Article

A Vaporization Model for Continuous Surface Force Approaches and Subcooled Configurations

MINES ParisTech, PSL Research University, CEMEF—Centre for Material Forming, CNRS UMR 7635, CS 10207 Rue Claude Daunesse, 06904 Sophia-Antipolis Cedex, France
*
Author to whom correspondence should be addressed.
Fluids 2023, 8(8), 233; https://doi.org/10.3390/fluids8080233
Submission received: 6 July 2023 / Revised: 29 July 2023 / Accepted: 8 August 2023 / Published: 19 August 2023
(This article belongs to the Special Issue Stochastic Equations in Fluid Dynamics, 2nd Edition)

Abstract

:
The integration of phase change phenomena through an interface is a numerical challenge that requires proper attention. Solutions to properly ensure mass and energy conservation were developed for finite difference and finite volume methods, but not for Finite Element methods. We propose a Finite Element phase change model based on an Eulerian framework with a Continuous Surface Force (CSF) approach. It handles both momentum and energy conservation at the interface for anisotropic meshes in a light an efficient way. To do so, a model based on the Level Set method is developed. A thick interface is considered to fit with the CSF approach. To properly compute the energy conservation, heat fluxes are extended through this interface thanks to the resolution of a transport equation. A dedicated pseudo compressible Navier–Stokes solver is added to compute velocity jumps with a source term at the interface in the velocity divergence equation. Several 1D and 2D benchmarks are considered with increasing complexity to highlight the performances of each feature of the framework. This stresses the capacity of the model to properly tackle phase change problems.

1. Introduction

Boiling phenomena are a key subject for many industrial domains in need of efficient heat exchangers. Most of the time, boiling is used as a great energy sink. The characterization of heat transfer between solids and fluids is of high interest for all applications.
Theoretical models and empirical laws have been developed to assess this quantity. In 1934, Nukiyama [1] was the first to describe, as a whole, all the different modes of boiling by plotting heat fluxes versus temperature, thanks to a heat wire that was plunged into a bath full of water. Nucleation, transition boiling and film boiling were observed. Then, many experiments using various fluids, conditions and parameters were made to better understand each mode. Correlations based on physical arguments were developed to estimate heat flux laws by pioneer works [2,3,4,5,6,7] as well as more recent investigations [8,9]. Some simple analytical models have also been developed [10]. All these approaches are very interesting and provide analytical laws but are often case-dependent, and their precision remains limited when confronted with industrial configurations.
Computational fluid dynamics (CFD) models have been proposed to better understand the physics of phase change. CFD allows the reproduction and evaluation of local phenomena that are difficult to estimate during tests. Once numerical models are validated, they can even be used as a powerful experimental laboratory. However, the development of a numerical model that could predicatively simulate all boiling modes remains a challenge.
Pioneer works have been conducted to simulate two-phase flows with phase change in 2D. Lee [11] developed a semi-implicit two-fluid phase change model with a sharp interface. A projection technique with an iterative scheme was used to compute the velocity jump, and the mass transfer was computed thanks to a proportional law. This enabled the simulation of a steam–water jet impingement. Using the volume of fluid (VOF) method, this work was extended by Rattner et al. [12] for film condensation. The mass transfer rate previously chosen was arbitrarily assessed through enthalpy considerations. This model was embedded for a finite volume approach within the Open-FOAM library. More recently, Giustini et al. [13] proposed a similar approach with the added value that their framework could fit arbitrary meshes without the need to introduce smearing of the mass transfer term. Son et al. [14] combined this second-order projection method with a Level Set method to solve saturated 2D horizontal film boiling. Juric et al. [15] also simulated this problem with a single-field formulation and a front tracking method implemented with finite differences. Welch et al. [16] performed the same but with a volume-of-fluid-based interface tracking method. Once again, the projection method was used, and the reconstructed interface led to the computation of temperature gradients from both sides. Kang et al., Gibou et al. and Tanguy et al. [17,18,19] implemented a Ghost Fluid Method to ease the introduction of interfacial terms within an Eulerian finite difference method. A similar approach was conducted by Esmaeeli et al. [20], who eliminated the iterative procedure with a predictor–corrector algorithm. Using the interface tracking and projection methods with a sharp interface approach, Sato et al. [21] implemented a staggered finite volume vaporization solver and computed proper bubble nucleation and growth. Khalloufi et al. [22] worked on the complete simulation of quenching processes in 3D for simple geometries thanks to an Eulerian framework with Level Set methods and Finite Elements. Other innovative methods have been developed, like the coupled Level Set and volume of fluid method [23], aiming to improve the interface definition and mass change rate computation.
These recent developments, however, require a large number of numerical computations over the interface. These could be troublesome when dealing with industrial applications. This is the reason why the choice of the Continuous Surface Force (CSF) approach is often preferred, as it guarantees an integrated implementation that is very light. This feature is especially appreciated when dealing with industrial applications. In the present work, we propose a phase change model within an Eulerian framework based on a stabilized Finite Element method. These methods have been proven to support the Navier–Stokes equations as well as convection diffusion reaction numerical schemes, allowing them to overcome challenging test cases [24]. The Level Set method is used to track the interface. A CSF approach is applied to deal with stiff differences in the physical properties, with a dedicated method to properly handle thermal variations. This consideration has been shown to bring stability to multiphase flow solvers with a simple implementation [25,26,27].
Most of the time, when boiling takes place in industrial processes, the liquid located far from the vaporizing front is below its saturation temperature. The difference in temperature (usually called subcooling) has been shown to significantly improve heat transfers [9,28,29,30,31,32,33]. The entire boiling curve is shifted at a higher Leindenfrost temperature the minimum temperature for the stabilization of a vapor film. More generally, the physics of boiling drastically changes from the saturated case. This is the reason why proper consideration of heat flux jumps at the vapor/liquid interface is crucial.
Moreover, as the vapor phase is usually much lighter than the liquid phase, vaporization entails an important dilatation at the interface. This is numerically challenging and requires specific attention adapted to the considered framework. To do so, a dedicated pseudo-compressible Navier–Stokes solver is added, based on the work of Khalloufi et al. [22]. It computes velocity jumps with a volume source term at the interface in the velocity divergence equation. This ensures mass and momentum conservation at the interface in a light and efficient way, with consideration of volume mass transfer distribution. To reduce the computational time in prevision of future cases, it is coupled with a remeshing algorithm (see [34] for further details on the implementation of this algorithm).
To the authors’ knowledge, there is not any existing method that accurately combines the CSF approach with the heat flux jump computation and a volume mass transfer distribution. In the present work, this is conducted with the consideration of a complete fictitious thick interface for the mixing laws described in Section 2. The phase change distribution is also smoothed and the temperature profile is set to the phase change temperature at the interface. Thus, the jump is not computed on one straight surface that usually features the interface, but on the border of this thick interface. Such consideration is new and requires the design of a dedicated method that will be described in details in Section 3 and Section 4. To validate the presented method for diffusion-only cases, simple 2D test cases are studied in Section 5. Then test case validating the pseudo-compressible approach are presented in Section 6. The complete vaporization framework is finally tested and validated in Section 7 on the compressible subcooled Stefan problem and on an adiabatic problem.

2. Phase Change Modeling

2.1. Mathematical Framework—Level Set Method

Two-phase flows with a mixture of liquid and vapor are considered. In order to separate the two different phases, the Level Set formalism is used. For x the position vector, a signed distance function ( x , t ) α describes the interface I between the two phases:
α ( x , t ) = d ( x , I ) in the vapor phase d ( x , I ) in the liquid phase 0 on the interface
This way, the gradient of the distance function α defines the normal of the interface. The normal of the interface n is defined as α α .
The associated characteristic function α H α allows to determine the fraction of vapor and liquid at any point. To avoid numerical instabilities, an interface thickness 2 ε is considered. Different functions can be used to smooth this Heavyside function, such as a tangent or a sine function. This latter has been chosen in this work:
H α = 1 if α > ε 1 2 1 + α ε + 1 π sin π α ε if | α | ε 0 if α < ε
The reasons behind this need of a smoothing function and a complete justification of the consistency of this solution can be found in [34]. This allows us to determine the characteristics of a fluid particle regarding the characteristics of the two phases.
Finally, to determine properties at the interface, the smoothed Dirac function α δ α is defined as the derivative of H α with respect to α . Thus:
δ α = 0 if | α | > ε 1 2 ε 1 + cos π α ε if | α | ε
Two relations can be noticed:
H α = ( α ) δ α
H α t = α t δ α

2.2. Continuous Description of Phase Change

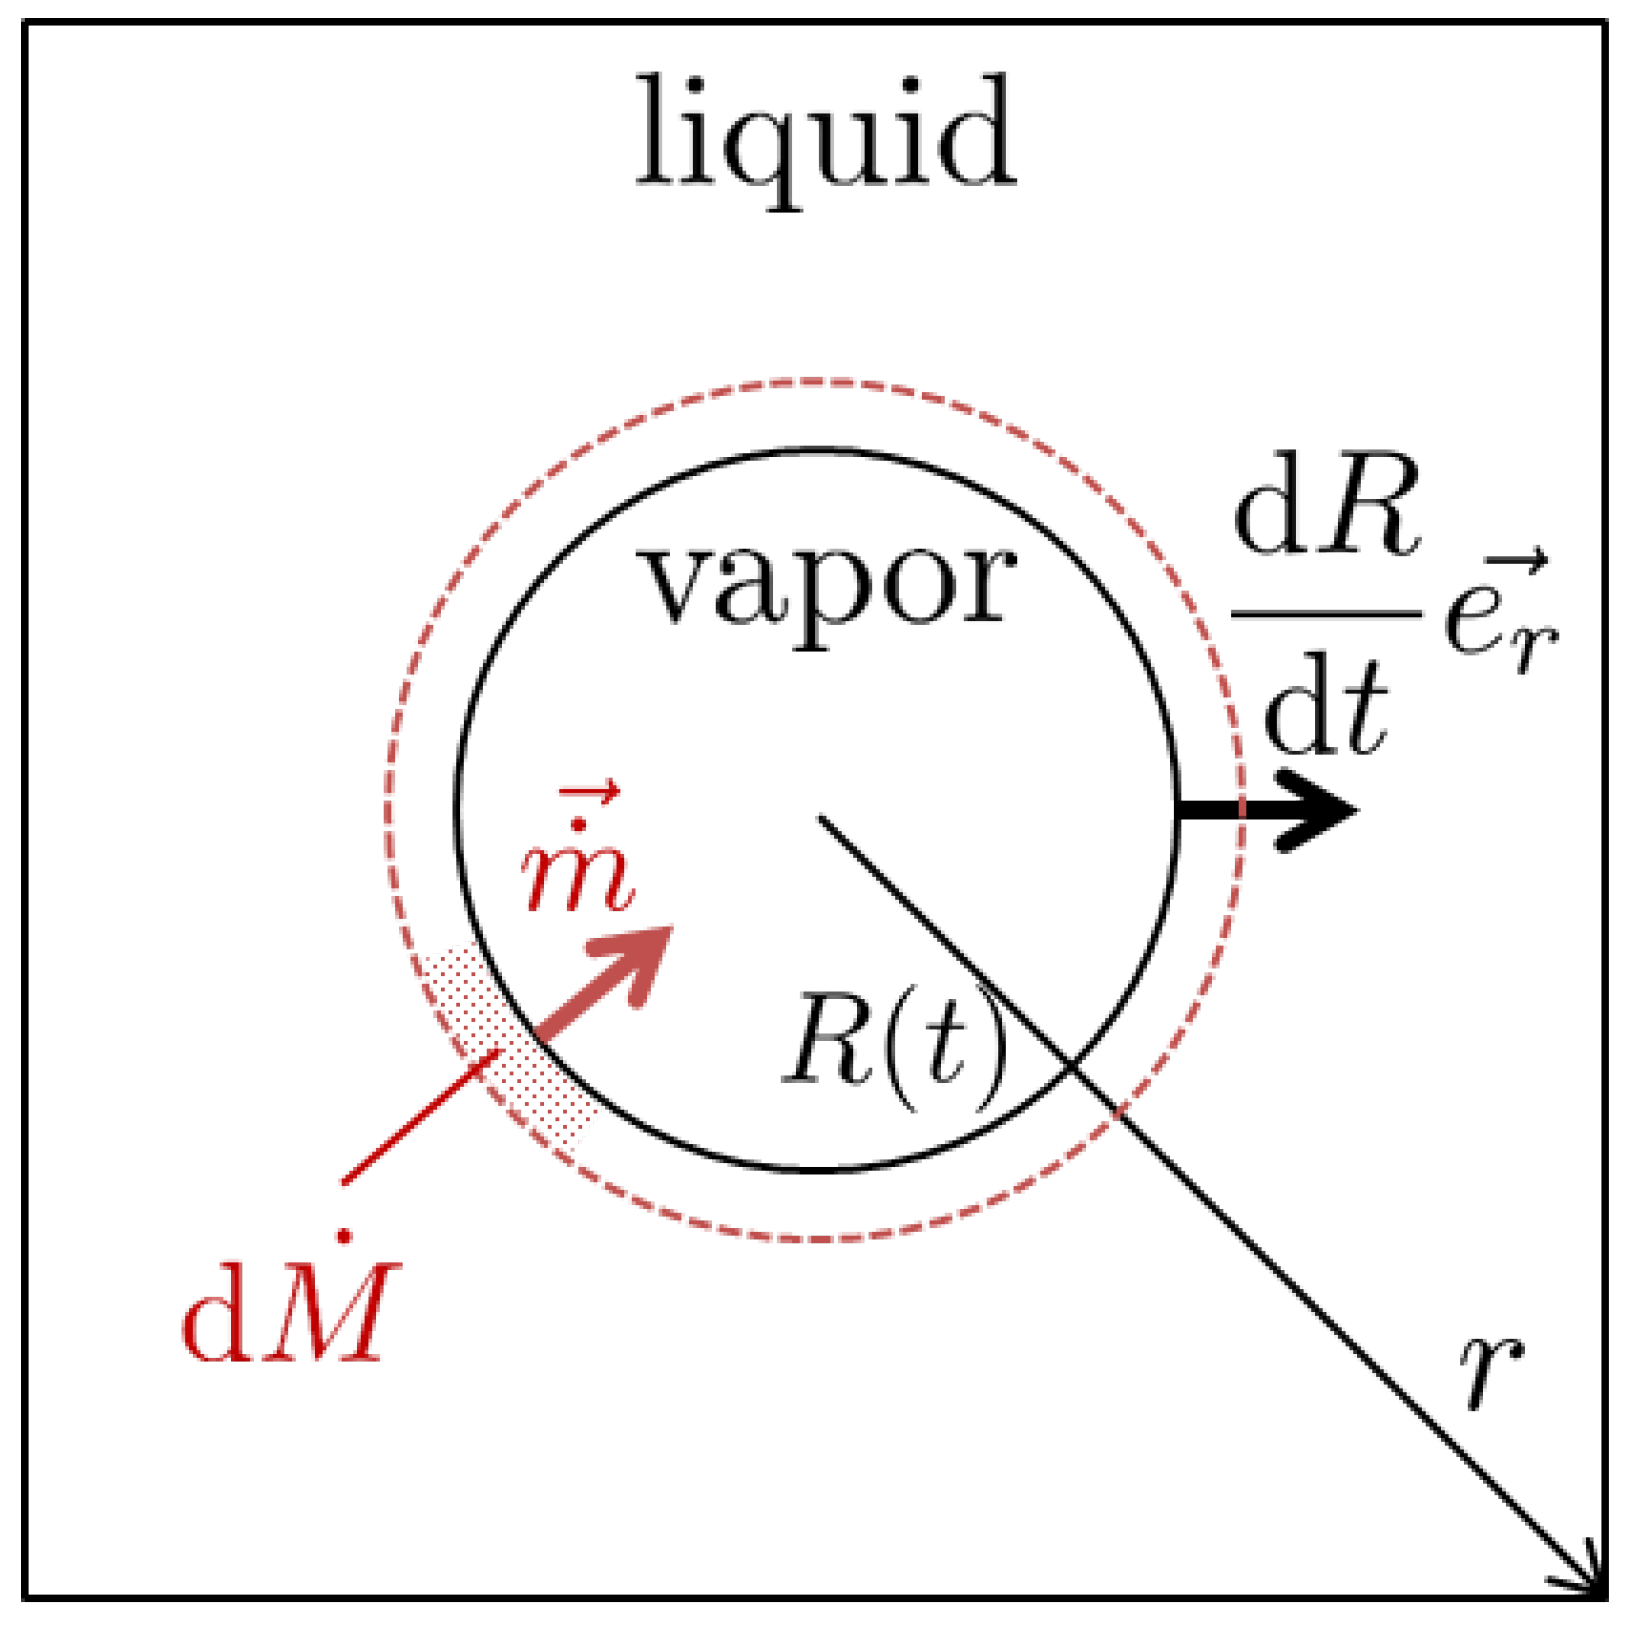
The mass change is represented by the vector m ˙ : | m ˙ | is the absolute surface mass transfer rate from one phase to another. The local direction of m ˙ indicates if it stands for vaporization or condensation. m ˙ is assumed to be orthogonal to the surface, thus aligned with the normal vector n . The total value of mass change over a surface S of the interface is S m ˙ · n d S (see Figure 1).
A continuous mass change profile [22] is chosen. The mass change is spread on the volume of an interface of thickness 2 ε thanks to a Dirac distribution δ α (see Figure 2). The local infinitesimal mass transfer rate d M ˙ over an infinitesimal volume d V then reads:
d M ˙ = m ˙ · α δ α d V .
With this configuration, m ˙ is supposed to be locally constant and orthogonal to the interface, and the total value of mass change over a surface S of the interface is conserved as:
S [ ε ; ε ] d M ˙ = S [ ε ; ε ] m ˙ · α δ α d α d S = S m ˙ · n d S
by definition of α and δ α .
Working with a Continuous Surface Force approach, the notion of heat flux jump is ambiguous, as all quantities are continuous. Moreover, its value must be accessible for each node inside the interface to determine the local constant value of m ˙ , and to be able to compute the velocity jump and the energy jump terms.
To address these issues, the present work proposes to set the entire interface temperature at T s a t , as shown in Figure 2. The heat flux jump is then considered from the two extremities of the interface. As only conductive heat fluxes are considered in the present study, the condition on m ˙ reads:
| m ˙ | L = k T · n ε ε
where k is the conductivity.
The extension method and the algorithm relying on it to compute the balance of flux on each points of the interface are presented hereafter.

3. Heat Flux Jump Computation

3.1. Description of the Extension Method

This method relies on a common technique explained by Aslam et al. [35]. The basis of this technique is to extend on Ω a scalar quantity q 0 that lives on Ω 0 (generally Ω and Ω 0 form a partition of the computation space). The extension is conducted by following streamlines of a normalized vector field n through an interface Γ that separates the two domains Ω and Ω 0 . In other words, the solution q equals q 0 on Ω 0 , and on Ω , q is set constant on the streamlines of n , its value being the value of q 0 on the intersection of Γ with the streamline. This corresponds to the resolution of the following system:
{ (9) q = q 0 on   Ω 0 (10) n · q = 0 on   Ω
Equation (9) is solved immediately, and is used as a Dirichlet condition on Γ for the resolution of (10). For frontiers of Ω that are at the vicinity of the calculation domain, a Neumann condition of null flux is used.
The second equation by itself is not numerically unconditionally stable, so a diffusion term is added:
n · q · ( λ q ) = 0
The value of λ should be as small as possible in Ω to limit its impact on the solution, but large enough to stabilize the solver. If h is the mesh size, a dimensional analysis leads to:
| n | q h λ q h 2
As n is normalized, the condition reads λ h . λ will be chosen at most of the same order of magnitude as h.
Before its implementation on heat flux jump computation, this method is tested on a theoretical test case: the extension of a scalar field that has a cylindrical symmetry on a disc. The field n is based on the gradient of the Level Set α (the signed distance function in respect to the interface that is positive inside Ω ). As a result, n is normal to the interface.

3.2. The Disc Case

Ω is a disc of radius R = 0.2 centered on the origin of a 1 × 1 square domain (see Figure 3a). The source field q 0 is defined in the cylindrical coordinates system ( r , θ ) such as:
q 0 ( r , θ ) = 2 r
n is defined as:
n ( r , θ ) = e r
Thus n has a singularity at the origin.
The case is implemented on an unstructured mesh of triangles of characteristic size h = 10 2 with λ = 10 3 . Results projected on the horizontal axis of the disc are plotted on Figure 3b.
We can see that the extension of q 0 over Ω is well computed, and the singularity of the vector field n does not cause issues to the solver. Errors can be controlled by refining the mesh.

3.3. Determination of Heat Flux Jumps over a Smooth Interface

Back to the phase change problem, the idea is to apply this tool on each side of the interface to access the values of the balance of heat fluxes on every point of the interface. The method is applied with the scalar field α | α | · ( k T ) to determine the heat fluxes on the vapor and on the liquid sides.
A first simple approach would be to choose Ω as the domain of the interface, and Ω 0 the union of the vapor and the liquid domains for both cases (it is useless to further project the heat flux from one phase on the whole domain of the other phase).
However, due to diffusion effects, the transition from T s a t on the interface to the temperature profile diffuses on a few elements. A “safety margin” is taken to make sure that the temperature profile is well established. This is the reason why the heat flux value to project is drawn one mesh size away from the isovalue α = ± ε . Moreover, to further reduce the influence of the diffusion term λ , the end of Ω is considered three mesh sizes away from the isovalue α = ± ε . Figure 4 summarizes these considerations. Doing so, the heat flux jump is well defined and constant on the domain { α [ ε ; ε ] } .
As an illustration and test purpose, this method is implemented on a simple 2D test case. A 1 × 1 square with a vertical interface x = 0 at its center (see Figure 5a).
The field to project from the left side of the interface is q 0 L = 5000 y ( 1 + x ) , and the associated domain Ω L is located between the axes x = 0.07 and x = 0.05 . The field to project from the right side of the interface is q 0 R = 10000 y ( 1 + x ) , and the associated domain Ω R is located between the axes x = 0.05 and x = 0.07 .
n L and n R are taken normal to the interface, but of opposite directions.
The case is implemented on an unstructured mesh of triangles of characteristic size h = 10 2 with λ = 10 3 . Results projected on the central vertical axis and on the horizontal axis y 0.25 are plotted on Figure 5b,c.
The extension is well computed, and errors are in the order of magnitude of the mesh precision.

3.4. Precision of the Method

As the extended heat flux is located one mesh size away h from the boundary of the interface, an error is made, which is proportional to h (see Figure 6a). Noting s the position of the boundary interface, and taking the distance function α , a linear approximation on q around s reads:
q ( s + h ) = q ( s ) + q α ( s ) h + o ( h )
Extending q from the position s + h instead of s thus leads to an error q α ( s ) .
Furthermore, unstructured mesh have been used in this study, and the evaluation of points ε + h away from the interface used as reference points for the extension method leads at most to a doubled “safety margin”, as shown on Figure 6b.
Considering only conductive heat fluxes q = q · α | α | = k T α , this leads to a maximum error on m ˙ :
Δ m ˙ 1 L L , V k 2 T α 2 2 h

4. Two-Phase Thermal Solver

The presented mass transfer modeling is associated with a thermal equation and a Level Set convection equation. This solver is made to solve diphasic and “static” (no fluid velocity) Thermal systems with phase change. Thus, only divergence free cases are tackled for the moment, meaning equal density between phases.

4.1. Thermal Equations

As no movements are considered, a purely diffusive system with phase change is solved. According to the Continuous Surface Force approach, the integration in the energy conservation equation of the source term due to phase change from Equation (6) reads:
ρ c p T t = · k T L m ˙ · α δ α
where ρ is the density and c p the specific heat capacity.
There is an equivalence between the condition T = T s a t at the interface and the formulation of the source term L m ˙ · α δ α in addition to the computation of the mass transfer thanks to the Heat Flux Jump Computation m ˙ = k T · α | α | : formulated this way, the system theoretically maintains the interface temperature at T s a t .
To be consistent regarding the mixing laws of every parameter, a choice is made to consider that H α is a volume ratio. This entails the mixing law of ρ c p . For the mixing laws of k, a geometric law is used following the recommendations of former studies [36,37] that shew the importance of the mixing law to properly tackle the flux continuity:
ρ c p = H α ( ρ c p ) V + ( 1 H α ) ( ρ c p ) L
1 k = H α k V + 1 H α k L
As the phases are considered to have the same density ρ , the velocity field is zero. The mass conservation then entails the following Level Set convection Equation ( α being positive inside the vapor phase):
α t m ˙ ρ · α = 0

4.2. Stabilization

The proposed system is theoretically consistent, as the formulation tends toward the sharp interface formulation for small ε . However, the conservation of T s a t is unfortunately not ensured as such. Among other reasons, overshooting effects are observed. Moreover the conductivity jump leads to stronger diffusion effects on the liquid side that tends to cool down the interface.
To guaranty the efficiency of the method, a penalty term of the form A δ α T T s a t is added, A being a sufficiently large parameter (taken as 1 × 10 6   W   K 1   m 2 , the order of magnitude of L × 1   K ). This formulation guarantees the conservation of T s a t on the interface.
m ˙ being computed thanks to the heat flux jump, the final system reads:
{ (21) ρ c p T t + A ( T T s a t ) δ α = · k T L m ˙ · α δ α (22) α t m ˙ ρ · α = 0 (23) with : L m ˙ = [ k T · α | α | ]
As a reminder, the advection velocity of Equation (22) represents the displacement of the interface due to the phase change. Furthermore, Equation (23) represents the energy conservation at the interface.

4.3. Numerical Method and Mesh

This formulation is composed of convection diffusion equations. These equations are solved using a Finite Element method, and are stabilized thanks to a SUPG-SCPG scheme presented in [38] that presents the solver used in this work. Basically, the Finite Element method consists of discretizing space into small, simple elements and choosing an approximation for the solution within each element using, for example, linear functions. Stabilization schemes such as SUPG-SCPG are necessary to ensure stability (for example in advection-dominated problems) and compatibility of the chosen approximations for each field (velocity, pressure, temperature …). The anisotropic mesh at the interface is refined (to improve accuracy of the solution, see [22]) using the gradient of the hyperbolic tangent of the Level Set. The physical properties of each domain are set with appropriate mixing laws. Each mesh is adapted under the constraint of a fixed, case-dependent number of edges. Representative interface regions at the end of the anisotropic adaptation process are shown in Figure 7. In practice, the adaptation process consists of adding nodes locally in the vicinity of the interface. The rest of the elements keep the same background size, that increases with the distance via three successive refinement steps to accurately capture the near-wake region.

5. The Isochoric Stefan Problem

As a first simple benchmark of this model, the isochoric 1D Stefan problem is solved in a 2D domain and compared with the analytical solution. This benchmark has been first used while working with solid/fluid phase changes (see for exemple [39]). It has been recently used as a basis by Chaurasiya et al. to study such systems with time dependant conductivity and convection [40,41,42,43]. It has then been extended to configurations of liquid/gas interactions (see for exemple [19,44]).
Both phases are considered to have the same density ρ , though different ρ c p of a liquid/vapor mixture. Two configurations are studied: the saturated Stefan problem and the subcooled Stefan problem.
The saturated problem has been tackled many times before (see [14,16,21,22,44,45,46]). However the subcooled Stefan problem is rarely studied to the authors’ knowledge.

5.1. Reminders of the Problem

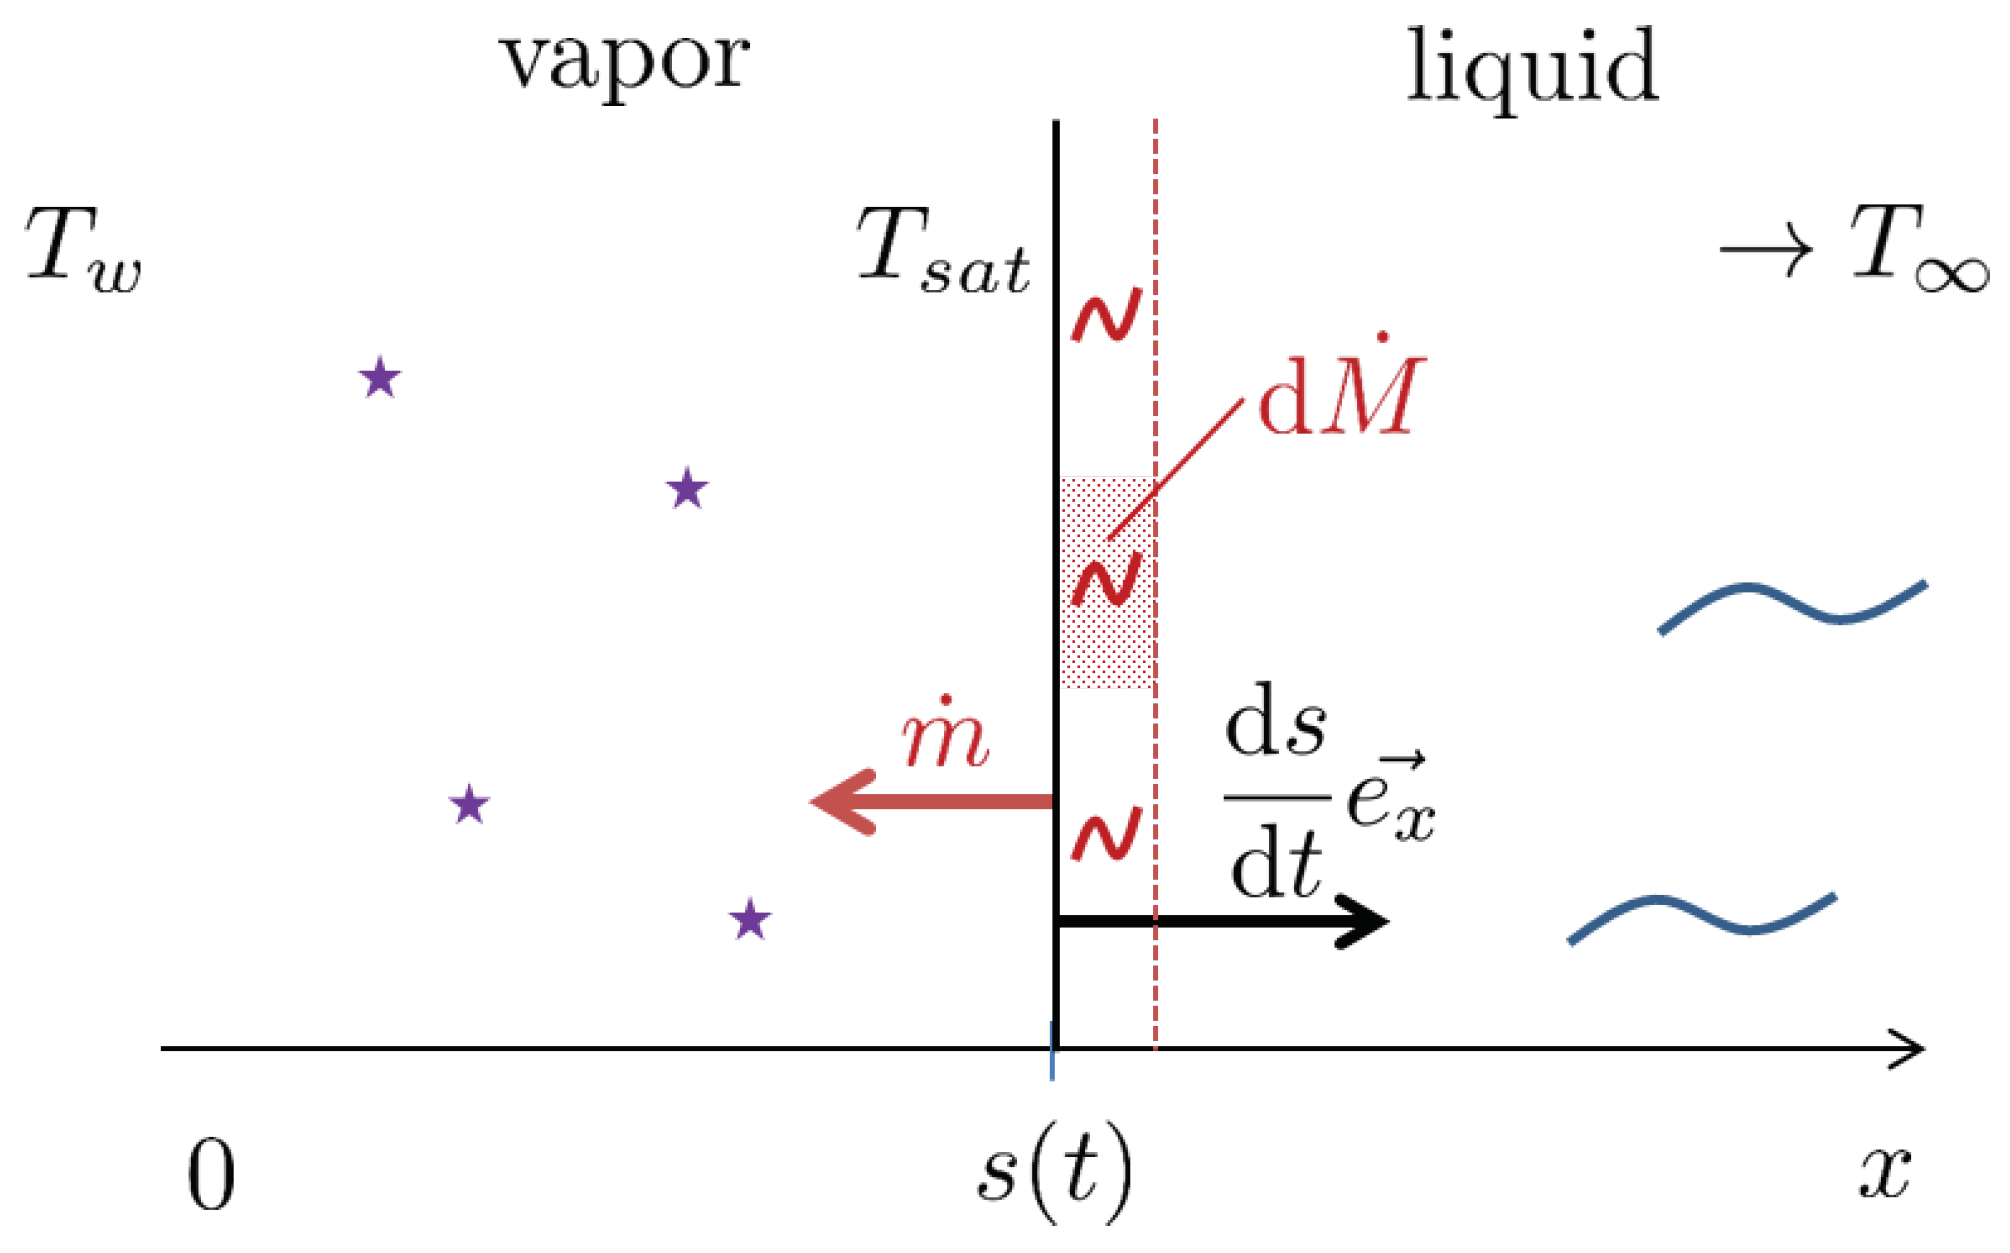
The considered Stefan problem is a semi infinite domain (indexed by the x [ 0 , + [ coordinate) filled with liquid at initial temperature T , and touching a wall ( x = 0 ) at temperature T w > T s a t (see Figure 8). At t > 0 , the wall warms up the liquid and vaporization occurs, creating a moving interface positioned by s ( t ) that goes away from the wall. The boundary is set to T s a t .
The governing equations of this problem read:
{ (24) ( ρ c p ) V T t = k V 2 T x 2 for   x [ 0 , s ( t ) [ (25) ( ρ c p ) L T t = k L 2 T x 2 for   x ] s ( t ) , + [
With the boundary conditions:
{ (26) T ( x , t = 0 ) = T for   x > 0 (27) T ( x = 0 , t ) = T w for   t > 0 (28) T ( x = + , t ) = T for   t > 0 (29) T ( x = s ( t ) , t ) = T s a t for   t > 0
Moreover, the energy jump condition at the interface remaining at T s a t and that governs the behavior of s reads:
L | m ˙ | = ρ V L d s d t = k V T x | x = s + k L T x | x = s +
The analytical solution classically reads:
T ( x , t ) = T w + T s a t T w erf χ erf χ x s ( t ) for x [ 0 , s ( t ) ] T + T s a t T erfc χ D V D L erfc χ x s ( t ) D V D L for x [ s ( t ) , + [
where D L = k L ( ρ c p ) L is the liquid diffusivity and D V = k V ( ρ c p ) V is the vapour diffusivity. The evolution of s reads:
s ( t ) = 2 χ D V t
χ is evaluated thanks to the resolution of the following equation:
ρ V L χ D V + k V ( T s a t T w ) e χ 2 π D V erf ( χ ) + k L ( T s a t T ) e χ 2 D V D L π D L erfc χ D V D L = 0
The temperature gradient reads:
T x ( x , t ) = 1 π D V t T s a t T w erf χ e χ x s ( t ) 2 for x [ 0 , s ( t ) ] 1 π D L t T s a t T erfc χ D V D L e χ x s ( t ) D V D L 2 for x [ s ( t ) , + [
One can notice that the temperature gradient (and its derivative) at the interface tends toward infinity as time gets close to zero. This entails an extra complexity for the computation of the Heat Flux Jump at the beginning of the simulation: it is interesting as it allows to test the performances of the Heat Flux Jump Computation feature and the error estimation (16).
All physical properties are those of a water and vapor mixture and summarized in Table 1. Yet a divergence free test case is considered and the density of water is taken as the density of vapor (though ρ c p values are not changing).

5.2. Studied Cases

5.2.1. Case 1: Without Subcooling

The first case solved is the classical Stefan problem with the liquid being at saturation temperature. The wall is 10 K above the saturation temperature, and χ = 0.067 .
The test case is computed for an unstructured 2D mesh of dimension 1 × 10−4 by 5 × 10 4   m 2 with 5 mesh sizes h (in m ): 1 × 10⁻⁶, 2 × 10⁻⁶, 4 × 10⁻⁶, 7 × 10⁻⁶ and 1 × 10⁻⁵. The time step is set to 1 × 10 5   s . The interface thickness is set to 6 h with an extension zone of 8 h .
The simulation starts with an initial interface position of 2 × 10 5   m (identified as the border of the thick interface on the vapor side). The initial temperature profile is computed according to its analytical solution.

5.2.2. Case 2: With a Small Subcooling

The second case is similar to the first one, except that the water phase is not at saturation temperature anymore. An initial temperature for the water of T s a t 1   K is taken, and χ = 0.021 . The domain, mesh sizes, time step and other parameters are the same. The initial position of the interface is also 2 × 10 5   m .

5.2.3. Case 3: With a High Subcooling

The robustness of the method is assessed in computing a more extreme Stefan Case for higher temperature: the wall is 900 K above the saturation temperature, the liquid is 10 K below, and χ = 0.101 . Furthermore, the remeshing methods is applied to test the good behavior of the combined methods.
The test case is computed for an unstructured non uniform 2D mesh of dimension 2 × 10 −4 by 2 × 10 3   m 2 with 30,000 elements whose mesh size h at the interface varies among 5 values (in m ): 5 × 10 −7, 1 × 10 −6, 2 × 10 −6, 3 × 10 −6 and 5 × 10 −6. The time step is still 1 × 10 5   s . The initial position of the interface is this time 1 × 10 4   m . The interface thickness is set to 6 h with an extension zone of 8 h .

5.3. Results

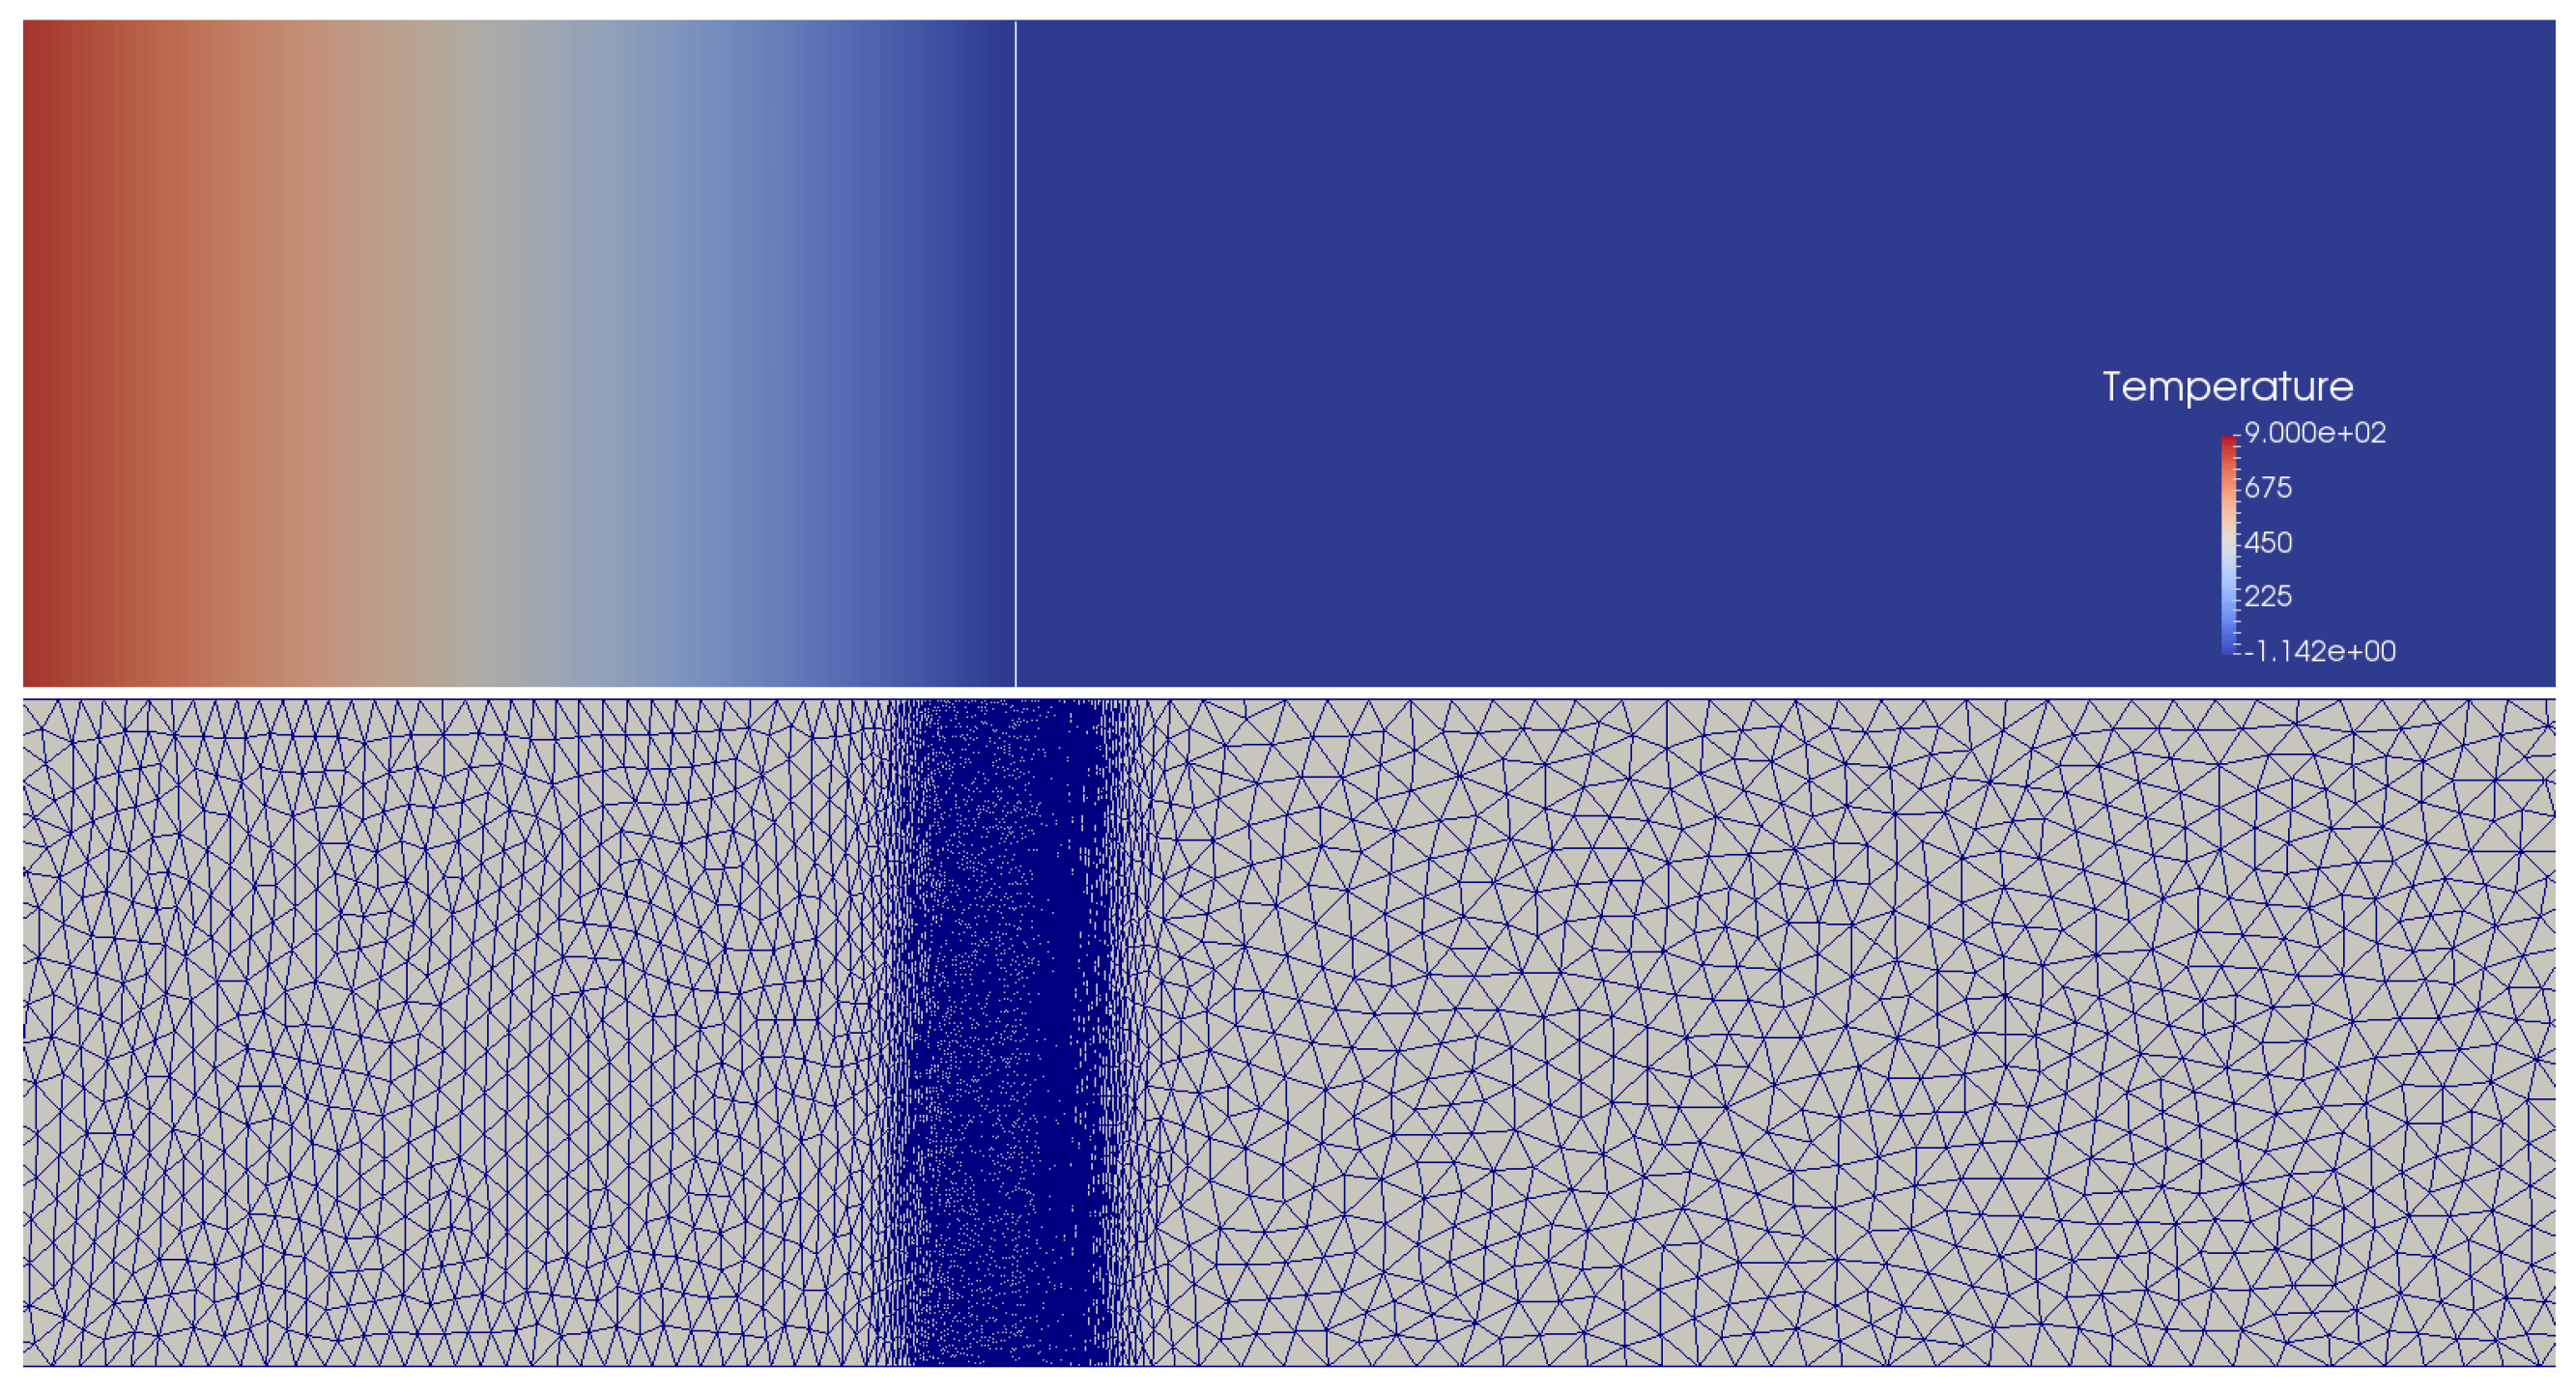
An example of temperature field values and mesh for the Case 3 is shown in Figure 7.
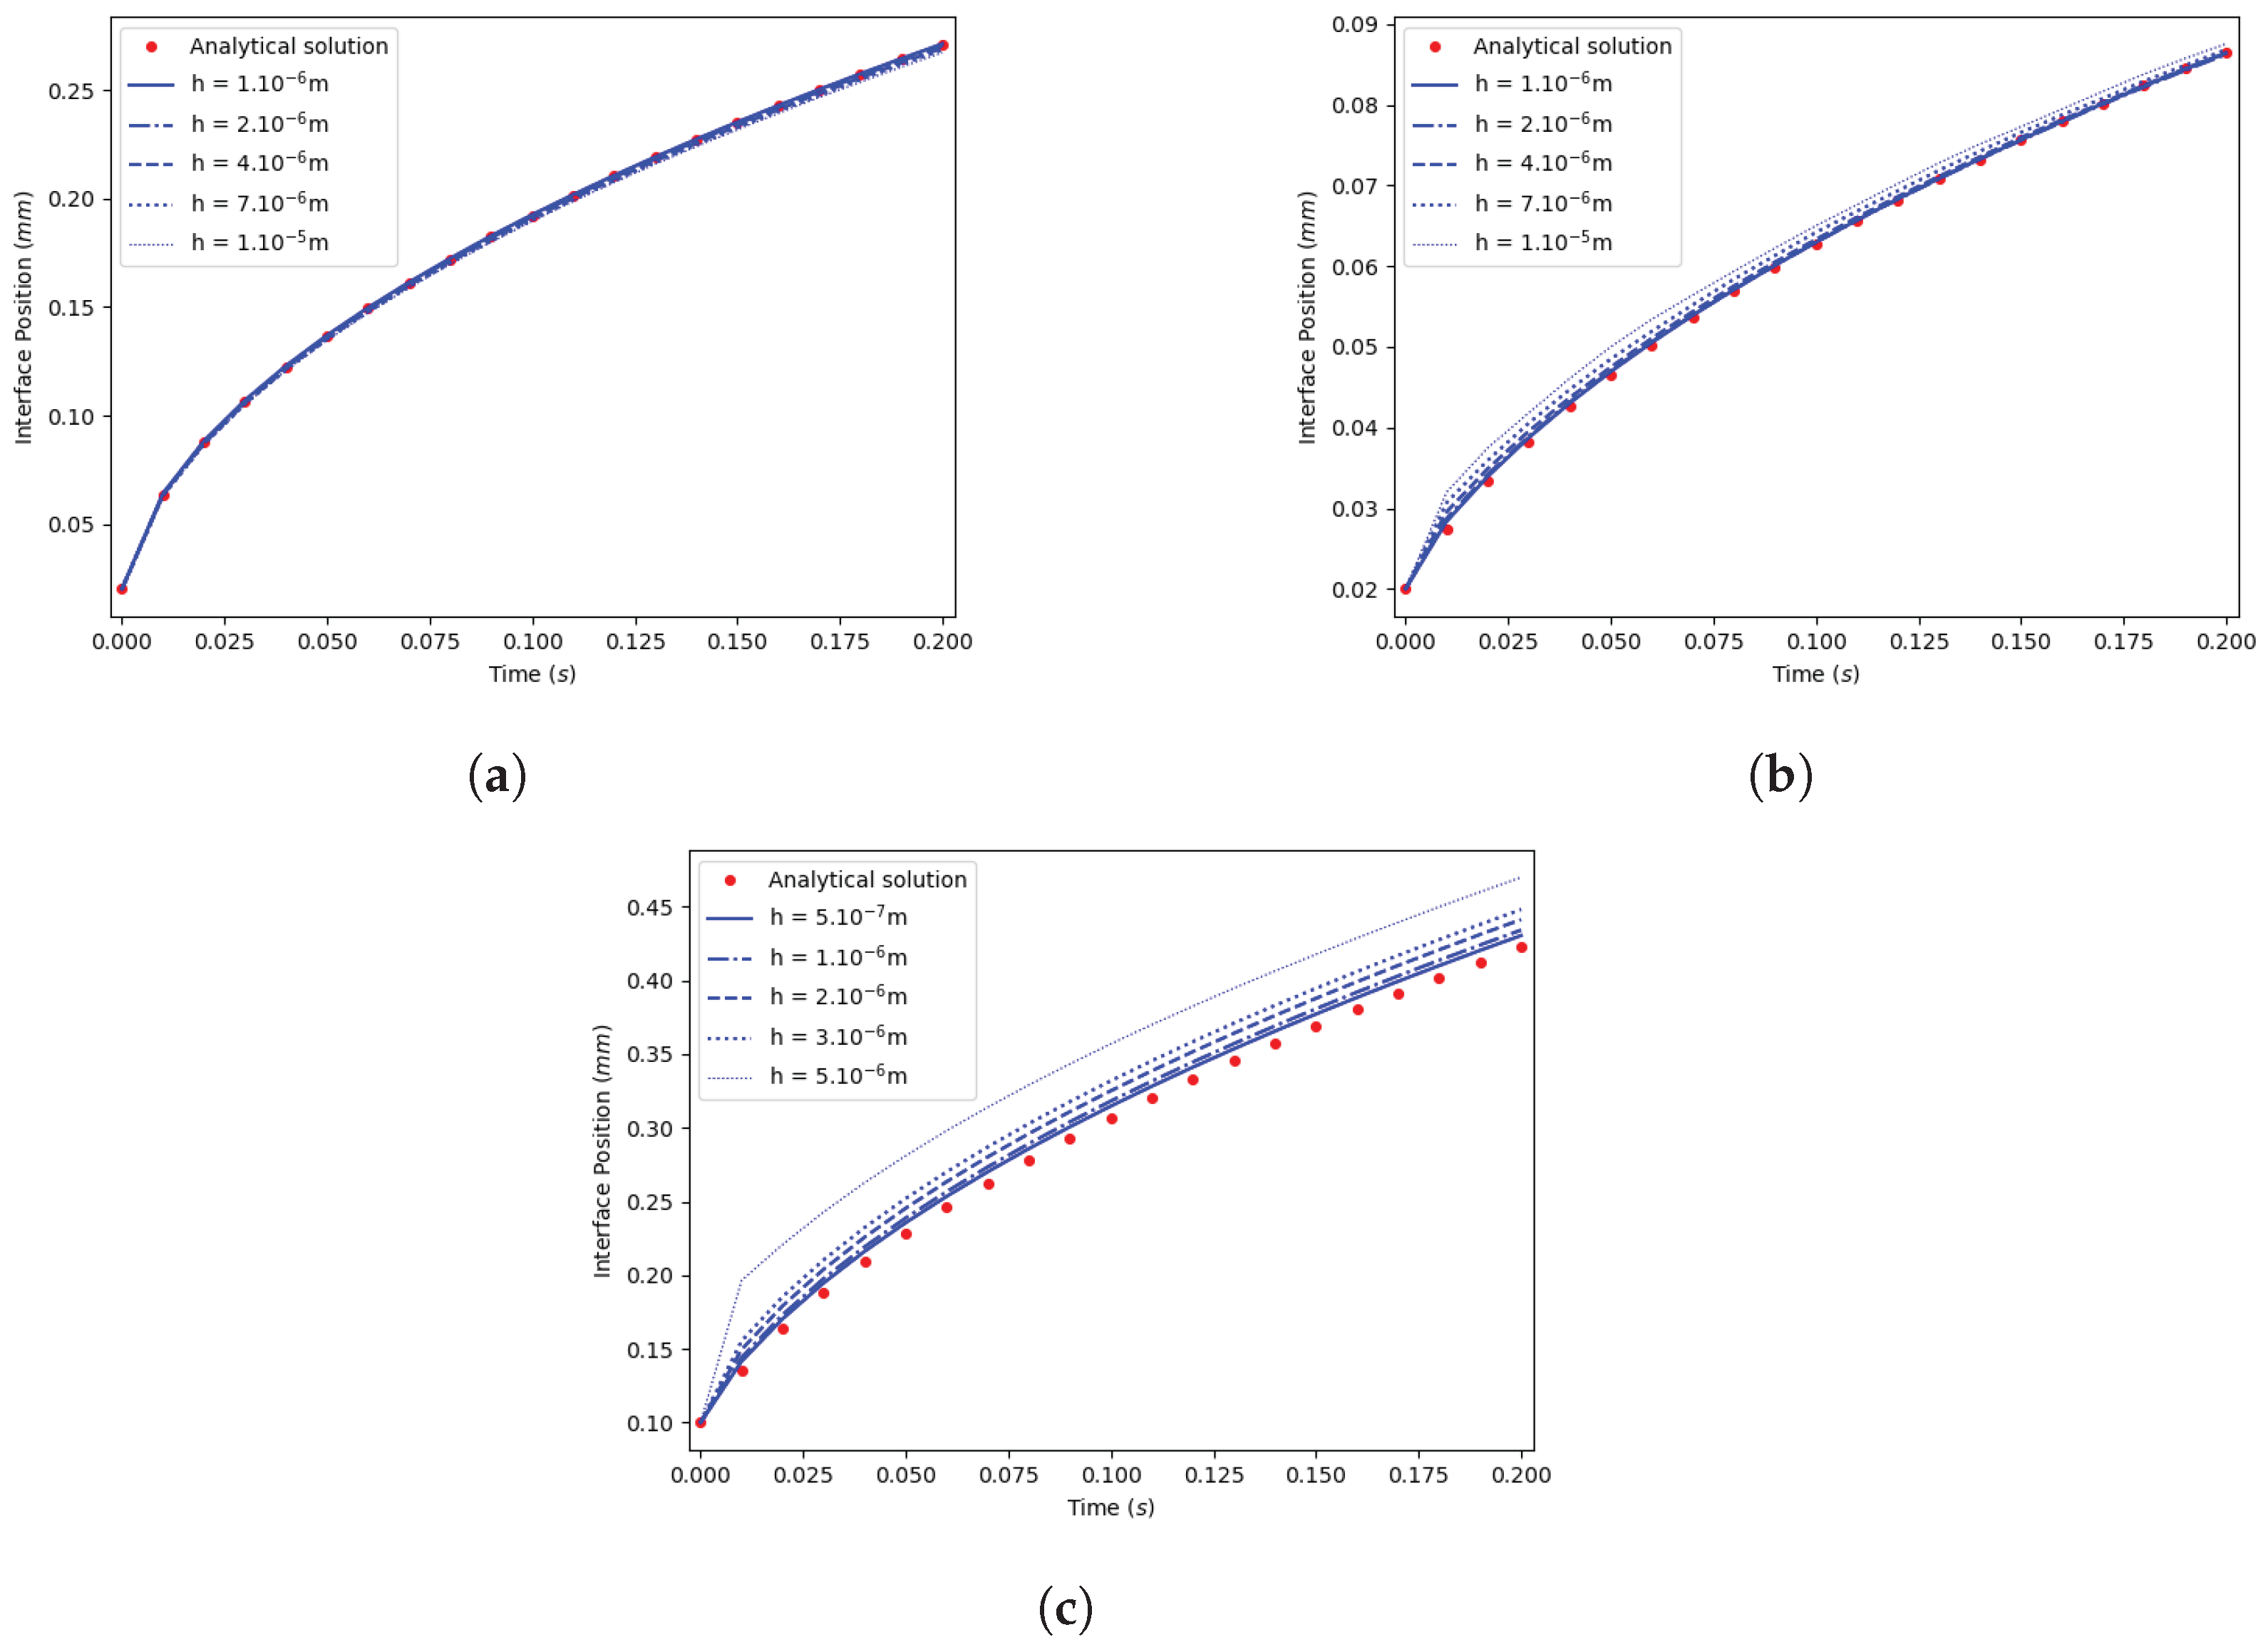
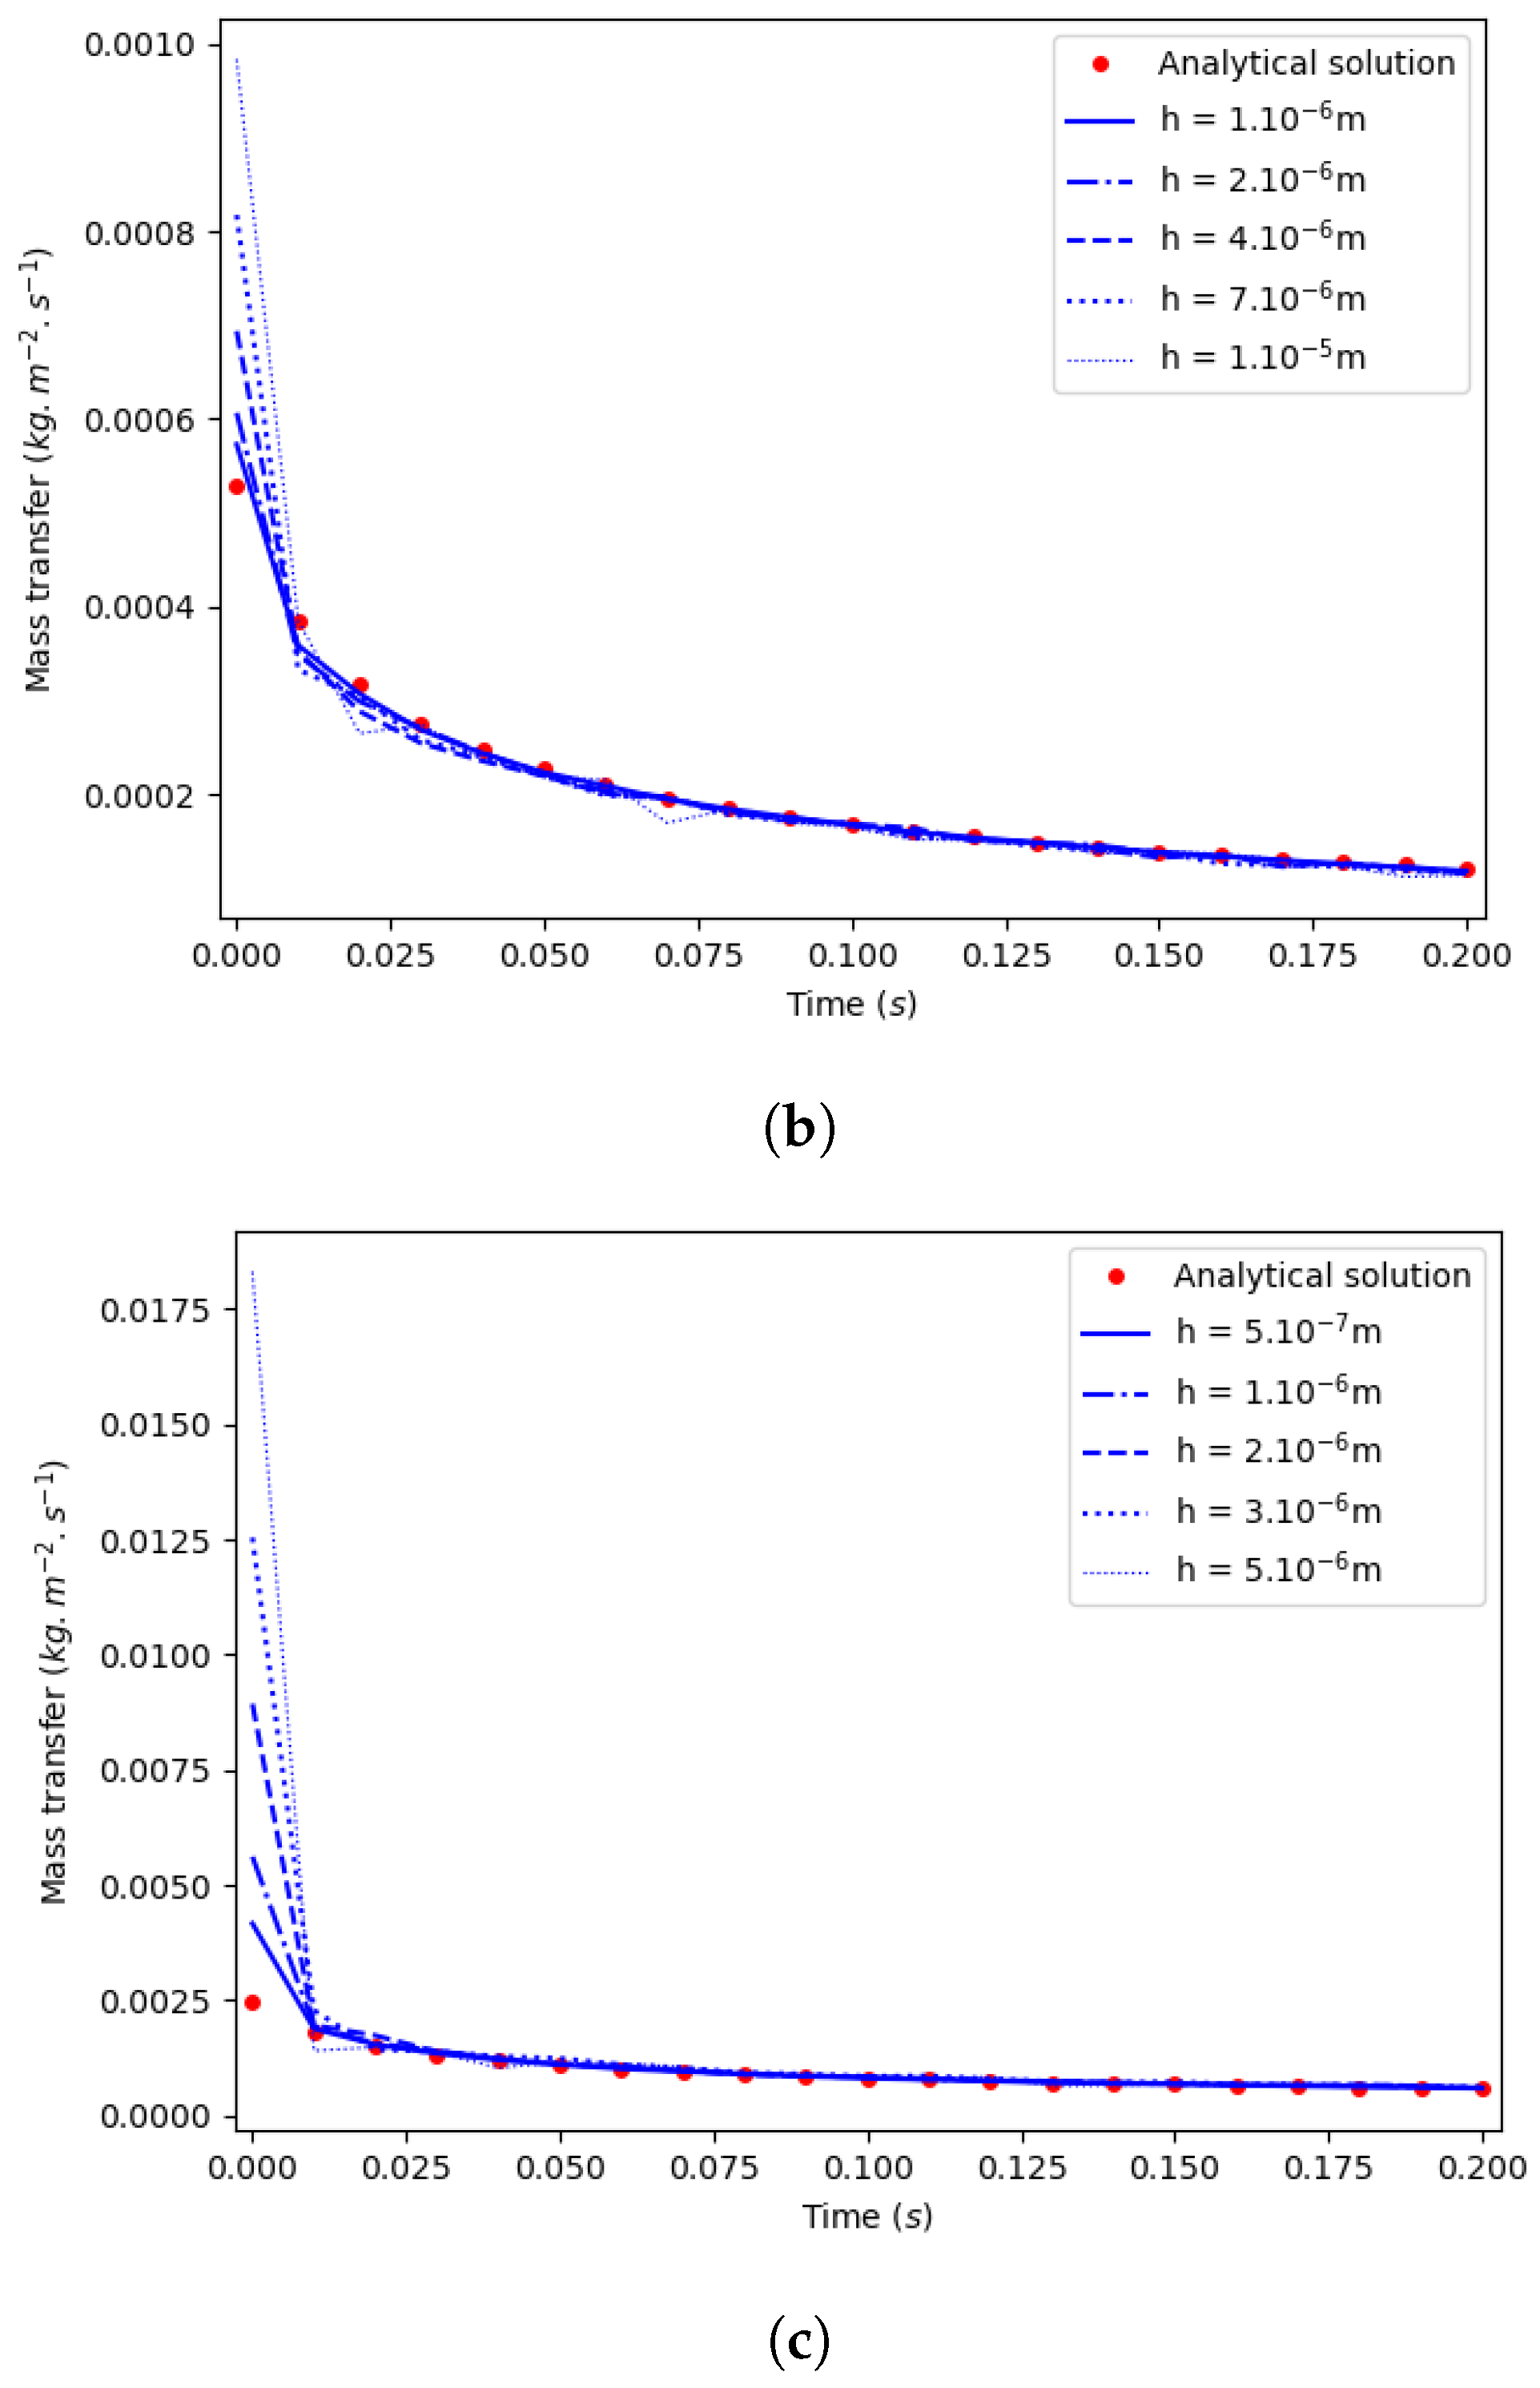
Results of interface position and mass transfer rate values versus time are plotted in Figure 9a and Figure 10a for the Case 1, in Figure 9b and Figure 10b for the Case 2, and in Figure 9c and Figure 10c for the Case 3.
Results of Case 1 are satisfactory, as errors on the position and mass transfer rate are small (less than 1%) whatever the mesh size.
The influence of the mesh size appears for the second case, mostly at the first time steps of the simulation where the heat flux jump computation is sensitive. This is explained by a higher heat flux gradient on the liquid size that raises the error on the mass transfer rate described by (16). Otherwise the case remains correctly described by the simulations.
Results for the Case 3 stress even more this observation, as even smaller mesh sizes reveal non negligible errors due to the important thermal constraint at play at the first time steps of the simulation. As soon as the temperature gradient is lower, errors on the mass transfer rate quickly decrease.

5.4. Precision and Accuracy Order

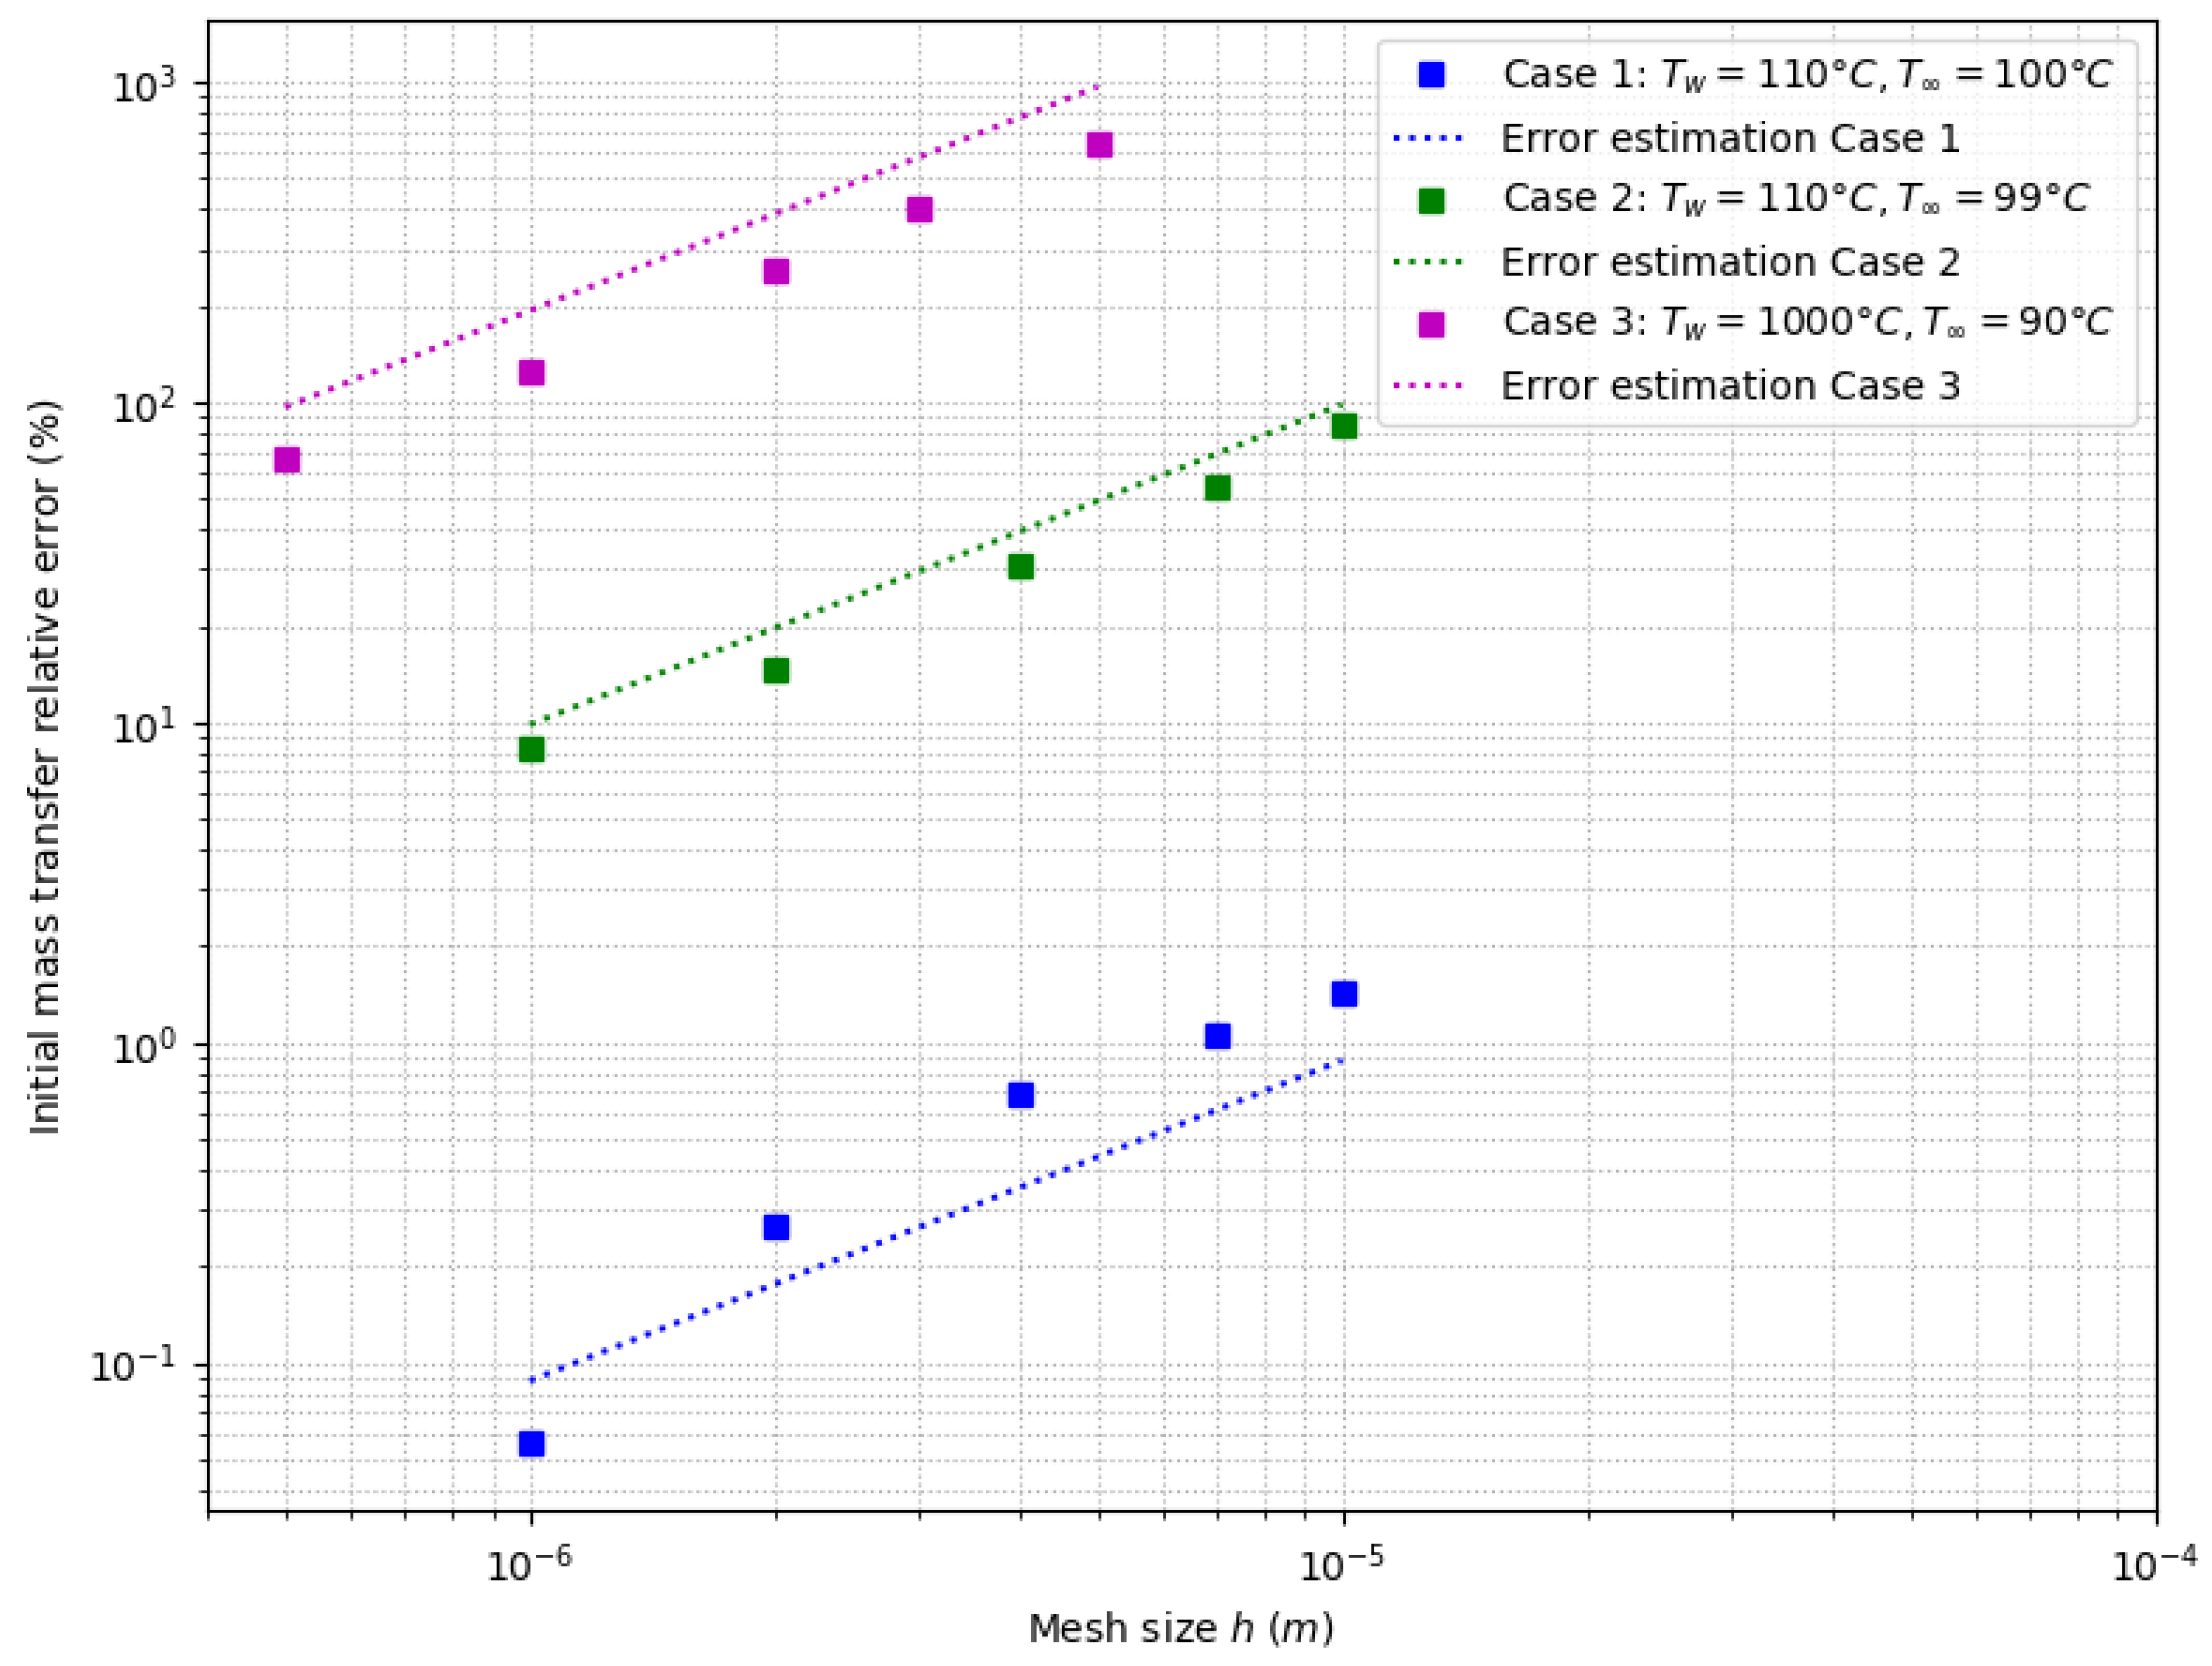
A first estimation of the HFJC method accuracy given by Equation (16) can be confirmed by plotting the errors of the three simulations on a ( h , Δ | m ˙ | ) graph. This is shown on Figure 11.
The lines represent the error estimation, thanks to the computation of 2 T x 2 ( s , t = t 0 ) given by the analytical solution. The error estimation correctly fits with the simulations results. This means that these errors are due to a too coarse grid, and can be controlled and reduced with the mesh size. An optimized approach to properly solve sub-cooled Stefan problems would be to control the mesh refinement according with the time.
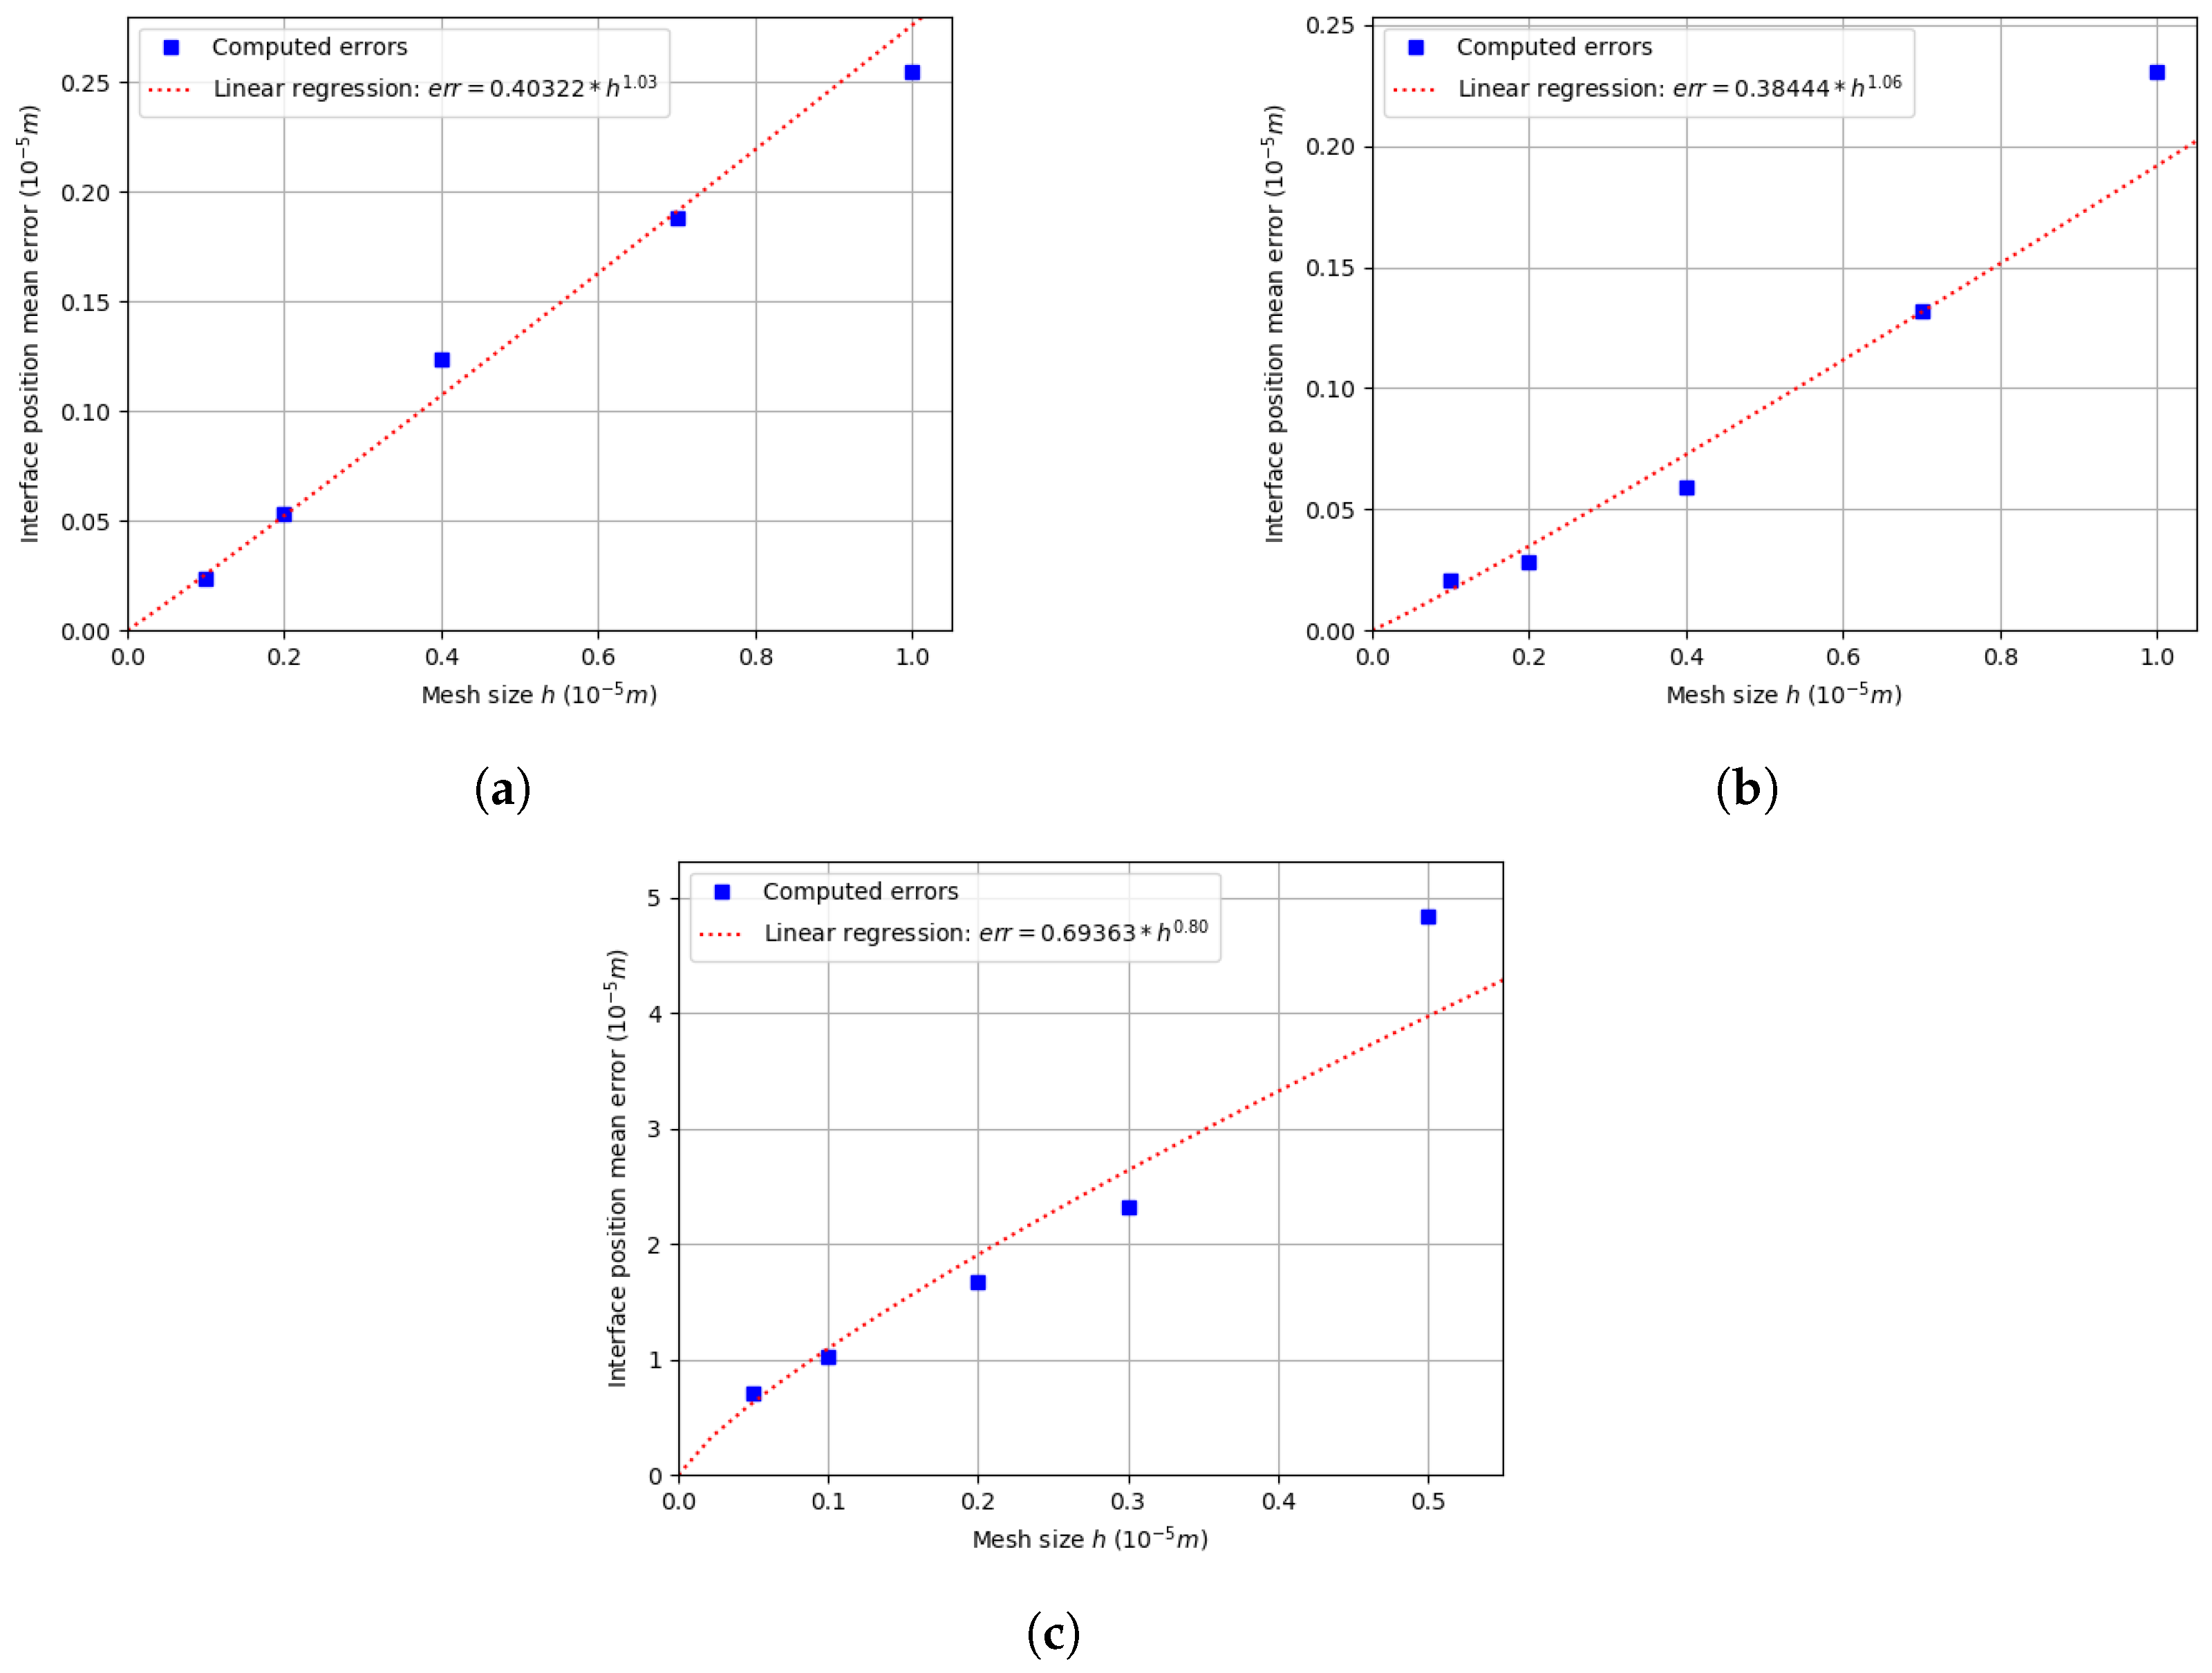
To further study the accuracy of the method, a convergence analysis with the mesh size h has been conducted. The error is defined as:
e r r = 1 N i 1 , N s s i m u i s a n i
where N is the number of sample steps among each iteration step, taken here as 20, and s s i m u i and s a n i are the position of the simulated and analytic interface at sample step i.
Results for the three cases are plotted on Figure 12a–c.
For all cases, the convergence order is around 1 as predicted by (16). The accuracy of the HFJC method is controlled by the value of ε that should be small enough to properly compute heat fluxes. If this condition is validated, and providing that the mesh is properly refined and validates the Fourier condition far from the interface, the presented method can be applied to more complex cases.

6. Multiphase Pseudo-Compressible Framework

To tackle the difference of density between the two phases, the consideration of compression or dilatation shall be implemented. In this framework, thermics drives the phase change, meaning a strong constrain on the mechanics. Continuing with a CSF approach, volume changes are implemented as a source term at the interface. This means the need to implement a Navier–Stokes solver that takes into account a source term on the mass conservation equation.

6.1. Pseudo-Compressible Navier–Stokes Solver

The one phase pseudo-compressible Navier–Stokes solver resolves a modified version of the incompressible Navier–Stokes equations:
{ (36) · u = φ (37) ρ u t + ( u · ) u = P + · 2 η ε ˙ ( u ) + ρ g
where φ is an imposed volume term, P is the pressure, ε ˙ is the strain rate tensor and g the gravity.

6.2. Numerical Method

This Navier–Stokes system is solved with a Finite Element method and stabilized with the Variational MultiScale (VMS) method presented in previous communication of the laboratory who provided this work [34,38,47]. However, the stabilisation scheme has to be modified due to the addition of the source term in the velocity divergence equation. The new pressure residual (formerly R p = · u ) now reads:
R p = φ · u
This slightly changes the formulation of the resolution matrix. However, the source term does not change significantly the solver accuracy and stability. The main aspects of the method, as well as the value of the stabilization parameters presented by Hachem et al. [38] are not changed.

6.3. A 2D Benchmark—The Pseudo-Compressible Square

We consider a first benchmark inspired by [37], whose first purpose was to study the behavior of the incompressible Navier–Stokes solver.
The target is to reproduce the following steady analytical solution on a ( 0 , 1 ) ( 0 , 1 ) square:
{ u x = 5 x y 4 + A x 2 u y = 0.5 + y 5 p = 0.5 ( y 5 y 10 ) + 5 ν y 4 f x = 5 x y 8 + 10 x y 3 + 60 ν x y 2 2 ν A 15 A x 2 y 4 + 2 A 2 x 3 f y = 0 φ = 2 A x
To do so, the values of f x , f y , φ and the boundary solutions are set, as described on Figure 13. The pressure boundary conditions are set free.
Two convergence studies are conducted with two values of A: 0.01 and 0.1. Five mesh sizes are considered: 2 × 10⁻³, 5 × 10⁻³, 1 × 10⁻², 2 × 10⁻² and 5 × 10⁻².
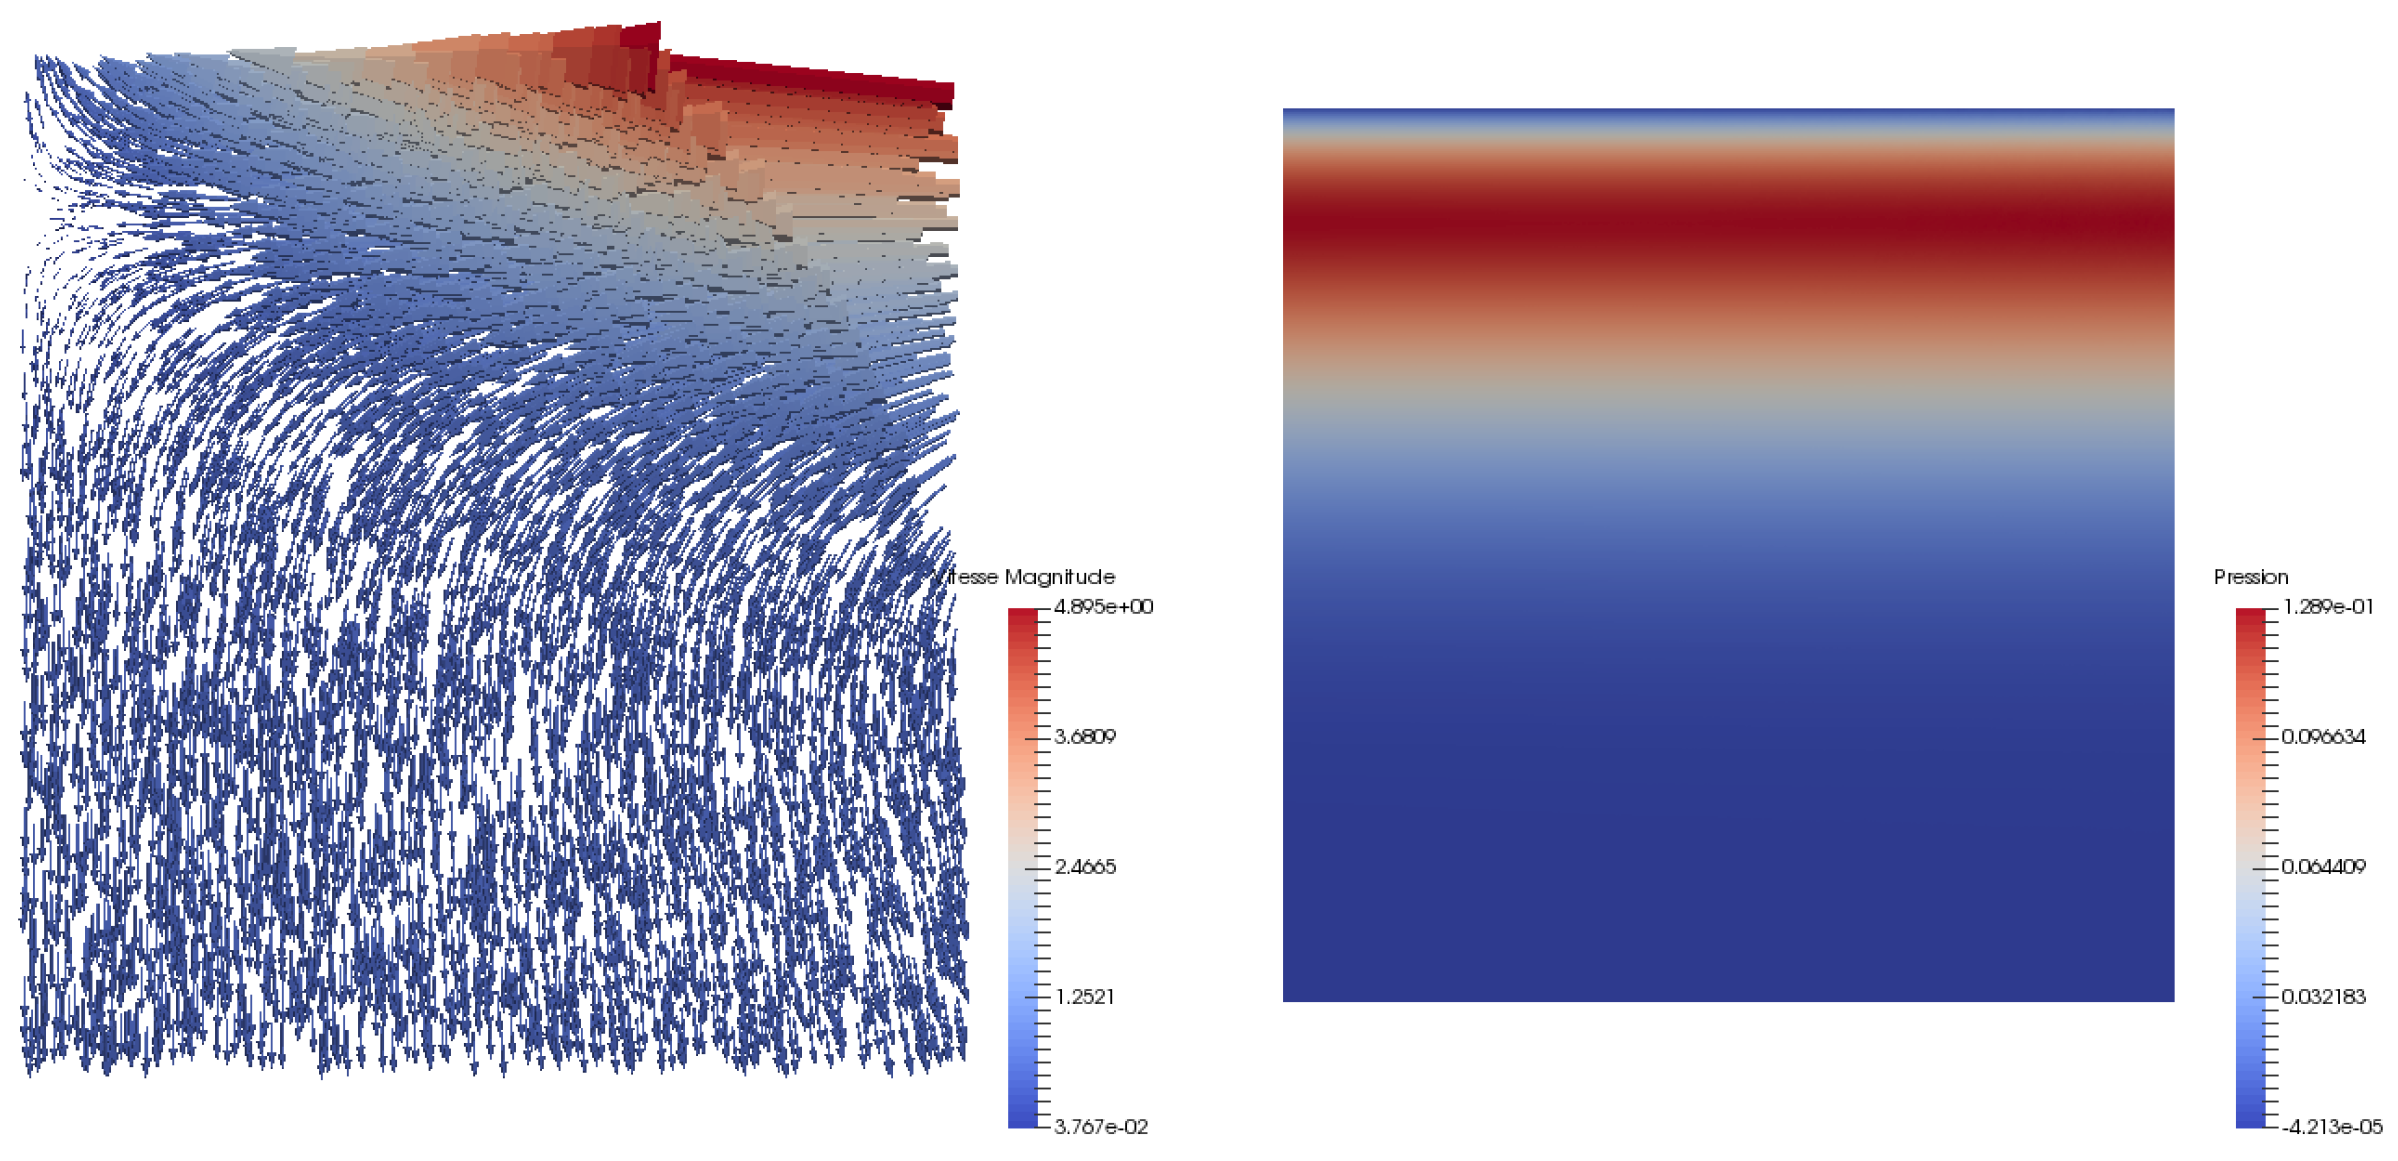
ρ is set to 1, and η to 0.001. The simulation starts with a null velocity, and runs until a time 20. The time step is set to 0.1. Results at time 20 are compared to the analytical solution. An example of the velocity and pressure fields are plotted in Figure 14.
The error criteria based on the L2 norm is used:
e r r x = Ω x s i m u x a n 2 d S Ω x a n 2 d S
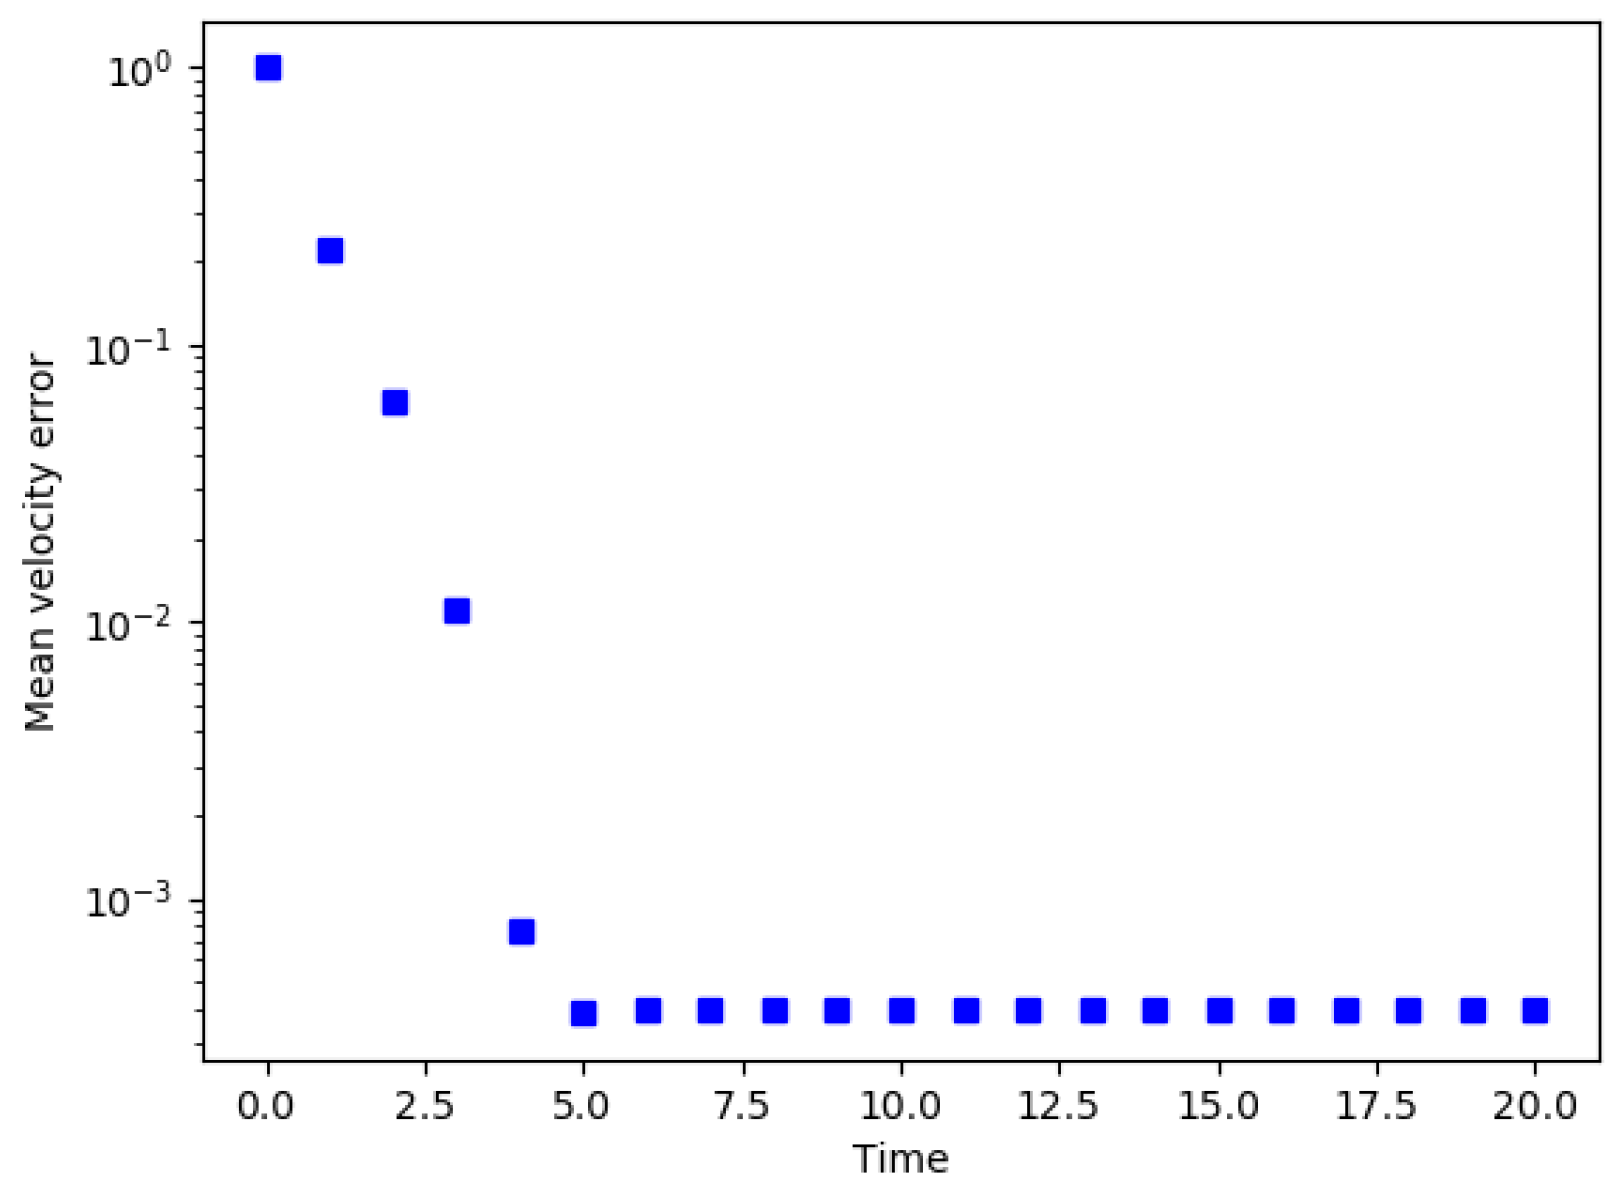
where x stands for the velocity vector or the pressure. 20 is long enough to ensure the steady state, when differences between two time steps are in the order of magnitude of the machine precision (see Figure 15).
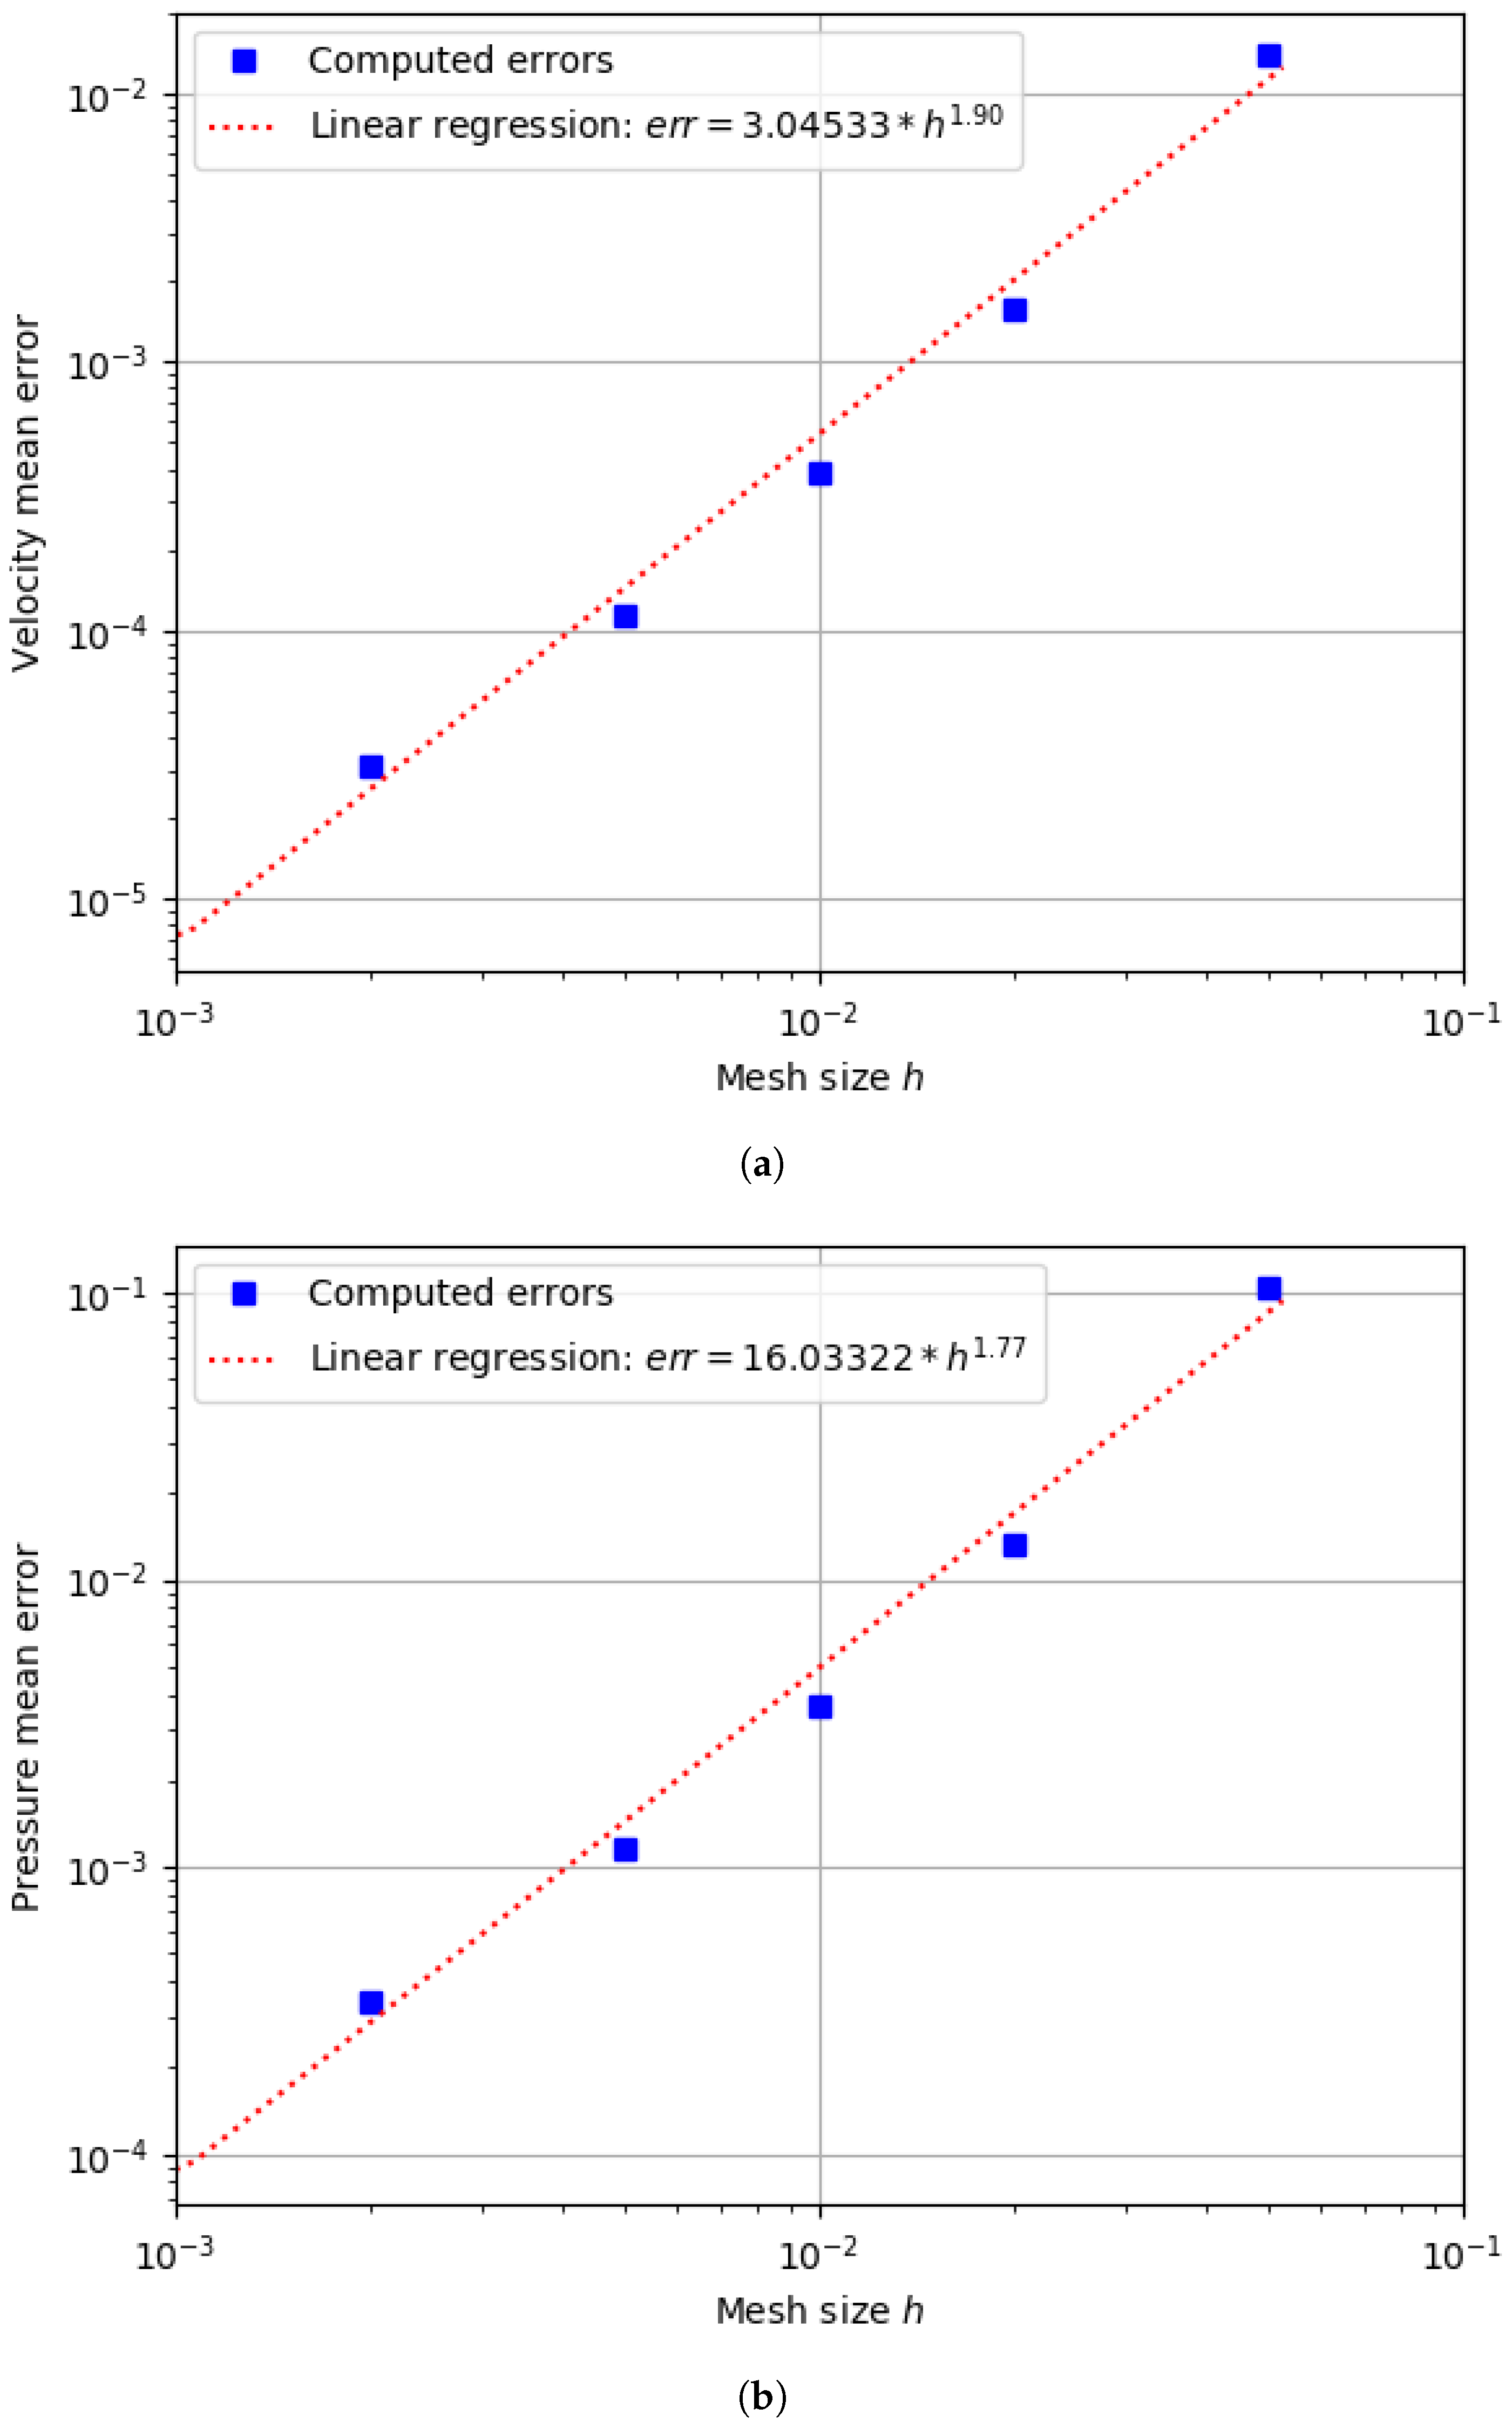
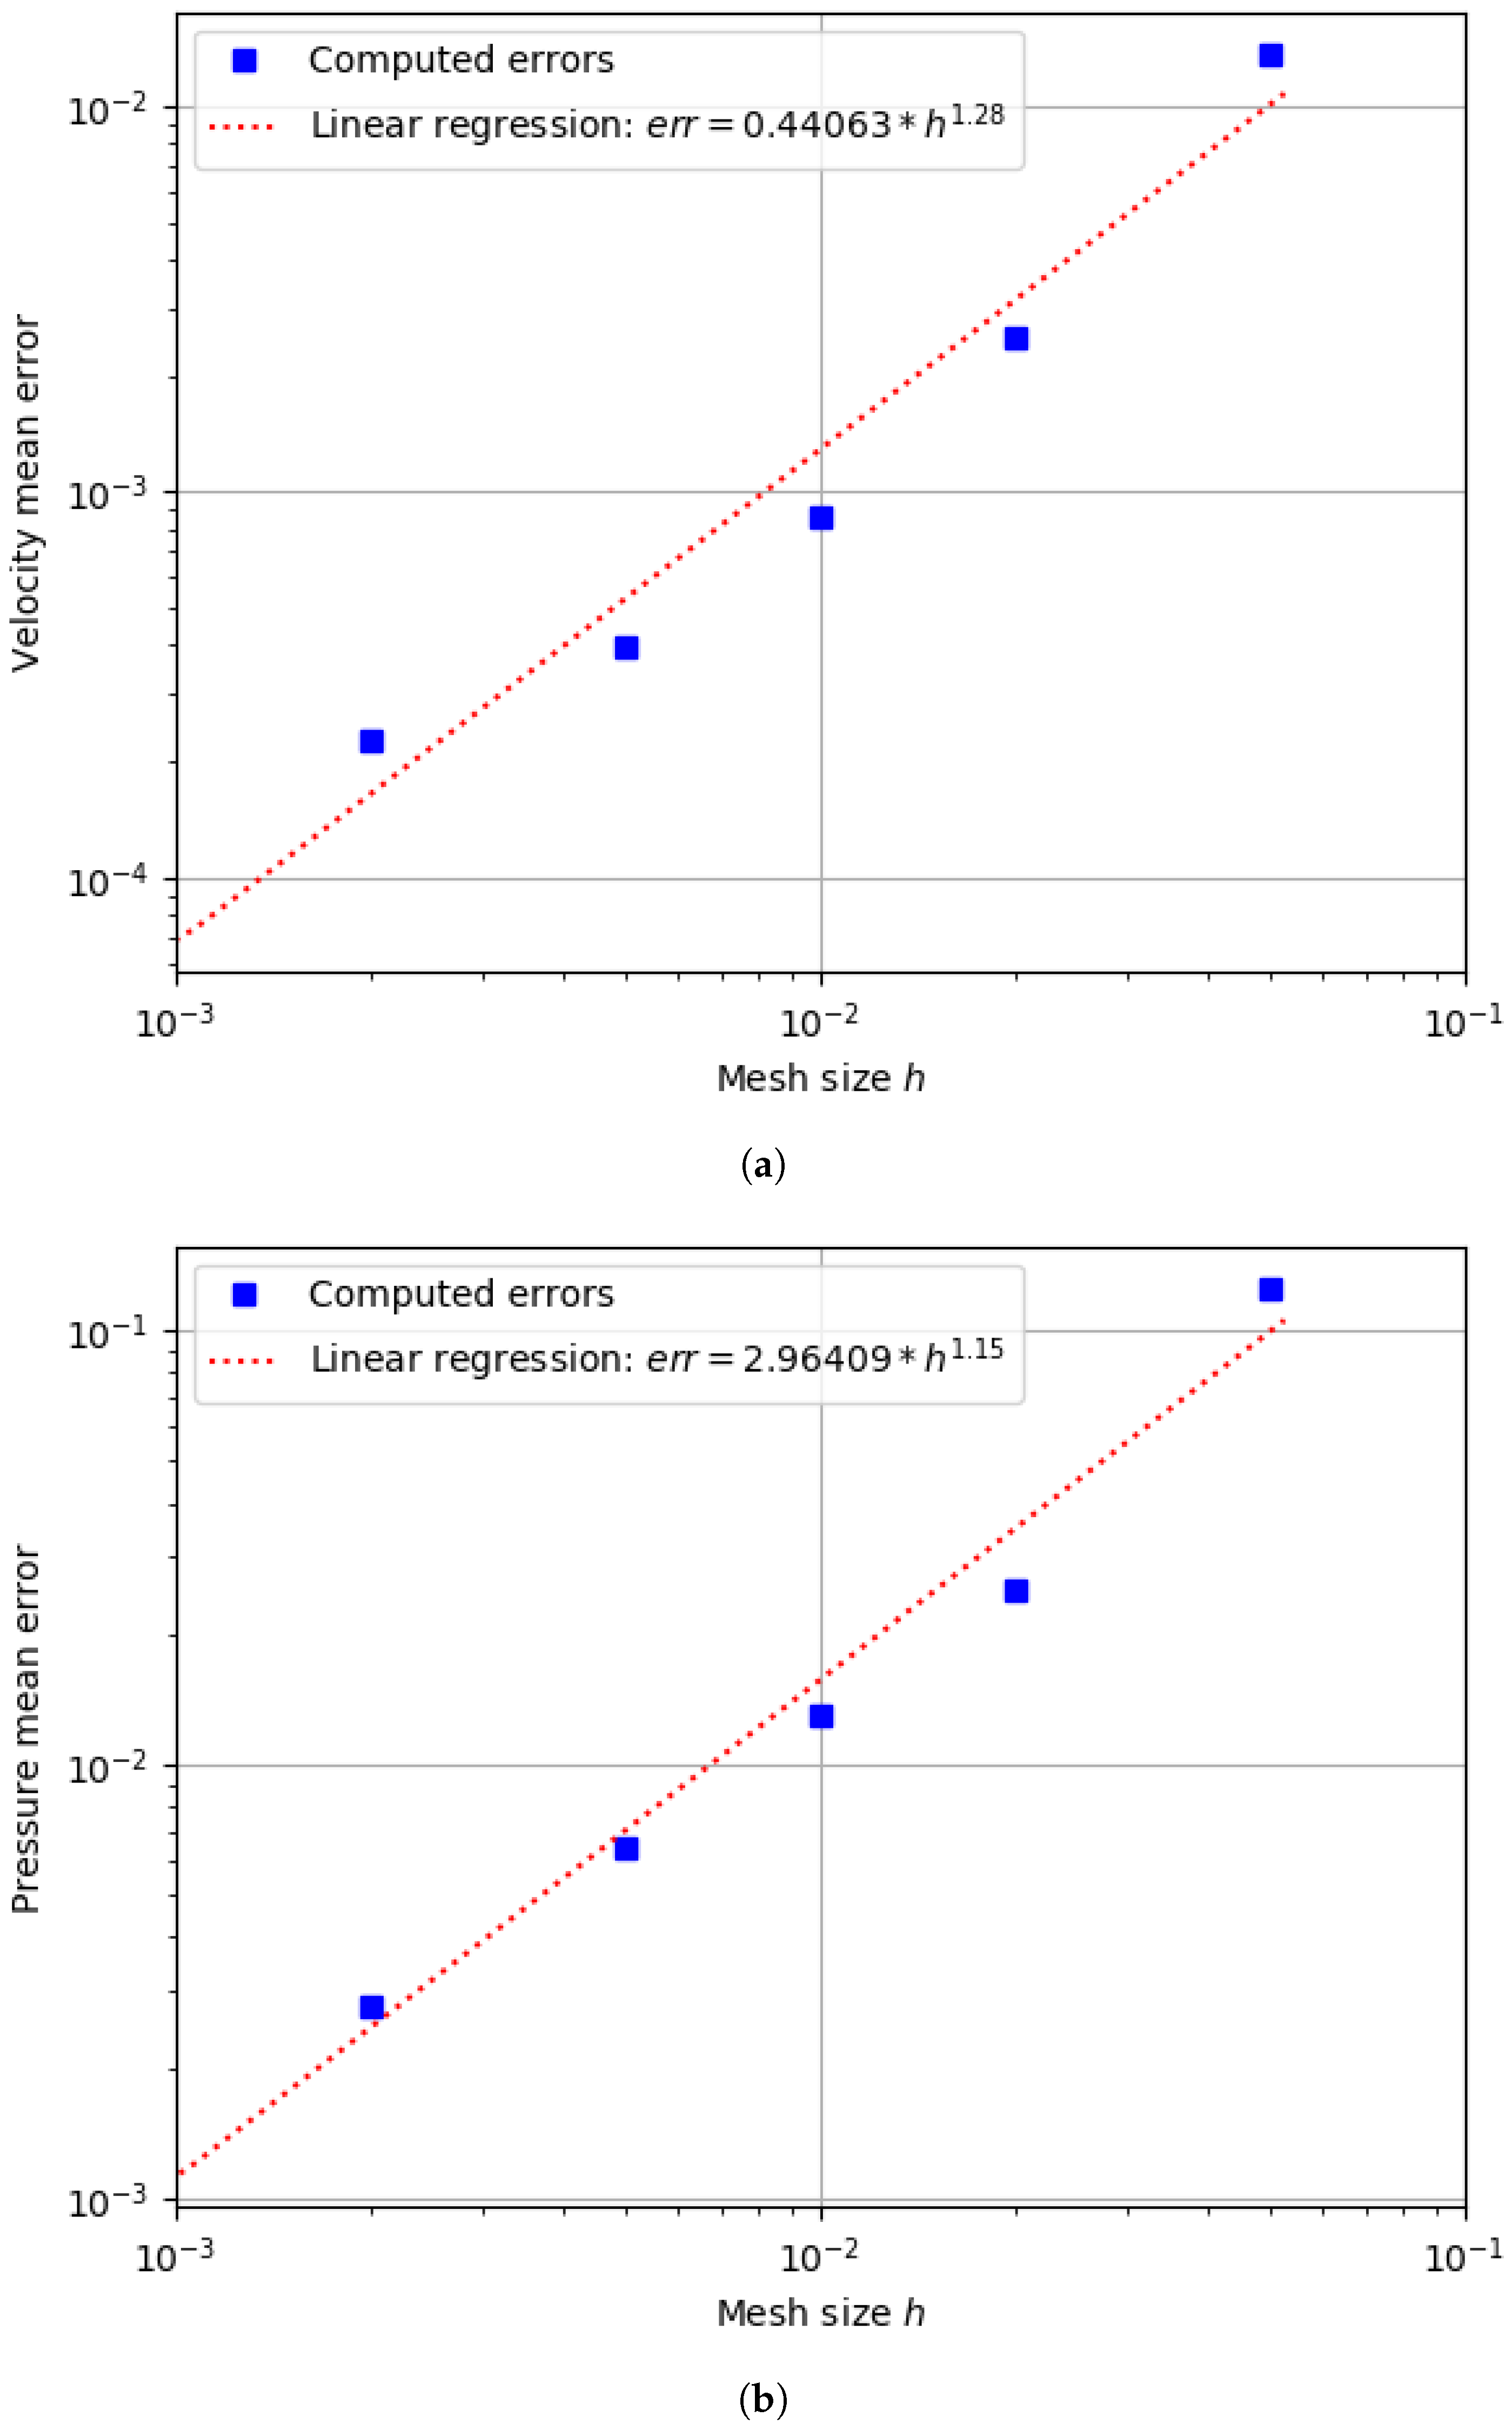
Results of the convergence study for both variables are plotted on Figure 16 for A = 0.1 and Figure 17 for A = 0.01 .
The order of convergence for the case A = 0.01 is of the same order as the one of the incompressible formulation computed by Hachem [37], proving the good behavior of the solver for this case. For A = 0.1 , the order of convergence is reduced (close to 1), showing a limit of the range of applicability of the formulation.

6.4. Combination with the Level Set Method

Now that the pseudo-compressible Navier–Stokes solver has been validated, it is used to account for a phase change process between fluids of different densities within the CSF approach. Considering back the surface mass transfer vector m ˙ , the conservation of mass in both fluids considering a Dirac distribution of mass transfer reads:
{ (40) H α ρ V t + · H α ρ V u   = m ˙ · α δ α ( 1 H α ) ρ L t + · ( 1 H α ) ρ L u (41) = m ˙ · α δ α
This can be rewritten as a velocity divergence equation combined with a Level Set convection equation form.
The momentum conservation equation is enriched with a Surface Tension term in the way of [47]. It is introduced in an implicit way as a volume source term γ α :
γ α = γ 0 · α | α | δ α α
This leads to the following system:
{ (43) · u = 1 ρ V 1 ρ L m ˙ · α δ α ρ u t + ( u · ) u (44) = P + · 2 η ε ˙ ( u ) + γ α + ρ g (45) α t + u ρ ρ V ρ L m ˙ · α = 0
The properties ρ and η are computed thanks to the following mixing laws:
ρ = H α ρ V + ( 1 H α ) ρ L
η = H α η V + ( 1 H α ) η L
This system well describes a phase change process with an arbitrary distribution m ˙ . Special attention should be paid on the velocity convecting the Level Set. The velocity field u as well as the correction factor are not constant perpendicular to the interface. This means a tendency of this formulation to deform the Level Set close to the 0 isovalue. The presence of α close to δ α allows small deviations from the distance property. However, this does not not stand above a certain point. To reduce this deformation impact, the value ρ ( α = 0 ) can be taken instead of ρ for the correction term, without disturbing the mass conservation property. What is really important is indeed the proper convection of the 0 isovalue. To consider this also avoid the spatial error made on ρ . Otherwise, the Level Set function shall be reinitialised regularly. The reinitilization technique is the one described by Shakoor et al. [48]. This is a Direct Reinitialization with Trees (DRT) that uses a geometrical approach to redefine the distance function from the 0 isovalue of the Level Set function. It is based on k-dimensional trees applied for Nearest Neighbor Searches to reduce the computational time of the reinitialization procedure. Further details are available in [48] that presents the algorithm used in this work.
This formulation is tested on two different benchmarks.

6.5. A 1D Benchmark—Moving Interface

The first benchmark is the convection of a straight line, meaning no theoretical influence of the surface tension term. The case is solved in 2D, in a 1 m × 1 m square domain. The vertical interface separates a vapor phase of small density on the left part from a liquid phase of high density on the right part. A mass transfer m ˙ is imposed from the vapor to the liquid phases. The fluids can only escape on the right side, leading to an interface displacement from left to right along with the liquid being pushed away due to the change of density. No slip boundaries conditions are fixed on the left side, and free slip conditions are fixed on the top and bottom sides. Pressure conditions are set free. This is summed up in Figure 18.
A constant interface velocity of u I = 2 × 10 3   m   s 1 is imposed. Different density ratios ρ L / ρ V are considered ranging from 2 to 2000 by changing ρ V . m ˙ is set accordingly to have the desired u I . The interface starts at a position 0.4 from the left side. The benchmark is conducted for the fluid properties gathered in Table 2.
No reinitialization was conducted for this benchmark, leading to a deformed Level Set. This enhances the capability of the formulation to handled non reinitialised Level Set on simple configurations.
The case was computed with four mesh sizes (in m ): 5 × 10⁻³, 1 × 10⁻², 2 × 10⁻² and 5 × 10⁻². Four time steps were set accordingly to maintain a constant CFL value of 0.2 related to the interface velocity u I = m ˙ / ρ V .
Two convergence studies were conducted. In the first one, the parameter ε was set constant to 0.1   m . In the second one, ε was set consistently with the mesh size h: ε = 3 h .
The considered error is also computed with (35) but with N = 10 sample points.

6.5.1. Constant ε

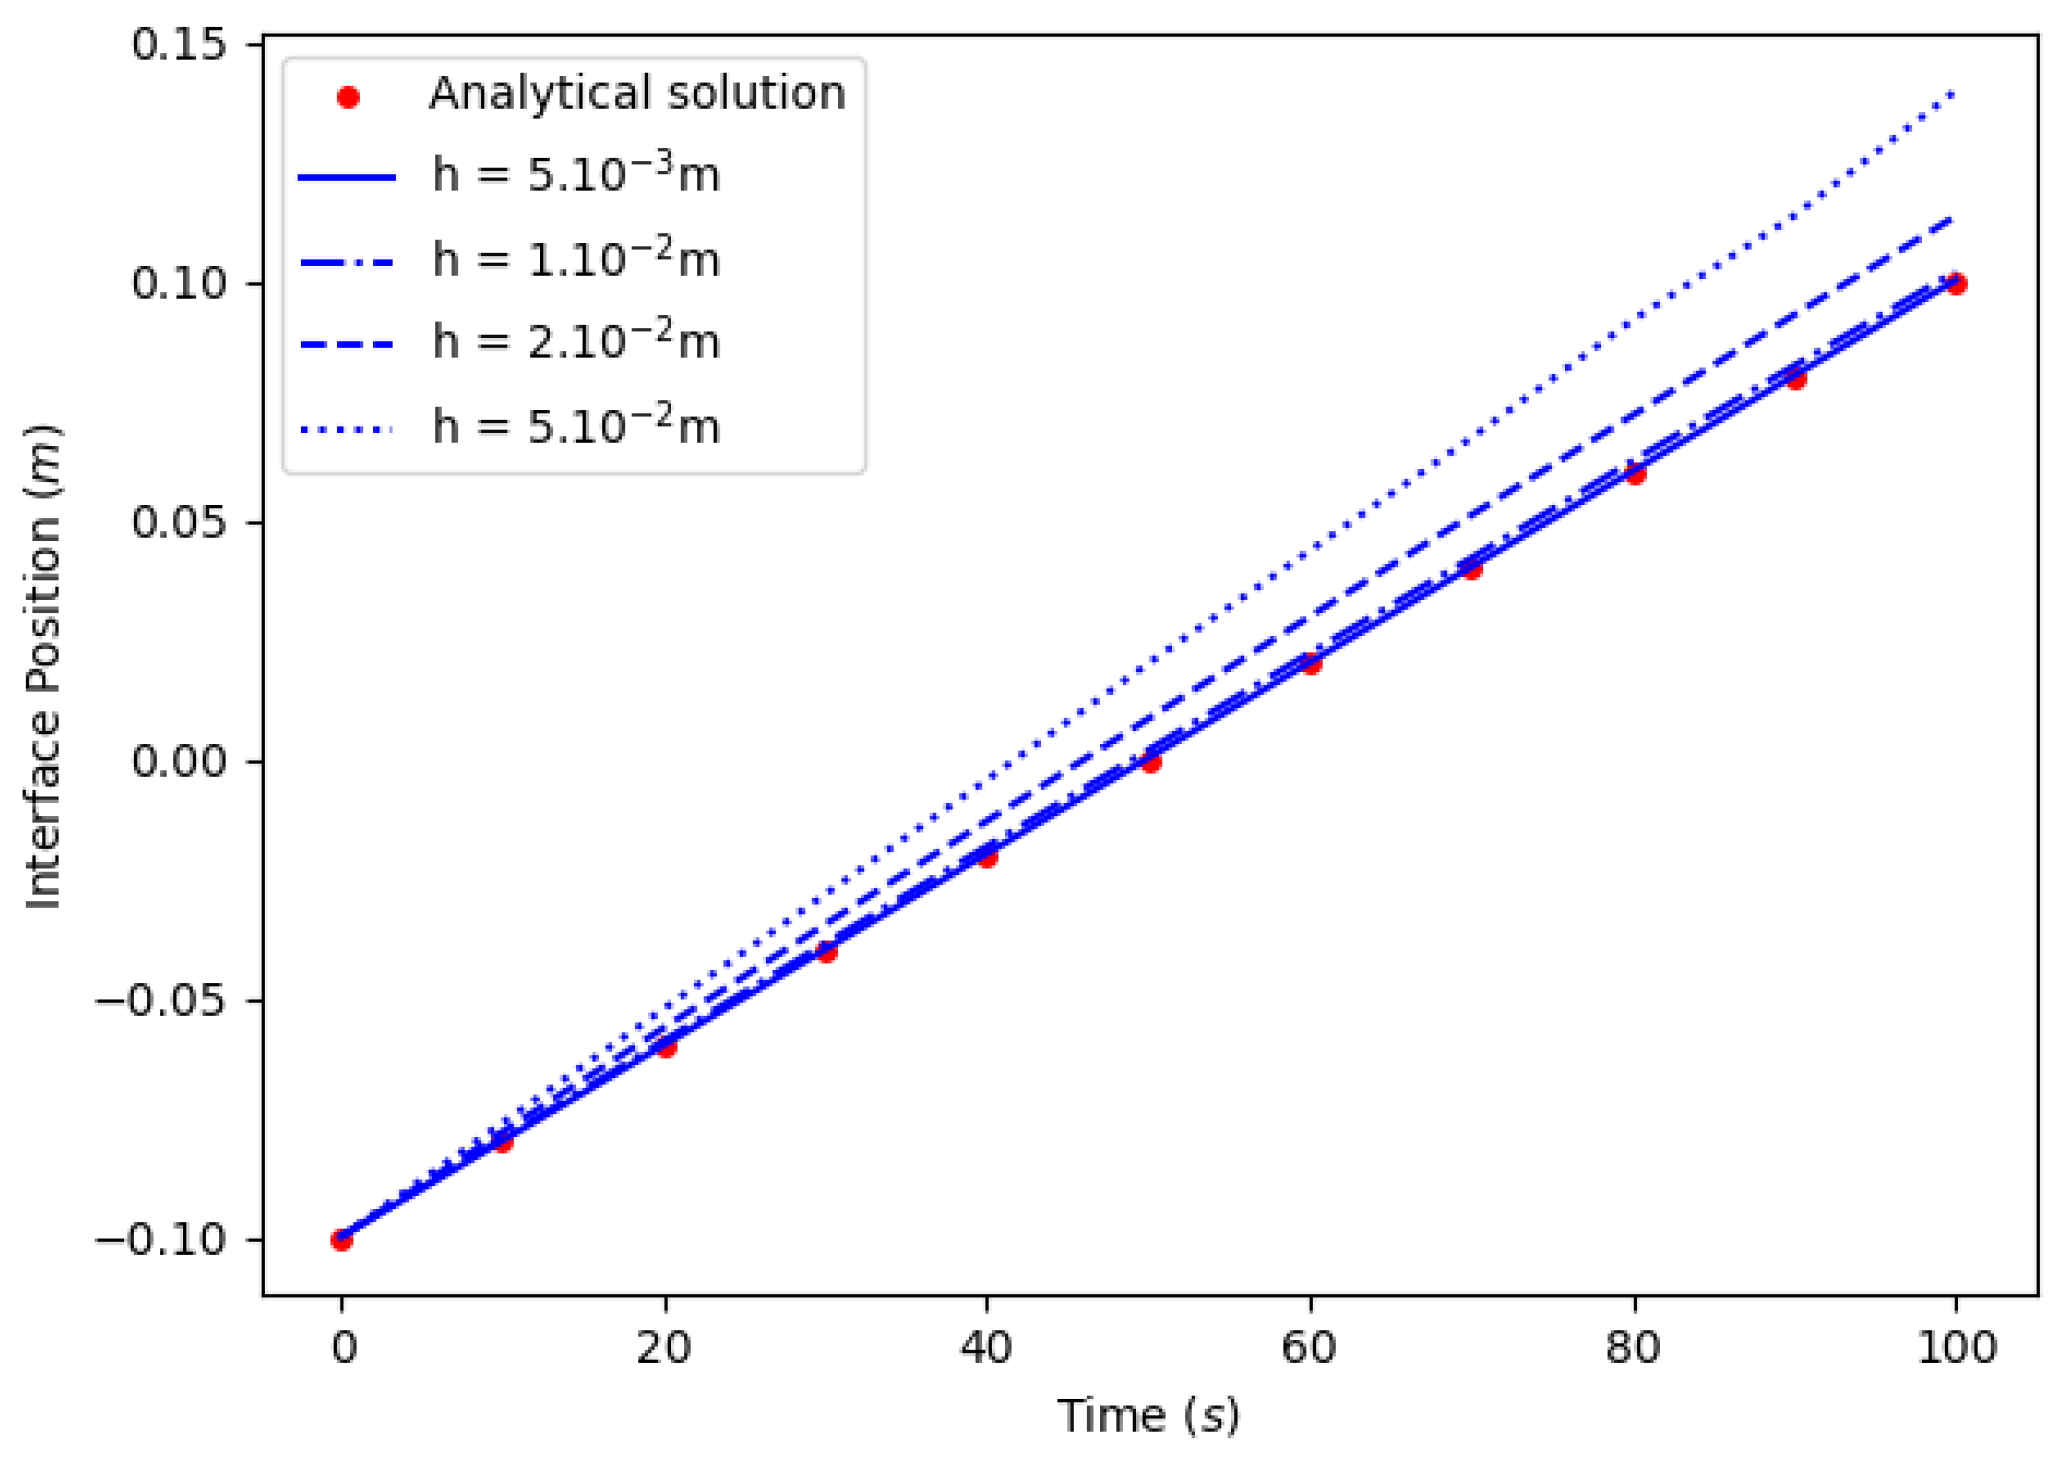
Positions for every mesh sizes for the case r = 2000 is plotted on Figure 19, and the convergence study for every ratios is plotted in Figure 20.
Displacement of the interface is properly computed according to the analytical solution, validating the combination of the two solvers. This is true whatever the ratio of density. The convergence is well observed, with an order of 2 whatever the density ratio. This is coherent with the results of the pseudo-compressible square benchmark with A = 0.01 .
Another point of interest is to verify if the mass conservation is properly respected. The good capturing of the interface displacement tells us that the mass of vapor is consistent with the analytical value. However, a liquid outflux exists on the right boundary, meaning a potential source of error. We therefore compare the total mass of the 2D system M:
M = H 0 s ρ V d x + H s L ρ L d x
where L and H are the width and the height of the domain.
The analytical mass M a n is given by the analytical value of s. It is compared with the simulated mass M s i m u computed by (48), and with the integrated mass M o u t from the liquid outflux:
M o u t = M ( t = t 0 ) 0 t 0 H u L · e x d y d t
where e x is the horizontal vector pointing to the right.
It is also compared with the mass M d i v computed by integrating the divergence of the velocity field:
M d i v = M ( t = t 0 ) 0 t 0 H 0 L · u   d x   d y   d t
We consider the deviations of M s i m u , M o u t and M d i v from M a n thanks to the relative difference | M * M a n | / M a n . These three quantities are plotted in Figure 21 for the configuration h m i n = 5 × 10 3   m and Δ t = 0.5   s . As the interface is properly computed, the simulated mass is naturally well computed. What is important is to notice that the masses estimated from the outflux and from the velocity divergence is consistent with the absolute mass, as the difference remains below 1%. This validates the efficiency of the system to properly deal with mass conservation.

6.5.2. Varying ε

The idea of the formulation is to reduce the interface size as much as possible, as the goal is to model a quasi sharp interface. The physical mixing length of a vapor liquid interface is of the order of magnitude of an Å, though this scale is rarely reached in practice. ε is then set according to the mesh size value. The same law as for the Stefan problem described in Section 5 is taken: ε = 3 h .
Doing so, two problems arise. Firstly, numerical instabilities described by [49] are not handled anymore and disturb the interface. This is not surprising, as the BKZ condition ( Δ t B Z K < ( ρ V + ρ L ) h 3 / 4 π γ 0 ) is exceeded by 2 orders of magnitudes, and the way the surface tension is handled does not fully control these instability, according to [49]. However, this problem can be handled by reducing the time step.
Secondly, even while canceling the surface tension term or stabilising the case by increasing viscosity values by a factor 100, no proper convergence is observed up to a certain point, and a residual error of around 1% remains. For example, interface positions for a ratio r = 2000 with higher viscosity are plotted Figure 22.
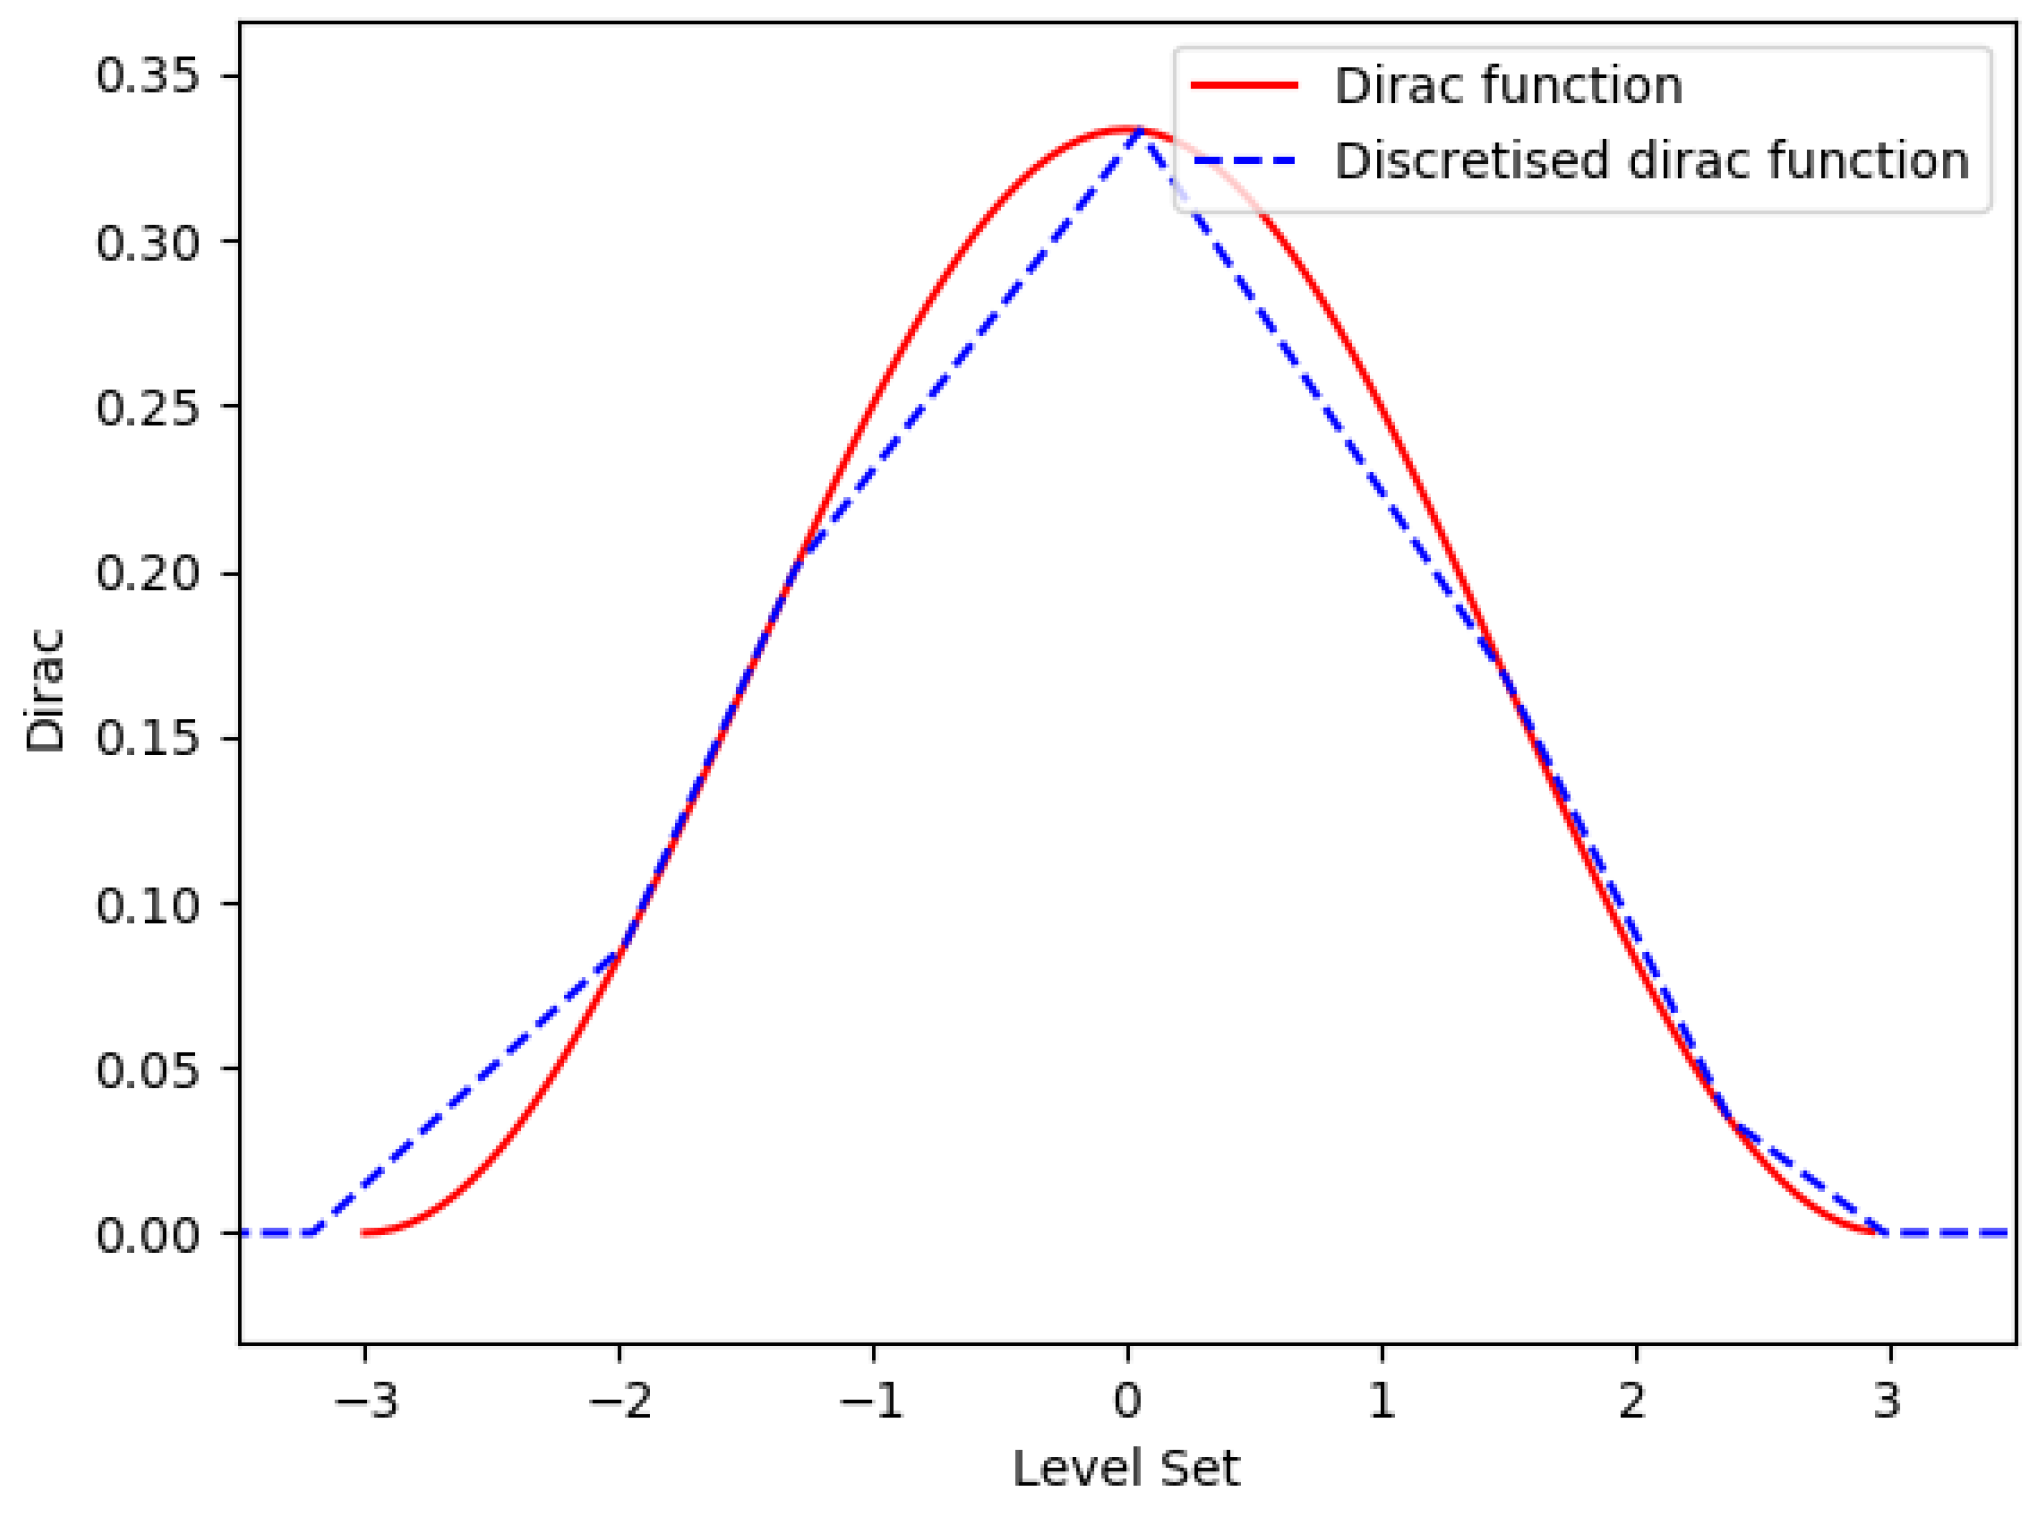
This can be explained by the discretization of the Dirac function δ α . Considering ε proportional to h means that the δ α function is discretized with the same number of point whatever the mesh size: 7 discretization points for ε = 3 h (see Figure 23). However most important is the capability of the function δ α to guarantee an integral of 1 over the interface. However, this is not guaranteed with a fixed amount of sample points in an unstructured mesh. To demonstrate this, a Python code has been implemented to assess the order of magnitude of the error made on the integral computation due to the discretization in 1D.
For the sake of an example, considering a constant mesh size h of 1, and still with ε = 3 h , seven reference sample points are considered, enriched with two extremity sample points at a distance 4 h from the center to cover the entire function:
α ˜ i 0 , 8 = ( 3 + 1 ) h + h i
A batch of 1000 groups of sample points are created thanks to the random function rd ( ) from the numpy library of Python, that allocates a random real between 0 and 1. Every sample point is randomly placed around a reference sample point at a maximum distance ζ . This is supposed to represent the non uniformity of the mesh. The bigger ζ , the more distorted the mesh is.
{ α i } j 1 , 1000 = α ˜ i + ζ rd ( ) 0.5 0.5
An example of a resulting sampling is plotted in Figure 23.
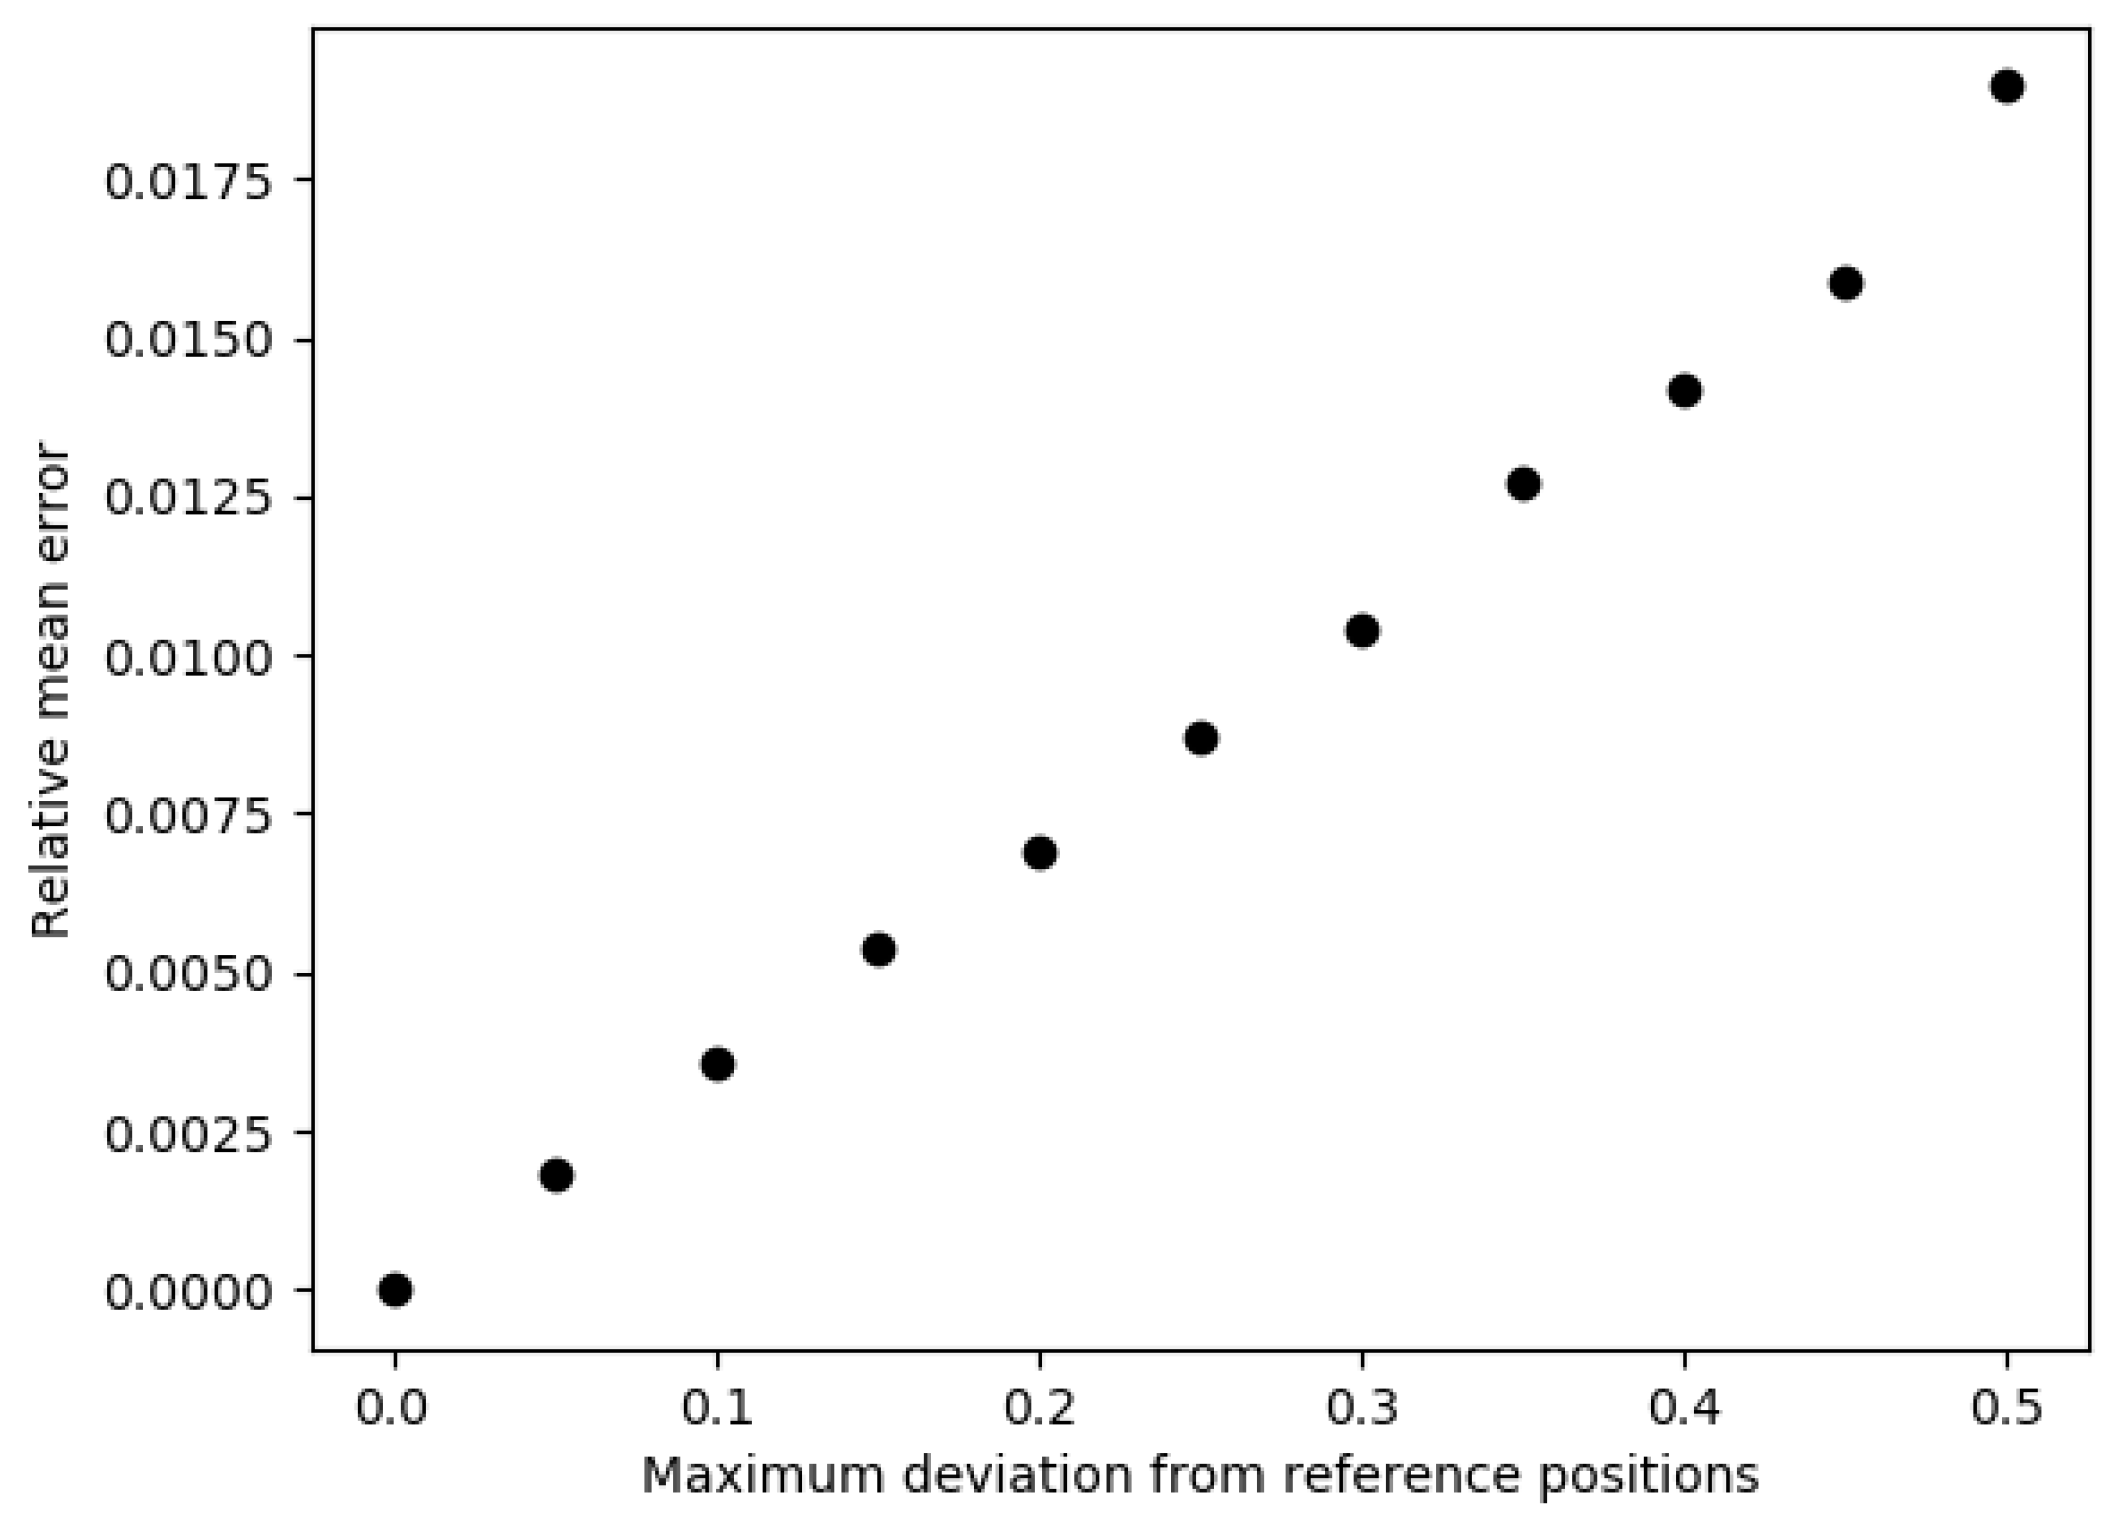
For different values of ζ , a thousand δ α functions with randomised discritization points are created. Integrals of these functions are then computed. Mean values of the error made are plotted in Figure 24.
Tests has been carried out with groups of points bigger than 1000 without changing the results. Thus, these results are assumed to represent well the discretization error conducted with an unstructured mesh. The order of magnitude of the error is of the percent. This is the same as the one observed for the interface displacement with ε changing with h. This explains why the formulation for a varying interface thickness does not properly converge in mesh size, as a permanent residual error exists due to the sampling of the Dirac function: if the integral is not properly computed, the integrated velocity field resulting from the velocity divergence equation deviates from the analytical solution. Then, the convection velocity of the Level Set equation also deviates from the analytical solution due to the same error, leading to the error on the interface position.

6.6. A 2D Benchmark—Growing Bubble

For this 2D benchmark, the contribution of the surface tension term is more strongly observed. Inside a square domain of 0.008 m × 0.008 m, a circular bubble of low density grows with a constant mass transfer inside a fluid of higher density, as shown in Figure 25. This fluid is pushed away outside of the domain, whose boundary conditions are of homogeneous Neumann type. Inside the bubble, a small zone is set at 0 velocity to prevent the derivation of the Bubble.
A constant mass transfer of 0.1 kg m−2 s−1 from the vapor phase towards the liquid phase is set. The initial radius of the bubble is 0.001   m . The benchmark is conducted for the following fluid properties gathered in Table 3.
This time, the Level Set was reinitialized to avoid important distortions of the Level Set. The reinitialization is conducted every 0.001 s, thus 10 times during the simulation. This is high enough to ensure that the Level Set is not too deformed, but low enough to avoid any systematic error due to the DRT method detailed in [48].
The case was computed with four mesh sizes: (in m ): 2 × 10⁻⁵, 5 × 10⁻⁵, 1 × 10⁻⁴ and 2 × 10⁻⁴. Four different time steps were set accordingly to maintain a constant CFL value of 0.025 related to the interface velocity m ˙ / ρ V . With these parameters, the BKZ condition is roughly respected.
Two studies were conducted: in the first one, the parameter ε was set constant to 2 × 10 4   m . In the second one, ε was set consistently with the mesh size h: ε = 3 h .
The considered error is based on the radius R, among N = 10 sample points:
e r r = 1 N i 1 , N R s i m u i R a n i
The study with constant ε leads to a residual error on the radius, even with the smallest values of time step and mesh size, as shown in Figure 26.
The reason lies inside the thick nature of the interface. When this parameter is not negligible in comparison to the curvature of radius R, a bias in the formulation is introduced. Globally, the amount of mass is conserved, but locally, the 0 isovalue is not properly convected. This can be shown while expressing analytically the velocity for this benchmark. The Level Set is here positive in the bubble, and negative outside, with H α being 1 inside the bubble, and 0 otherwise. Considering that the Level Set is properly reinitialised, writing u = u r ( r ) e r , and integrating · u = 1 r r u r r = 1 ρ m ˙ · α δ α between R ε and r leads to:
u r = 1 ρ | m ˙ | ( 1 H α ) 1 r ε r R ¯ H α d α
Adding the velocity correction term, the 0 isovalue convection velocity reads:
u I ( α = 0 ) = m ˙ ρ V + 1 ρ m ˙ R ε 0 H α d α
Which is not the analytical solution m ˙ ρ V . A second order term appears, and is not negligible when ε is not negligible in regards to the curvature radius R. This shows the need of an order 2 correction term to account for this effect. If the Level Set is not properly reinitialised, an order 1 linear approximation leads to a modification of the correction term thanks to the gradient of the Level Set.
The convection equation now reads:
α t + u ρ ρ V ρ L m ˙ 1 ρ m ˙ κ α | α | ε 0 H α d α · α = 0
With κ α the curvature that is computed thanks to the divergence of the normal given by the Level Set, as for the Surface Tension term. The integral can be computed analytically knowing the analytical expression of H α .
Doing so, the problem is solved and the error vanishes for the smallest values of time step and mesh size as shown in Figure 26.
Results of the convergence study are shown in Figure 27.
Now, a proper convergence is observed. An order of convergence close to 2 is coherent with the former results of the moving interface.
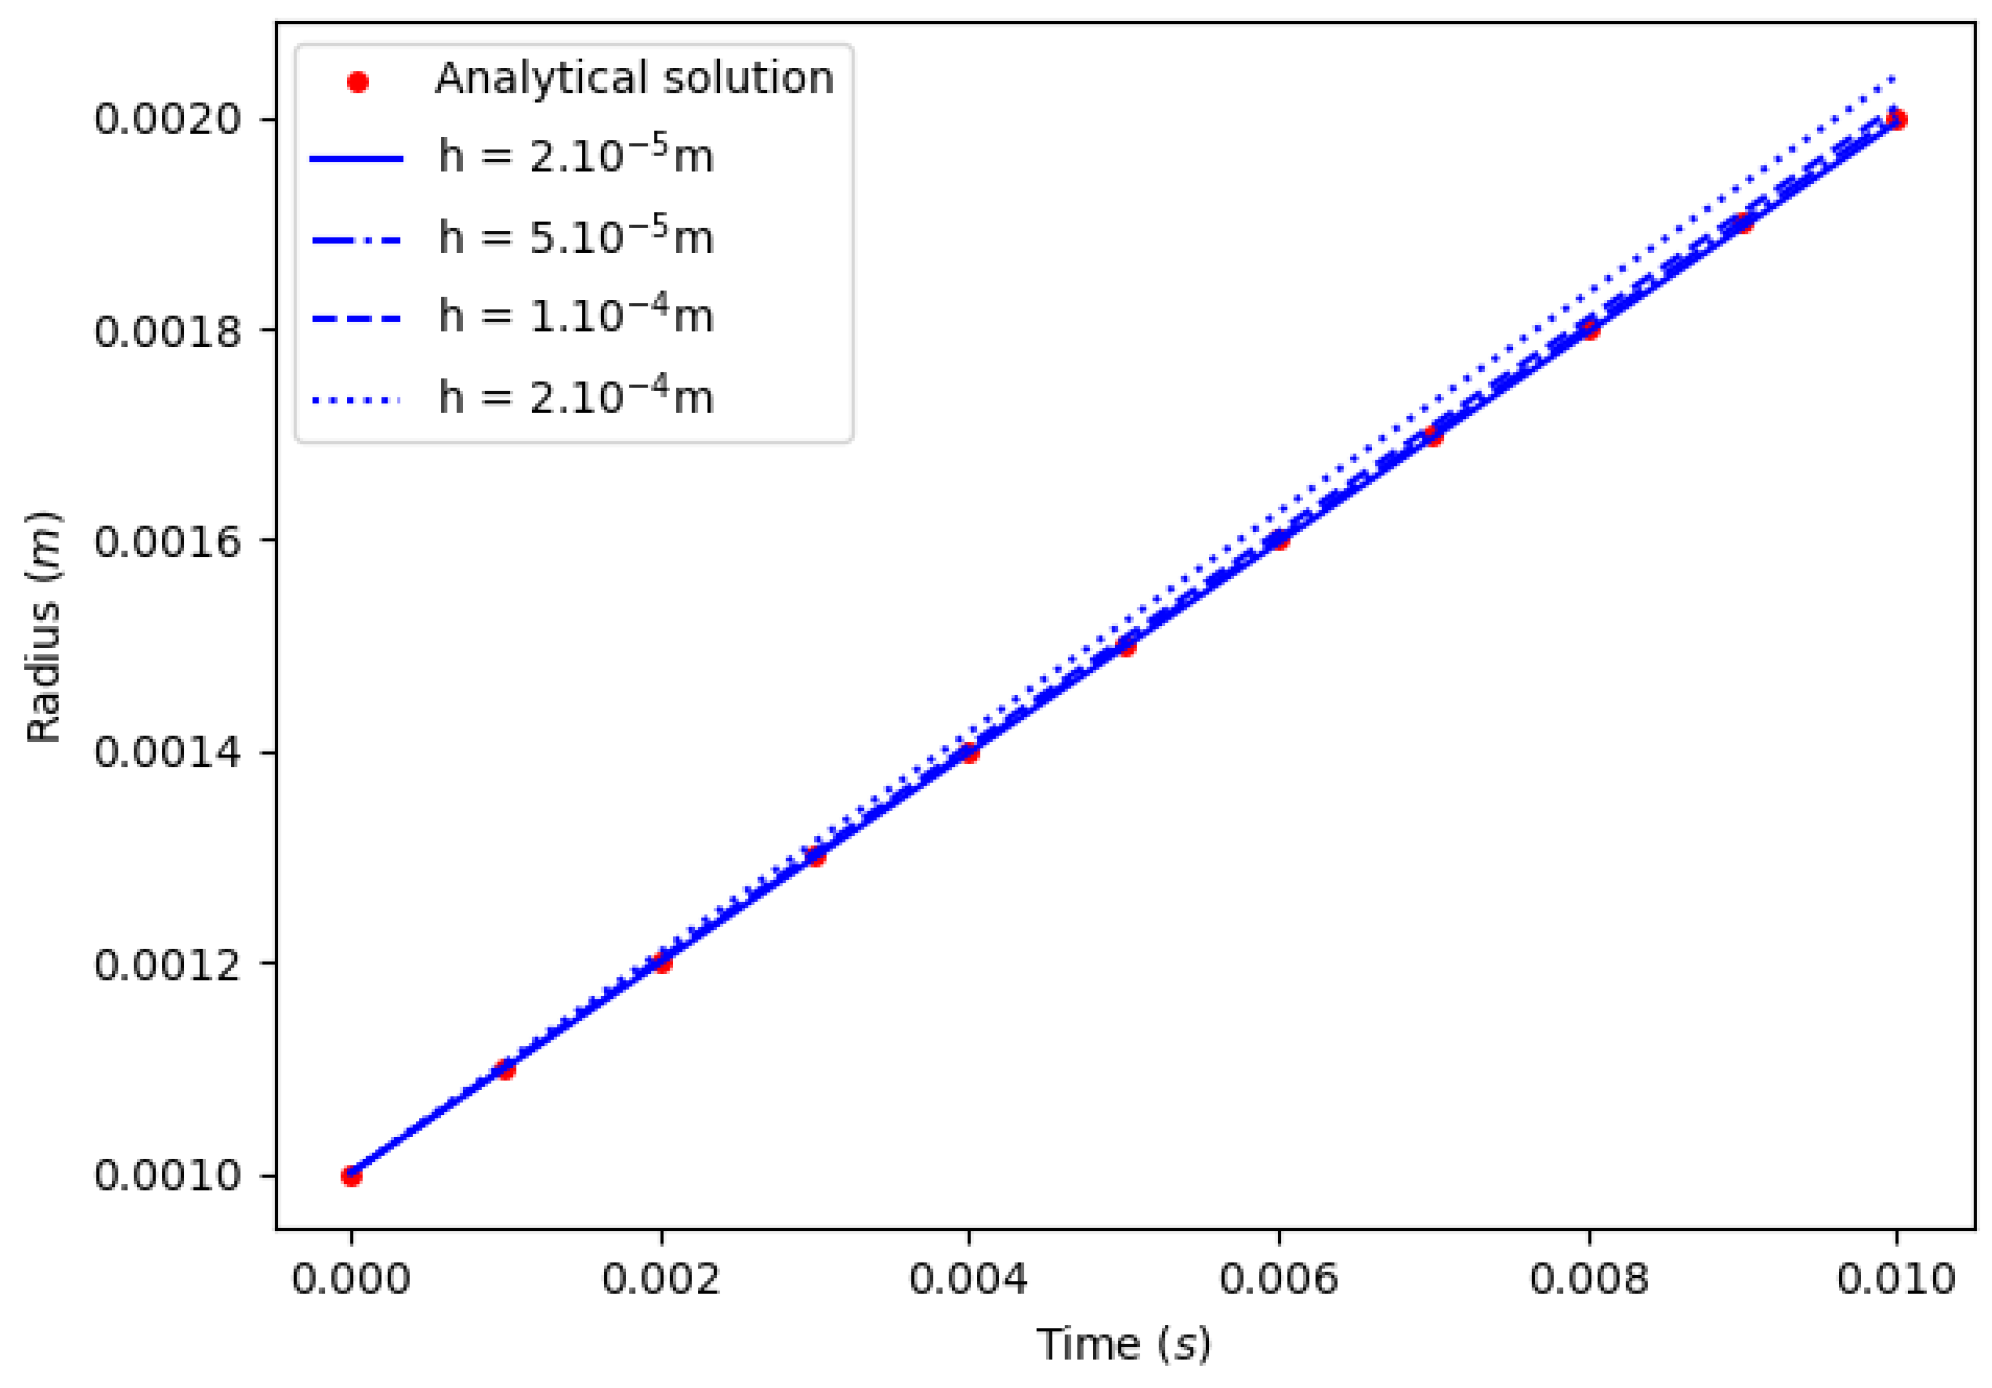
Regarding the convergence study when varying ε , the radius for different time steps and mesh size are plotted in Figure 28.
The error is not very significant for small h and Δ t , but convergence is slower with mesh size due to the Dirac discretization that requires a very small mesh size. The order of magnitude of the error is again the same as the one estimated thanks to our Python code, explaining the convergence of the scheme for varying ε . This is however an error of relative small importance for more complex cases, and that can be reduced by raising the number of discretization points to describe δ α .
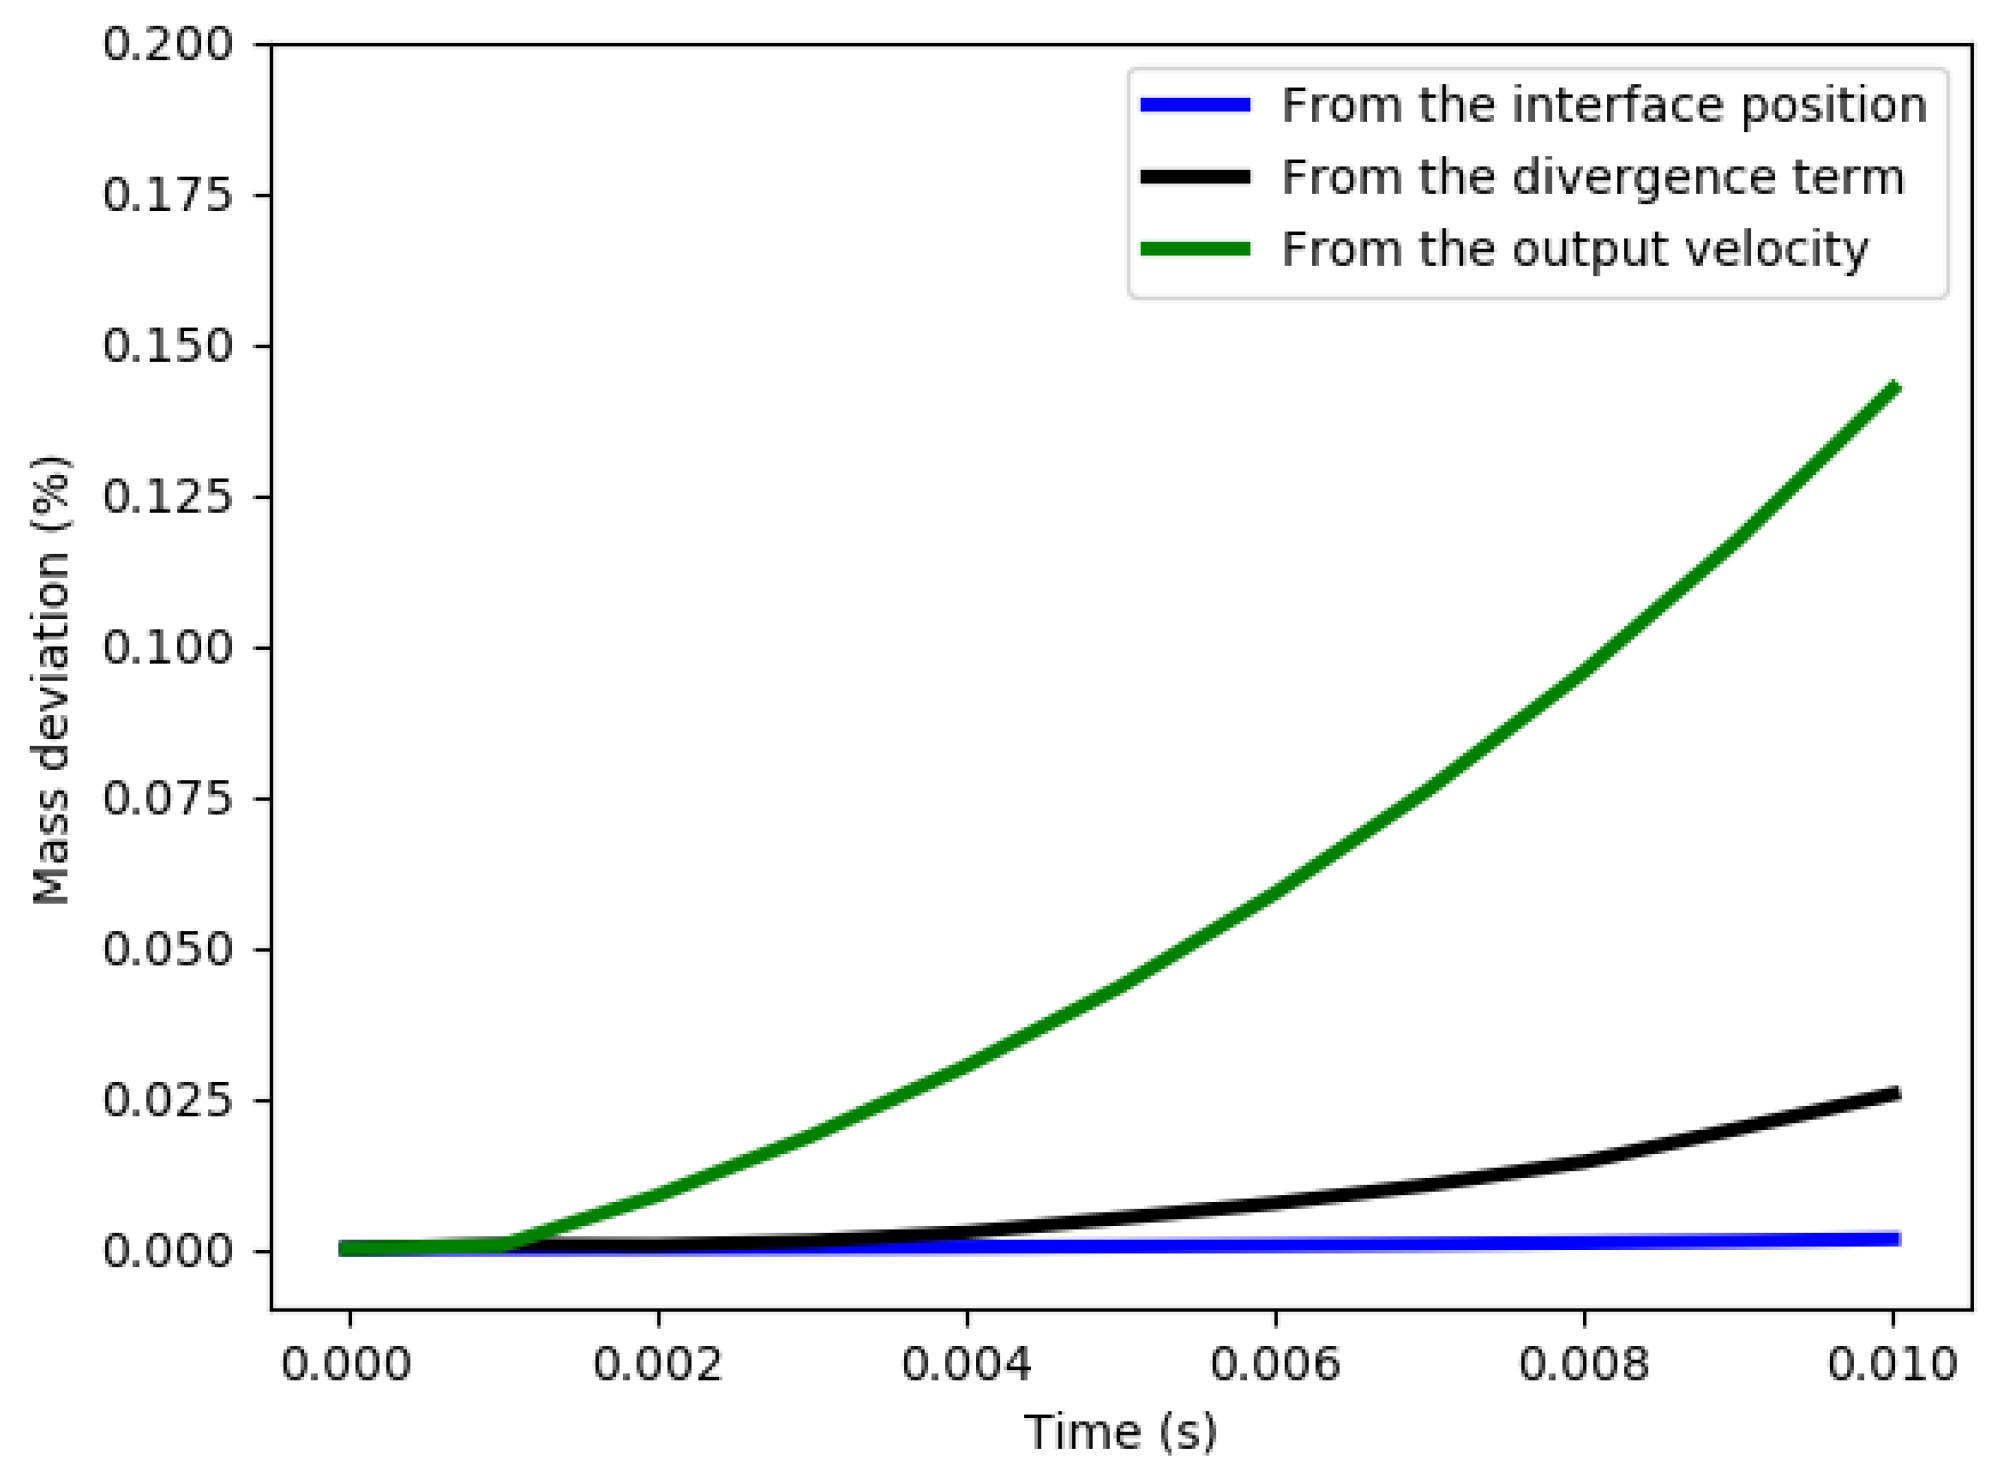
The mass conservation is also verified in this configuration. We follow the same approach as in Section 6.5.1, the only difference being that this configuration is 2D: the outflux has to be computed on all the boundaries of the domain. The different deviations of the mass estimations for the configuration h m i n = 2 × 10 5   m and Δ t = 5 × 10 6   s are plotted in Figure 29. The masses estimated from the outflux and from the velocity divergence are still consistent with the absolute mass. This validates further the efficiency of the system to properly deal with mass conservation.

7. The Complete Phase Change Solver

All the ingredients are now ready for the complete formulation of a phase change solver. The mass transfer and change of density are taken into account thanks to the pseudo-compressible solver along with Level Set convection. The surface mass transfer vector m ˙ is computed thanks to the HFJC method described in Section 3.
Special attention should be paid on the distance function property. The HFJC relies on a proper distance function, and can run improperly if the Level Set is deformed. To ensure this, a working distance function used for the HFJC method is created by reinitializing the Level Set at each time step without modifying α itself.
Two benchmarks are studied to assess the validity of the complete formulation.

7.1. A 1D Benchmark—Compressible Stefan Test Case

The compressible Stefan test case is very similar to the incompressible configuration, except that the liquid phase is pushed back away from the wall. There is thus a convection term inside the liquid phase that changes the formulation of the energy conservation equation, and then the temperature distribution.
In the liquid phase, the new equation reads:
T t + u L T x = D L 2 T x 2
The velocity u L is spatially constant, and determined thanks to the velocity jump at the interface:
u L = 1 ρ | m ˙ |
Boundary conditions (30) do not change. Interface still initialized at 0.0001 m.
The solution of this new version of Stefan benchmark reads:
T ( x , t ) = T ω + T s a t T ω erf χ erf χ x s ( t ) for x [ 0 , s ( t ) ] T + T s a t T erfc χ ρ V ρ L D V D L × erfc χ x 1 ρ V ρ L s ( t ) s ( t ) D V D L for x [ s ( t ) , + [
The interface displacement is still proportional to the square root of the time:
s ( t ) = 2 χ D V t
With χ given from the energy conservation at the interface that leads to:
ρ V L χ D V + k V ( T s a t T ω ) e χ 2 π D V erf ( χ ) + k L ( T s a t T ) e χ 2 ρ V 2 ρ L 2 D V D L π D L erfc χ ρ V ρ L D V D L = 0
Only one configuration is tested: T ω = T s a t + 10   K , T = T s a t 1   K . Then χ = 2.52 × 10 2 . The physical properties are given in Table 4.
The test case is computed for an unstructured non uniform 2D mesh of dimension 2 × 10 −4 by 2 × 10 3   m 2 with a maximum of 50.000 elements whose mesh size h at the interface varies among 5 values (in m ): 1 × 10 −6, 2 × 10 −6, 4 × 10 −6, 7 × 10 −6 and 1 × 10 −5. Five different time steps were set accordingly to maintain a constant CFL value of 0.2 related to the initial interface velocity m ˙ ( t = t 0 ) / ρ V . The initial position of the interface is this time 1 × 10 4   m . The interface thickness is set to 3 h with an extension zone of size 4 h .
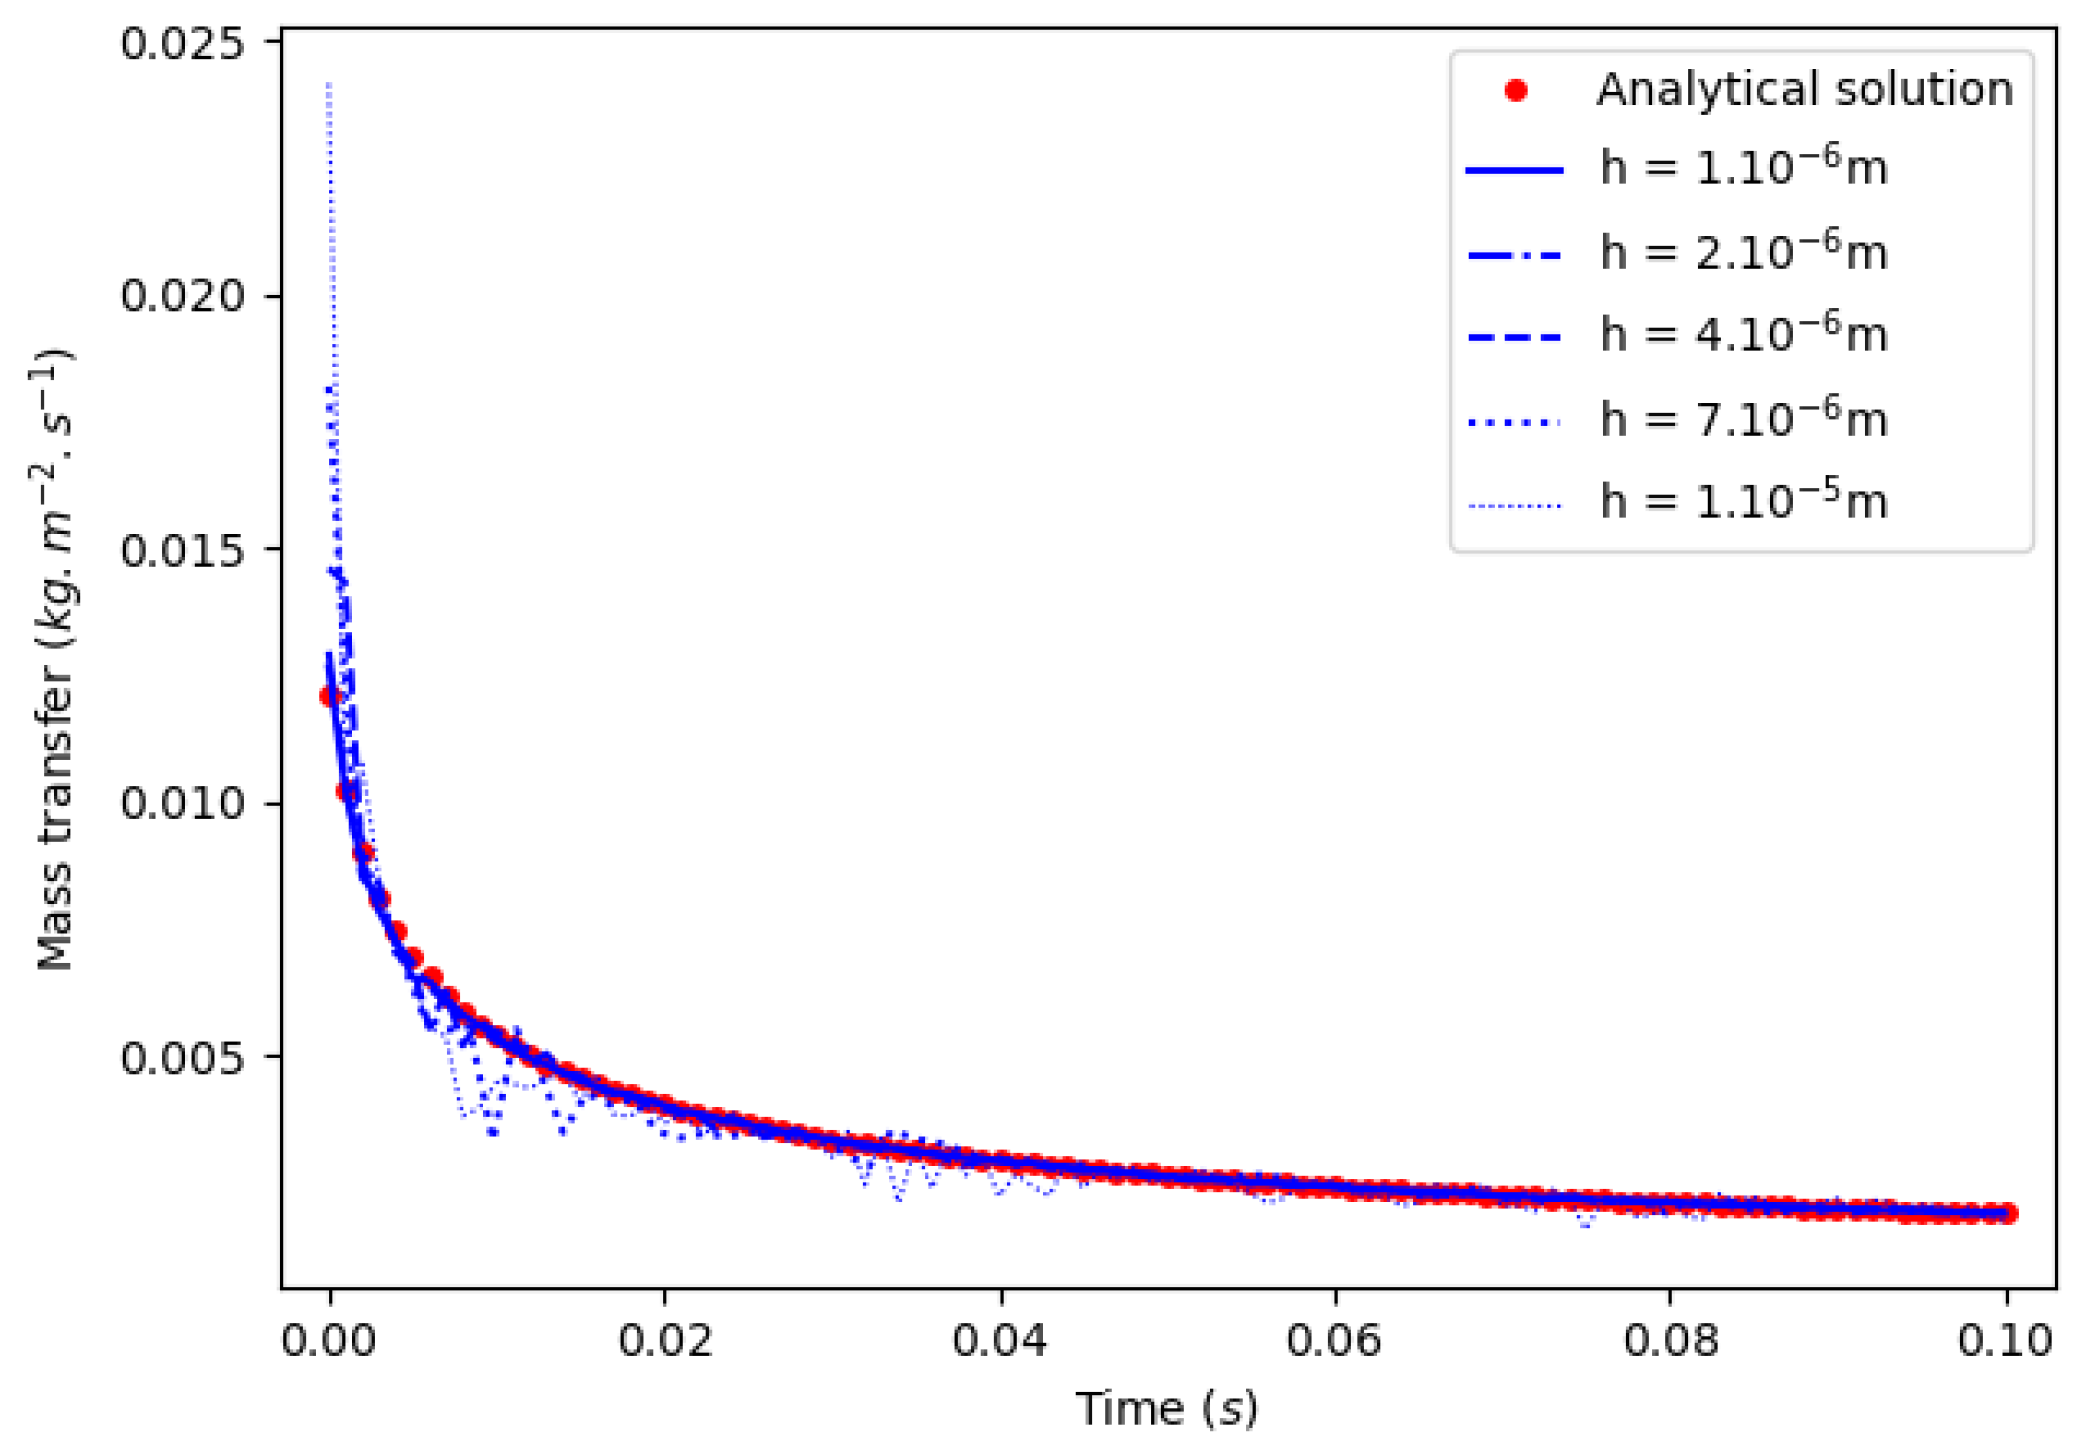
Results of interface position and mass transfer rate values versus time are plotted in Figure 30 and Figure 31.
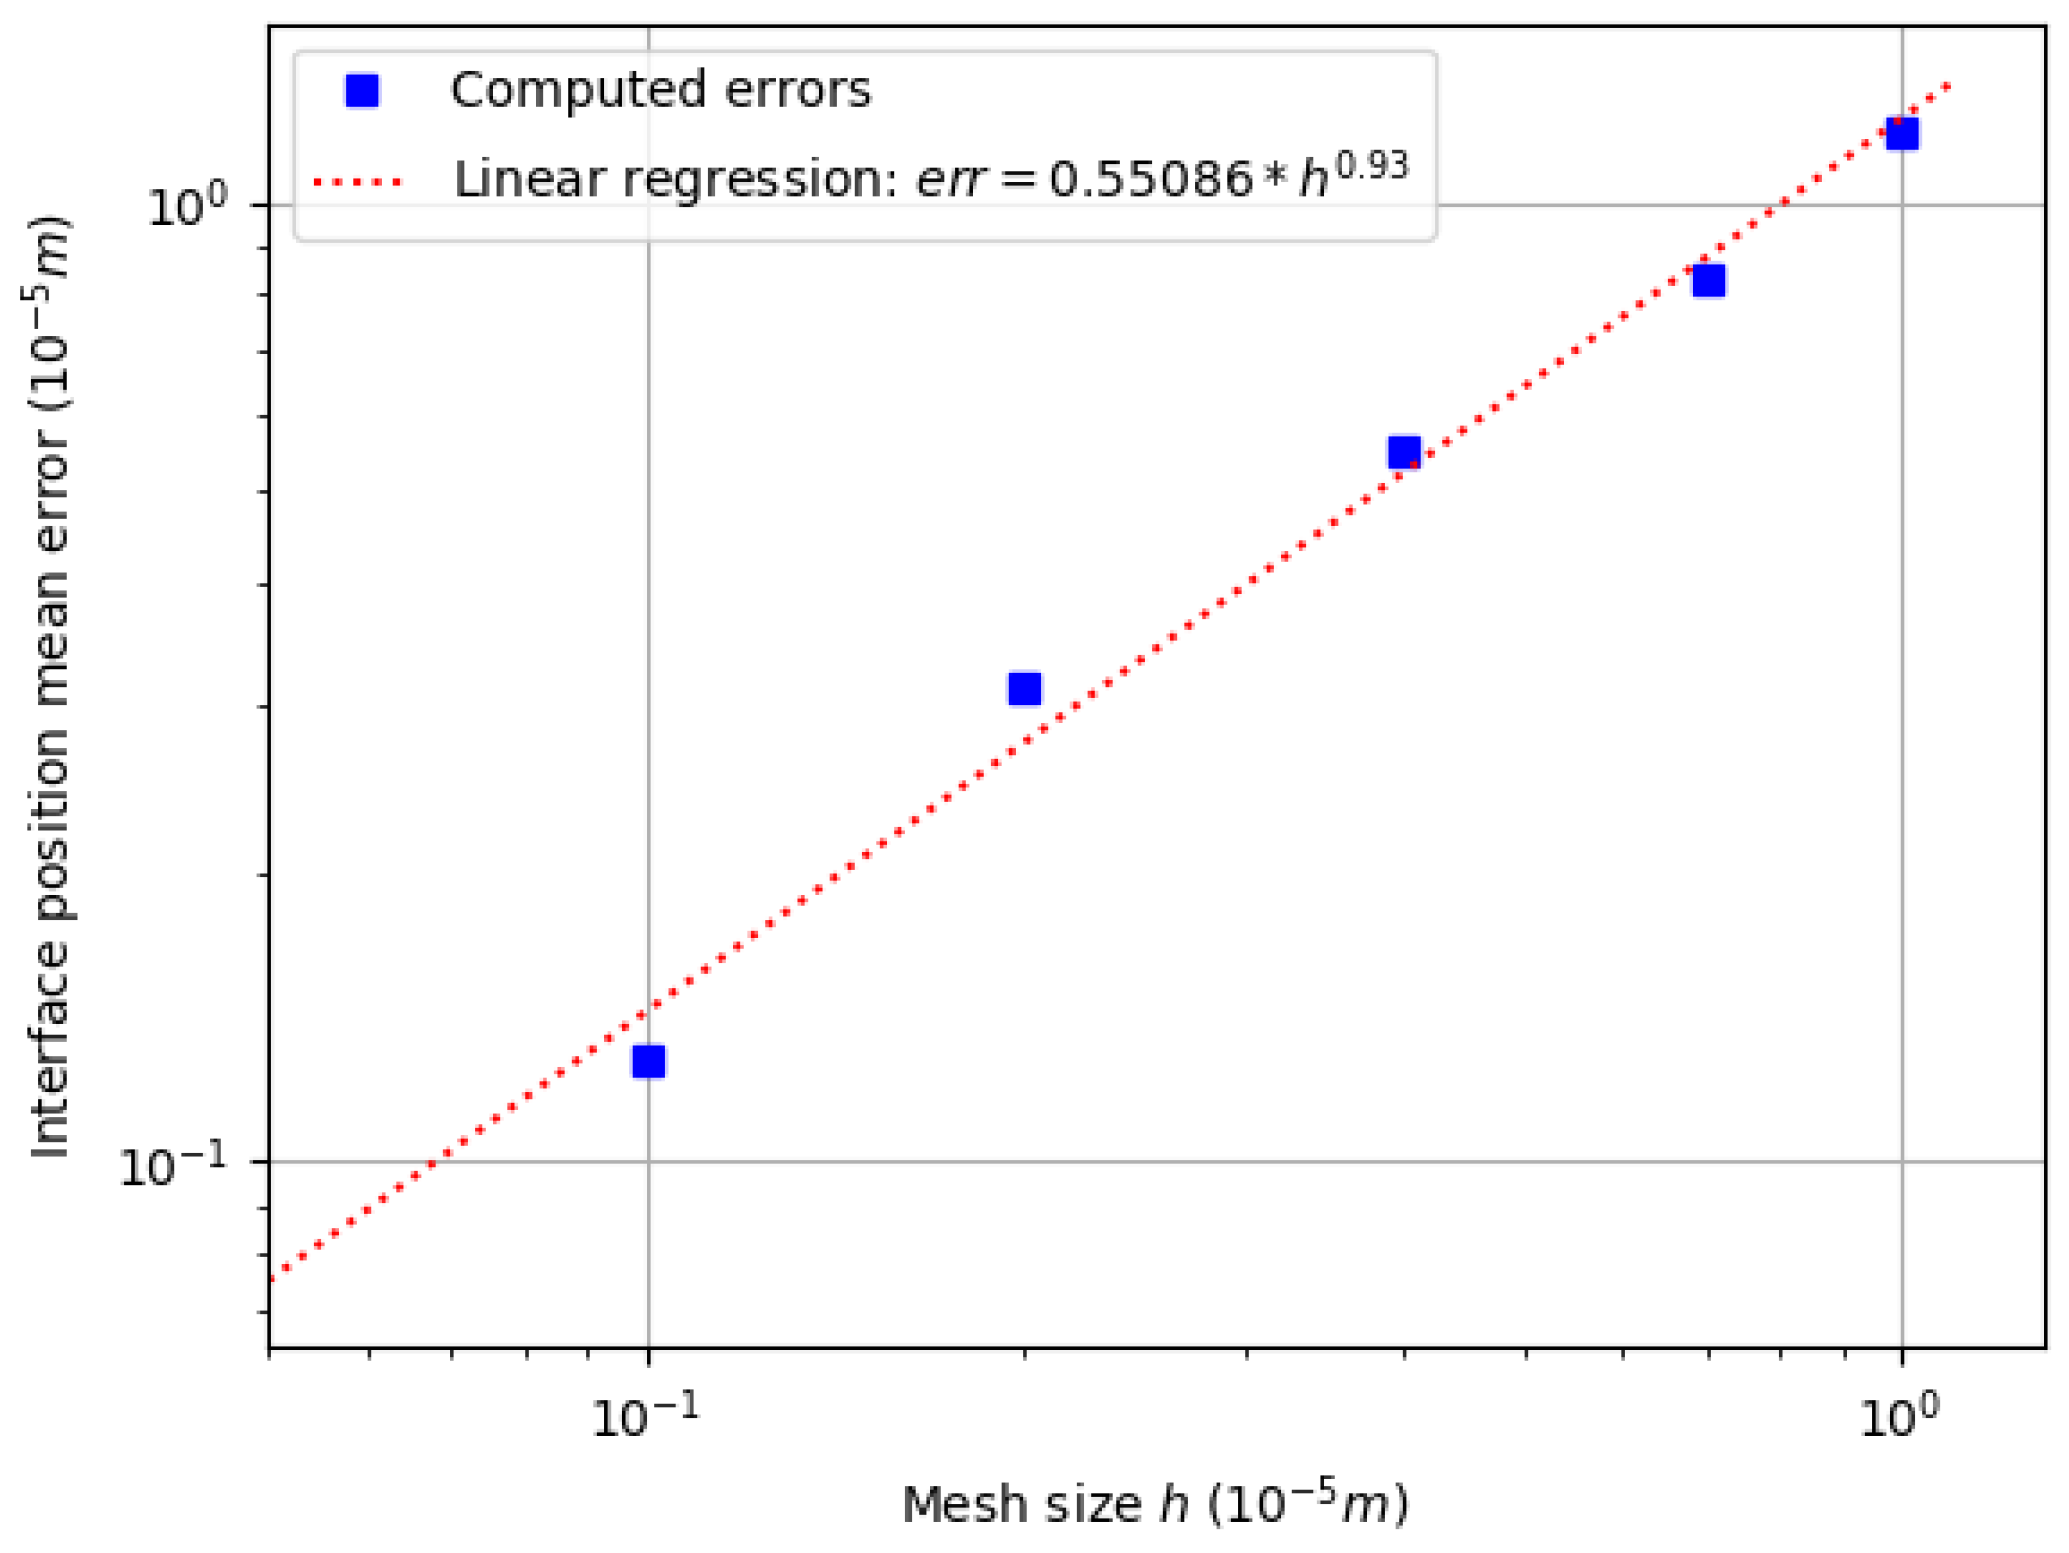
The convergence is considered regarding the error on the interface position, computed with (35) with N = 100 sample points. The convergence is plotted in Figure 32.
The convergence is well observed, with an order 1 that is coherent with the prediction of (16). The computed errors are above the order of magnitude of the one caused by the discretization of the Dirac, explaining why it does not disturb the convergence. This may appear for smaller time steps and mesh sizes.
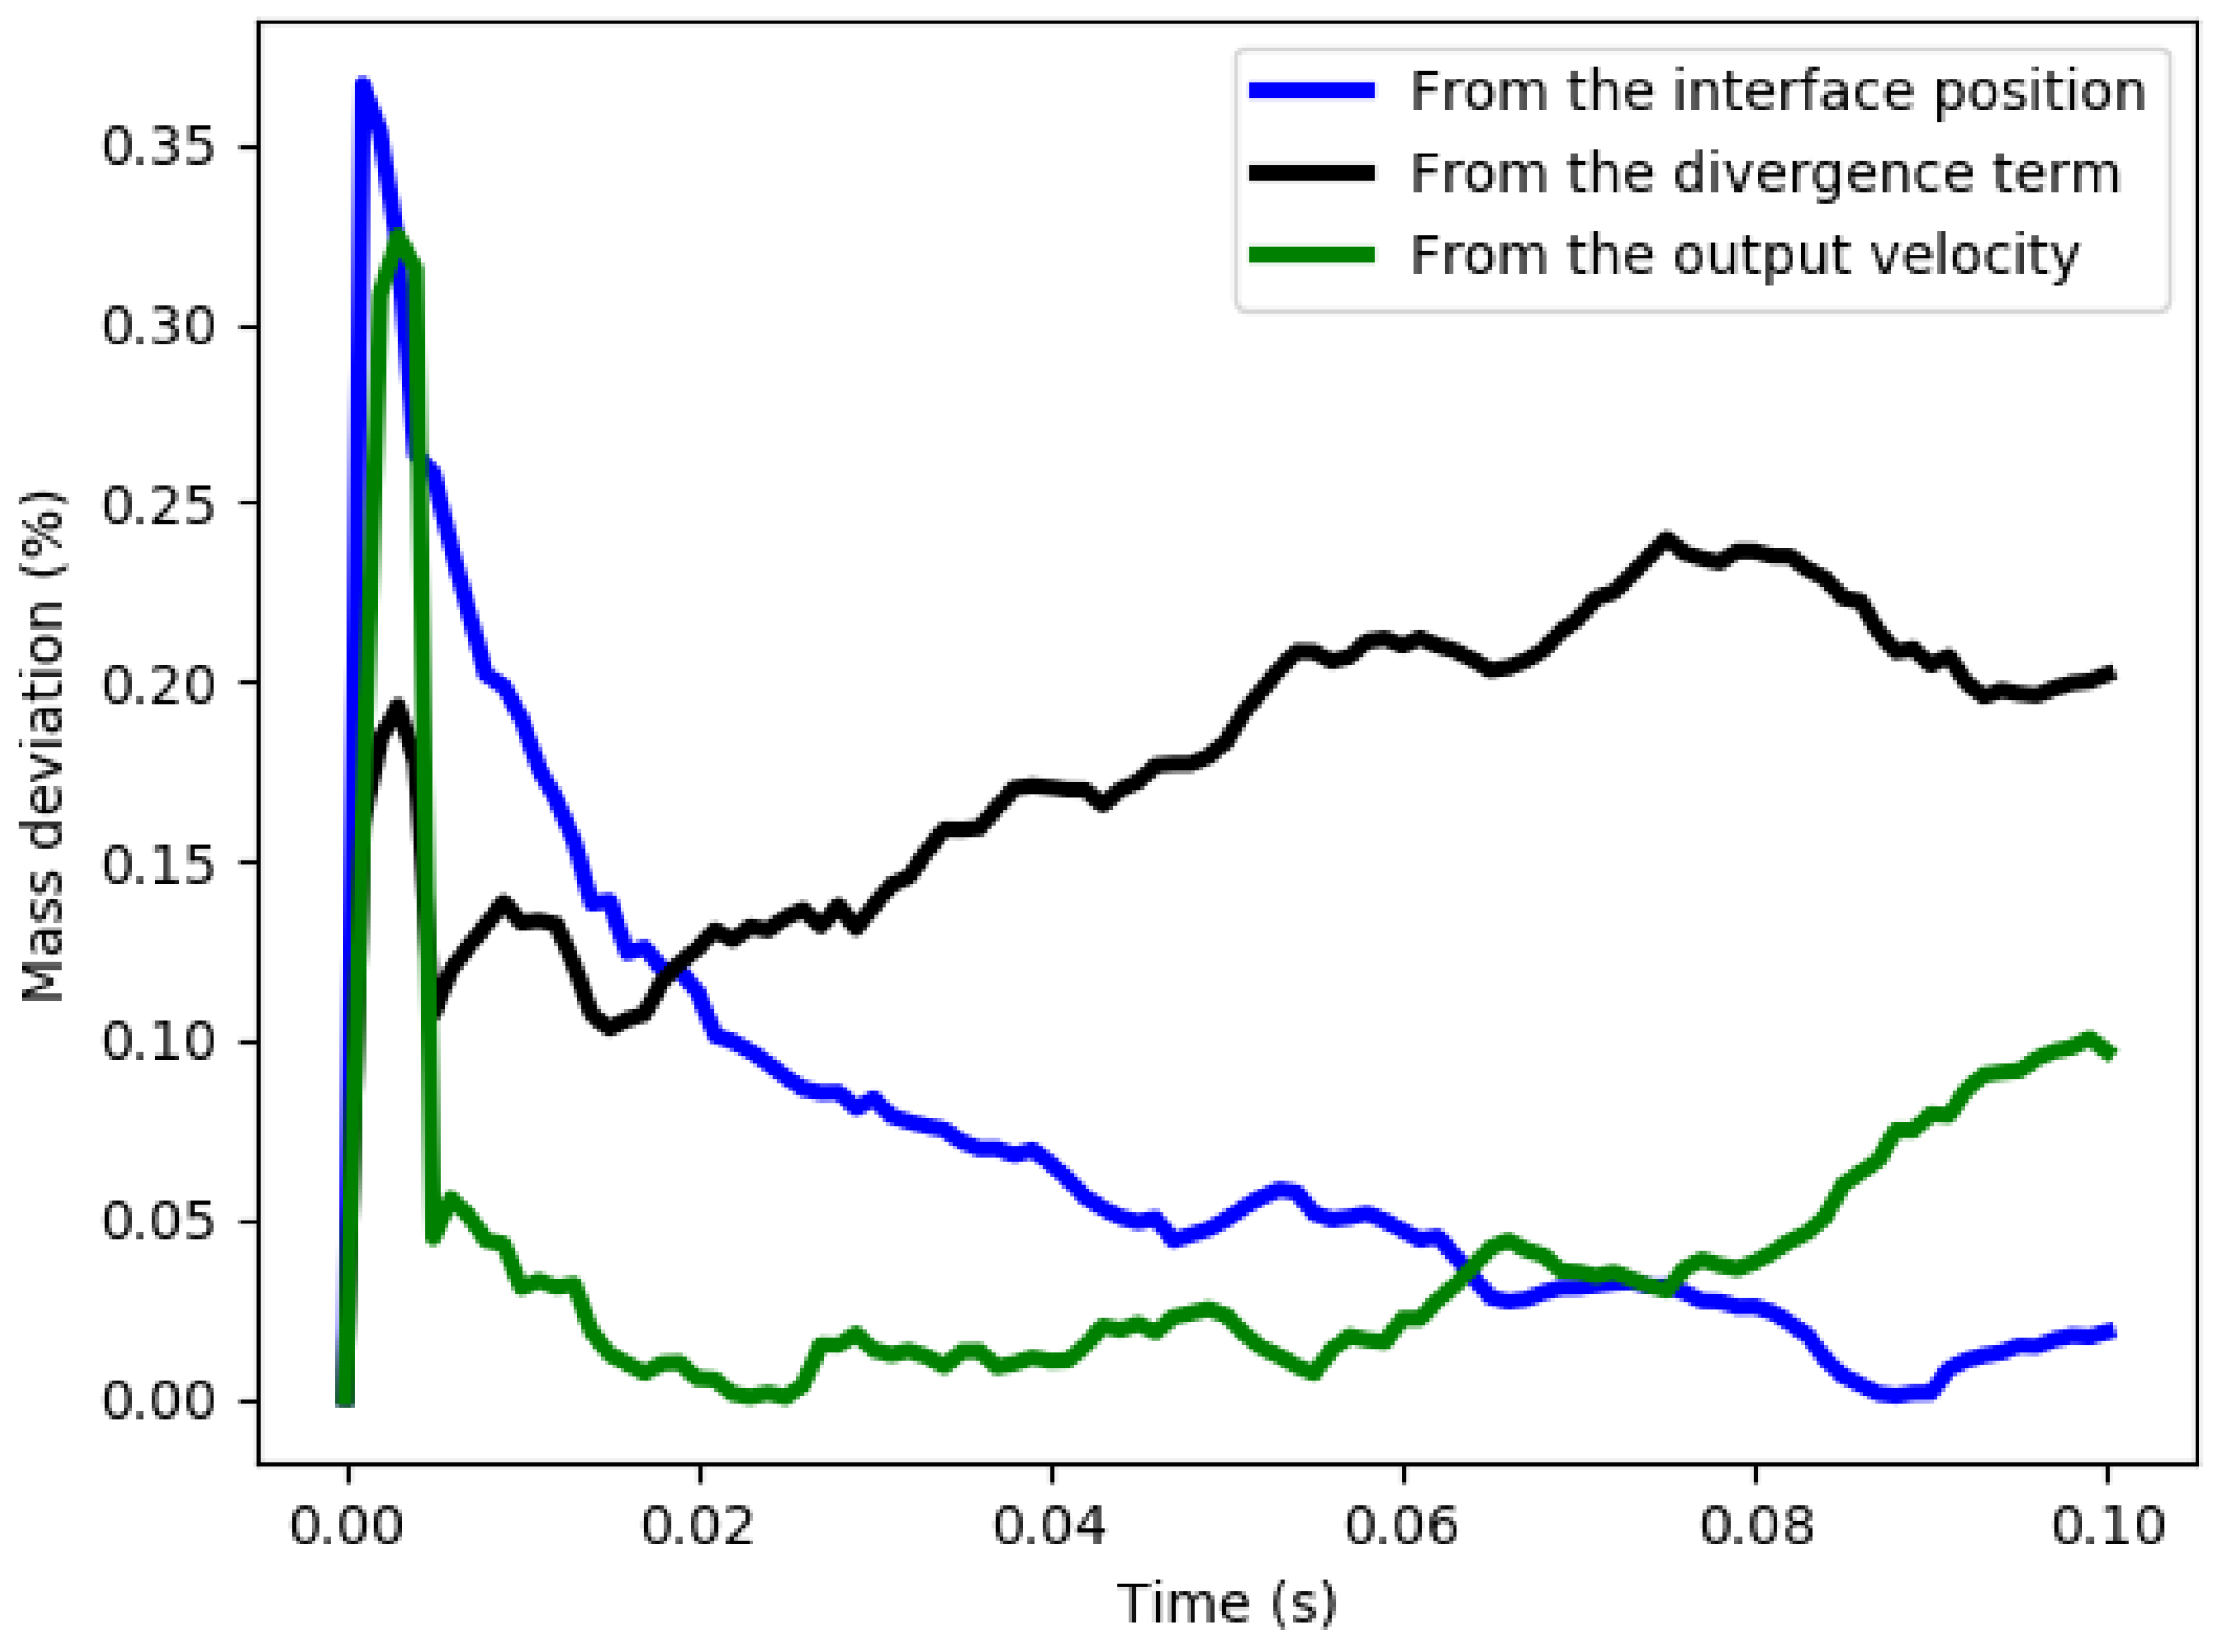
The mass conservation is once again verified. We strictly follow the same approach as in Section 6.5.1. The different mass deviations for the configuration h m i n = 2 × 10 6   m and Δ t = 2 × 10 5   s are plotted in Figure 33. The masses estimated from the outflux and from the velocity divergence are still consistent with the absolute mass, though the error is a little higher but still below 1%.

7.2. A 1D Benchmark—Adiabatic Problem

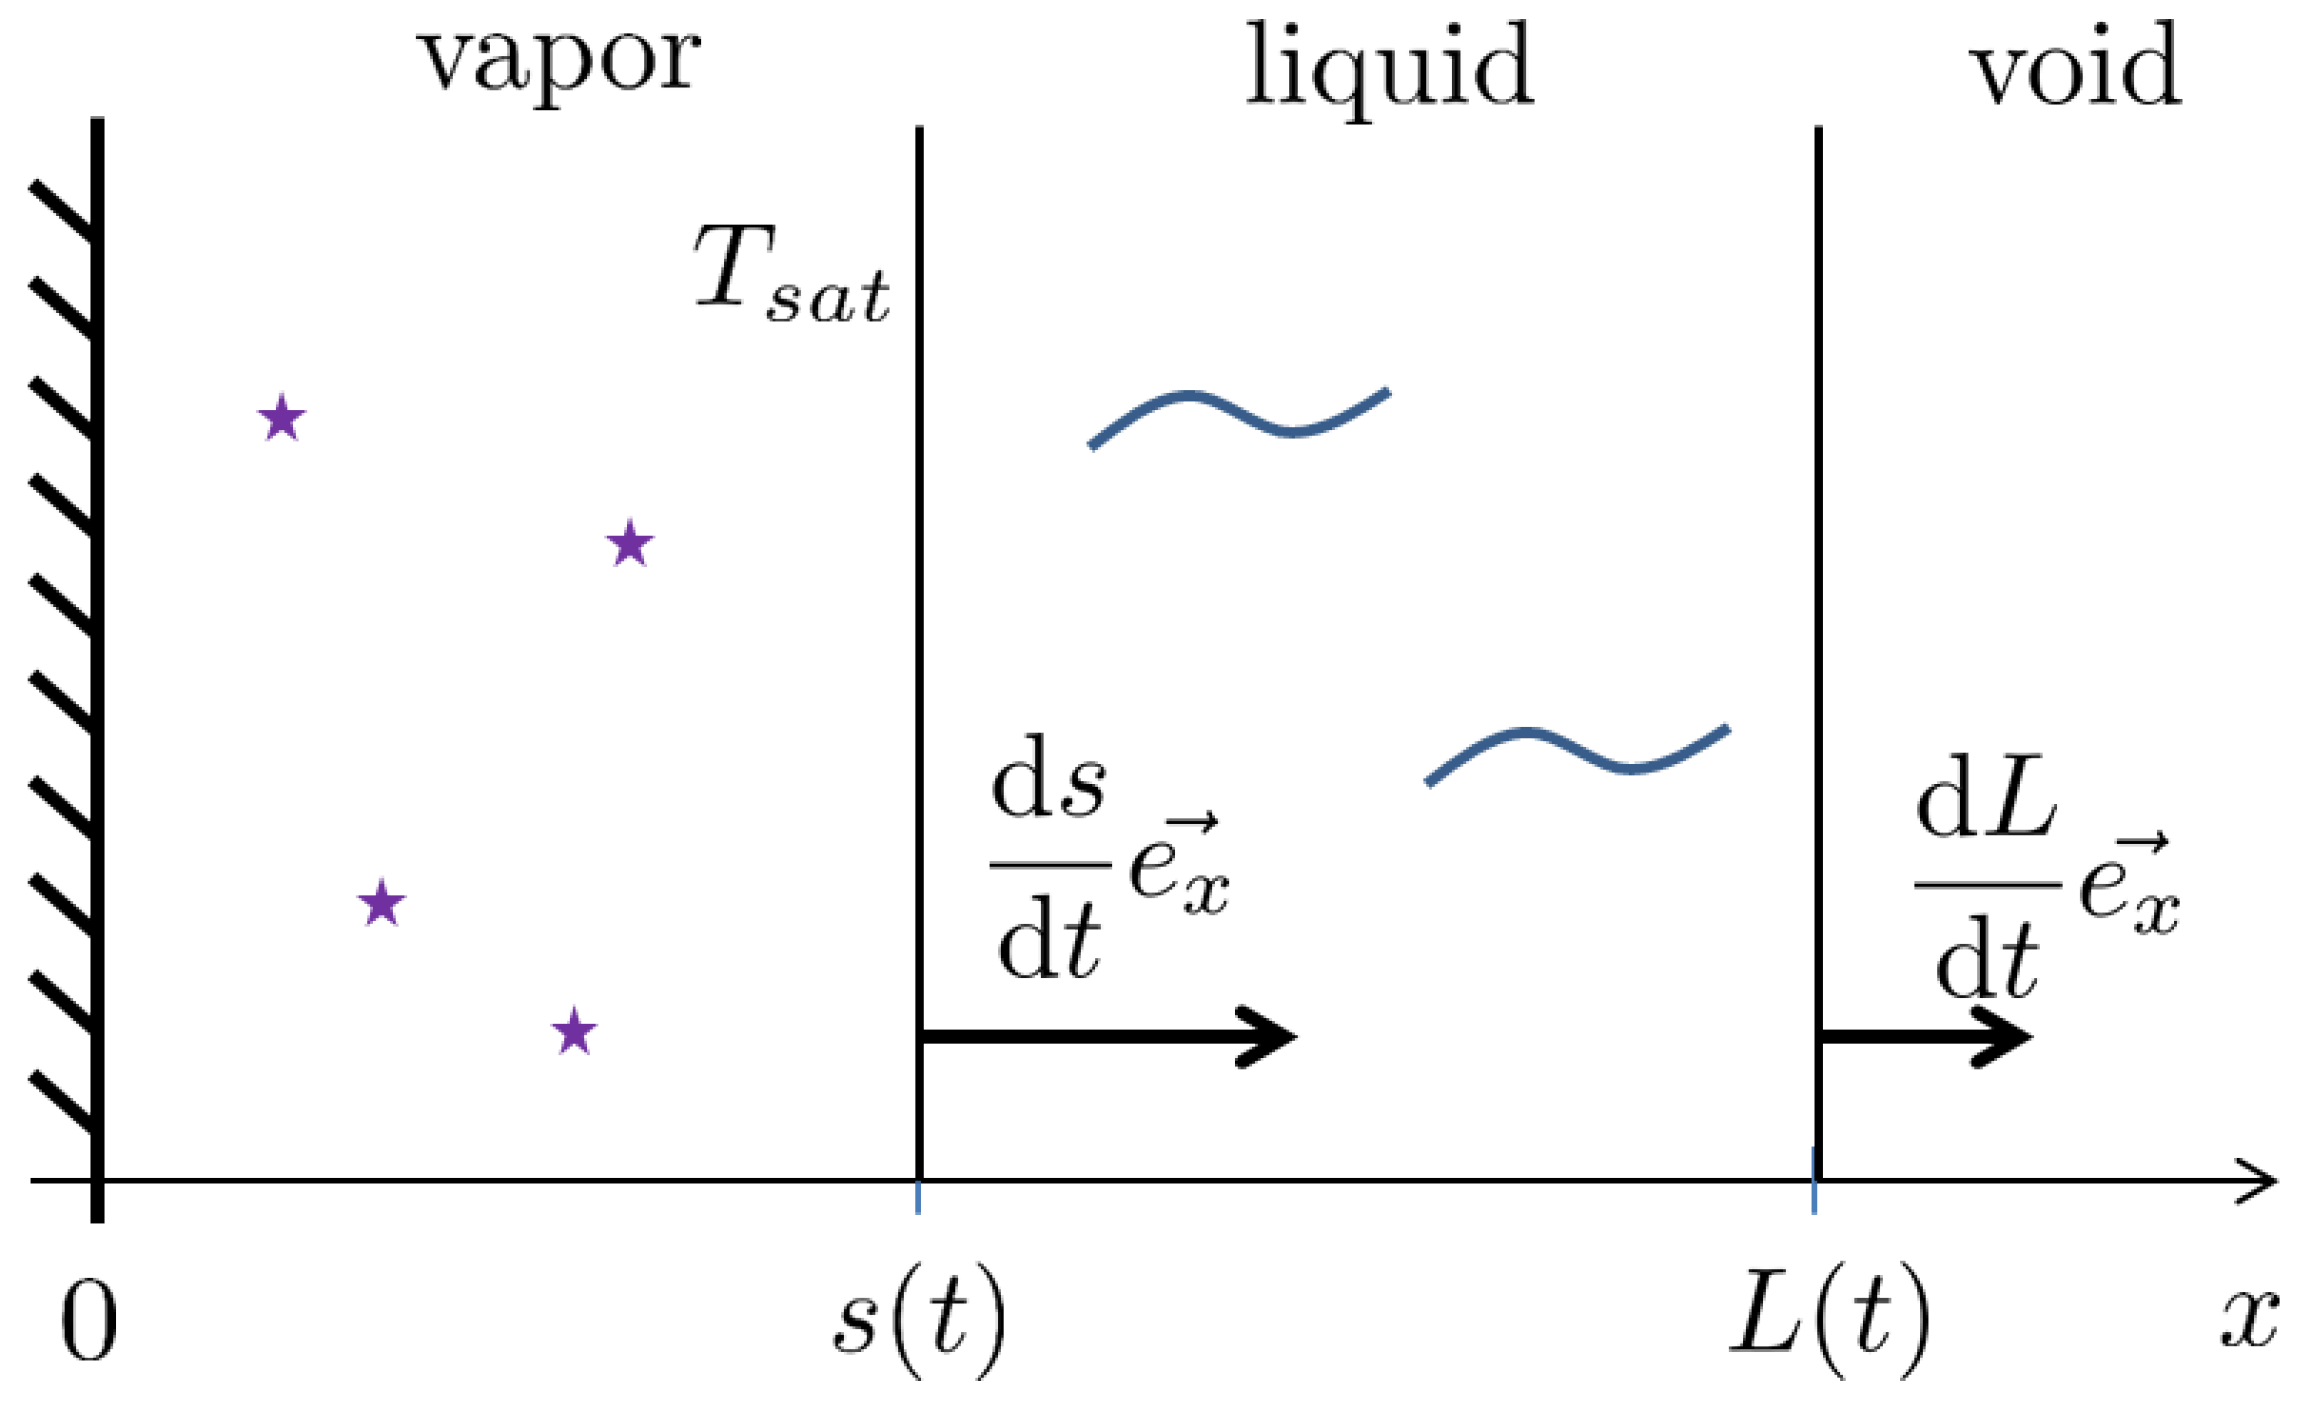
We propose to tackle a complementary study with adiabatic boundary conditions inspired by the work of Santiago et al. [39]. This allows to challenge differently the respect of the energy conservation. It consists of setting an arbitrary temperature field on a domain with both liquid and vapor separated by a planar interface, and to let the system evolve to the steady state – either one of the phase vanishes, or the system temperature tends to T s a t . In our consideration, the vapor is blocked by the wall at x = 0 , and the liquid is allowed to move with an initial right boundary at x = L 0 = L ( t 0 ) , as shown in Figure 34.
If the initial temperature field T ( 0 < x < L , t 0 ) and the initial interface position s 0 = s ( t 0 ) are set so that the steady state is a mixture of liquid and vapor at T s a t , then the available thermal energy E over a section S reads:
E = S ρ V c p V 0 s 0 ( T ( x , t 0 ) T s a t ) d x S ρ L c p L s 0 L 0 ( T s a t T ( x , t 0 ) ) d x
Over the conditions that E is positive, meaning that there is an excess of energy regarding the steady state at T s a t for the same proportion of liquid and vapor, all this energy is transformed to vaporise a portion of liquid:
E = ρ V S L ( s s 0 ) = ρ V S L Δ s
with s = s ( t ) the final interface position.
Thus, for a given initial temperature field that fulfills theses conditions, the final displacement of the liquid vapor interface is:
Δ s = s 0 L 0 ( T s a t T ( x , t 0 ) ) d x ρ V c p V 0 s 0 ( T ( x , t 0 ) T s a t ) d x ρ L c p L s 0 L 0 ( T s a t T ( x , t 0 ) ) d x / ( ρ V L )
This is related to a certain amount of liquid that vaporizes, leading to the liquid interface displacement:
Δ L = 1 ρ V ρ L Δ s
In our study, the initial temperature profile considered reads:
T ( x , t 0 ) = ( T s a t T ω ) x s 0 2 + T ω for x [ 0 , s 0 ] ( T s a t T ) L 0 x L 0 s 0 2 + T for x [ s 0 , L 0 [
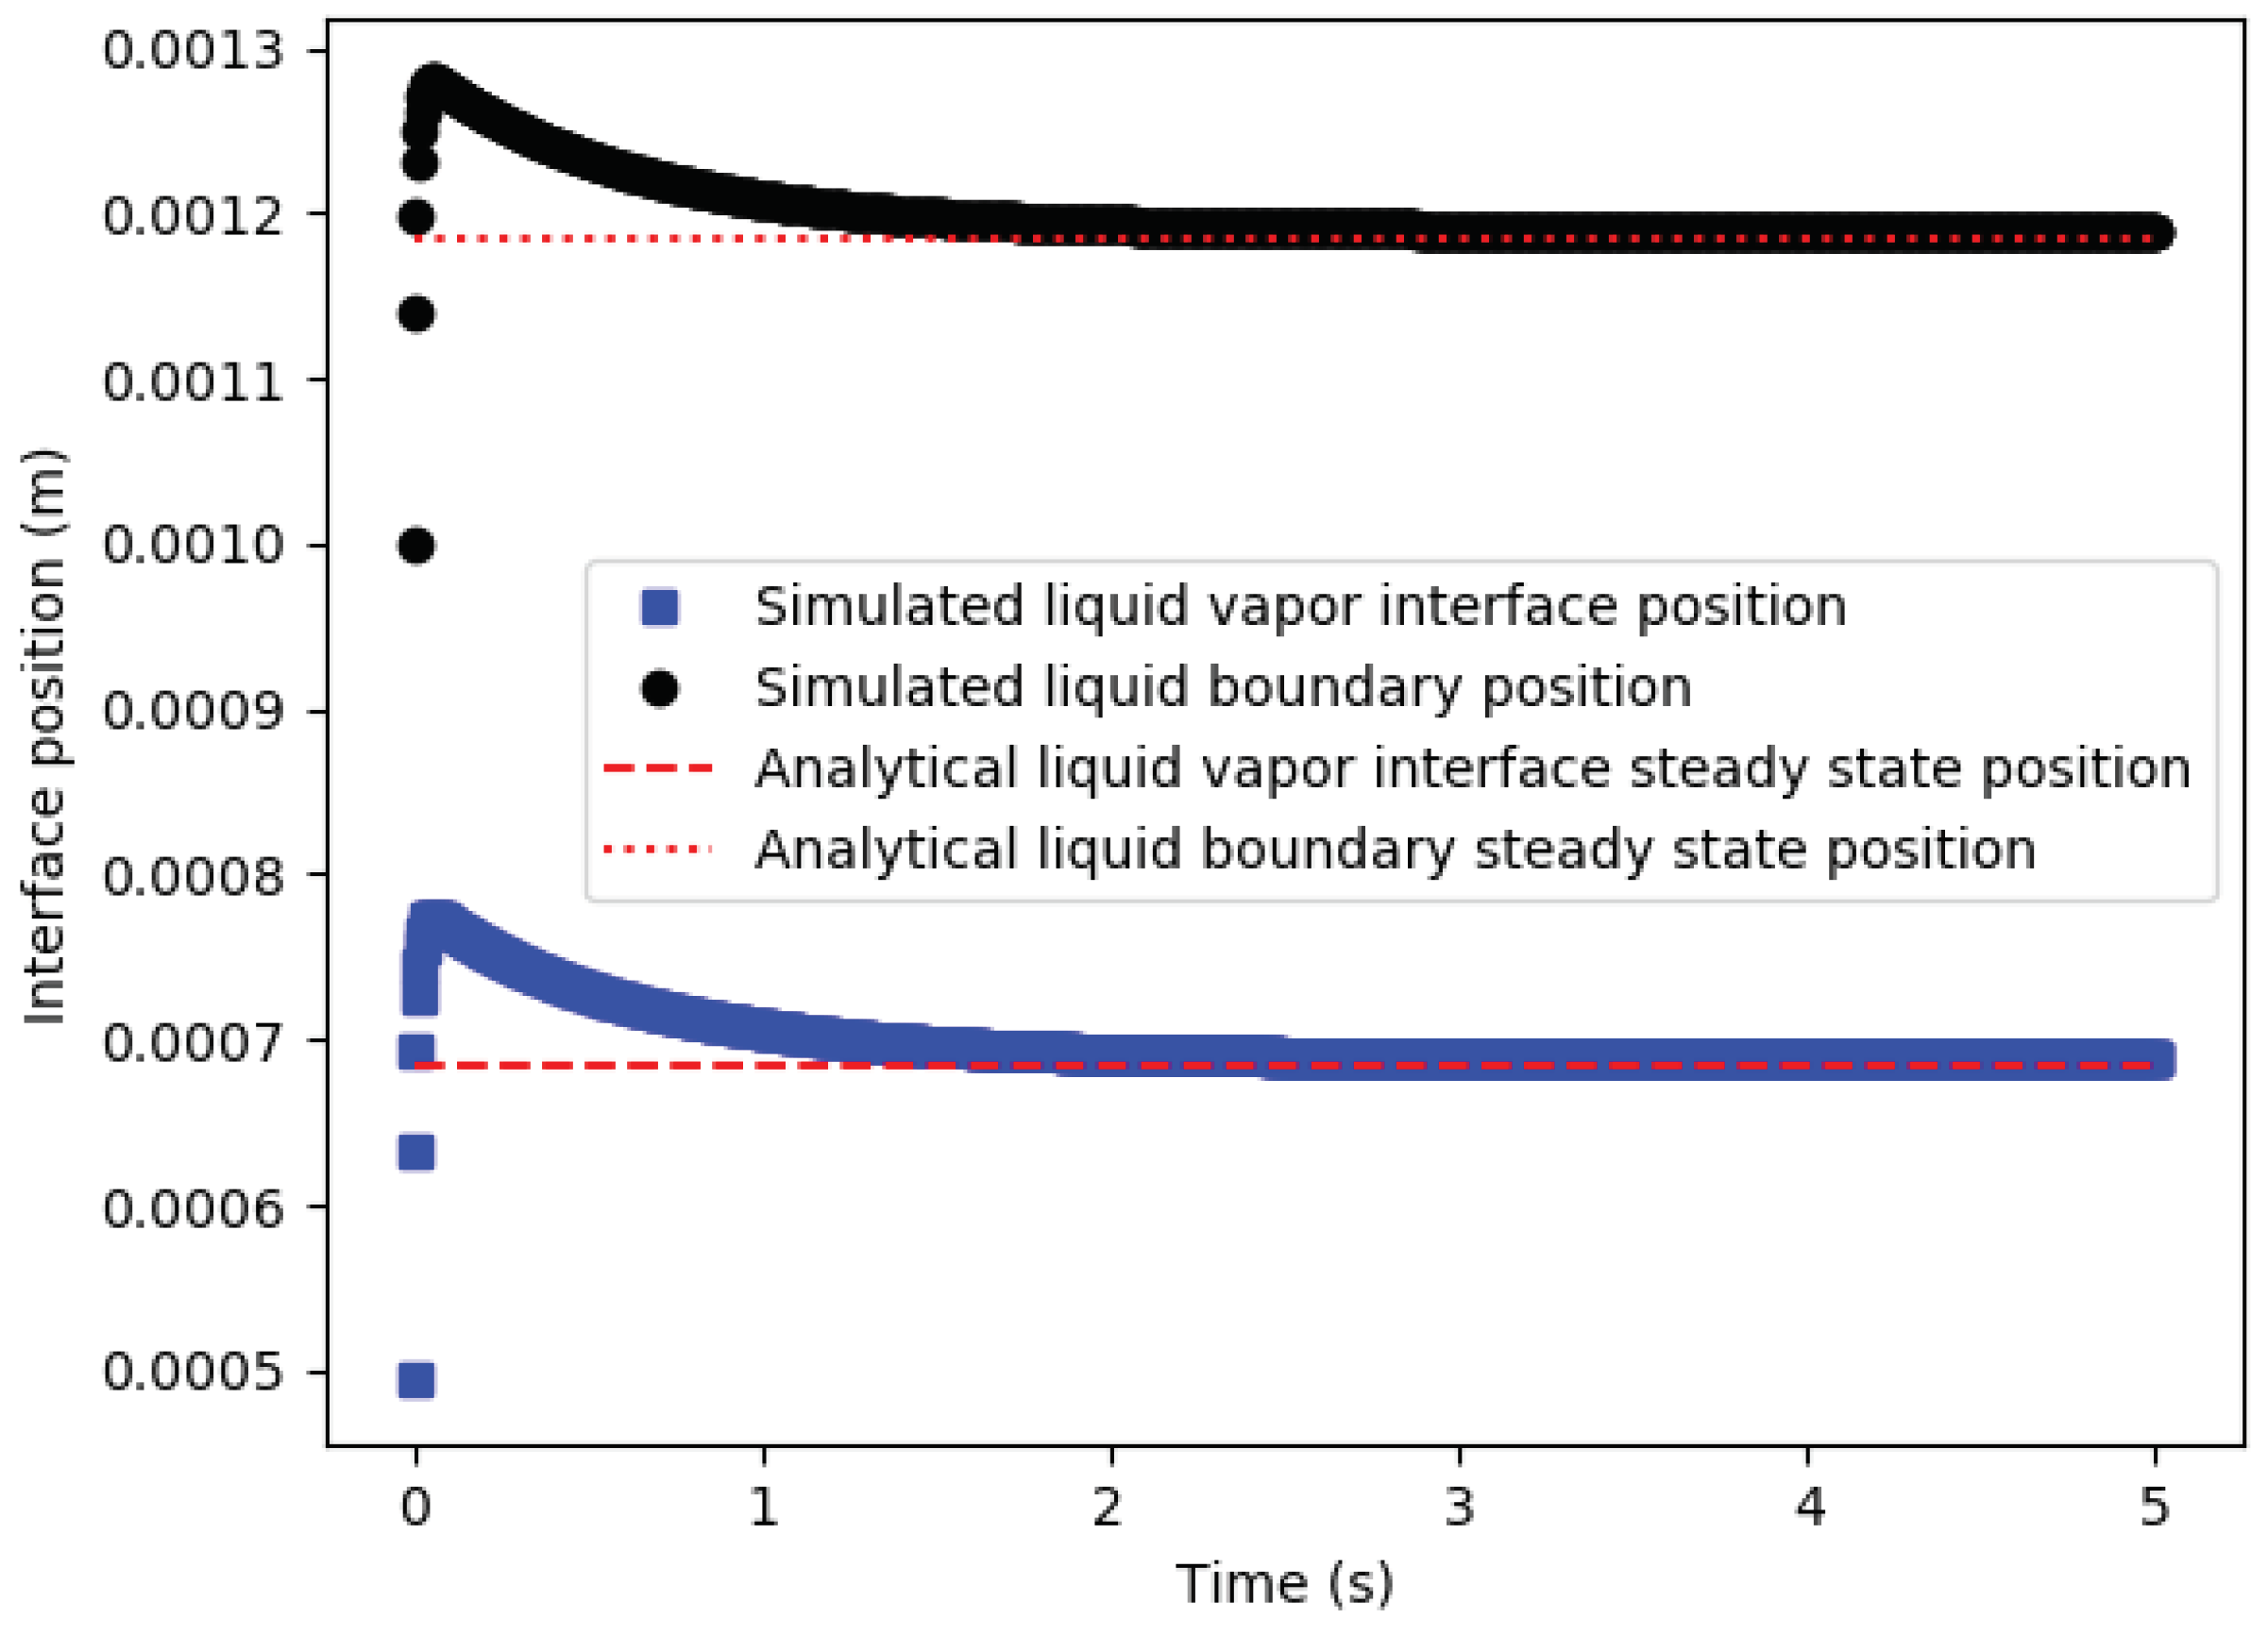
with T ω = 1100 °C and T = 99.9 °C. The liquid vapor interface is set at s 0 = 0.5 mm from the wall, and the liquid boundary is initially at L 0 = 1 mm from the wall. The material properties of liquid and water are taken from Table 4.
The test case is computed for an unstructured non uniform 2D mesh of dimension 2 × 10−4 by 2 × 10 3   m 2 with a maximum of 25.000 elements whose mesh size h m i n at the interface is set to 2 × 10 6   m . The end of the liquid interface is represented by another Level Set to enable its movement. To guaranty adiabatic conditions, the rest of the domain ( x > L ) is set with a reduced conductivity ( 1 × 10 6  W m−1 K−1). This way the temperature gradient is approximately null at the liquid boundary. A time step of 1 × 10 5   s is set. The simulation runs until a time t = 5   s to ensure that it reaches the steady state.
The liquid vapor interface and the liquid boundary position are plotted in Figure 35. First of all, the steady state is consistent with the analytical value. The absolute final error on both interface positions is around 5 × 10 6   m , which is of the order of magnitude of the minimum mesh size, and three orders of magnitude lower than the system lengthscale, proving a proper respect of the energy conservation. It is also interesting to notice that the system vaporises too much before condensing to reach the steady state, which is consistent with the difference of diffusivity between the liquid and the vapor phases. The vapor phase diffusivity being higher, conduction inside the vapor is stronger and the steady state is reached faster. Thus, all the thermal potential energy of vapor is given to the interface before the liquid recovers part of it.

8. Conclusions and Perspectives

In this article, an extension of an existing Finite Element solver based on the Continuous Surface Force approach and adapted to phase change systems has been developed. In comparison to other phase change approaches, it has the advantage of an easy and light numerical implementation. The main conclusions are gathered hereafter:
  • This methods has been tested and validated on several analytic tests and isochoric Stefan Problem without and with subcooling.
  • Then a remeshing algorithm has been added and good results are showed for the combination of these two methods on a stiffer Stefan problem.
  • A Navier–Stokes solver embedding a source term in the mass conservation equation has been developed and coupled with a new formulation of the Level Set convection equation to account for a density change during phase change. This framework has been tested and validated on simple 1D and 2D benchmarks. The discretization of the interface has been shown to be a critical feature to control for a proper behavior of the method.
  • Finally, these two frameworks have been merged to create a complete phase change solver. It has been tested on a compressible Stefan problem. The conclusion is that this solver is valid for stable configurations where no phase is overheated or undercooled.
  • The model is based on several simplifications: the fluids are considered incompressible, only thermal energy variations are prevailing, the interface is in thermal equilibrium, and the viscous dissipation is negligible. This framework is then applicable only in those conditions. Thus, violent thermal shock waves are not modeled, which can be troublesome when dealing with boiling modeling. Furthermore, second order effects due to the compressibility of vapor are not taken into account, and the simulation can under-estimate hydrodynamical effects.
Future works are expected to deal with 3D tests and add a suitable wetting model.

Author Contributions

Conceptualization, C.B. and R.V.; software, C.B. and E.H.; validation, C.B. and L.C.-B.; formal analysis, C.B.; investigation, C.B. and L.C.-B.; writing—original draft preparation, C.B. and L.C.-B.; writing—review and editing, R.V.; supervision, E.H. and R.V.; project administration, E.H.; funding acquisition, E.H. All authors have read and agreed to the published version of the manuscript.

Funding

This research received no external funding.

Data Availability Statement

Not applicable.

Acknowledgments

The author gratefully acknowledges support from the companies involved in the INFINITY industrial ANR chair: Aubert & Duval, Cevifal, CMI Group, Faurecia, Framatome, Industeel CRMC (Arcelor Mittal), Lisi Aerospace, Montupet, Safran, Science Computer and Consultants (SCC) and Transvalor.

Conflicts of Interest

The authors declare no conflict of interest.

Abbreviations

  • The following abbreviations are used in this manuscript:
LSLevel Set
CSFContinuous Surface Force
tTime (s)
u Velocity (m·s−1)
PPressure (Pa)
TTemperature (K)
q Heat flux (W·m−2)
m ˙ Surface mass transfer rate vector (kg·s−1·m−2)
sInterface position (m)
RRadius (m)
MMass (kg)
d M ˙ Local mass transfer rate (kg·s−1)
u I Interface velocity (m·s−1)
d S Infinitesimal surface (m2)
d V Infinitesimal volume (m3)
ρ Density (kg·m−3)
η Dynamic viscosity (Pa·s)
c p Specific heat capacity at constant pressure (J·K−1·kg−1)
kThermal conductivity (W·m−1·K−1)
T s a t Saturation temperature of the fluid at atmospheric pressure (K)
L Specific enthalpy of vaporization at saturation temperature (J·kg−1)
DThermal diffusivity (m2·s−1)
γ 0 Surface tension coefficient (J·m−2)
g Gravity (m·s−2)
ε ˙ Strain rate tensor (s−1)
χ Stefan constant ()
LLiquid
VVapor
ω Wall
Far from the interface
n Normal vector of the liquid-vapor interface
dDistance function
α Level Set function
H α Heaviside function
δ α Dirac function
ε Characteristic length of the smoothed interface
Gradient operator
· Divergence operator
λ Diffusivity of the extension solver

References

  1. Nukiyama, S. The maximum and minimum values of the heat Q from metal to boilng water under atmospheir pressure. J. Jpn. Soc. Mech. Eng. 1934, 37, 367–374. [Google Scholar]
  2. Zuber, N. Hydrodynamic Aspects of Boiling Heat Transfer (Thesis); Technical Report; University of California: Los Angeles, CA, USA, 1959. [Google Scholar] [CrossRef]
  3. Berenson, P.J. Transition Boiling Heat Transfer from a Horizontal Surface; Technical Report 17; The National Science Foundation: Cambridge, MA, USA, 1960. [Google Scholar]
  4. Chen, J.C. Correlation for Boiling Heat Transfer to Saturated Fluids in Convective Flow. Industrial & Engineering Chemistry Process Design and Development 1966, 5, 322–329. [Google Scholar] [CrossRef]
  5. Judd, R.L.; Hwang, K.S. A Comprehensive Model for Nucleate Pool Boiling Heat Transfer Including Microlayer Evaporation. J. Heat Transfer 1976, 98, 623–629. [Google Scholar] [CrossRef]
  6. Cooper, M. Saturation Nucleate Pool Boiling—A Simple Correlation. In First U.K. National Conference on Heat Transfer; Elsevier: Amsterdam, The Netherlands, 1984; pp. 785–793. [Google Scholar] [CrossRef]
  7. Ramilison, J.M.; Lienhard, J.H. Transition Boiling Heat Transfer and the Film Transition Regime. J. Heat Transfer 1987, 109, 746–752. [Google Scholar] [CrossRef]
  8. Steiner, H.; Kobor, A.; Gebhard, L. A wall heat transfer model for subcooled boiling flow. Int. J. Heat Mass Transfer 2005, 48, 4161–4173. [Google Scholar] [CrossRef]
  9. Meduri, P.K.; Warrier, G.R.; Dhir, V.K. Wall heat flux partitioning during subcooled forced flow film boiling of water on a vertical surface. Int. J. Heat Mass Transfer 2009, 52, 3534–3546. [Google Scholar] [CrossRef]
  10. Brennen, C.E. Fundamentals of Multiphase Flow, reprint ed.; Cambridge University Press: Cambridge, UK, 2006. [Google Scholar]
  11. Lee, W.H. A Pressure Iteration Scheme for Two-Phase Flow Modeling. In Computational Methods for Two-Phase Flow and Particle Transport; World Scientific: Singapore, 1980; pp. 61–82. [Google Scholar] [CrossRef]
  12. Rattner, A.S.; Garimella, S. Simple Mechanistically Consistent Formulation for Volume-of-Fluid Based Computations of Condensing Flows. J. Heat Transfer 2014, 136, 071501. [Google Scholar] [CrossRef]
  13. Giustini, G.; Issa, R.I. A method for simulating interfacial mass transfer on arbitrary meshes. Phys. Fluids 2021, 33, 087102. [Google Scholar] [CrossRef]
  14. Son, G.; Dhir, V.K. Numerical Simulation of Film Boiling Near Critical Pressures With a Level Set Method. J. Heat Transfer 1998, 120, 183–192. [Google Scholar] [CrossRef]
  15. Juric, D. Computations of Boiling Flows. Int. J. Multiph. Flow 1998, 24, 387–410. [Google Scholar] [CrossRef]
  16. Welch, S.W.; Wilson, J. A Volume of Fluid Based Method for Fluid Flows with Phase Change. J. Comput. Phys. 2000, 160, 662–682. [Google Scholar] [CrossRef]
  17. Kang, M.; Fedkiw, R.P.; Liu, X.D. A Boundary Condition Capturing Method for Multiphase Incompressible Flow. J. Sci. Comput. 2000, 15, 323–360. [Google Scholar] [CrossRef]
  18. Tanguy, S.; Ménard, T.; Berlemont, A. A Level Set Method for vaporizing two-phase flows. J. Comput. Phys. 2007, 221, 837–853. [Google Scholar] [CrossRef]
  19. Gibou, F.; Chen, L.; Nguyen, D.; Banerjee, S. A level set based sharp interface method for the multiphase incompressible Navier–Stokes equations with phase change. J. Comput. Phys. 2007, 222, 536–555. [Google Scholar] [CrossRef]
  20. Esmaeeli, A.; Tryggvason, G. Computations of film boiling. Part I: Numerical method. Int. J. Heat Mass Transf. 2004, 47, 5451–5461. [Google Scholar] [CrossRef]
  21. Sato, Y.; Ničeno, B. A sharp-interface phase change model for a mass-conservative interface tracking method. J. Comput. Phys. 2013, 249, 127–161. [Google Scholar] [CrossRef]
  22. Khalloufi, M.; Valette, R.; Hachem, E. Adaptive Eulerian framework for boiling and evaporation. J. Comput. Phys. 2020, 401, 109030. [Google Scholar] [CrossRef]
  23. Kumar Singh, N.; Premachandran, B. A coupled level set and volume of fluid method on unstructured grids for the direct numerical simulations of two-phase flows including phase change. Int. J. Heat Mass Transfer 2018, 122, 182–203. [Google Scholar] [CrossRef]
  24. Hachem, E.; Rivaux, B.; Kloczko, T.; Digonnet, H.; Coupez, T. Stabilized finite element method for incompressible flows with high Reynolds number. J. Comput. Phys. 2010, 229, 8643–8665. [Google Scholar] [CrossRef]
  25. Unverdi, S.O.; Tryggvason, G. A Front-Tracking Method for Viscous, Incompressible, Multi-fluid Flows. J. Comput. Phys. 1992, 100, 25–37. [Google Scholar] [CrossRef]
  26. Sussman, M.; Smereka, P.; Osher, S. A Level Set Approach for Computing Solutions to Incompressible Two-Phase Flows. J. Comput. Phys. 1994, 114, 146–159. [Google Scholar] [CrossRef]
  27. Osher, S.; Fedkiw, R. Level Set Methods and Dynamic Implicit Surfaces; Applied Mathematical Sciences; Springer: Berlin/Heidelberg, Germany, 2004; Volume 153. [Google Scholar]
  28. Feng, Q.; Johannsen, K. Experimental results of maximum transition boiling temperature during upflow in a circular tube at medium pressure. Exp. Therm. Fluid Sci. 1991, 4, 90–102. [Google Scholar] [CrossRef]
  29. Ebrahim, S.A.; Chang, S.; Cheung, F.B.; Bajorek, S.M. Parametric investigation of film boiling heat transfer on the quenching of vertical rods in water pool. Appl. Therm. Eng. 2018, 140, 139–146. [Google Scholar] [CrossRef]
  30. Liscic, B.; Tensi, H.M.; Luty, W. Theory and Technology of Quenching; Springer: Berlin/Heidelberg, Germany, 1992. [Google Scholar]
  31. Kim, J.; Benton, J.F.; Wisniewski, D. Pool boiling heat transfer on small heaters: Effect of gravity and subcooling. Int. J. Heat Mass Transfer 2002, 45, 3919–3932. [Google Scholar] [CrossRef]
  32. Ikkene, R.; Koudil, Z.; Mouzali, M. Pouvoir de refroidissement des solutions de trempe à base de polymères hydrosolubles. Comptes Rendus Chim. 2008, 11, 297–306. [Google Scholar] [CrossRef]
  33. Kopun, R.; Škerget, L.; Hriberšek, M.; Zhang, D.; Stauder, B.; Greif, D. Numerical simulation of immersion quenching process for cast aluminium part at different pool temperatures. Appl. Therm. Eng. 2014, 65, 74–84. [Google Scholar] [CrossRef]
  34. Hachem, E.; Feghali, S.; Codina, R.; Coupez, T. Immersed stress method for fluid–structure interaction using anisotropic mesh adaptation: A monolithic approach to fluid–structure interaction. Int. J. Numer. Meth. Engng 2013, 94, 805–825. [Google Scholar] [CrossRef]
  35. Aslam, T.D. A partial differential equation approach to multidimensional extrapolation. J. Comput. Phys. 2004, 193, 349–355. [Google Scholar] [CrossRef]
  36. Patankar, S.V. Numerical Heat Transfer and Fluid Flow; Series in Computational Methods in Mechanics and Thermal Sciences; Hemisphere Publ. Co.: New York, NY, USA, 1980. [Google Scholar]
  37. Hachem, E. Stabilized Finite Element Method for Heat Transfer and Turbulent Flows Inside Industrial Furnaces. Ph.D. Thesis, Ecole Nationale Supérieure des Mines de Paris, Paris, France, 2009. [Google Scholar]
  38. Hachem, E.; Kloczko, T.; Digonnet, H.; Coupez, T. Stabilized finite element solution to handle complex heat and fluid flows in industrial furnaces using the immersed volume method. Int. J. Numer. Meth. Fluids 2012, 68, 99–121. [Google Scholar] [CrossRef]
  39. Santiago, R.D.; Hernández, E.M.; Otero, J.A. Constant mass model for the liquid–solid phase transition on a one-dimensional Stefan problem: Transient and steady state regimes. Int. J. Therm. Sci. 2017, 118, 40–52. [Google Scholar] [CrossRef]
  40. Chaurasiya, V.; Singh, J. An analytical study of coupled convective heat and mass transfer with volumetric heating describing sublimation of a porous body under most sensitive temperature inputs: Application of freeze-drying. Int. J. Heat Mass Transf. 2023, 214, 124294. [Google Scholar] [CrossRef]
  41. Chaurasiya, V.; Singh, J. Numerical investigation of a non-linear moving boundary problem describing solidification of a phase change material with temperature dependent thermal conductivity and convection. J. Therm. Stress. 2023, 46, 799–822. [Google Scholar] [CrossRef]
  42. Chaurasiya, V.; Jain, A.; Singh, J. Numerical Study of a Non-Linear Porous Sublimation Problem With Temperature-Dependent Thermal Conductivity and Concentration-Dependent Mass Diffusivity. ASME J. Heat Mass Transf. 2023, 145, 072701. [Google Scholar] [CrossRef]
  43. Chaurasiya, V.; Upadhyay, S.; Rai, K.; Singh, J. A temperature-dependent numerical study of a moving boundary problem with variable thermal conductivity and convection. Waves Random Complex Media 2023, 1–25. [Google Scholar] [CrossRef]
  44. Kim, D.G.; Jeon, C.H.; Park, I.S. Comparison of numerical phase-change models through Stefan vaporizing problem. Int. Commun. Heat Mass 2017, 87, 228–236. [Google Scholar] [CrossRef]
  45. Denis, R. Modélisation et Simulation de l’effet Leidenfrost dans les Micro-Gouttes. Ph.D. Thesis, Université de Grenoble, Grenoble, France, 2014. [Google Scholar]
  46. Ramezanzadeh, H.; Ramiar, A.; Yousefifard, M. Numerical investigation into coolant liquid velocity effect on forced convection quenching process. Appl. Therm. Eng. 2017, 122, 253–267. [Google Scholar] [CrossRef]
  47. Khalloufi, M.; Mesri, Y.; Valette, R.; Massoni, E.; Hachem, E. High fidelity anisotropic adaptive variational multiscale method for multiphase flows with surface tension. Comput. Methods Appl. Mech. Eng. 2016, 307, 44–67. [Google Scholar] [CrossRef]
  48. Shakoor, M.; Scholtes, B.; Bouchard, P.O.; Bernacki, M. An efficient and parallel level set reinitialization method—Application to micromechanics and microstructural evolutions. Appl. Math. Model. 2014, 39, 7291–7302. [Google Scholar] [CrossRef]
  49. Denner, F.; van Wachem, B.G. Numerical time-step restrictions as a result of capillary waves. J. Comput. Phys. 2015, 285, 24–40. [Google Scholar] [CrossRef]
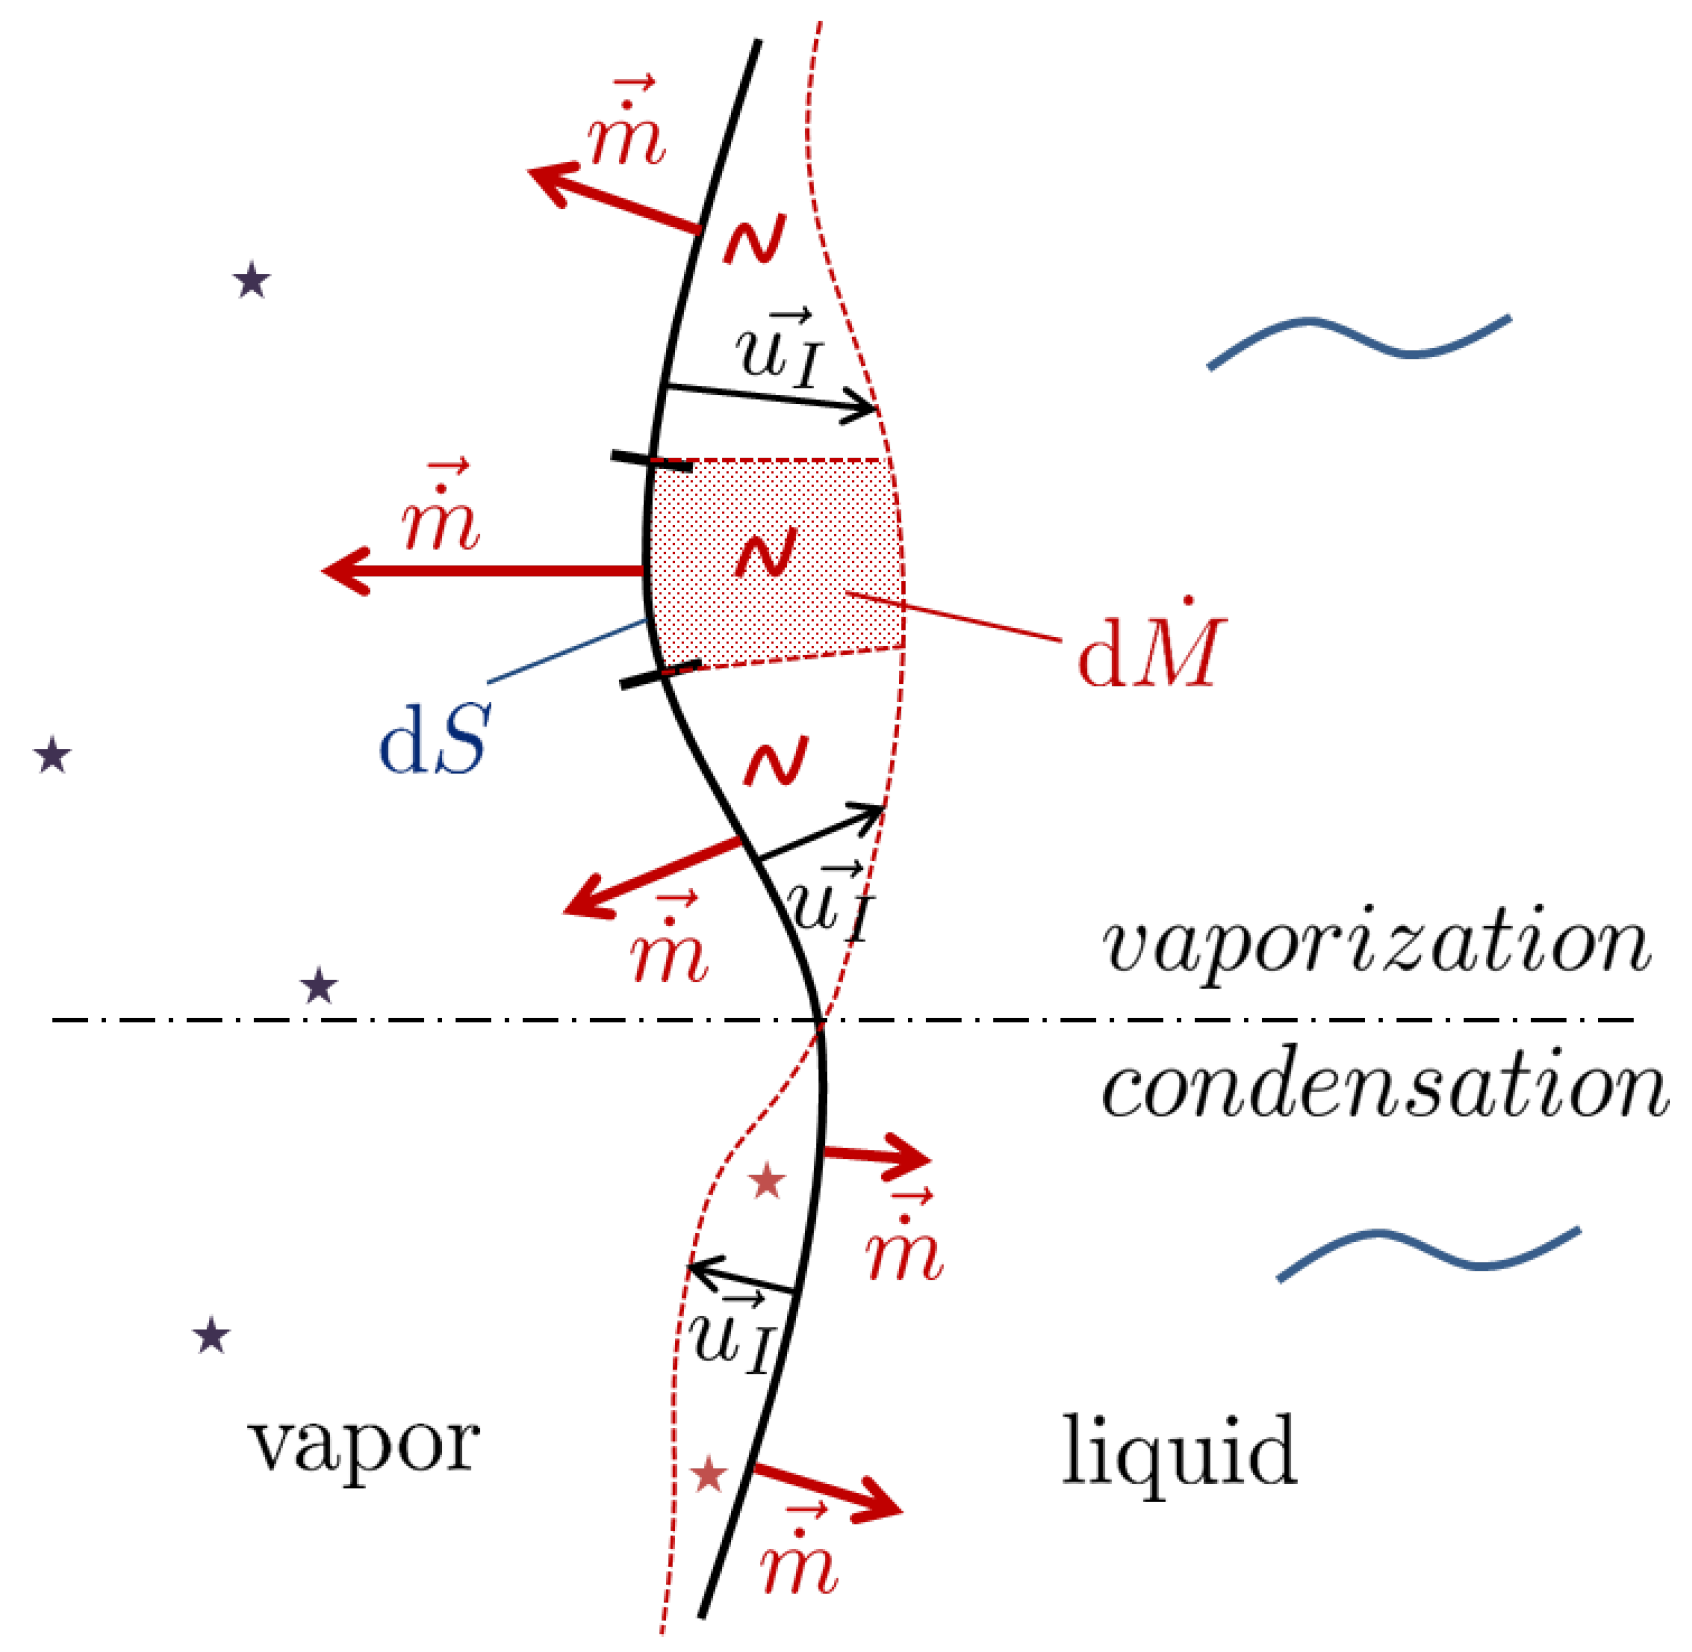
Figure 1. Schematic description of the mass transfer rate vector m ˙ . The red dashed line corresponds to the interface position after a time d t . On the upper part, the liquid vaporizes and m ˙ points towards the vapor phase. On the lower part, the vapor condensates and m ˙ points towards the liquid phase.
Fluids 08 00233 g001
Figure 2. Modeling of the interface temperature profile adapted to a Continuous Surface Force approach. The temperature is fixed at T s a t on the entire layer of thickness 2 ε to create a well defined heat flux jump. The mass transfer is spread out on the layer with a δ α profile. (a) Sharp interface configuration; (b) Smooth interface configuration.
Fluids 08 00233 g002
Figure 3. The disc test case: an initial radial scalar field is extended on a disc (the red zone) following the radial vector field (the black arrows). (a) Schematic description of the disc test case. (b) Source and extended field values on the radial axis y = 0 .
Fluids 08 00233 g003
Figure 4. Modeling of the interface temperature and heat flux profiles with a Continuous Surface Force approach. In order to well capture the heat flux jump, heat flux values are extended from a distance ε + h of the interface center. The end of the extension domain is located at a distance ε + 3 h of the interface center to reduce diffusion impacts on the extended value. (a) Sharp interface configuration. (b) Smooth interface configuration.
Fluids 08 00233 g004
Figure 5. The interface test case—an initial radial scalar field is extended from both sides of a thick interface (the red zone) following the normal vector field (the black arrows). Results projected on the horizontal and vertical green dotted line are shown in (b,c). (a) Schematic description of the Interface Case. (b) Source and extended field values on the horizontal axis y = 0.25 . (c) Theoretical and extended field values on the centered vertical axis x = 0 .
Fluids 08 00233 g005aFluids 08 00233 g005b
Figure 6. Description of the “safety margin” taken for the extension of the heat flux that avoids errors due to the continuity of the temperature gradient. Heat flux values are taken from points away of at least ε + h from the interface. As the mesh in not structured, the effective distance varies from one point to another up to ε + 2 h . (a) Graphical illustration of the safety margin. (b) Schematic description of the selection of reference points of the extension method.
Fluids 08 00233 g006
Figure 7. Temperature field and mesh of the Case 3 simulation for h = 2 × 10 6   m at time 0.1 s. The mesh is refined around the interface where temperature gradients and physical properties variations are important. Only the left side of the computational domain is plotted.
Fluids 08 00233 g007
Figure 8. Schematic description of the Stefan problem test case.
Fluids 08 00233 g008
Figure 9. Analytic and simulated positions of the interface for different mesh sizes h. (a) Case 1. (b) Case 2. (c) Case 3.
Fluids 08 00233 g009
Figure 10. Analytic and simulated mass transfer rates for different mesh sizes h. (a) Case 1. (b) Case 2. (c) Case 3.
Fluids 08 00233 g010aFluids 08 00233 g010b
Figure 11. Relative error of the initial mass transfer rate value versus interface mesh size. Estimations of this error given by Equation (16) are plotted in dashed lines.
Fluids 08 00233 g011
Figure 12. Space-time convergence analysis for the isochoric Stefan Benchmark. (a) Case 1. (b) Case 2. (c) Case 3.
Fluids 08 00233 g012
Figure 13. Dirichlet velocity boundary conditions for the Square Benchmark. The other velocity components are set with homogeneous Neumann boundary conditions.
Fluids 08 00233 g013
Figure 14. Final velocity and pressure fields for A = 0.1 and h = 2 × 10 3 .
Fluids 08 00233 g014
Figure 15. L2 norm error evolution for A = 0.1 and h = 5 × 10 3 . The final time considered it high enought to guaranty the steady state regime on the final iteration.
Fluids 08 00233 g015
Figure 16. Space convergence analysis for the Square Benchmark with A = 0.01 . (a) Velocity L2 norm error. (b) Pressure L2 norm error.
Fluids 08 00233 g016
Figure 17. Space convergence analysis for the Square Benchmark with A = 0.1 . (a) Velocity L2 norm error. (b) Pressure L2 norm error.
Fluids 08 00233 g017
Figure 18. Description of the Moving Interface Benchmark. Dirichlet conditions are described in this figure. Boundary conditions for the velocity components and pressure that are not mentioned are set free.
Fluids 08 00233 g018
Figure 19. Space-time convergence analysis for the Moving Interface benchmark for ε = 0.1   m .
Fluids 08 00233 g019
Figure 20. Interface position in the case r = 2000 for ε = 0.1   m for the Moving Interface Benchmark.
Fluids 08 00233 g020
Figure 21. Comparison of the analytical and simulated mass of the moving interface benchmark for the configuration h m i n = 5 × 10 3   m and Δ t = 0.5   s . The estimations from the outflux and the velocity divergence are consistent with the instant mass value.
Fluids 08 00233 g021
Figure 22. Interface position in the case r = 2000 for ε = 3 h .
Fluids 08 00233 g022
Figure 23. Example of discretization of the Dirac function δ α in 1D. A thousand similar discretizations are conducted in the same way using randomized positions around the reference points.
Fluids 08 00233 g023
Figure 24. Influence of the value of ζ on the mean value of the integral absolute deviation of the discretized Dirac functions of every batch.
Fluids 08 00233 g024
Figure 25. Description of the Growing Bubble Benchmark.
Fluids 08 00233 g025
Figure 26. Impact of the second order correction term on the LS convection velocity the Growing Bubble benchmark for ε = 2 × 10 4   m .
Fluids 08 00233 g026
Figure 27. Space-time convergence analysis for the Growing Bubble benchmark for ε = 2 × 10 4   m .
Fluids 08 00233 g027
Figure 28. Radius for different mesh sizes and time steps for the growing bubble benchmark for ε = 3 h .
Fluids 08 00233 g028
Figure 29. Comparison of the analytical and simulated mass of the growing bubble benchmark for the configuration h m i n = 2 × 10 5   m and Δ t = 5 × 10 6   s . The estimations from the outflux and the velocity divergence are still consistent with the instant mass value.
Fluids 08 00233 g029
Figure 30. Position of the interface for different mesh sizes and time steps for the compressible Stefan problem benchmark.
Fluids 08 00233 g030
Figure 31. Mass transfer for different mesh sizes and time steps for the compressible Stefan problem benchmark.
Fluids 08 00233 g031
Figure 32. Space-time convergence analysis for the compressible Stefan problem benchmark.
Fluids 08 00233 g032
Figure 33. Comparison of the analytical and simulated mass of the compressible Stefan benchmark for the configuration h m i n = 2 × 10 6   m and Δ t = 2 × 10 5   s . The mass deviations are higher at the beginning of the simulation due to the error in mass transfer that is higher at higher heat fluxes.
Fluids 08 00233 g033
Figure 34. Schematic description of the adiabatic problem.
Fluids 08 00233 g034
Figure 35. Comparison of the simulated liquid vapor interfaces and liquid boundary positions compared with the steady state analytical solution of the adiabatic problem.
Fluids 08 00233 g035
Table 1. Physical properties of the considered fluids for the isochoric Stefan problem.
Density ρ Volume Heat Capacity ρ c p Thermal Conductivity kLatent Heat L
kg m−3J m−3 K−1W m−1 K−1J kg−1
Vapor5.97 × 10−11.12 × 1032.48 × 10−22.26 × 10⁶
Liquid4.40 × 1066.79 × 10−1
Table 2. Physical properties of the considered fluids of the Moving Interface benchmark.
Density ρ Viscosity η Surface Tension γ 0
(kg m−3) (Pa s) (J m−2)
Vapor5 × 10−1/5/5 × 101/5 × 1021.2 × 10−56 × 10−2
Liquid1032.8 × 10−4
Table 3. Physical properties of the considered fluids for the Growing Bubble test case.
Density ρ Viscosity η Surface Tension γ 0
(kg m−3) (Pa s) (J m−2)
Vapor11.78 × 10−57 × 10−2
Liquid10310−3
Table 4. Physical properties of the considered fluids for the Compressible Stefan test case.
Density ρ Specific Heat Capacity c p Thermal Conductivity kViscosity η Latent Heat L
(kg m−3) (J kg−1 K−1) (W m−1 K−1) (Pa s) (J kg−1)
Vapor5.97 × 10−12.030 × 1032.48 × 10−21.20 × 10−52.26 × 106
Liquid9.584 × 1024.216 × 1036.76 × 10−12.8 × 10⁻⁴
Disclaimer/Publisher’s Note: The statements, opinions and data contained in all publications are solely those of the individual author(s) and contributor(s) and not of MDPI and/or the editor(s). MDPI and/or the editor(s) disclaim responsibility for any injury to people or property resulting from any ideas, methods, instructions or products referred to in the content.