Abstract
Buoyancy effects in vertical, upward laminar flows can result in an augmentation in heat transfer rates to supercritical CO2 (sCO2) near its pseudocritical temperature (TPC). This is in contrast to corresponding flows in the turbulent regime, or laminar sCO2 flows (with minimum buoyancy effects), where a deterioration in heat transfer near TPC, followed by a recovery phase, have been observed. To exploit these sCO2 heat transfer enhancement characteristics and improve heat exchange efficiencies, the location of the TPC pinch point and the variables controlling these buoyancy effects need to be identified. To fill this void, numerical simulations of sCO2 (at inlet: 8.2 MPa, 265 K) in vertical circular tubes of diameters (D) 0.2–2 mm, heated with constant wall heat fluxes (Q) of 1–4 kW/m2) and inlet Reynolds numbers (Re) of 100, 400, were carried out. The tube lengths were varied to maintain an exit temperature of 320 K (TPC~309 K). The results indicated that buoyancy-augmented laminar heat transfer rates may be expected when Gr/Re2.7 > 10−4 (Gr = Grashof number). A modified Nusselt number correlation in terms of (Gr/Re) is proposed and is observed to fit the observed variations within a mean absolute percentage error < 15%, in most regions.
1. Introduction
Due to the rapid variations in the thermophysical properties near their critical point, supercritical fluids (SCFs) can assist in improving the efficiencies of heat exchange processes in industrial scenarios [1]. In order to achieve this, the temperature and pressure in the vicinity of rapid property variations must be precisely controlled to fully exploit these favorable heat transfer characteristics. Supercritical CO2 (sCO2), for instance, is a promising candidate that can be an effective heat transfer medium within compact heat exchangers for use in indirect-fired Brayton cycles [2] and trans-critical heat pump cycles [3].
Since the critical point of CO2 is 304.25 K and 73.9 bar, sending sCO2 through small diameter tubes and avoiding excessive wall thicknesses may facilitate the design of low weight, small volume heat exchangers. However, sCO2 heat transfer studies in mini channels (i.e., those having hydraulic diameters in the range of 200 µm–3 mm [4]) have been mainly conducted using fully developed turbulent flow conditions, as summarized in recent reviews [5,6]. Experimental uncertainties [7], along with strong thermophysical property variations near the pseudo-critical point (defined as the temperature, TPC, at which a specific heat reaches a maximum value at the operating pressure) have made it challenging to formulate and propose universal heat transfer correlations that are applicable across a wide range of operating conditions. Sudden heat transfer rate enhancement [8], as well as deterioration due to buoyancy across multiple scenarios as a result of flow acceleration and laminarization [8,9], have further impeded this task. As a result of the aforementioned challenges, the general consensus is that formulating a universal correlation to quantify turbulent heat transfer rates through sCO2 in the vicinity of its TPC is challenging from an experimental aspect alone. Efforts to garner insights into these phenomena through numerical simulations have also met with limited success. The constant turbulent Prandtl number (Prt) assumption inherent in Reynolds-Averaged Navier–Stokes (RANS)-based turbulence models, for instance, has been identified as a major source of error, especially in scenarios where buoyancy effects are important [8]. While these shortcomings associated with RANS-based models can be alleviated using well resolved direct numerical simulations (DNS), these are currently limited to conditions involving moderately low Reynolds numbers, since the mesh count required to resolve all the turbulence scales (down to the Kolmogorov length scales) is proportional to Re9/4.
sCO2 laminar flow scenarios (encountered in printed circuit heat exchangers, for instance) may be exempt from the measurement and simulation challenges associated with turbulent conditions. However, the reviews [5,6] highlight only a limit number of studies that have attempted to understand the effects of buoyancy on the laminar heat transfer to sCO2 in mini-channels, the results of which are summarized in Table 1.

Table 1.
A summary of previous studies examining the effects of buoyancy on the laminar heat transfer to sCO2.
What is clear from these studies is that:
- In contrast to turbulent flows, buoyancy effects in vertical, upward laminar flows can result in an augmentation in heat transfer rates to sCO2 near its TPC. Therefore, the primary variables responsible for this augmentation need to be identified/recognized.
- There is a lack of correlation with the laminar regime allowing us to exploit these buoyancy-induced sCO2 heat transfer enhancement characteristics by enabling us to identify the location of the TPC pinch point within a heat exchanger, as well as the variables controlling these buoyancy effects. For instance, correlations for the Nusselt number (Nu) have been proposed by Dang and Hihara [13], as well as Viswanathan and Krishnamoorthy [14], in terms of the ratios of thermophysical properties evaluated at wall and bulk fluid temperatures. However, neither of these correlations account for the effects of buoyancy. While the effects of buoyancy in mini channels are generally small, this effect needs to be assessed rigorously for a range of pipe diameters and heat fluxes.
- While the buoyancy criterion for the turbulent regime have been well discussed in the literature [9], their validity in the laminar regime needs to be assessed to enable us to select an appropriate correlation for use in our analysis.
To fill this void, numerical simulations of sCO2 (at inlet: 8.2 MPa, 265 K) in vertical circular tubes of diameters (D) of 0.2–2 mm, heated with constant wall heat fluxes (Q) at 1–4 kW/m2 (representative of fluxes encountered in solar collectors), and inlet Reynolds numbers (Re) of 100, 400 were carried out. The tube lengths were varied to maintain an exit temperature of 320 K (TPC~309 K).
2. Materials and Methods
The range of simulation parameters employed in this study are reported in Table 2. Figure 1a shows the thermophysical properties (ΦT) of CO2 at 8.2 MPa, normalized by their maximum values (ΦMAX). In the numerical study involving laminar, steady-state simulations were carried out employing the commercial code ANSYS FLUENT 19.1 [15]. The 3D geometry was resolved using 485,000 hexahedral cells (cf. Figure 1b) after making sure that grid-independent results were obtained for all the cases examined in this study at this resolution. We ascertained that grid-independent results were obtained at this resolution at all inlet Re, tube diameters, and heat fluxes examined in this study by first ensuring that when constant properties were involved, the Nu converged to 4.36 (when buoyancy effects are minimal). Second, the computed wall temperature profiles (the primary simulation output of interest) were also ensured to numerically converge, and they did not change with any further increase in mesh resolution.
Table 2.
Geometric details, inlet, and wall boundary conditions employed in this study.
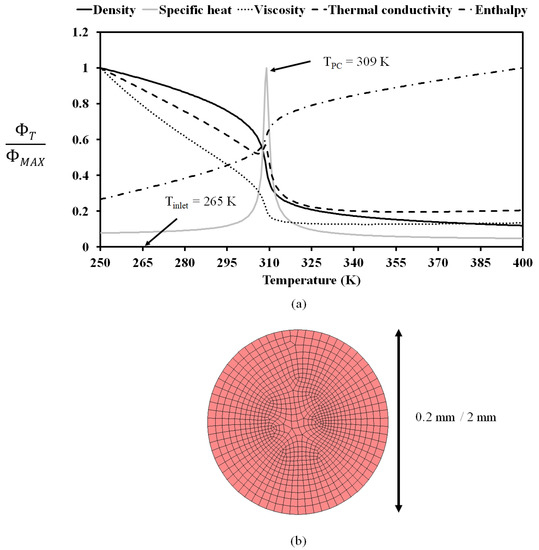
Figure 1.
(a) Thermophysical properties (ΦT) of CO2 at 8.2 MPa, normalized by their maximum values (ΦMAX) across the temperature range of interest 250–400 K); (b) the highly resolved mesh along the radial direction (in the 0.2 mm/2 mm diameter tubes).
The steady-state, mass conservation equation is given as [15]:
where and represent the density and velocity vector, respectively. The momentum conservation for the fluid can be written as [15]:
where is the stress tensor, the static pressure, and is the direction of the gravitational component. The stress tensor is evaluated as:
where μ is the molecular viscosity, I is the unit tensor, and the second term on the right-hand side is the effect of volume dilation. In the absence of sources and sinks, the conservation of energy (E) can be written as [15]:
where k and T represent the thermal conductivity and temperature, respectively.
A constant velocity inlet boundary condition was specified to match the inlet Reynolds number by estimating the density at 265 K at different tube diameters. A constant flux boundary condition was imposed at the walls for the different scenarios, as per Table 2.
The temperature-dependent thermophysical properties of sCO2 at 8.2 MPa were ascertained from NIST’s REFPROP thermodynamic library [16] and specified in a piecewise linear format across the temperature range of interest. The tube lengths were varied, depending on the imposed heat fluxes, to maintain an outlet temperature close to 320 K across all scenarios. Based on the inlet and outlet viscosities (at 265 K and ~320 K respectively, cf. Figure 1a), this corresponds to an approximately six-fold increase in Re from the inlet to the outlet. This inlet and outlet temperature range was selected to ensure that the flow remains in the laminar regime across all investigated scenarios, transitioning through TPC. In order to compute the Nusselt number (Nu) and heat transfer coefficient (h), the local wall temperature (TWALL) must be obtained first. For a specified heat flux Q, TWALL was computed as:
where q is in W/m2, Δn is the normal distance from the wall to the centroid of the first cell adjacent to the wall, and kf and Tf are the fluid thermal conductivity adjacent to the wall and the fluid temperature adjacent to the wall, respectively. The local heat transfer coefficient (h) was then estimated from TWALL using the relation:
h = q/(TWALL − TBULK)
In Equation (6), TBULK is the local fluid bulk temperature estimated from the local bulk enthalpy (Hx) as:
where G is the mass flow in Kg/s and Hin the enthalpy corresponding to inlet temperature (obtained from REFPROP [16]), x is the distance from the inlet, and d is the tube diameter (in m). The local bulk temperature (TBULK) was evaluated from the estimated local bulk enthalpy (Hx) (cf. Figure 1a). The thermal conductivity (KBULK) corresponding to the bulk temperature was then estimated (cf. Figure 1a) and used to calculate the Nusselt number (Nu) from the expression:
Hx = Hin +q × π × d × x/G
Nu = hD/kBULK
In addition, following the review of several buoyancy criteria for supercritical fluids, an assessment of the Jackson and Hall [17] buoyancy criterion was made to assess its validity in the laminar flow region. The criterion for the importance of buoyancy effects may be given as:
where GrBULK and ReBULK are the Grashof and Reynolds numbers, respectively, both defined based on the bulk properties. The density-based Grashof number is defined as:
Pressure and velocity were coupled using the SIMPLE algorithm. The PRESTO and QUICK schemes were employed for the spatial discretization of the pressure and momentum terms, respectively, since hexahedral cells were employed in the calculations [15]. Since the main variable of interest from the simulation is the wall temperatures (cf. Equations (5) and (6)), convergence was ensured by invariant wall temperature profiles. Rapid temperature variations and strong buoyancy effects, such as those encountered during combustion, can necessitate the use of unsteady solvers in mixed convection scenarios [18]. However, all simulations investigated in this study converged with the steady-state solver due to the modest values of the heat fluxes employed in the calculations (1 kW/m2–4 kW/m2).
3. Results and Discussion
3.1. Effect of Variations in Heat Flux, Inlet Re, and Diameter on Nu
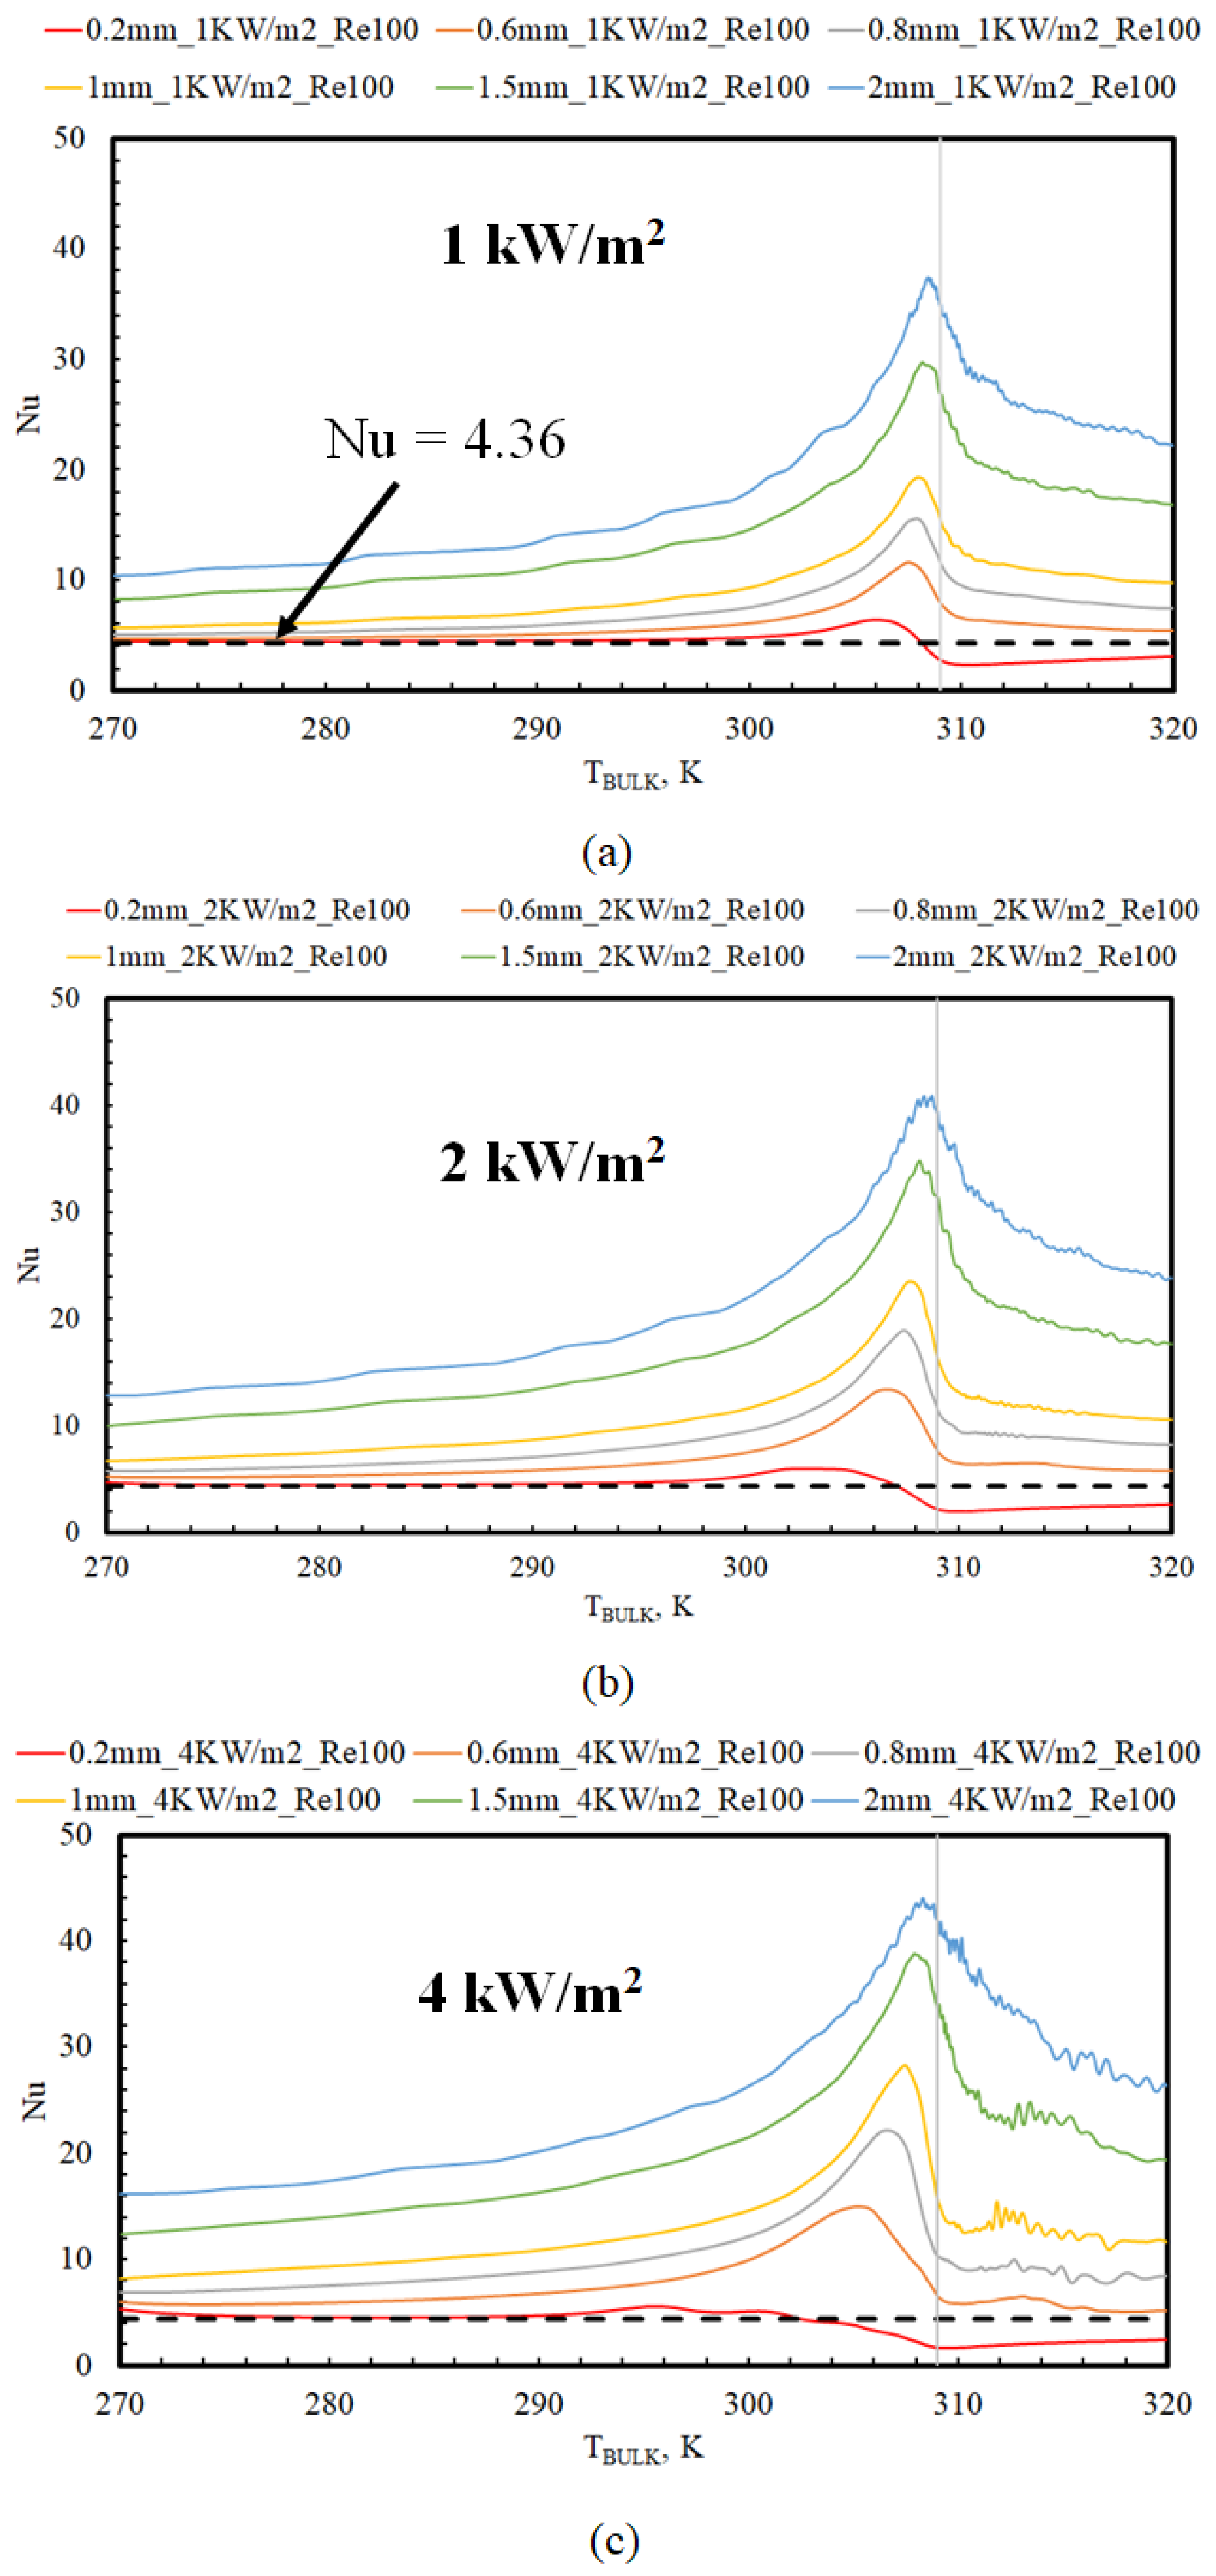
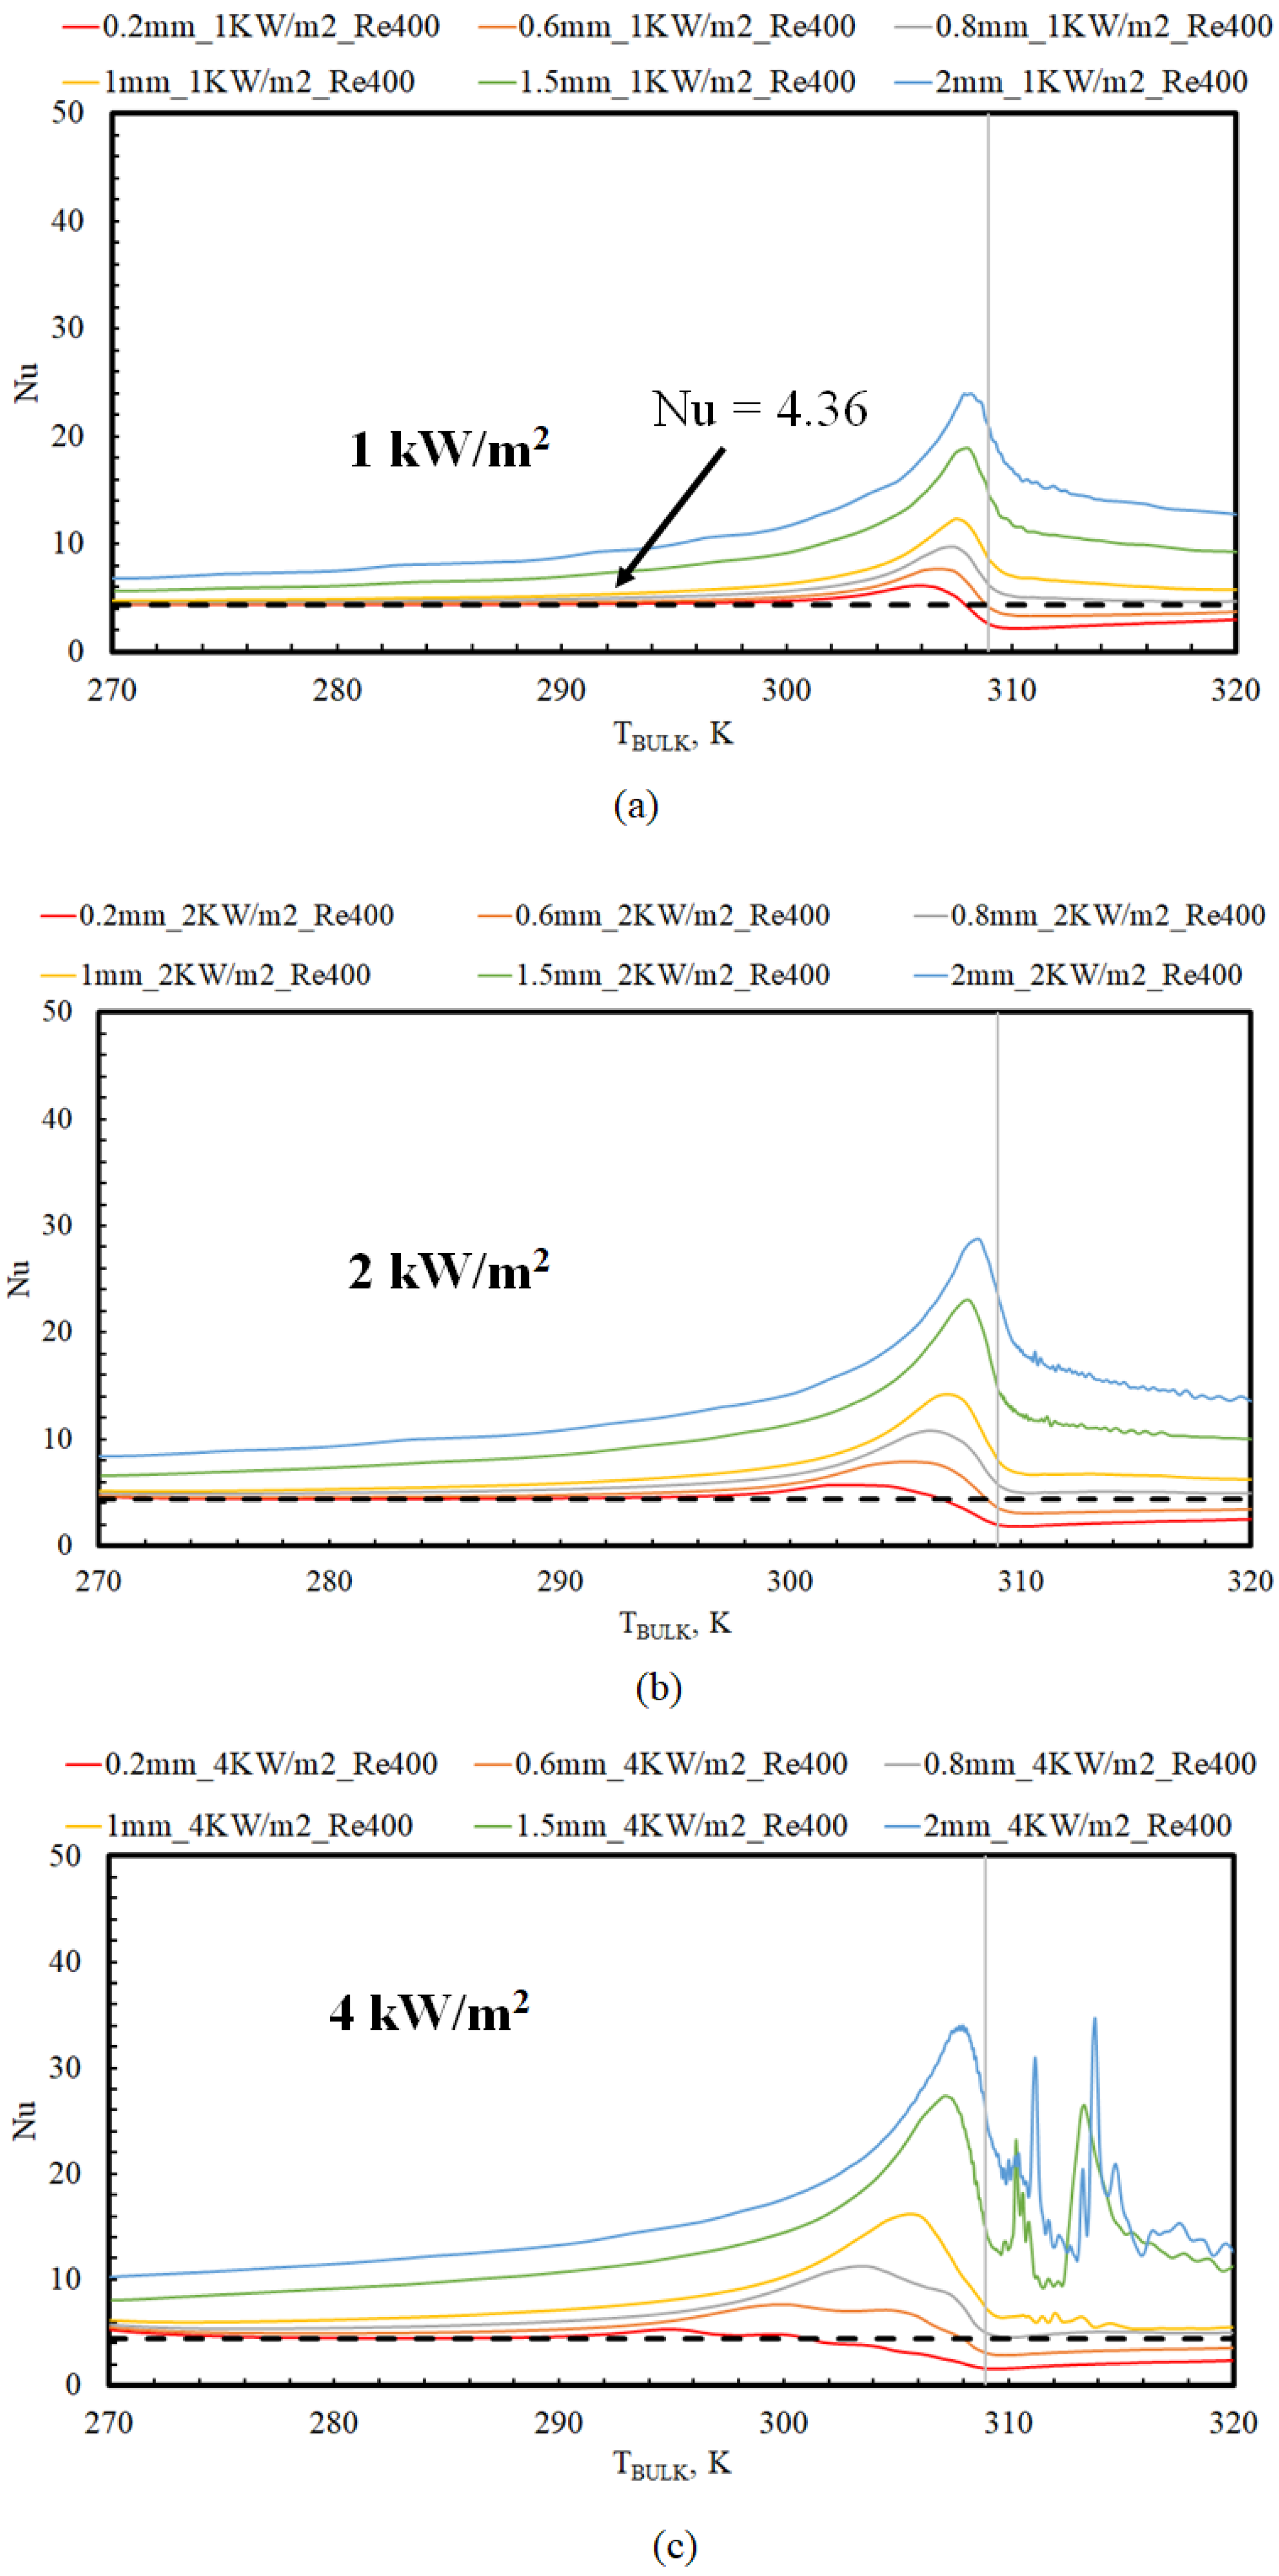
The Nu variation along the flow direction for different tube diameters is shown in Figure 2 at various heat fluxes imposed on the wall boundaries. Figure 2 depicts this variation in Nu as a function of bulk temperature (TBULK) at an inlet Re of 100, whereas Figure 3 shows the axial Nu variation as a function of bulk temperature (TBULK) at an inlet Re of 400. From Figure 2 and Figure 3, three distinct regions are observed, with the following characteristics:
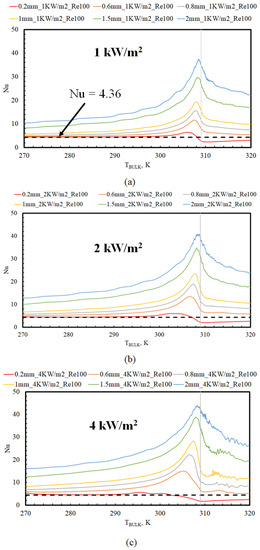
Figure 2.
Nu versus bulk temperature (TBULK) (Re 100) at different tube diameters for wall heat fluxes of: (a) 1 kW/m2; (b) 2 kW/m2; (c) 4 kW/m2.
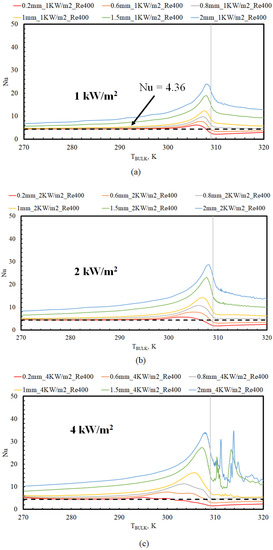
Figure 3.
Nu versus bulk temperature (TBULK) (Re 400) at different tube diameters for wall heat fluxes of: (a) 1 kW/m2; (b) 2 kW/m2; (c) 4 kW/m2.
- For TBULK < 285 K: Thermophysical property variations are gradual in this region (cf. Figure 1a). Therefore, the local Nu should ideally approach the value of 4.36 corresponding to fully developed, constant property, laminar flow conditions (indicated by the horizontal dotted lines in Figure 2 and Figure 3). Further, this should be independent of inlet Re, tube diameters, or the imposed fluxes. However, Nu was close to 4.36 in this region across all fluxes only for the tube diameter of 0.2 mm and for diameters less than 1.5 mm when the inlet Re was 400. This indicates that the buoyancy to convection effects are larger with a lower inlet Re and larger tube diameters, as expected from Equation (9). At larger tube diameters and lower inlet Re (>0.2 mm and >1.5 mm for Re 100), the local Nu in this bulk temperature region was greater than 4.36, indicating that buoyancy is augmenting the heat transfer rates. In addition, the Nu is also a function of tube diameter (D) and the imposed heat flux (Q), as seen in Figure 2 and Figure 3. This is attributed to larger differences in wall and bulk fluid properties at larger heat fluxes and the strong dependence of Gr on the tube diameter (cf. Equation (10)).
- For 285 K < TBULK < 310 K: There are wide variations in the thermophysical properties in this region (cf. Figure 1a). Therefore, Nu increases sharply (beyond 4.36). The extent of these Nu deviations (from the constant property flow value of 4.36), before and after TPC, were again found to be functions of the imposed heat fluxes (Q), tube diameter (D), and inlet Re. Nu reaches a peak value when TBULK is close to TPC across all scenarios.
- For TBULK > 310 K: Thermophysical property variations are again gradual in this region (cf. Figure 1a). However, Nu asymptotically approaches different values. In most cases, Nu attains a value much higher than the constant property fully developed flow value of 4.36, depending on the imposed heat flux and tube diameters. This points to buoyancy effects upstream affecting the flow behavior downstream. However, in some cases (tube diameters of 0.2 mm and for diameters less than 0.8 mm when the inlet Re was 400), Nu drops below 4.36 in this region and slowly recovers, as observed in previous studies where the influence of gravity was ignored [14].
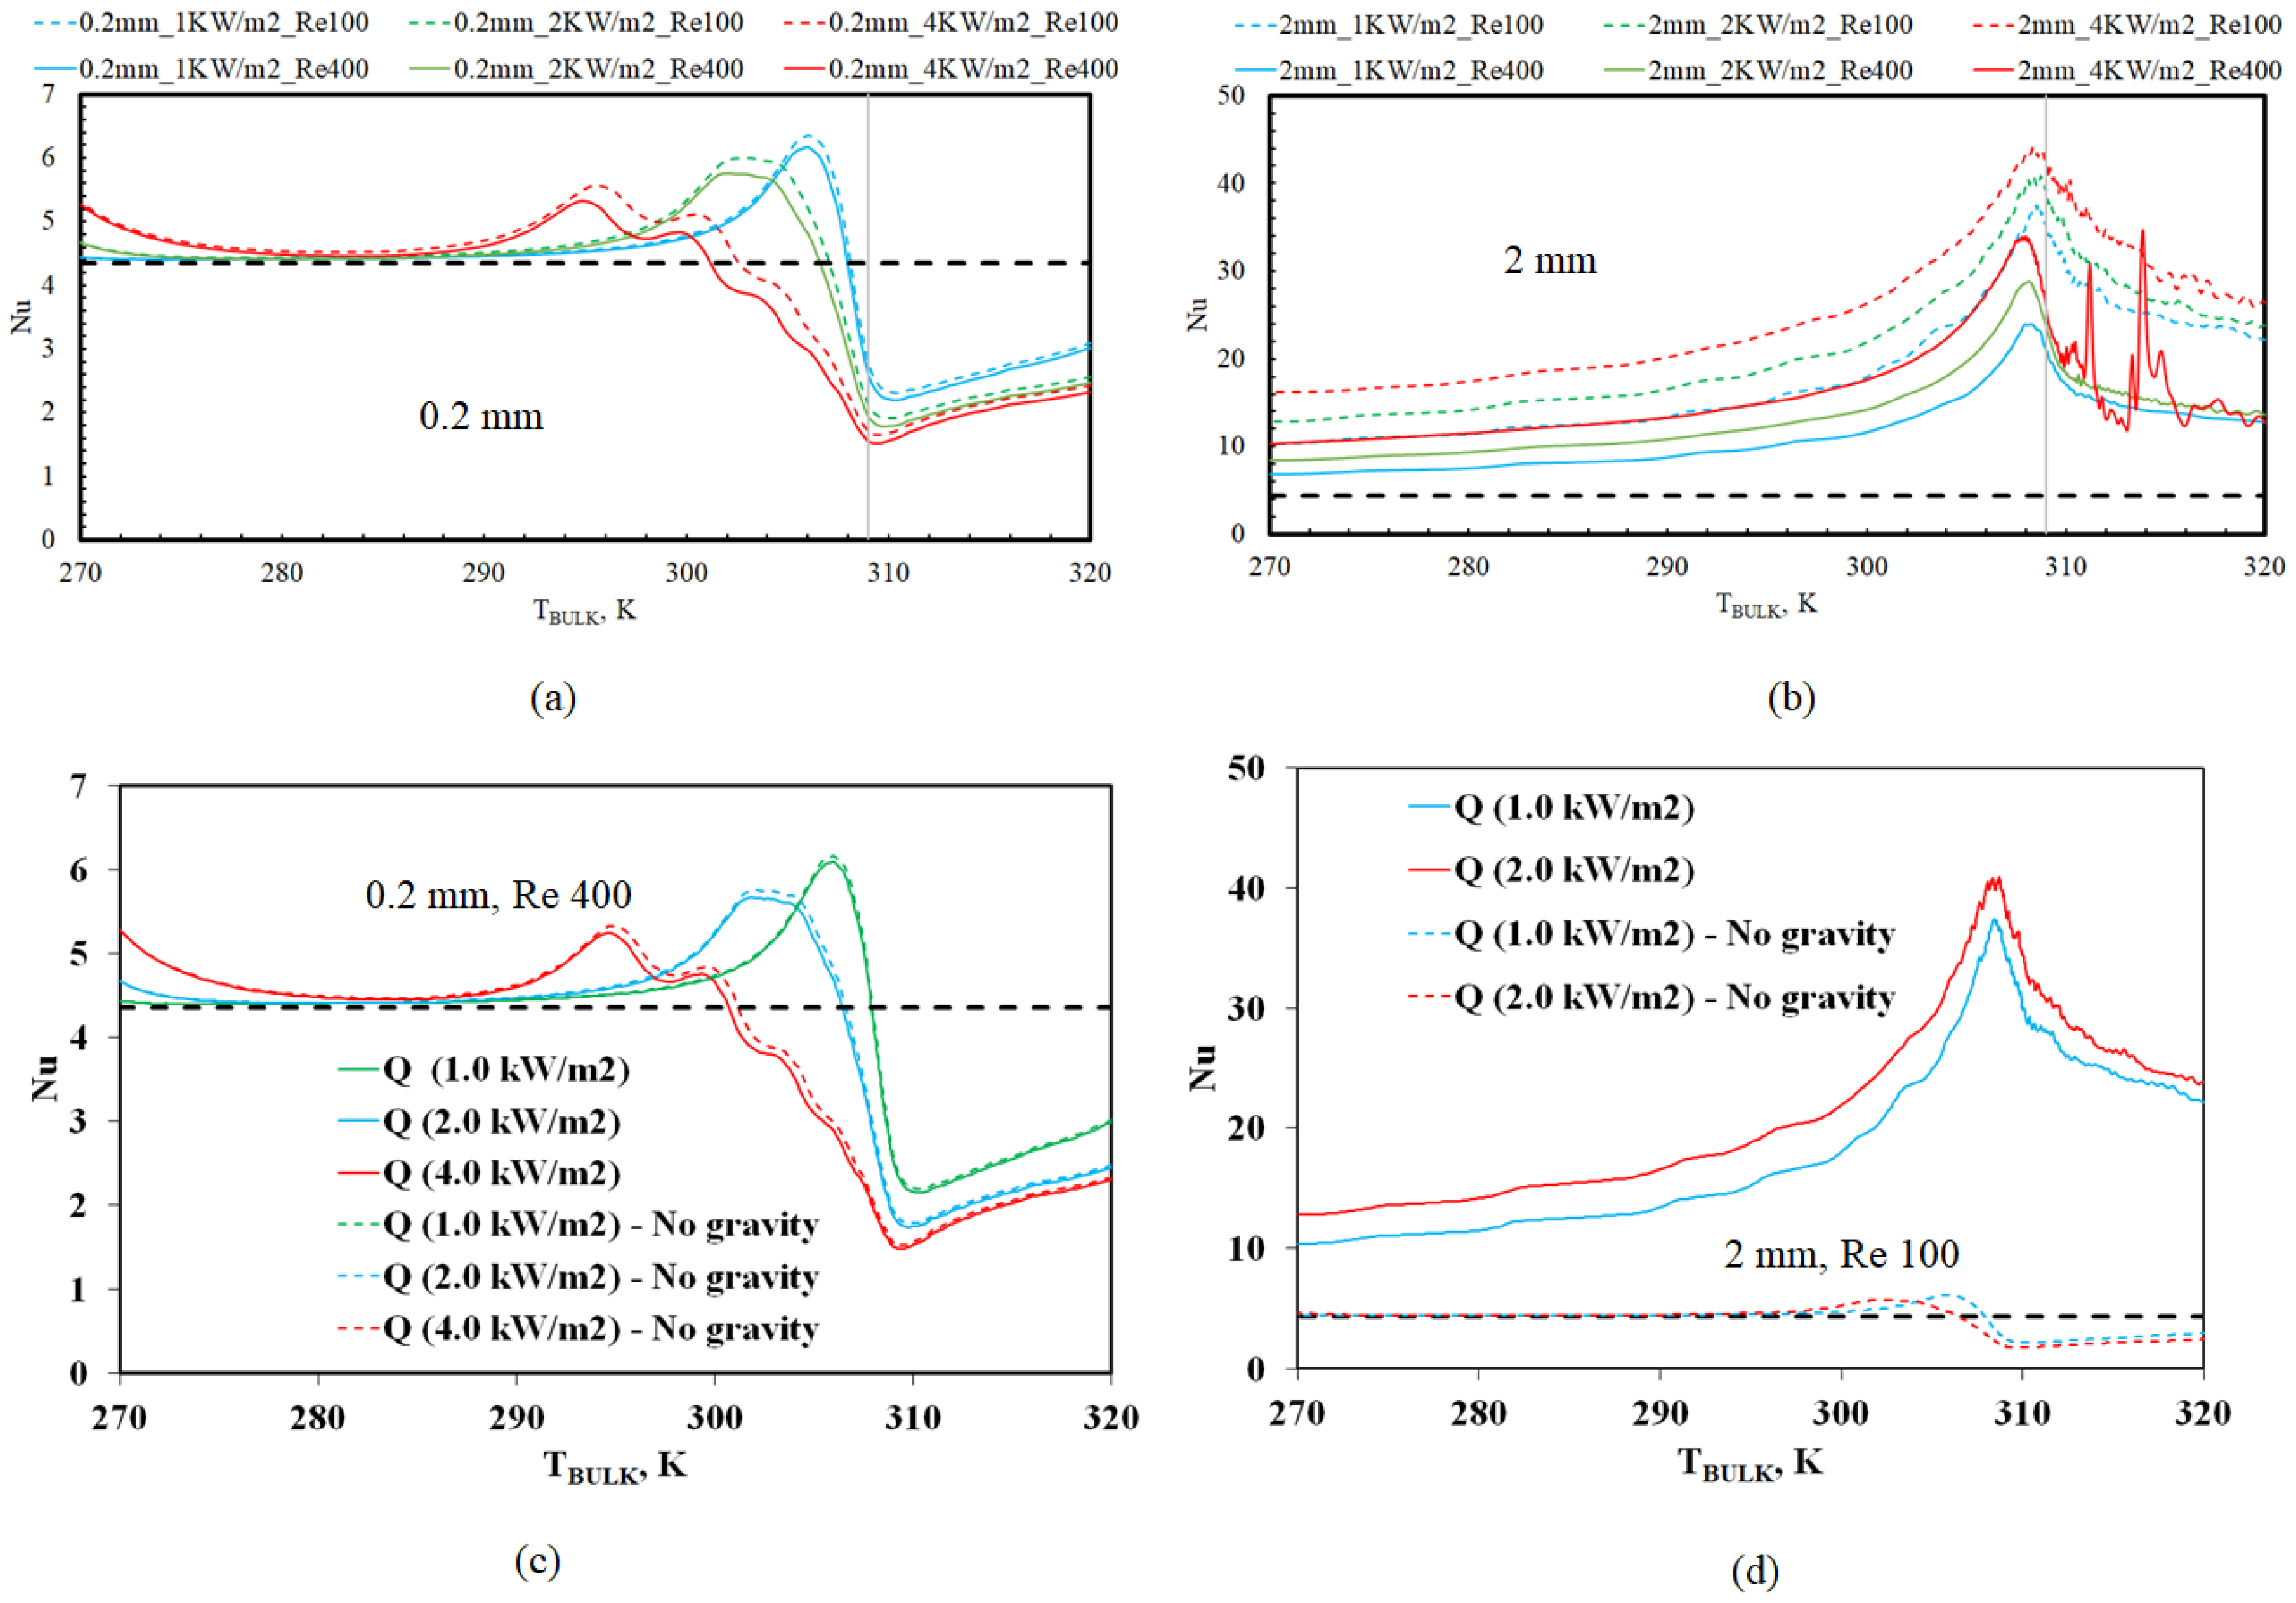
These results indicate that buoyancy effects may be negligible in the 0.2 mm diameter tube, with the effects diminishing further at a higher inlet Re. In contrast, larger tube diameters and a lower inlet Re are anticipated to show increased effects of buoyancy. To confirm this, Figure 4 show the variations in Nu at the minimum (0.2 mm) and maximum (2 mm) tube diameters investigated in this study, with and without the effects of gravity. Figure 4a,c indeed shows that Nu variations are independent of inlet Re, as well as gravity. In contrast, Figure 4b,d show the strong effects of buoyancy in 2 mm diameter tubes, as evident from the Nu dependence on the inlet Re, as well as gravity. At the highest heat flux (4 kW/m2), instability, as evident from Nu fluctuation, is noted in this region (cf. Figure 3c and Figure 4b) at the higher inlet Re as the flow is entering the transition region (Re > 2000). The fact that Nu was dependent on the inlet Re (for all tube diameters > 0.2 mm) is in contrast with the results from our previous study (carried out without considering the effect of gravity) [14]. Figure 4 additionally shows that the Nu variations are dependent on heat flux. Higher heat flux values, through their obvious influence on the wall temperatures, cause Nu to peak sooner (at lower bulk temperatures). Since larger heat flux values result in higher wall temperatures, this indicates that correlations for Nu in the laminar regime should include the thermophysical properties evaluated at the wall temperatures, as well as at the bulk temperatures, as seen in Equation (10).
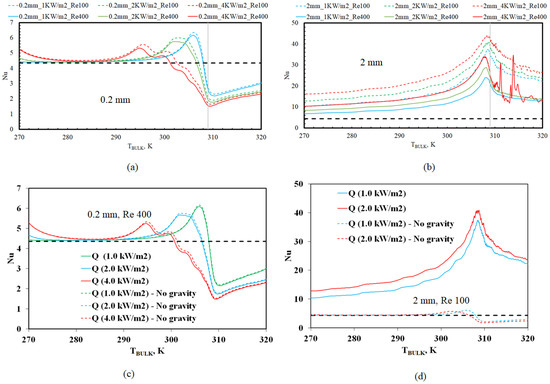
Figure 4.
Nu versus bulk temperature (TBULK) in: (a) 0.2 mm diameter tube at different inlet Re and heat fluxes; (b) 2 mm diameter tube at different inlet Re and heat fluxes; (c) 0.2 mm diameter tube, with and without gravity effects; (d) 2 mm diameter tube, with and without gravity effects.
Another conclusion from our previous study (that ignored the effects of gravity) [14] was that Nu was shown to attain identical values as a function of TBULK, as long as the flux times the tube diameter (Q × D) was held constant. In addition, this was found to be independent of the inlet Re. For instance, this means that the 1 mm diameter tube at a heat flux of 2 kW/m2 and the 2 mm diameter tube at a heat flux of 1 kW/m2 should show identical Nu values, if the effects of gravity were not considered. However, Figure 2 and Figure 3 clearly show that this is not the case, with the larger tube diameter (2 mm, 1 kW/m2) attaining higher values than its lower diameter (1 mm, 2 kW/m2) counterpart.
In summary, Figure 2, Figure 3 and Figure 4 indicate buoyancy-induced heat transfer augmentation across the entire bulk temperature range of interest (270–320 K) at tube diameters greater than 0.2 mm. In addition, this augmentation is directly proportional to Gr and inversely proportional to Re. This dependence on Gr and Re is to be anticipated, since the ratio Gr/Re2 (or alternatively, Equation (9)) quantifies the relative influence of hydrodynamic buoyancy. This augmentation in heat transfer rates has also been observed by Zaim and Nassab [19] in laminar flows involving sH2O in an annular channel.
3.2. Quantifying Grashof Numbers and Arriving at Buoyancy Criterion
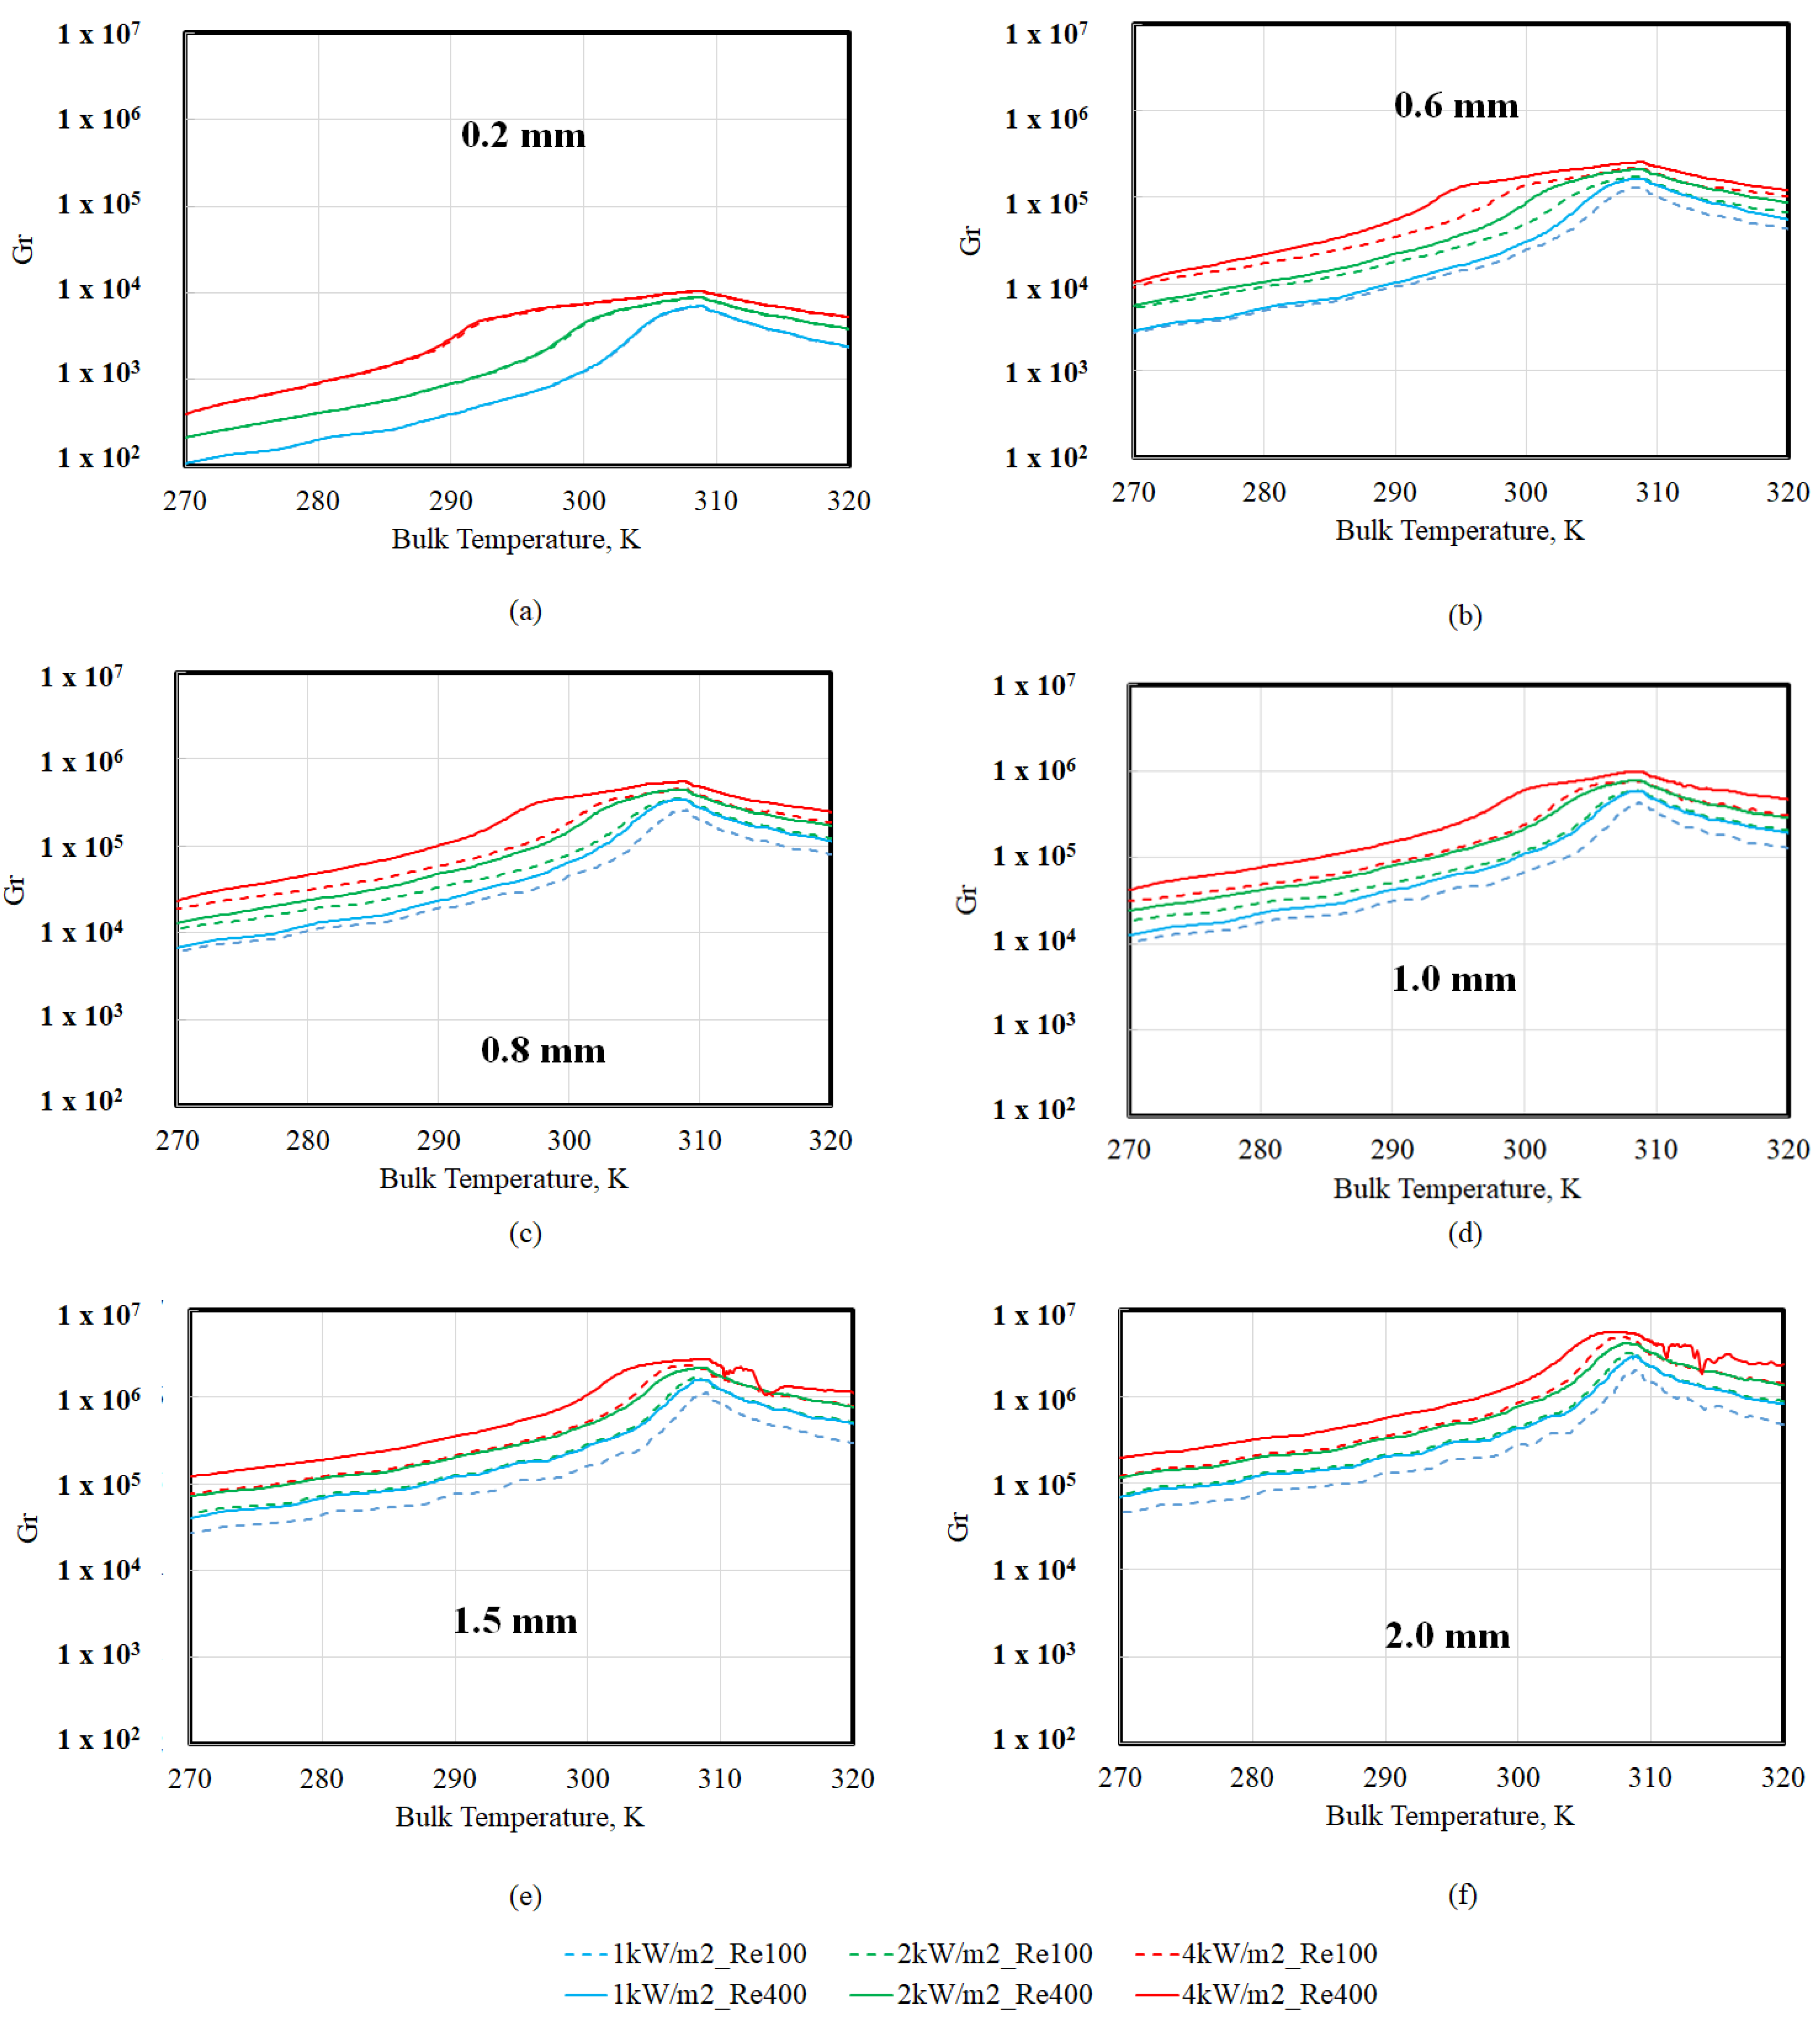
In order to understand the influence of buoyancy and its role in heat transfer augmentation, the variations in Gr with bulk temperature (TBULK) at different tube diameters are shown in Figure 5. First, it is worth noting that the magnitude of Gr across all scenarios was in the range of 102–107, which is well within the 109 laminar to turbulence transition limit for constant property fluids in vertical heated pipes [20]. At a given tube diameter and bulk temperature, Gr increases with an increase in heat flux. As mentioned previously, an increase in heat flux increases the wall temperature. This increases the difference between the wall and bulk temperatures and brings about a corresponding increase in the wall and bulk densities, as shown in Equation (10), thereby increasing the Gr with an increase in heat flux. Second, Gr increases with an increase in diameter (cf. Equation (10)), through its obvious third-power dependency. Since both these observations (i.e., Gr dependence on heat flux and tube diameters, as seen in Figure 5) are in line with the increase in Nu observed in the region TBULK < TPC, as seen in Figure 2 and Figure 3, this suggests that Gr can be used as a correlating parameter for capturing the Nu variation in this region.
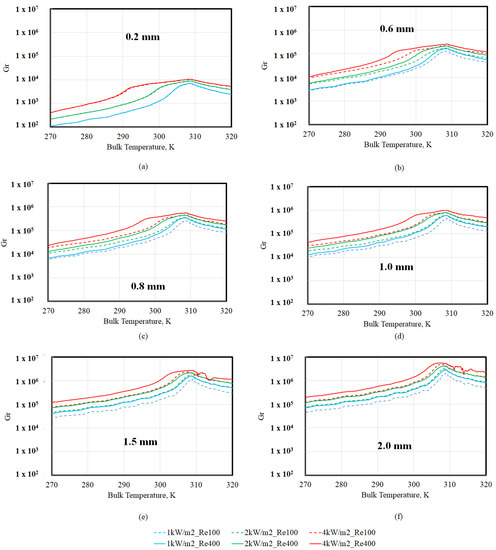
Figure 5.
Gr versus bulk temperature (TBULK) at different tube diameters: (a) 0.2 mm; (b) 0.6 mm; (c) 0.8 mm; (d) 1.0 mm; (e) 1.5 mm; (f) 2 mm.
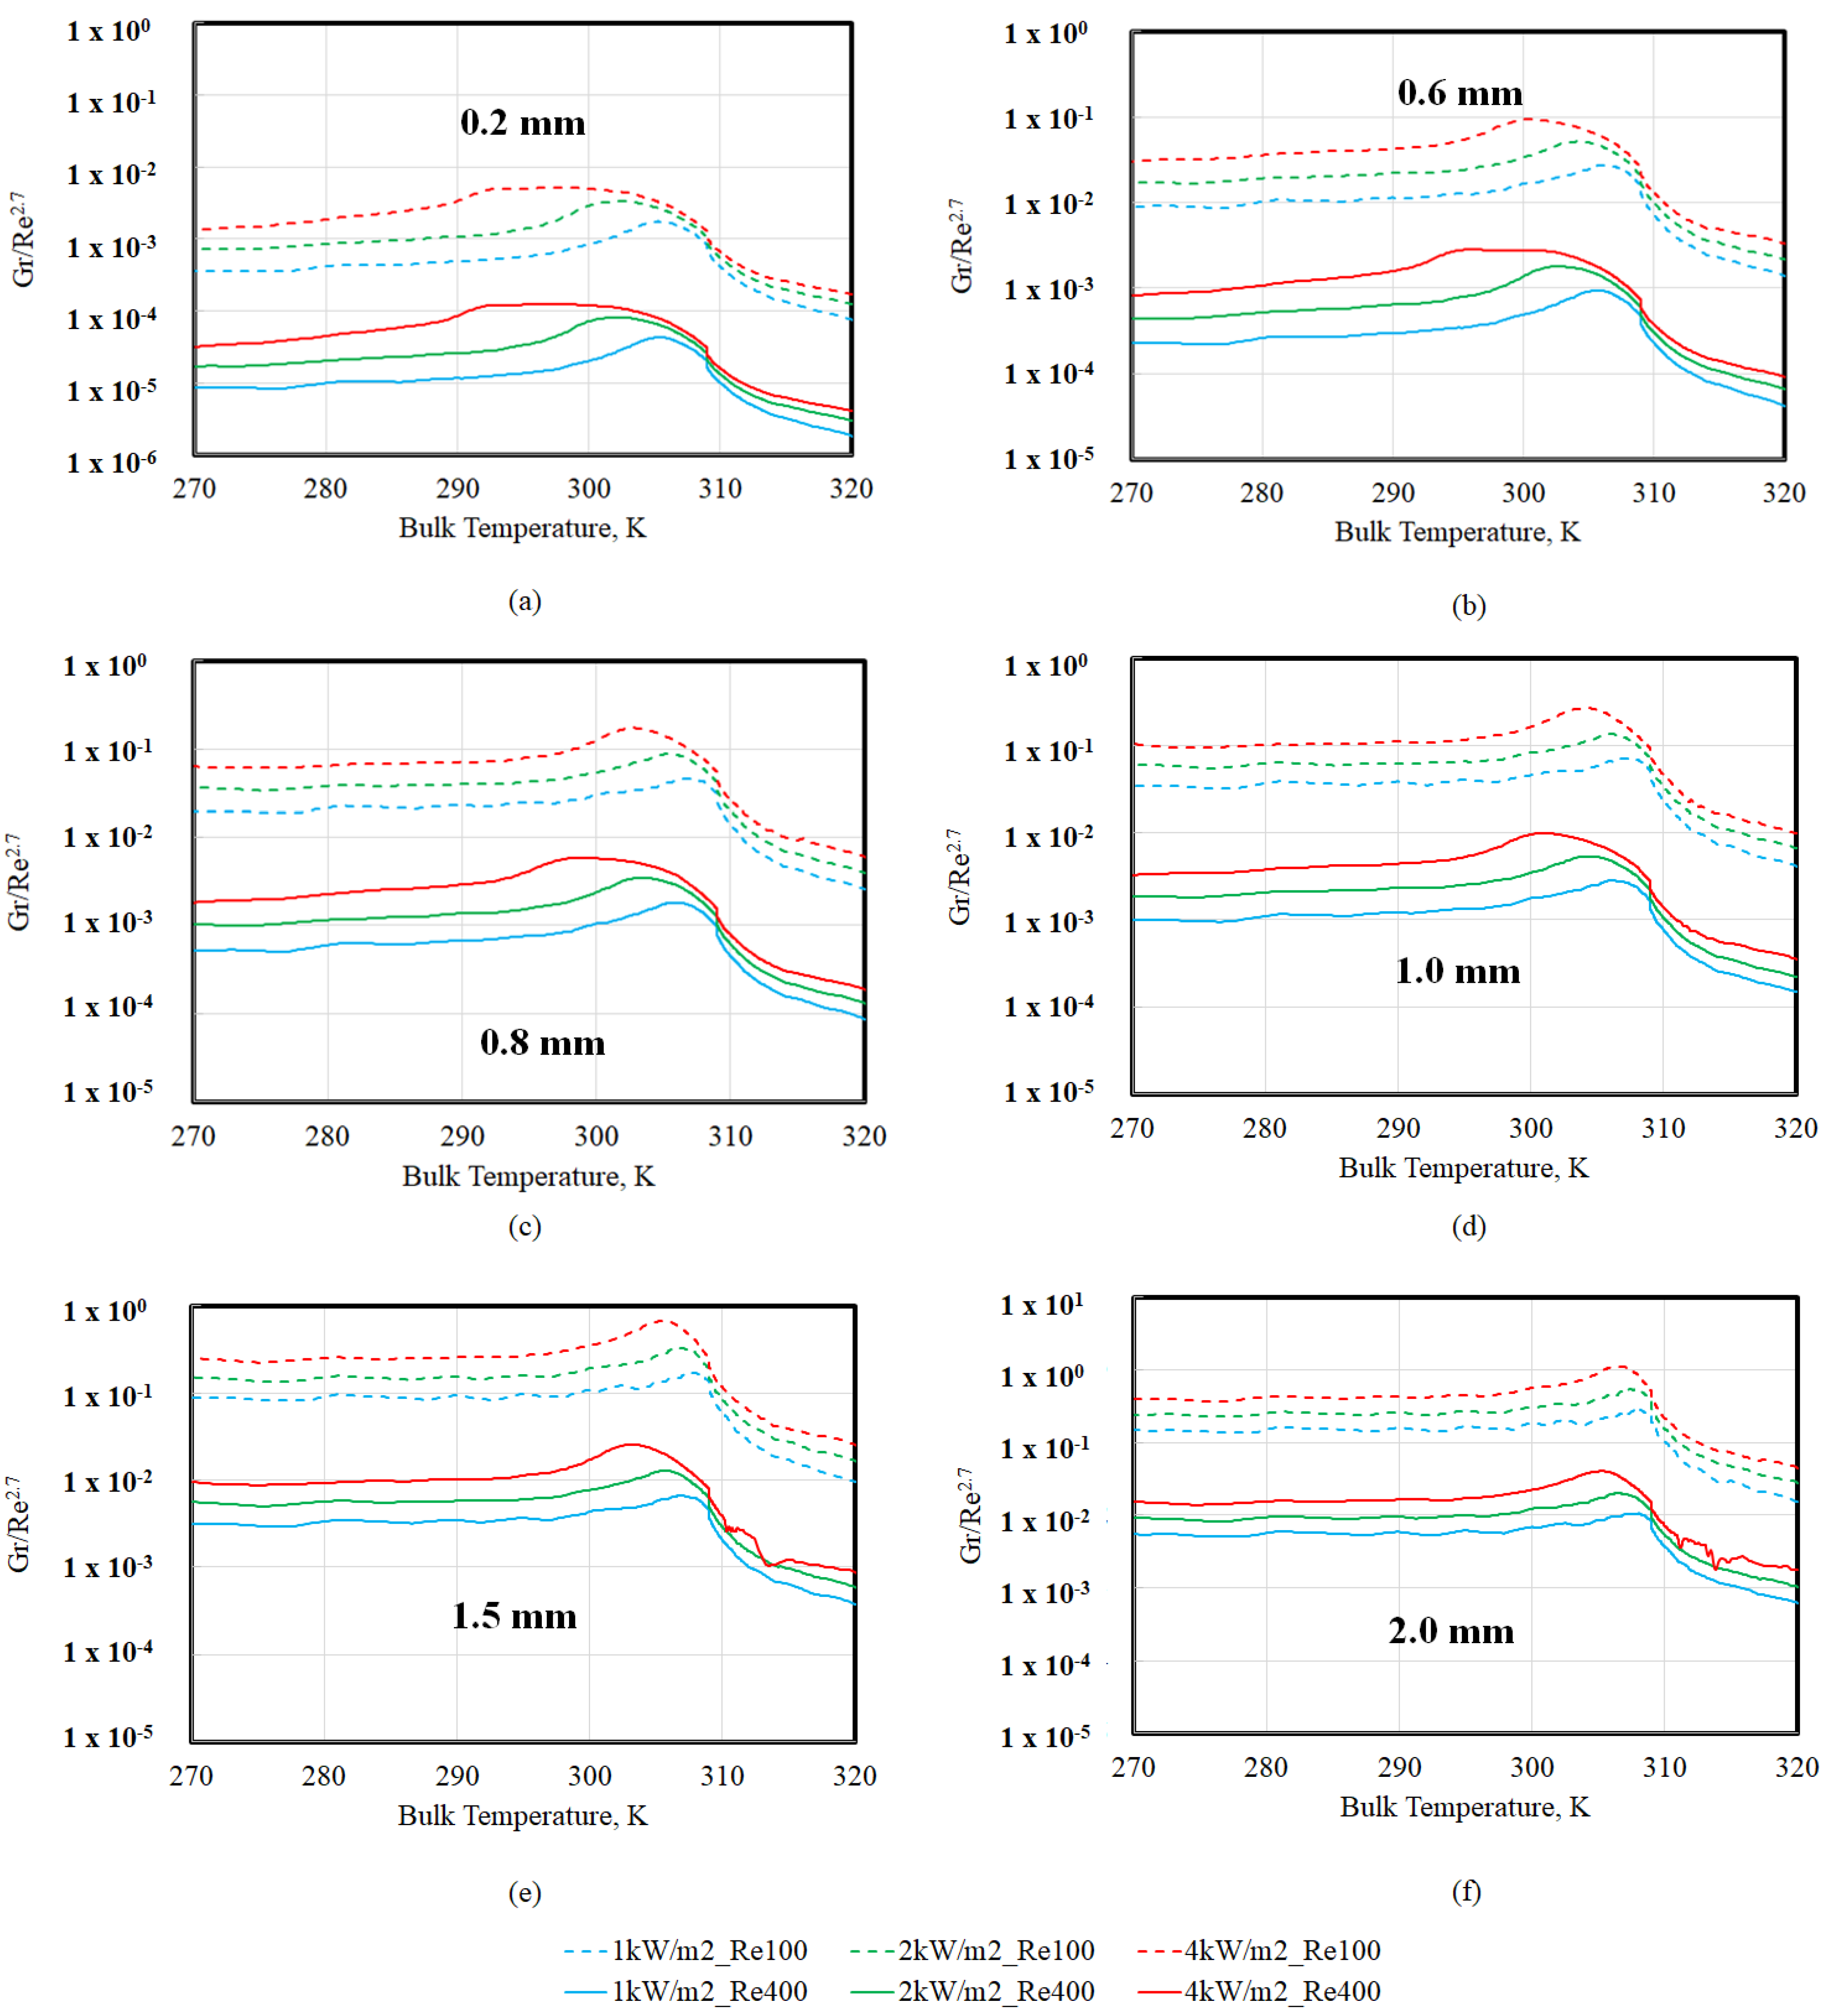
However, Figure 5 shows that downstream of TPC (~309 K), Gr gradually reduces, indicating that the difference between the wall and bulk temperature and the densities are gradually decreasing as well. While this should result in an augmentation in heat transfer and Nu (cf. Equation (6)), Figure 2 and Figure 3 show that at TBULK > TPC, Nu also decreases (similar to Gr), suggesting that Nu is proportional to Gr in this region as well. The fact that Nu decreased, in spite of the lower (TBULK − TWALL) in this region, may be understood based on the fact that the highest ReBULK values for each scenario are also found in this region (since viscosity also reduces when TBULK > TPC). Therefore, Gr/Re appears to be a criterion for buoyancy-induced heat transfer augmentation in this region. Based on the review of various buoyancy criterion [9], the magnitude of Gr/Re2.7 versus bulk temperature (TBULK) at different tube diameters was computed, and the results are shown in Figure 6. It is worth recalling that buoyancy effects were deemed to start becoming important at a tube diameter of 0.2 mm only when the inlet Re was 100, but not at an inlet Re of 400 (cf. Figure 4a,c). This suggests that Gr/Re2.7 > 10−4 (Figure 6a) may be employed as a criterion for which buoyancy augmented laminar heat transfer rates may be expected. This is an order of magnitude higher than the Gr/Re2.7 > 10−5 criterion that is employed to assess buoyancy effects in the turbulent regime [9].
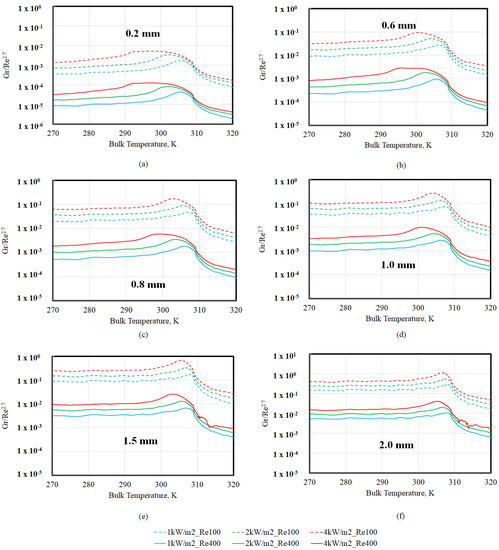
Figure 6.
Gr/Re2.7 versus bulk temperature (TBULK) at different tube diameters: (a) 0.2 mm; (b) 0.6 mm; (c) 0.8 mm; (d) 1.0 mm; (e) 1.5 mm; (f) 2 mm.
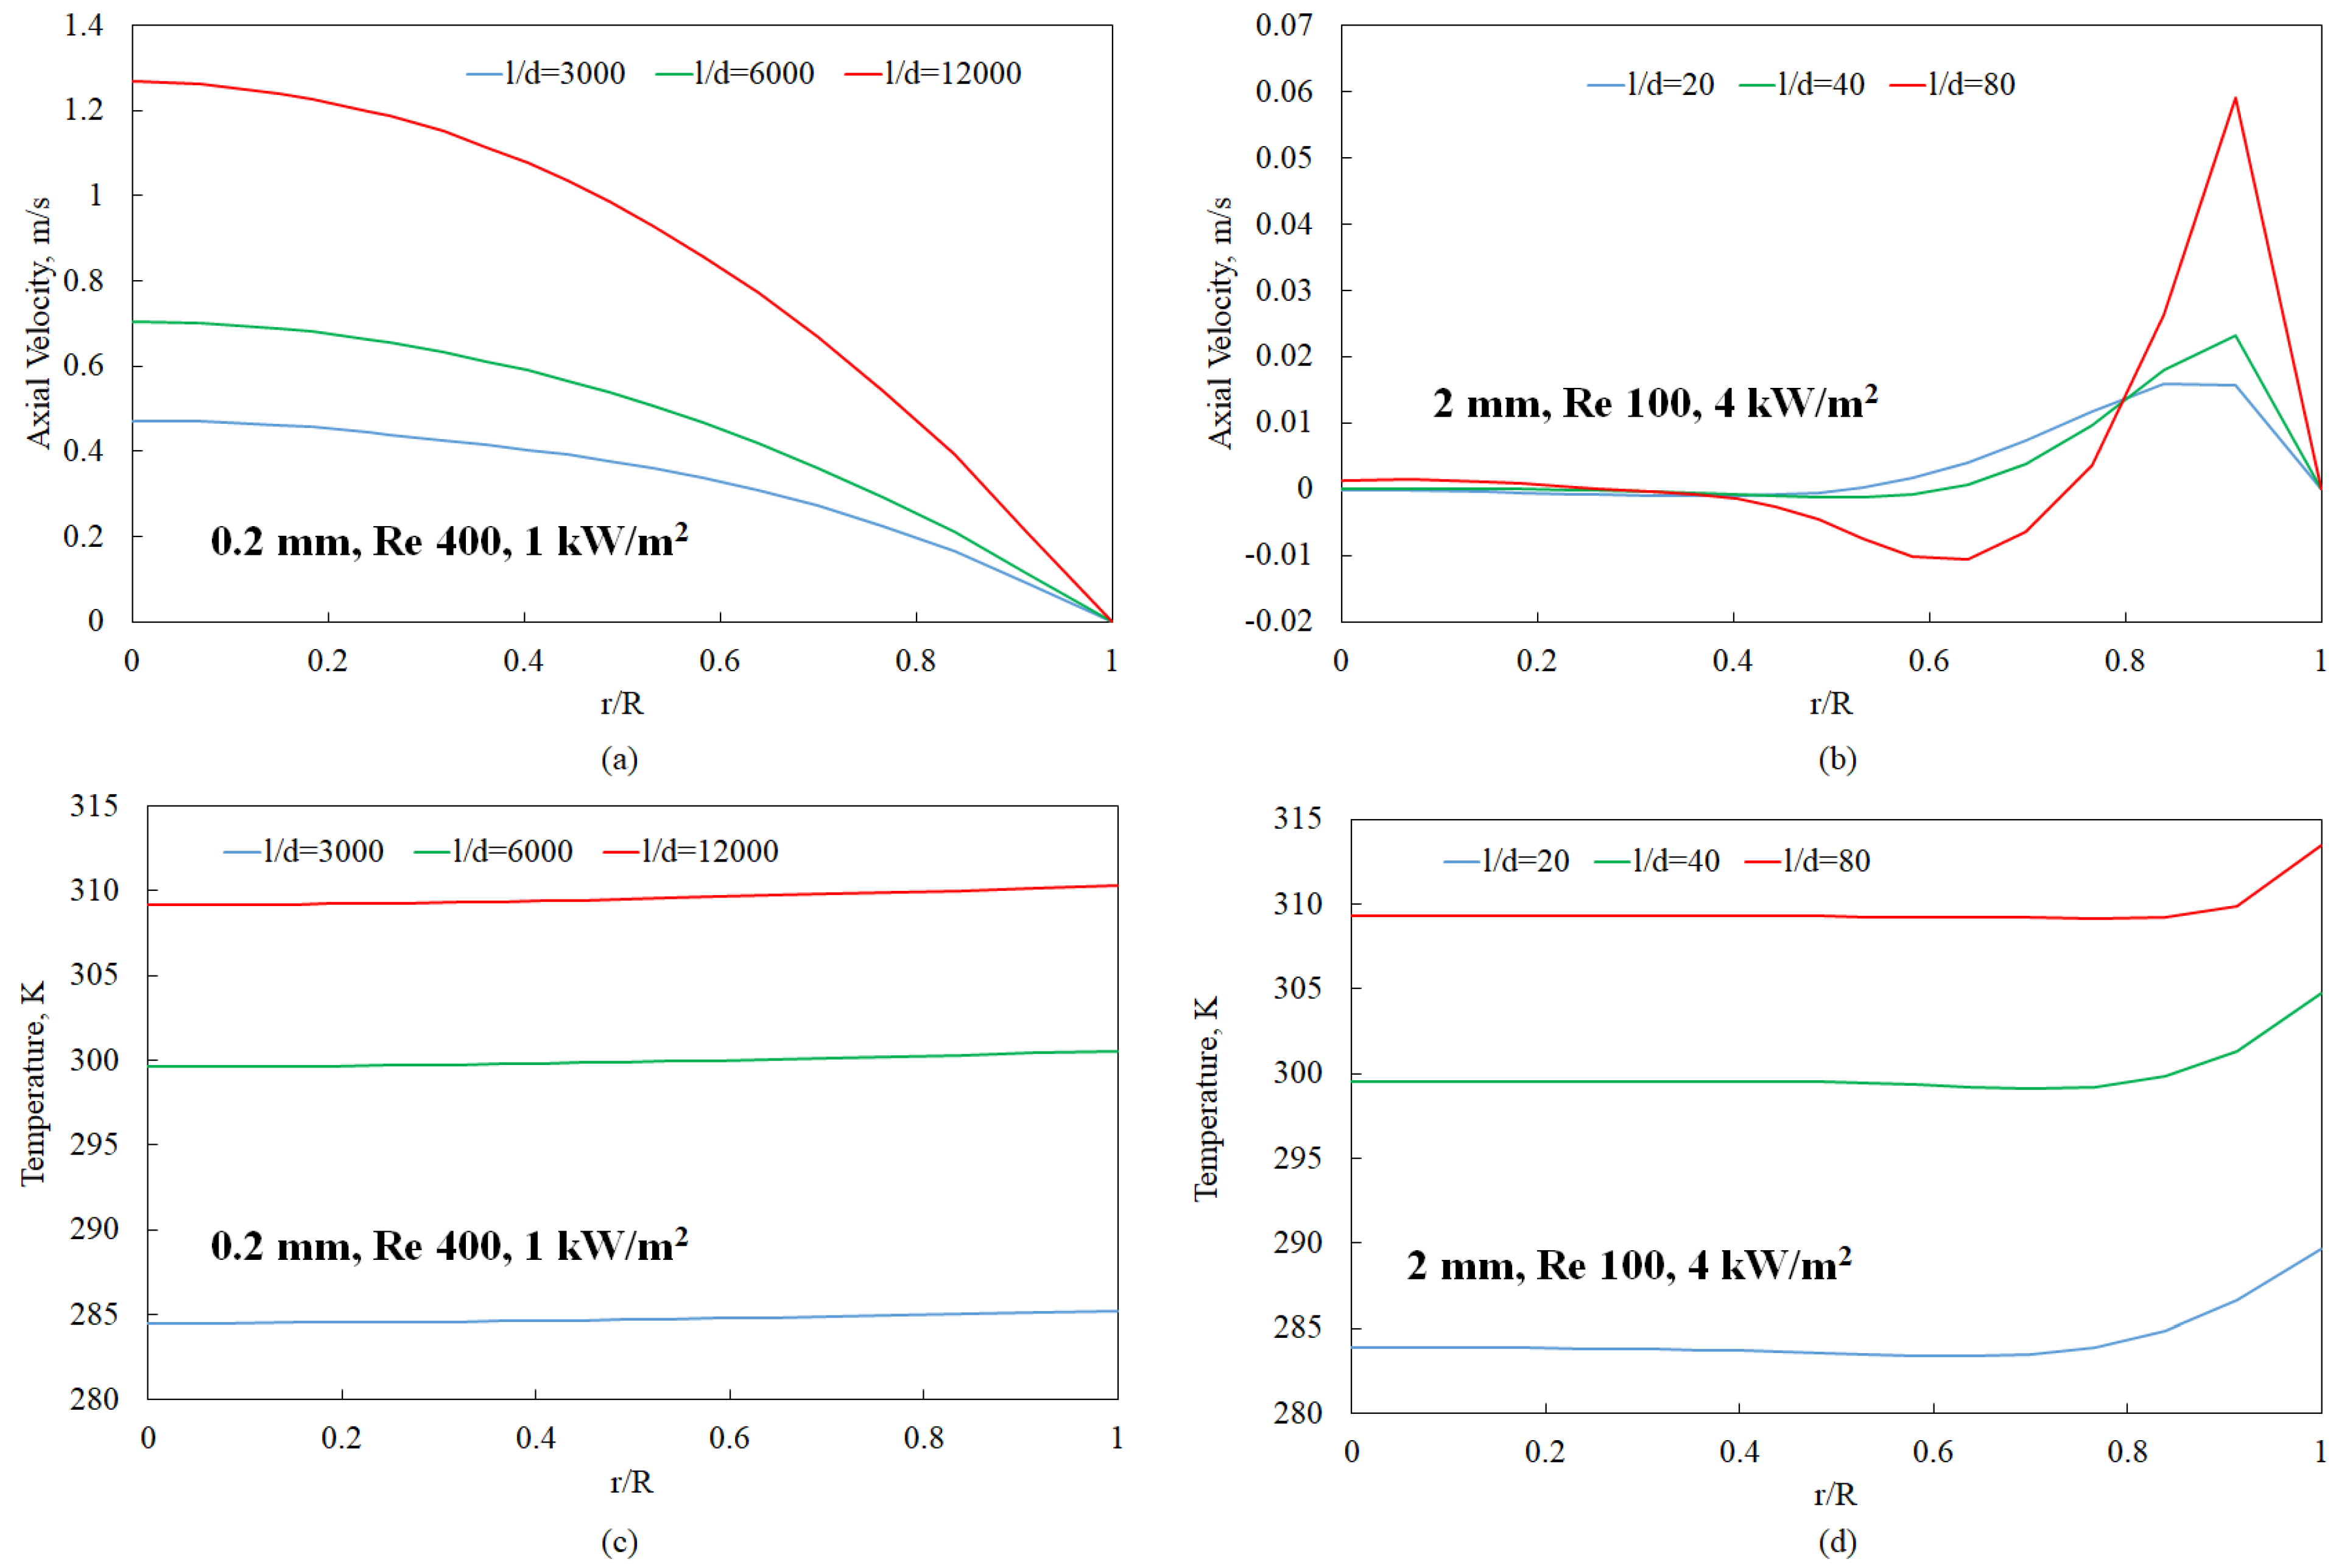
The velocity and temperature profiles associated with the conditions at which minimum (Figure 6a) and maximum (Figure 6f) buoyancy effects were encountered in this study are shown in Figure 7.
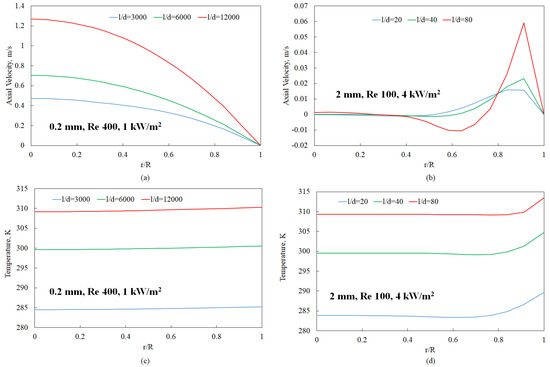
Figure 7.
Axial velocity and temperature profiles at different axial locations (indicated by distances from the inlet (l) over diameter (d) ratios). The radial locations are specified as the distance from the tube center (r) over the tube diameter (R): (a) 0.2 mm diameter tube, axial velocity; (b) 2 mm diameter tube, axial velocity; (c) 0.2 mm diameter tube, temperature; (d) 2 mm diameter tube, temperature.
The axial locations indicated by distance from inlet (l) over diameter (d) ratios were specifically chosen so that the sCO2 temperatures were nearly identical across the two scenarios. In the minimum buoyancy scenario (0.2 mm, 1 kW/m2, Re 400), the velocity profiles are parabolic at all axial locations, corresponding to fully developed flow conditions associated with constant property fluids. As shown in Figure 3a, Nu profiles associated with the 0.2 mm diameter tube are indeed closer to the 4.36 value associated with constant property fluid heat transfer rates. A flow acceleration is noted in Figure 7a due to a decrease in density from 280 K to 310 K (cf. Figure 1a). In contrast, the maximum buoyancy scenario (2 mm, 4 kW/m2, Re 100) shows an axially evolving velocity profile (Figure 7b). In particular, the flow acceleration near the walls (r/R = 1) due to the effects of buoyancy when the bulk temperature is near TPC (~309 K) is to be noted, as this leads to enhanced heat transfer rates (cf. Figure 2c) for this tube diameter.
3.3. A New Correlation for Laminar Mixed Convection sCO2 Heat Transfer
Figure 2, Figure 3 and Figure 5 indicate that the Nu variations are proportional to Gr and inversely proportional to Re. Therefore, a preliminary attempt to fit the Nu versus bulk temperature data in Figure 2 and Figure 3 was made by resorting to the functional form:
where A and B are constants. It is worth noting that Equation (11) is functionally similar to the correlation used by Jackson et al. [21] for laminar, mixed convection flow involving subcritical water in a vertically heated tube. However, a heat flux-based Gr was employed in that correlation, and the values of A and B were 0.95 and 0.28, respectively. In this study, the value of A was set to 1.0, and the value of B was ascertained at different pipe diameters. A best fit was determined with the goal of minimizing the mean absolute percentage error (MAPE) for each scenario, based on Equation (12).
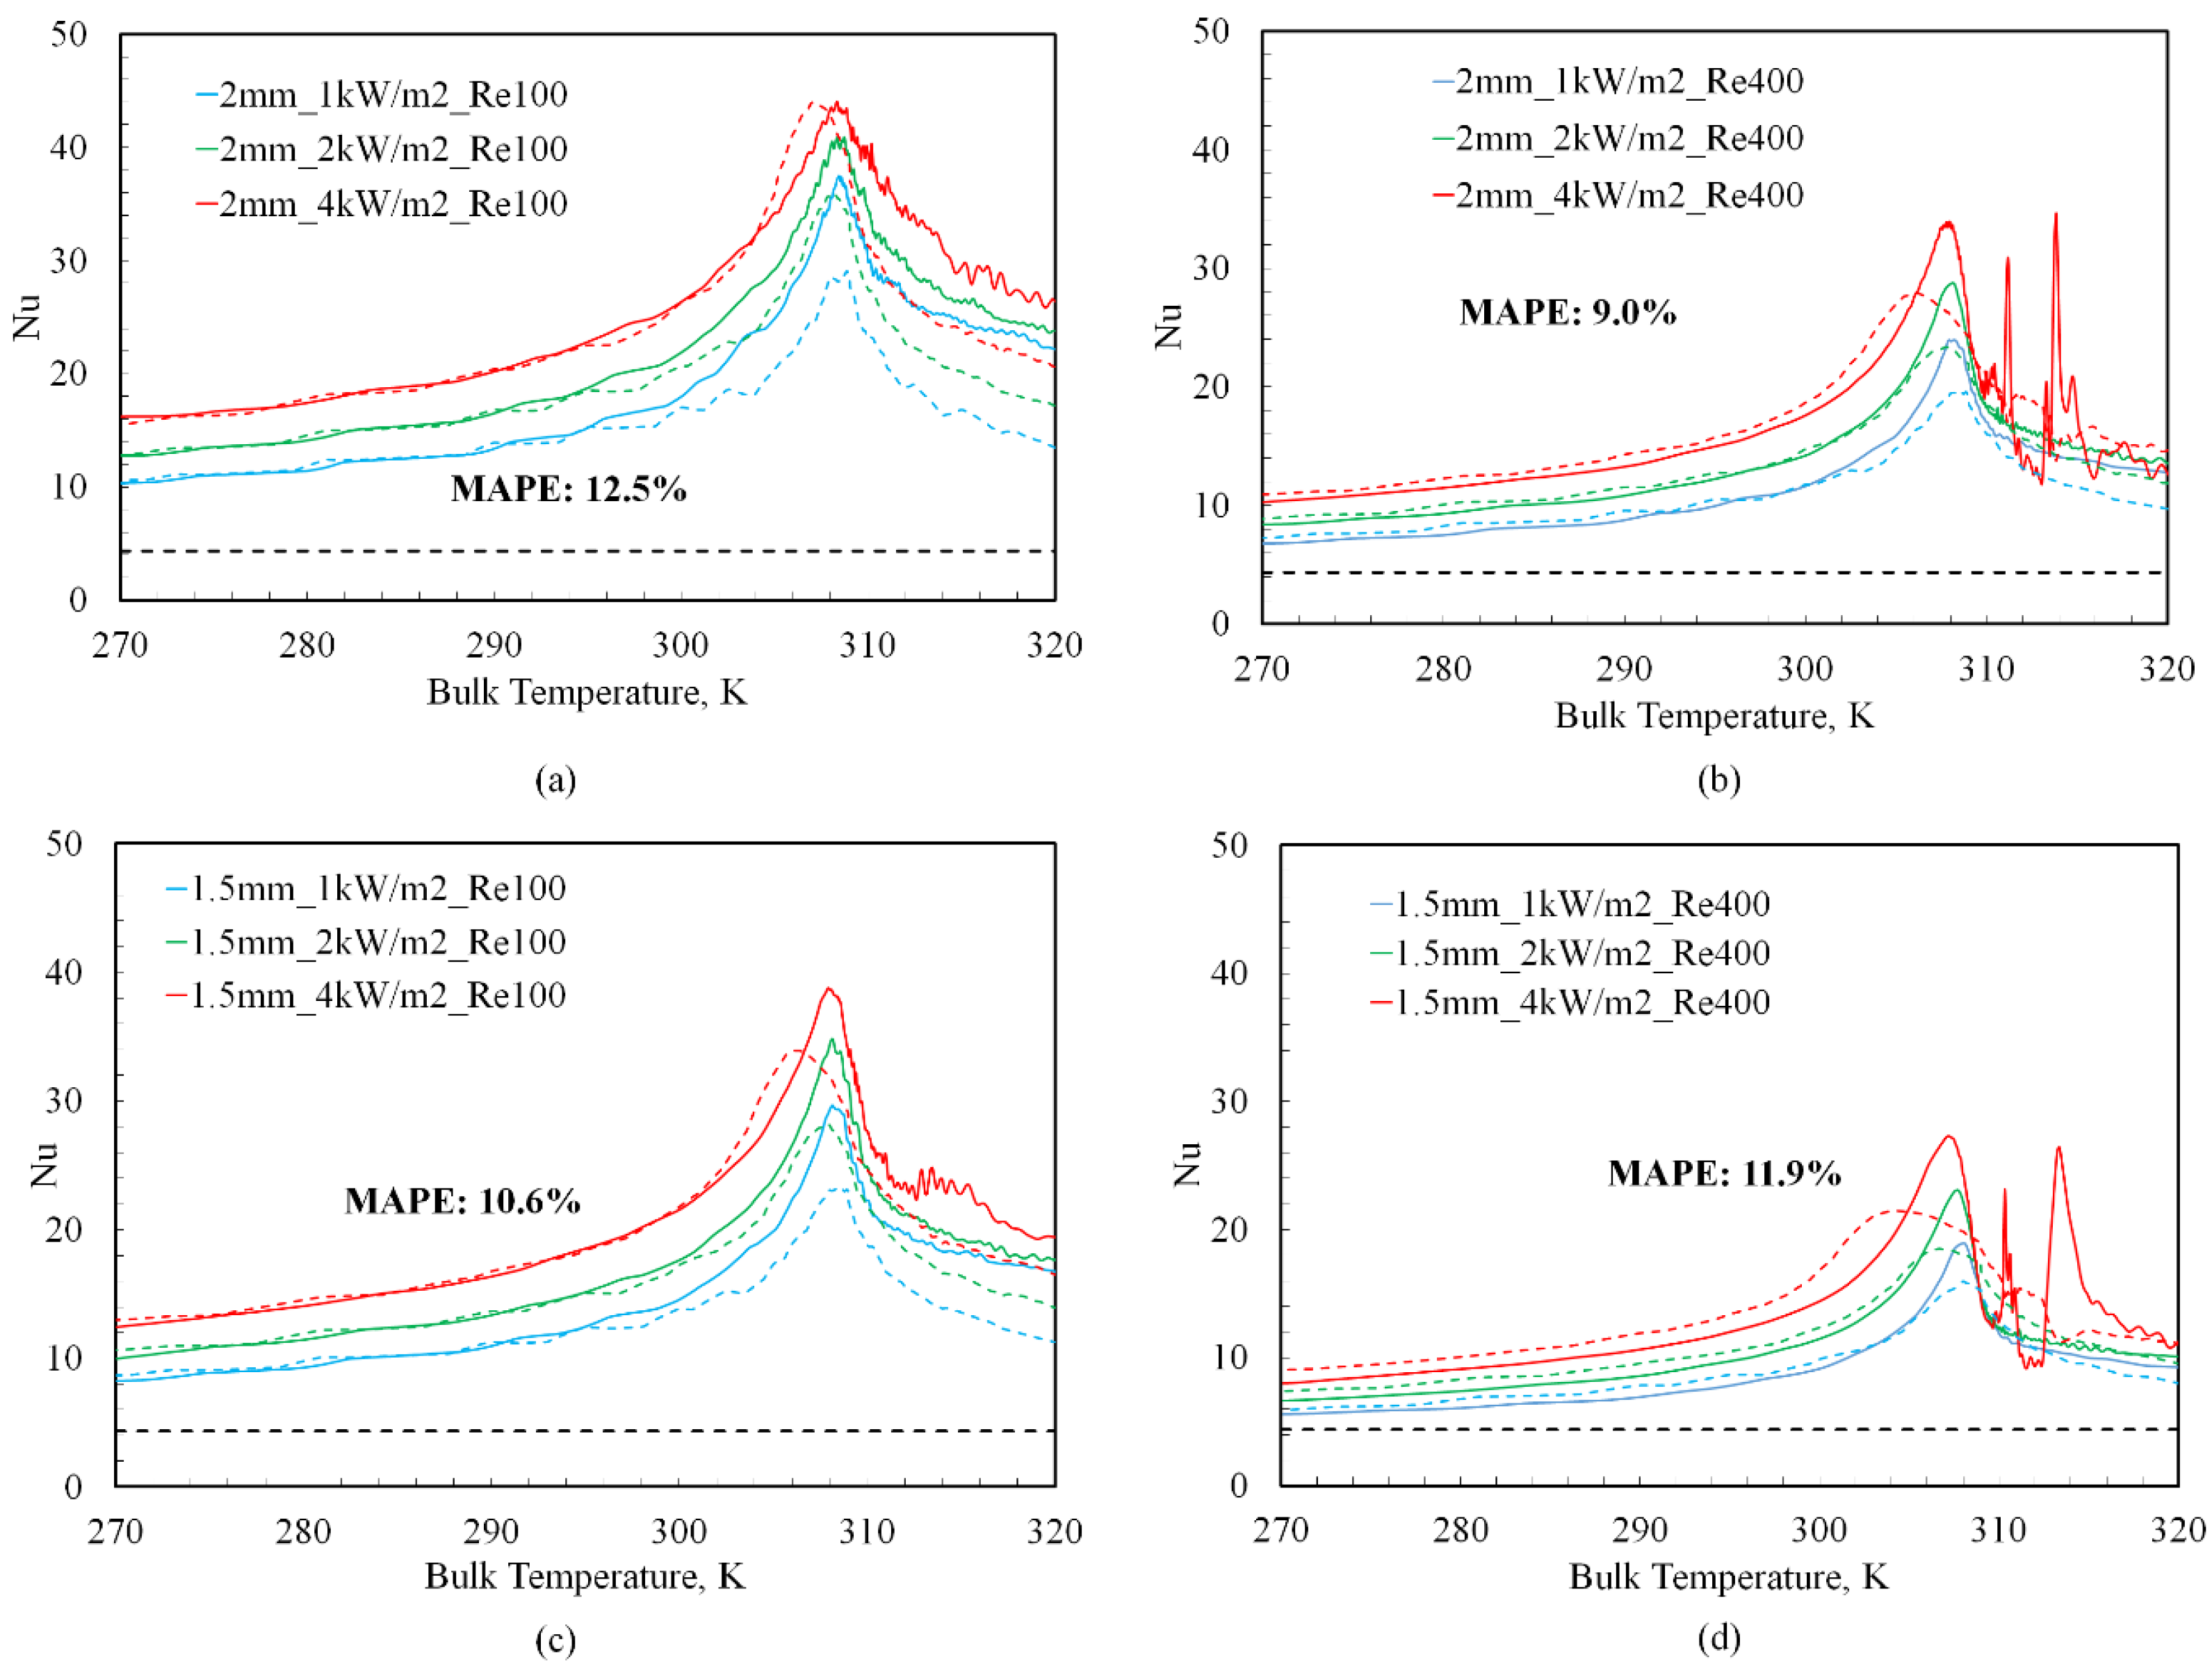
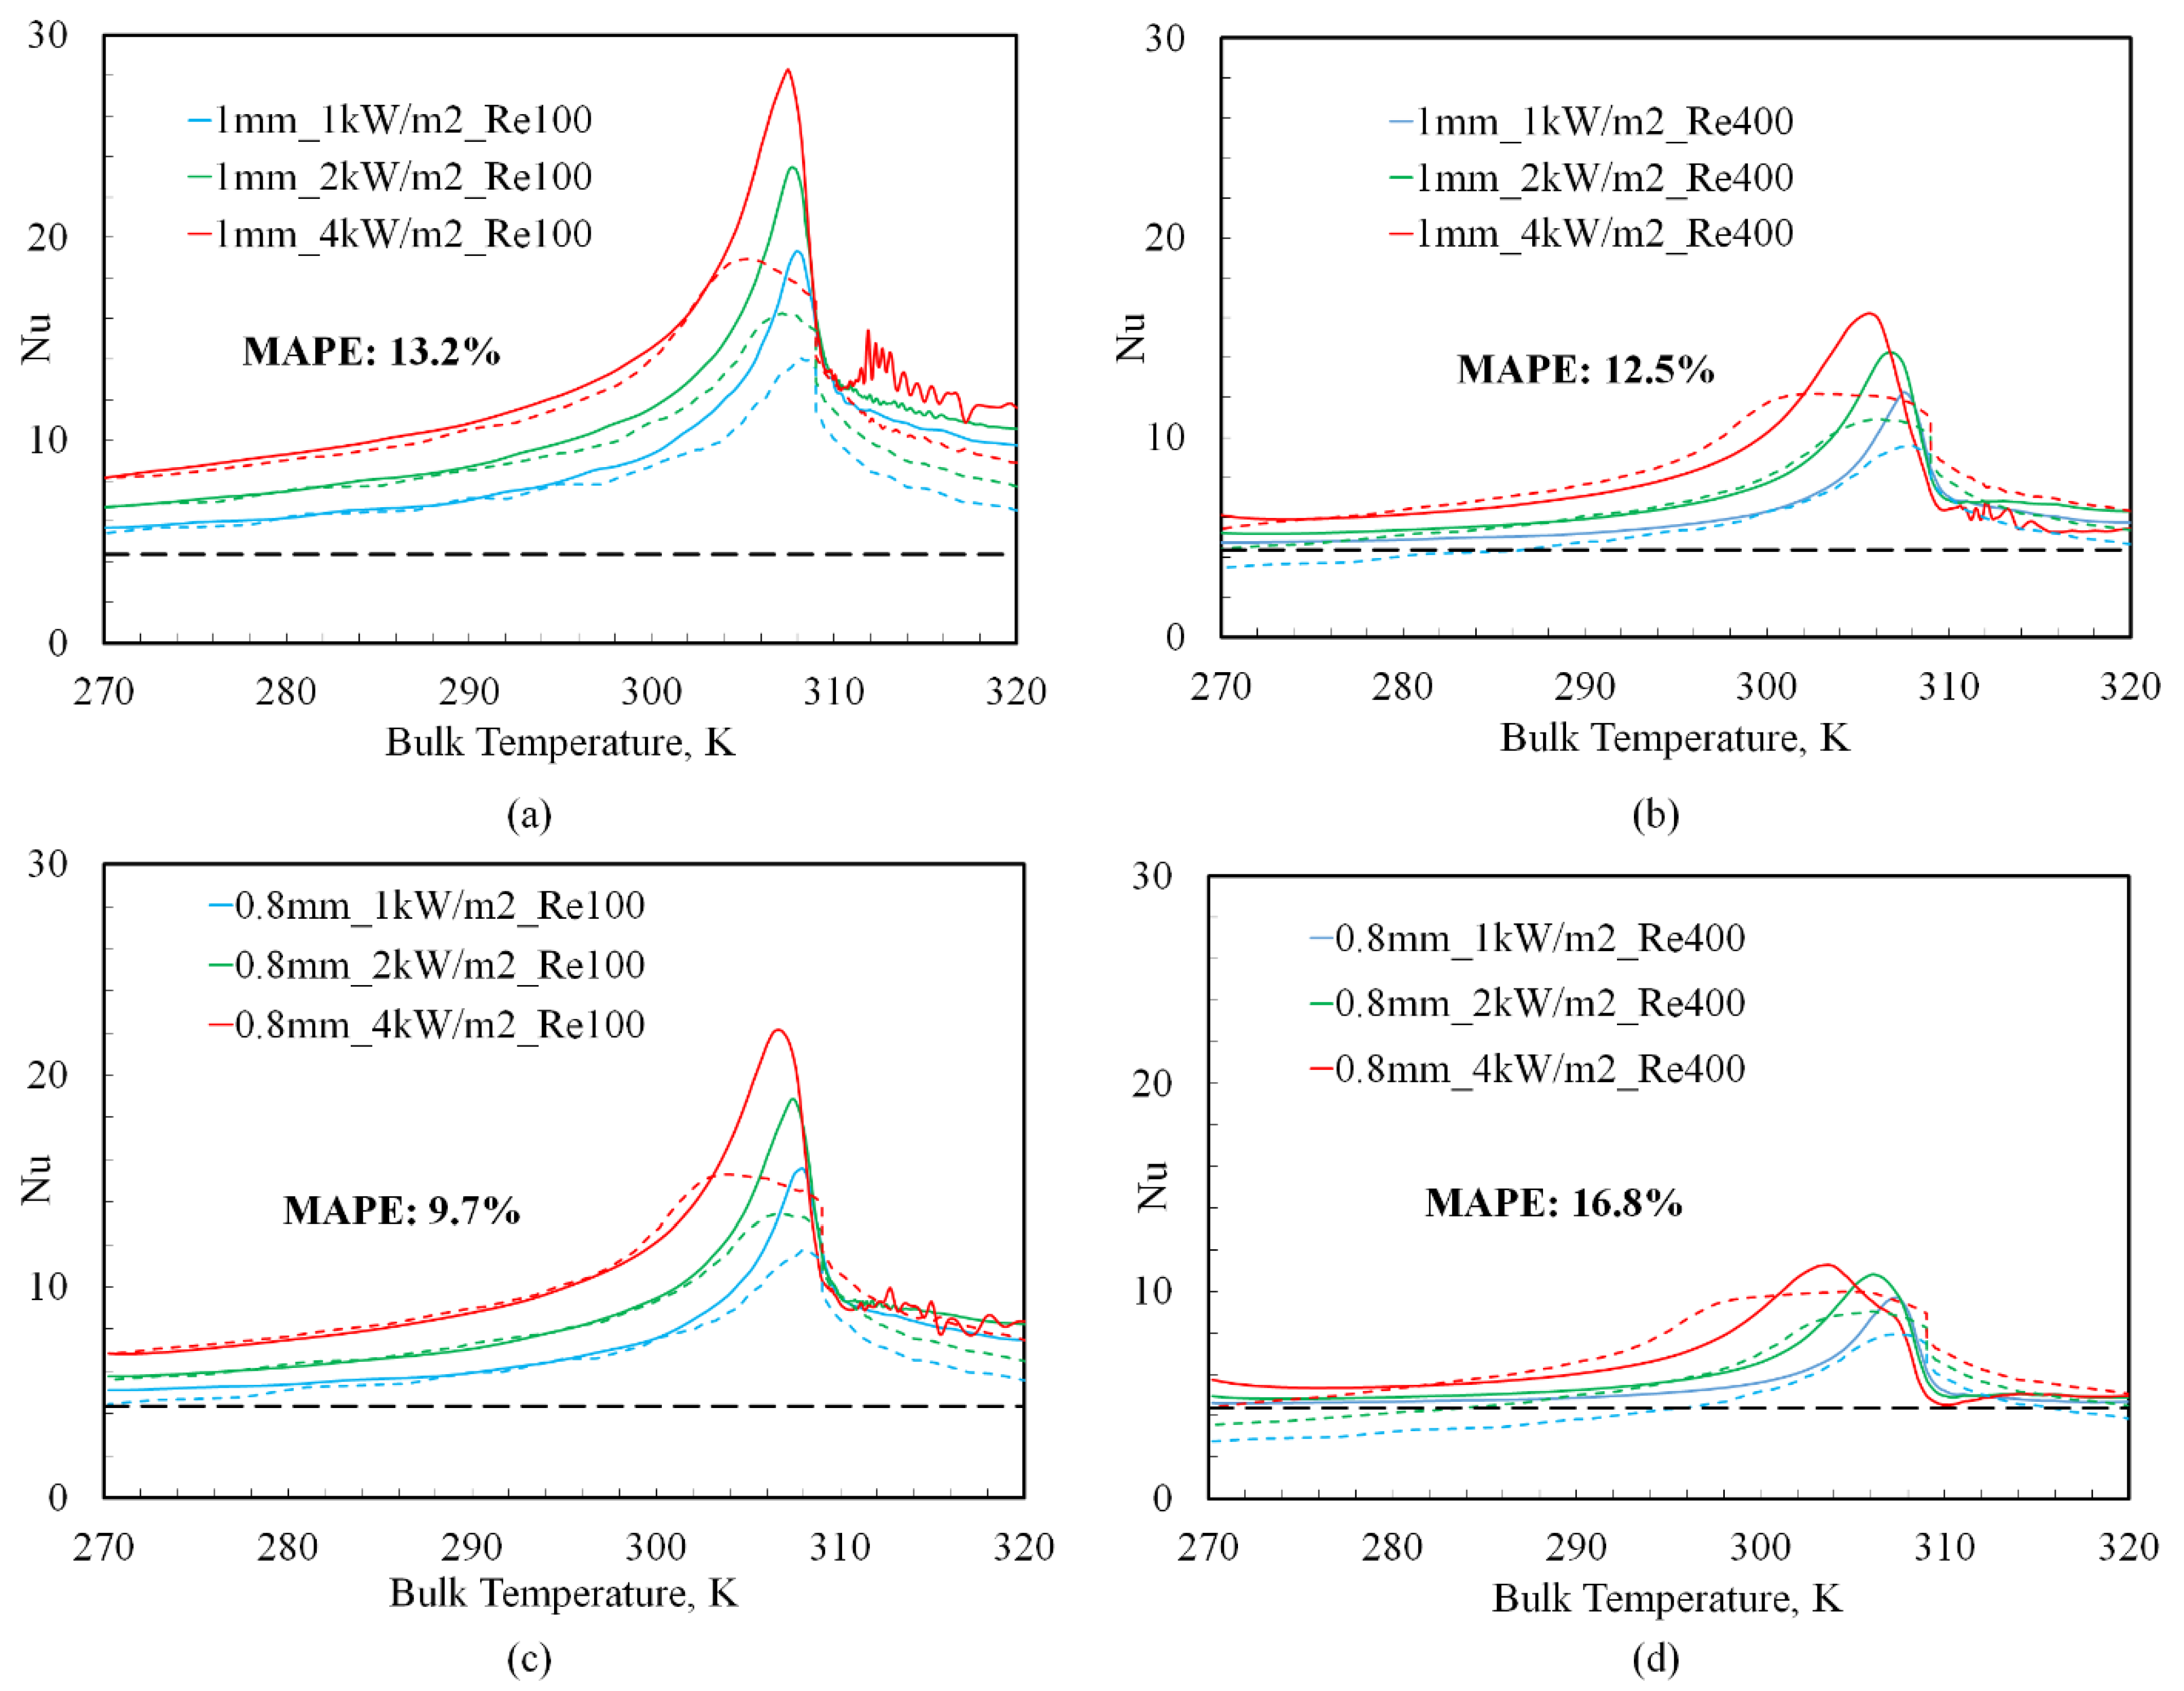
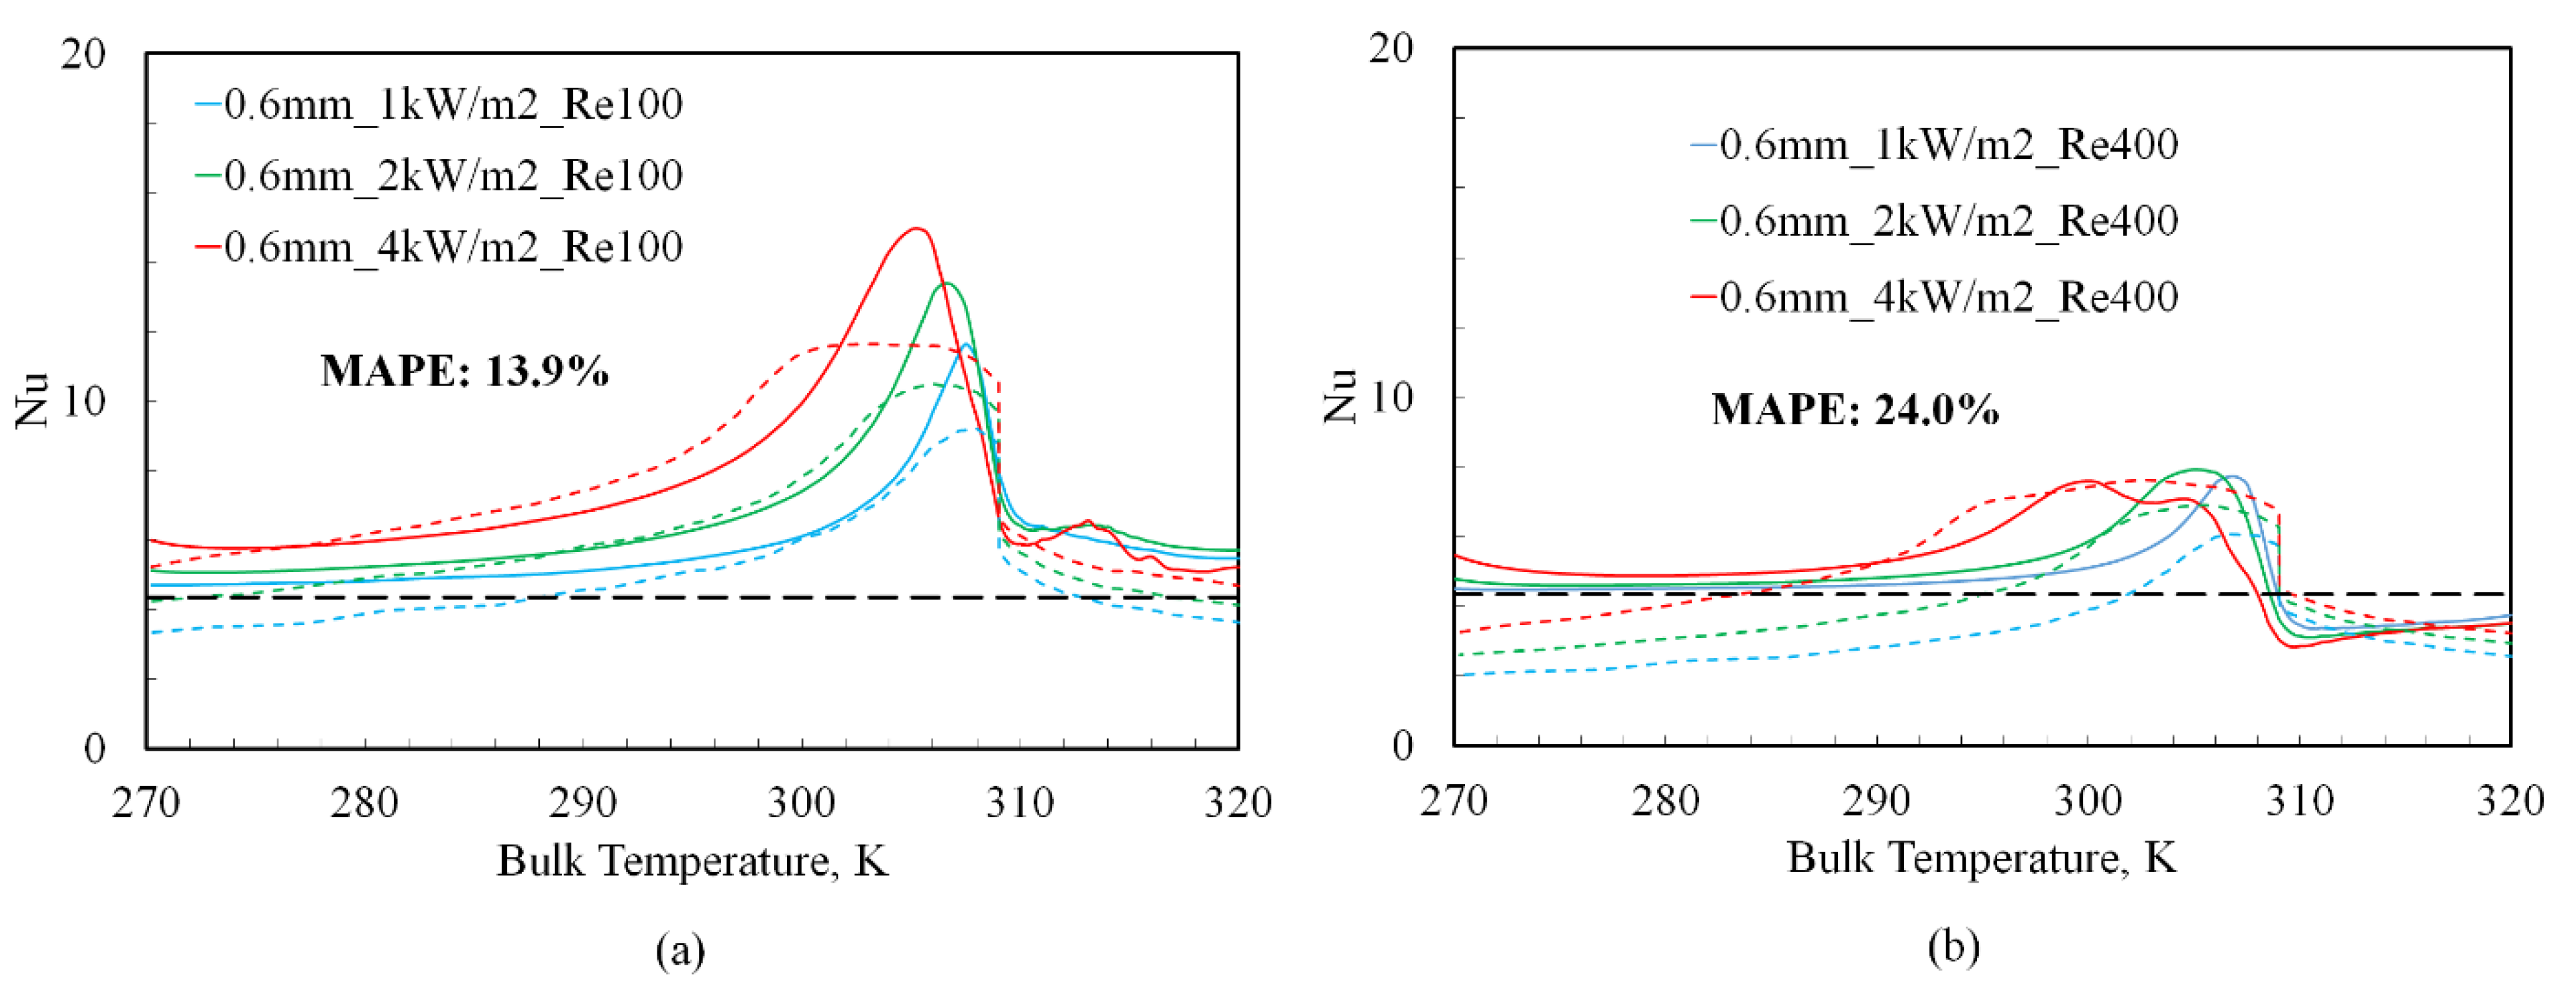
The correlation predictions for different tube diameters are shown as dotted lines in Figure 8, Figure 9 and Figure 10. In the region where TBULK < TPC, the constant “B” was found to be mildly sensitive to the tube diameter, varying from 0.39 for the 2 mm diameter tube to 0.37 for the 0.6 mm diameter tube. However, in the region where TBULK > TPC, “B” varied from 0.39 (for the 2 mm diameter) to 0.3 (for the 0.6 mm diameter), respectively. While this range in the values of B (0.3–0.39) is comparable to the B value of 0.28 reported in Jackson et al. [21], this likely points to a need for two distinct correlations above and below TPC for laminar mixed convection heat transfer. Such an approach of proposing two correlations, above and below TPC, has been adopted for the turbulent flow regions by other authors as well [5,6]. The correlation is seen to fit the observed data with a MAPE < 15% in all regions where Gr/Re2.7 > 10−3. However, note that the Re 400 scenarios for both 0.6 mm and 0.8 mm diameter tubes have large regions where Gr/Re2.7 < 10−3 (cf. Figure 6b and Figure 6c, respectively), which translates to larger errors, as shown in Figure 8d and Figure 9b, respectively. While correlations of improved accuracies may be obtained by incorporating the effects of additional variables in Equation (11), the simple functional form of this equation represents a useful starting point for these endeavors.
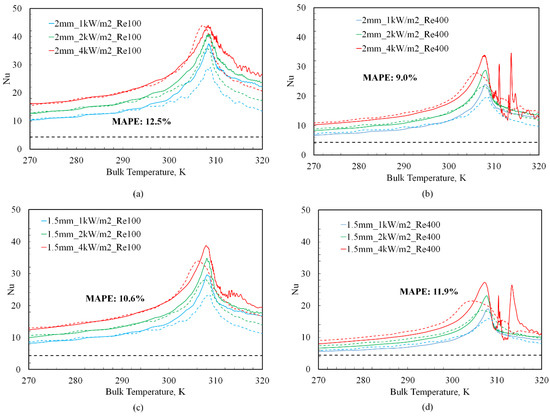
Figure 8.
Equation (11) based predictions of Nu (dotted lines) versus bulk temperature (TBULK) at tube diameters of 2 mm and 1.5 mm and different inlet Re: (a) 2 mm, Re 100; (b) 2 mm, Re 400; (c) 1.5 mm, Re 100; (d) 1.5 mm, Re 400. CFD-based Nu calculations are shown in bold lines. The values of B in Equation (11) were: 0.39 for TBULK< TPC and 0.39 for TBULK> TPC.
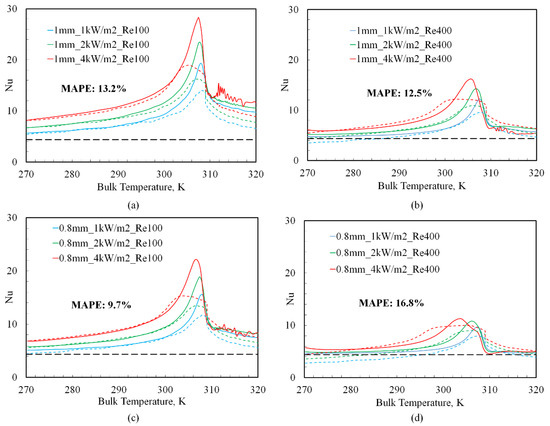
Figure 9.
Equation (11) based predictions of Nu (dotted lines) versus bulk temperature (TBULK) at tube diameters of 1 mm and 0.8 mm and different inlet Re: (a) 1 mm, Re 100; (b) 1 mm, Re 400; (c) 0.8 mm, Re 100; (d) 0.8 mm, Re 400. CFD-based Nu calculations are shown in bold lines. The values of B in Equation (11) were: 0.37 for TBULK< TPC and 0.35 for TBULK> TPC.
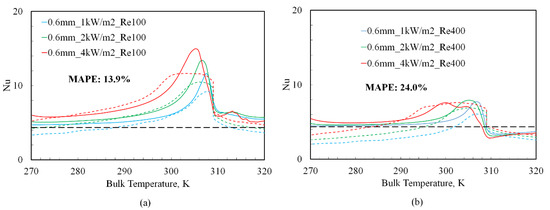
Figure 10.
Equation (11) based predictions of Nu (dotted lines) versus bulk temperature (TBULK) at a tube diameter of 0.6 mm and different inlet Re: (a) 0.6 mm, Re 100; (b) 0.6 mm, Re 400. The values of B in Equation (10) w ere: 0.37 for TBULK < TPC and 0.30 for TBULK > TPC.
4. Conclusions
This study demonstrates that the effects of buoyancy in vertical upward laminar flows can result in an augmentation in heat transfer rates to supercritical CO2 (sCO2) near its pseudocritical temperature (TPC). This is in contrast to corresponding (upward) flows in the turbulent regime, or laminar sCO2 flows (with minimum buoyancy effects) where a deterioration in heat transfer near TPC has been observed. To exploit these sCO2 heat transfer enhancement characteristics and improve heat exchange efficiencies, the location of the TPC pinch point and the variables controlling these buoyancy effects need to be identified. After highlighting the lack of heat transfer correlations for laminar sCO2 upward flows, numerical simulations of sCO2 (at inlet 8.2 MPa, 265 K) in vertical circular tubes of diameters (D) of 0.2–2 mm, heated with constant wall heat fluxes (Q) of 1–4 kW/m2) and inlet Reynolds (Re) numbers of 100, 400 were carried out to fill this void. The tube lengths were varied to maintain an exit temperature of 320 K (TPC~309 K). This corresponds to an approximately six-fold increase in Re from the inlet to the outlet. The following conclusions can be drawn from this study:
- When 265 K < TBULK < 285 K, the thermophysical property variations are gradual, and the local Nu should ideally approach the value of 4.36. However, this was observed to be true only for tube diameter of 0.2 mm. At tube diameters greater than 0.2 mm, the local Nu in this bulk temperature region was greater than 4.36 and was also a function of tube diameter (D), the imposed heat flux (Q), and inlet Re. Further, the local Nu was inversely proportional to the Re and directly proportional to tube diameter and heat flux. This indicates the role played by buoyancy and Gr in this region. This is because, in addition to the direct dependence of Gr on the third-power of the tube diameter, an increase in heat flux increases the temperature difference between the wall and the bulk fluid and therefore, the density differences evaluated at these two temperatures. The fact that Nu was dependent on the inlet Re is in contrast with the results of our previous study (carried out without considering the effect of gravity) [14], which showed that Nu attains identical values, as long as “Q * D” was held constant and was independent of inlet Re.
- When 285 K < TBULK < 310 K, the thermophysical properties vary significantly, and Nu increases sharply (beyond 4.36). The extent of these Nu deviations (from 4.36), before and after TPC, were again found to be functions of the imposed heat fluxes, the tube diameter, and the inlet Re. Again, the local Nu was inversely proportional to the Re and directly proportional to the tube diameters and heat fluxes in this region.
- When TBULK > 325 K, the thermophysical property variations are gradual and asymptotically approach different values, depending on the imposed heat flux and tube diameters, pointing to buoyancy effects upstream affecting the flow behavior downstream.
- The Grashof (Gr) numbers vary sharply (by nearly two orders of magnitude) from 270 K to TPC, followed by a gradual reduction beyond TPC. Further, they were sensitive to the imposed fluxes and inlet Re, pointing to the important role played by TWALL in the observed behavior. While Gr increases with tube diameter (through its obvious third-power dependency), its magnitude across all scenarios was in the range of 102–107, which is well within the 109 laminar to turbulence transition limit for constant property fluids undergoing natural convection.
- The results indicate that buoyancy augmented laminar heat transfer rates may be expected when Gr/Re2.7 > 10−4 (Gr = Grashof number).
- A modified Nusselt number correlation in terms of (Gr/Re) is proposed and is determined to fit the observed variations within a mean absolute percentage error <15%, in most regions. While the correlation is functionally similar, with constants close to other correlations proposed for laminar, mixed convection flow involving subcritical water in a vertically heated tube, the equation identifies the major variables associated with buoyancy-induced heat transfer augmentation in the laminar regime and provides a starting point for formulating more complex correlations that incorporate additional variables for improved accuracies.
Author Contributions
Conceptualization, K.V. and G.K.; methodology, K.V.; software, K.V.; validation, K.V. and G.K.; formal analysis, K.V. and G.K.; investigation, K.V.; resources, K.V. and G.K.; data curation, K.V.; writing—original draft preparation, K.V.; writing—review and editing, K.V. and G.K.; visualization, K.V.; supervision, G.K.; project administration, G.K.; funding acquisition, G.K. All authors have read and agreed to the published version of the manuscript.
Funding
This research was partially funded through the Post-Doctoral Seed Funding Program administered by the Office of the Vice President for Research and Economic Development at the University of North Dakota.
Data Availability Statement
All data that is relevant to this study is contained within the article. Any additional supplemental information that is needed is available upon request from the corresponding author.
Conflicts of Interest
The authors declare no conflict of interest.
Nomenclature
| d | diameter, mm |
| G | inlet mass flow, kg/s |
| Gr | Grashof number |
| Hin | enthalpy at inlet, J/kg |
| Nu | Nusselt number |
| Pr | Prandtl number |
| q | heat flux, W/m2 |
| Re | Reynolds number |
| T | temperature, K |
| v | velocity, m/s |
| Greek Symbols: | |
| ρ | density, kg/m3 |
| Subscripts: | |
| in | inlet |
| PC | pseudocritical |
| t | turbulent |
| w | wall |
References
- Huang, D.; Wu, Z.; Sunden, B.; Li, W. A brief review on convection heat transfer of fluids at supercritical pressures in tubes and the recent progress. Appl. Energy 2016, 162, 494–505. [Google Scholar] [CrossRef]
- Wright, S.A.; Radel, R.F.; Vernon, M.E.; Rochau, G.E.; Pickard, P.S. Operation and Analysis of a Supercritical CO2 Brayton Cycle; Sandia Report, No. SAND2010-017l; Sandia National Laboratories: Livermore, CA, USA, 2010. [Google Scholar]
- Ma, Y.; Liu, Z.; Tian, H. A review of transcritical carbon dioxide heat pump and refrigeration cycles. Energy 2013, 55, 156–172. [Google Scholar] [CrossRef]
- Kandlikar, S.G. Fundamental issues related to flow boiling in minichannels and microchannels. Exp. Therm. Fluid Sci. 2002, 26, 389–407. [Google Scholar] [CrossRef]
- Lopes, N.C.; Chao, Y.; Dasarla, V.; Sullivan, N.P.; Ricklick, M.A.; Boetcher, S.K. Comprehensive Review of Heat Transfer Correlations of Supercritical CO2 in Straight Tubes Near the Critical Point: A Historical Perspective. J. Heat Transf. 2022, 144, 120801. [Google Scholar] [CrossRef]
- Ehsan, M.M.; Guan, Z.; Klimenko, A.Y. A comprehensive review on heat transfer and pressure drop characteristics and correlations with supercritical CO2 under heating and cooling applications. Renew. Sustain. Energy Rev. 2018, 92, 658–675. [Google Scholar] [CrossRef]
- Cheng, L.; Gherhardt, R.; Thome, J.R. Analysis of supercritical CO2 cooling in macro-and micro-channels. Int. J. Refrig. 2008, 31, 1301–1316. [Google Scholar] [CrossRef]
- Yoo, J.Y. The turbulent flows of supercritical fluids with heat transfer. Annu. Rev. Fluid Mech. 2013, 45, 495–525. [Google Scholar] [CrossRef]
- Huang, D.; Li, W. A brief review on the buoyancy criteria for supercritical fluids. Appl. Therm. Eng. 2018, 131, 977–987. [Google Scholar] [CrossRef]
- Cao, X.L.; Rao, Z.H.; Liao, S.M. Laminar convective heat transfer of supercritical CO2 in horizontal miniature circular and triangular tubes. Appl. Therm. Eng. 2011, 31, 2374–2384. [Google Scholar] [CrossRef]
- Liao, S.M.; Zhao, T.S. A numerical investigation of laminar convection of supercritical carbon dioxide in vertical mini/micro tubes. Prog. Comput. Fluid Dyn. Int. J. 2002, 2, 144–152. [Google Scholar] [CrossRef]
- Zhang, X.R.; Yamaguchi, H. Forced convection heat transfer of supercritical CO2 in a horizontal circular tube. J. Supercrit. Fluids 2007, 41, 412–420. [Google Scholar] [CrossRef]
- Dang, C.; Hihara, E. Numerical study on in-tube laminar heat transfer of supercritical fluids. Appl. Therm. Eng. 2010, 30, 1567–1573. [Google Scholar] [CrossRef]
- Viswanathan, K.; Krishnamoorthy, G. The effects of wall heat fluxes and tube diameters on laminar heat transfer rates to supercritical CO2. Int. Commun. Heat Mass 2021, 123, 105197. [Google Scholar] [CrossRef]
- ANSYS, Inc. ANSYS Fluent Theory Guide; Release 19.1; ANSYS, Inc.: Canonsburg, PA, USA, 2018. [Google Scholar]
- Lemmon, E.W.; Huber, M.L.; McLinden, M.O. NIST Reference Fluid Thermodynamic and Transport Properties—REFPROP; U.S. Department of Commerce: Gaithersburg, ML, USA, 2010.
- Jackson, D.; Hall, W.B. Influence of buoyancy on heat transfer to fluids flowing in vertical tubes under turbulent conditions. Turbul. Forced Convect. Channels Bundles 1979, 2, 613–640. [Google Scholar]
- Abdul-Sater, H.; Krishnamoorthy, G. An assessment of radiation modeling strategies in simulations of laminar to transitional, oxy-methane, diffusion flames. Appl. Therm. Eng. 2013, 61, 507–518. [Google Scholar] [CrossRef]
- Zaim, E.H.; Nassab, S.A.G. Numerical investigation of laminar forced convection of water upwards in a narrow annulus at supercritical pressure. Energy 2010, 35, 4172–4177. [Google Scholar] [CrossRef]
- Kang, G.U.; Chung, B.J. The experimental study on transition criteria of natural convection inside a vertical pipe. Int. Commun. Heat Mass Transf. 2010, 37, 1057–1063. [Google Scholar] [CrossRef]
- Jackson, J.D.; Cotton, M.A.; Axcell, B.P. Studies of mixed convection in vertical tubes. Int. J. Heat Fluid Flow 1989, 10, 2–15. [Google Scholar] [CrossRef]

Disclaimer/Publisher’s Note: The statements, opinions and data contained in all publications are solely those of the individual author(s) and contributor(s) and not of MDPI and/or the editor(s). MDPI and/or the editor(s) disclaim responsibility for any injury to people or property resulting from any ideas, methods, instructions or products referred to in the content. |
© 2023 by the authors. Licensee MDPI, Basel, Switzerland. This article is an open access article distributed under the terms and conditions of the Creative Commons Attribution (CC BY) license (https://creativecommons.org/licenses/by/4.0/).