
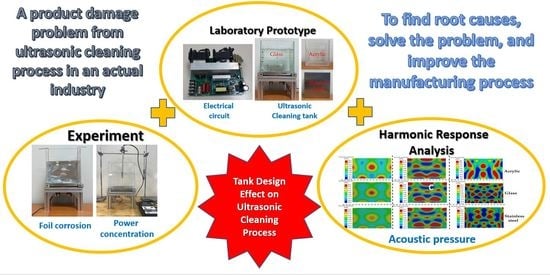
Harmonic Response Analysis of Tank Design Effect on Ultrasonic Cleaning Process


Abstract
:
1. Introduction
2. Theoretical Background
2.1. Harmonic Response Analysis (HRA) and Ultrasonic Cleaning
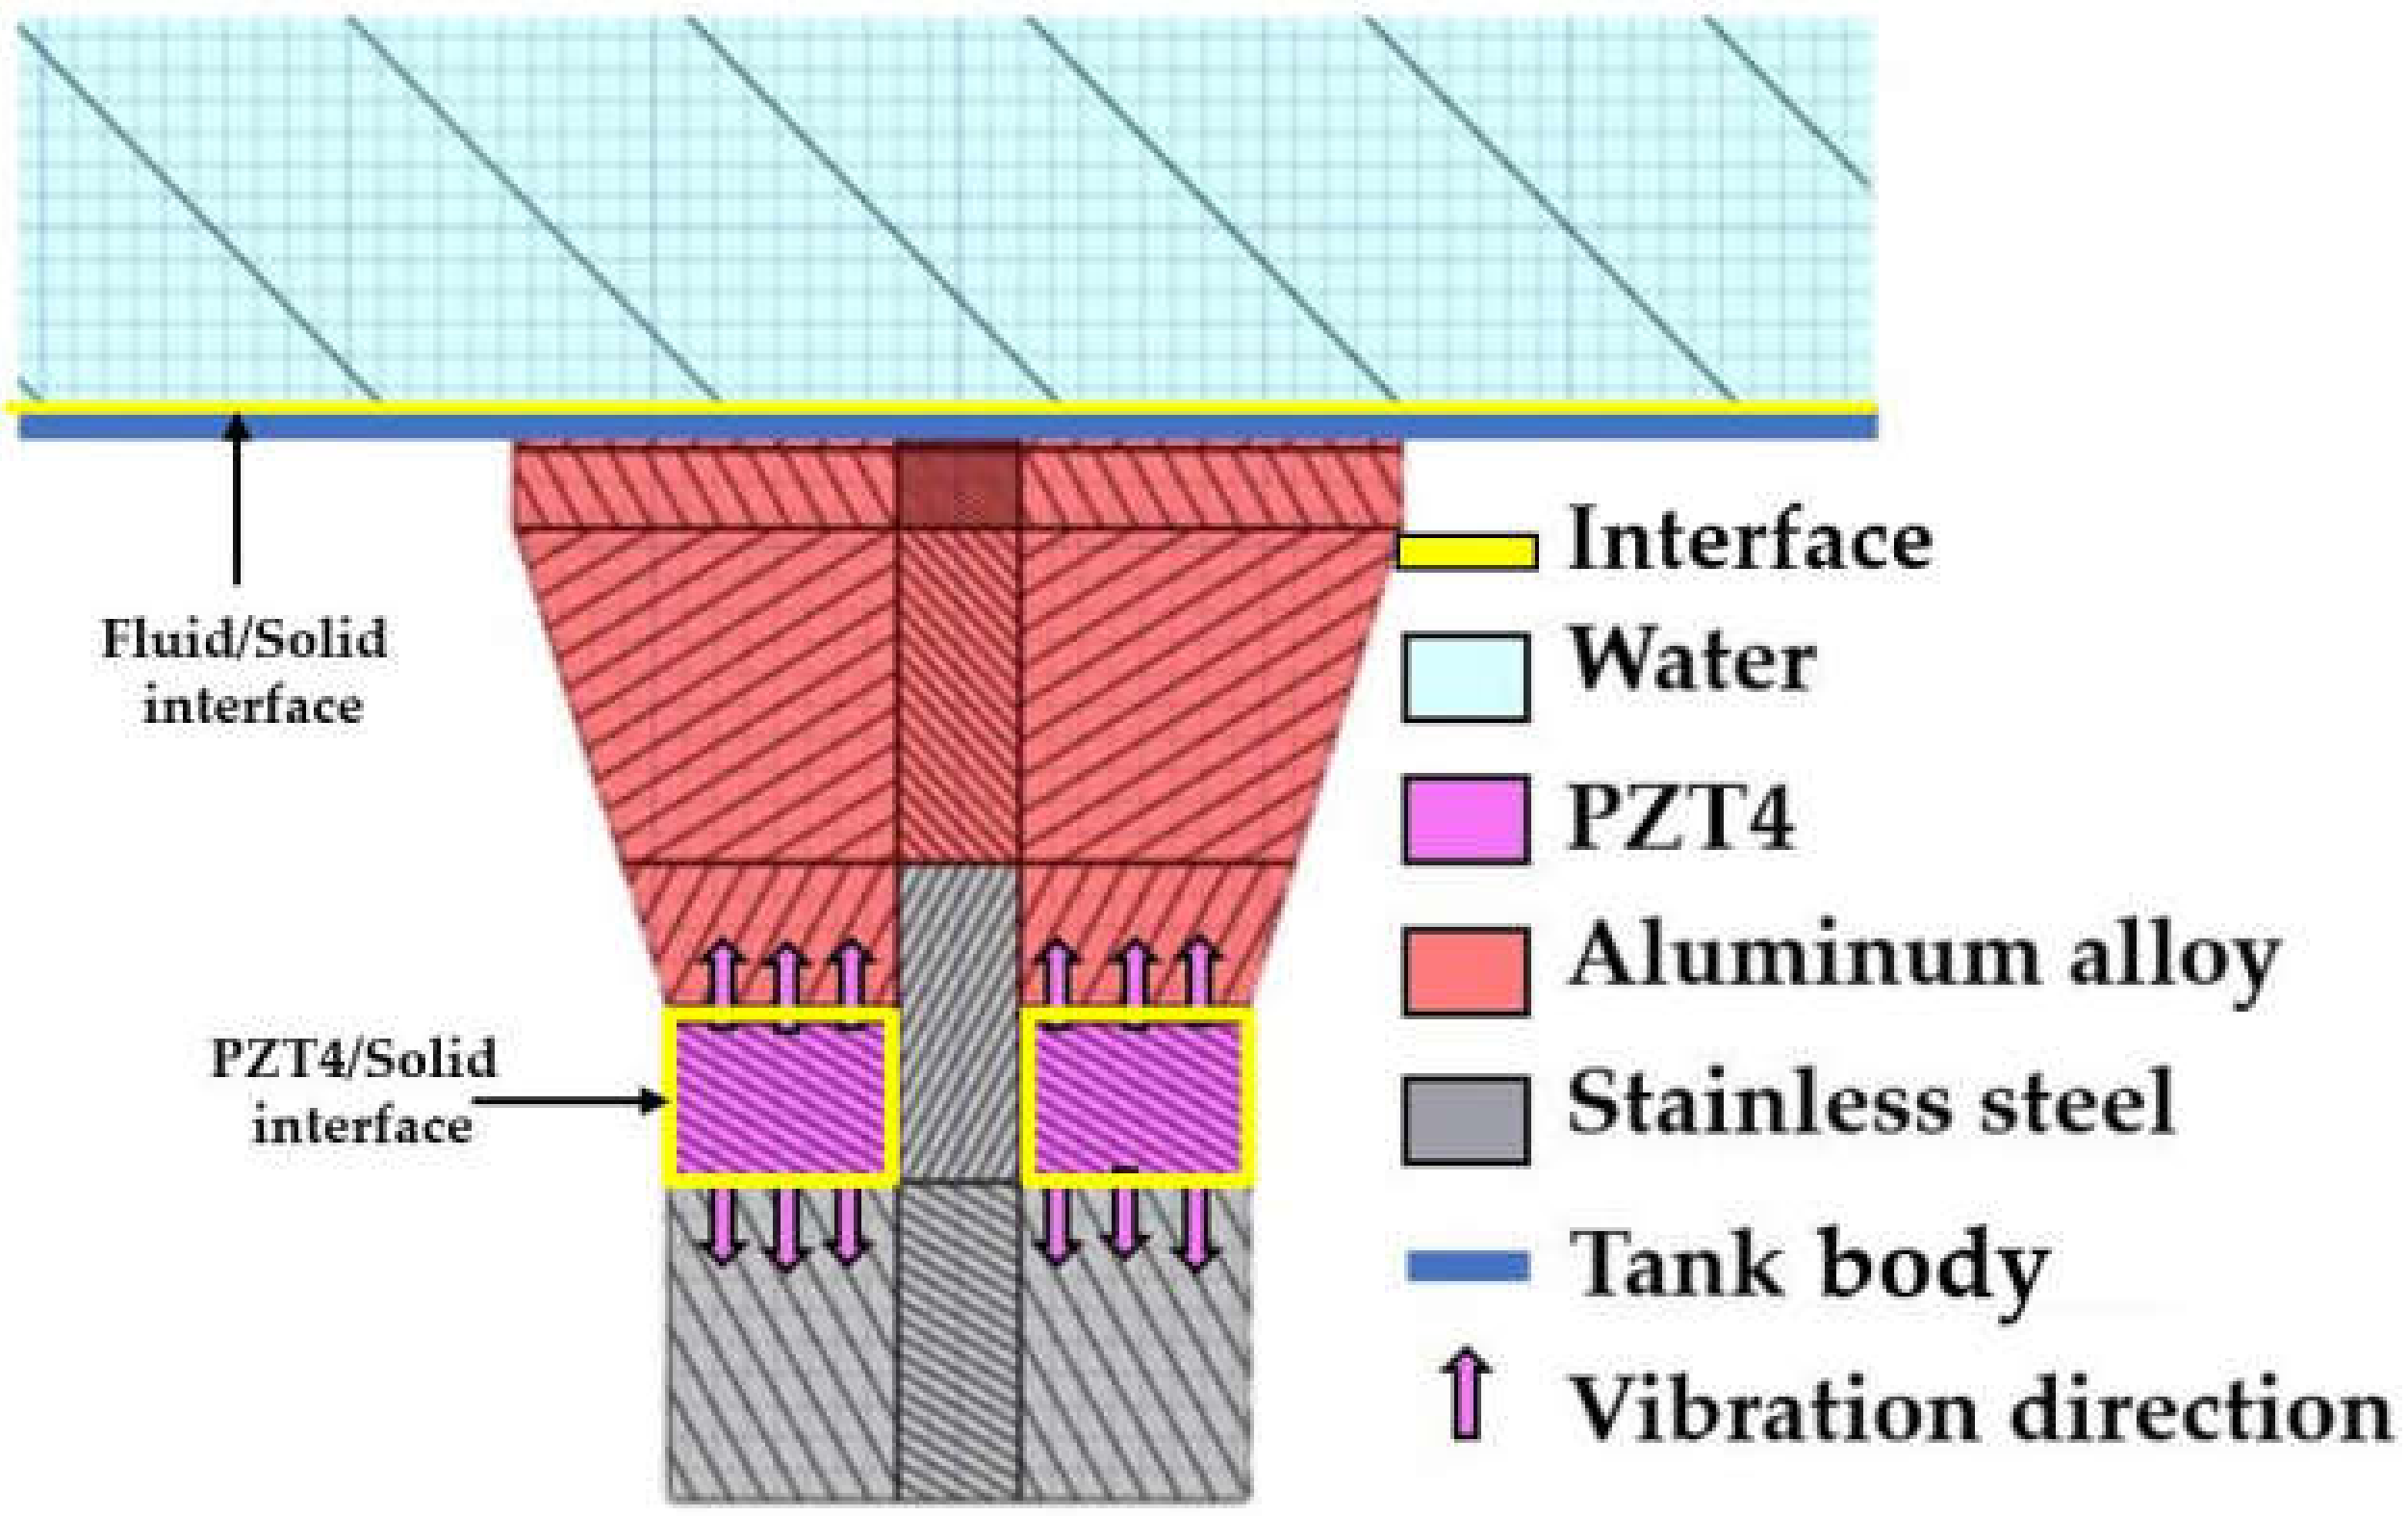
2.2. Reflection, Transmission, and Vibration, in the UCT
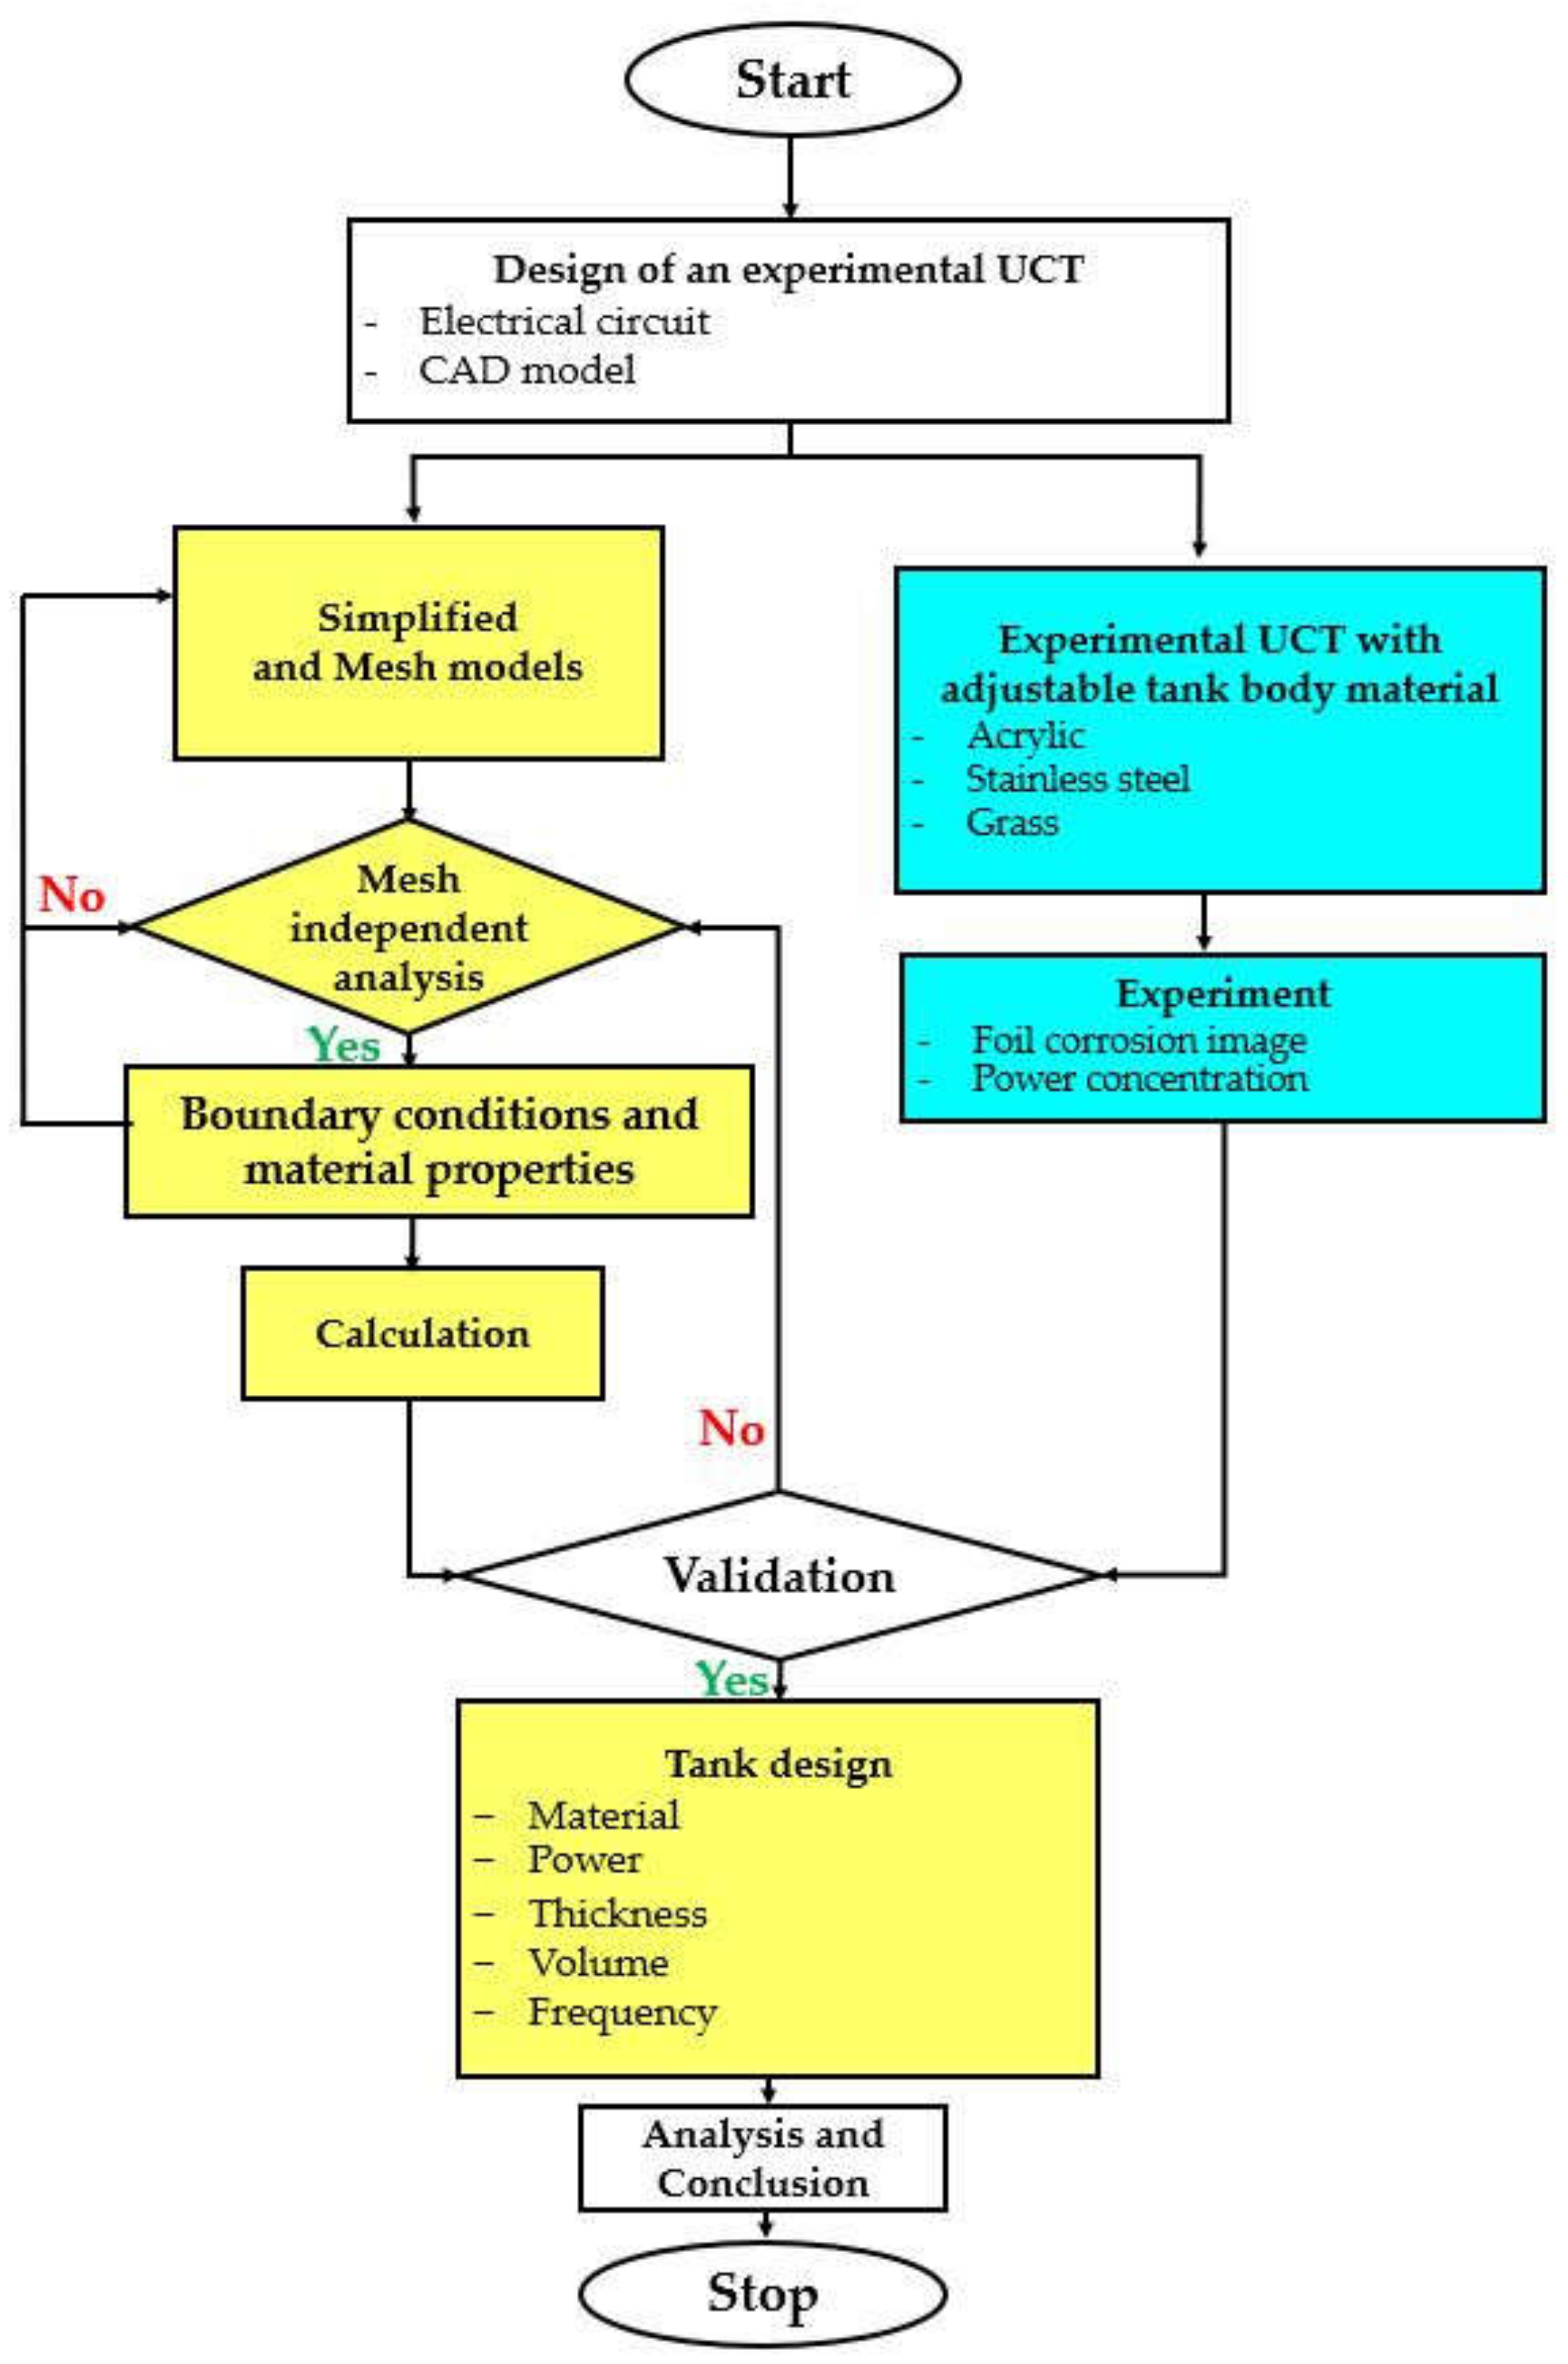
3. Methodology
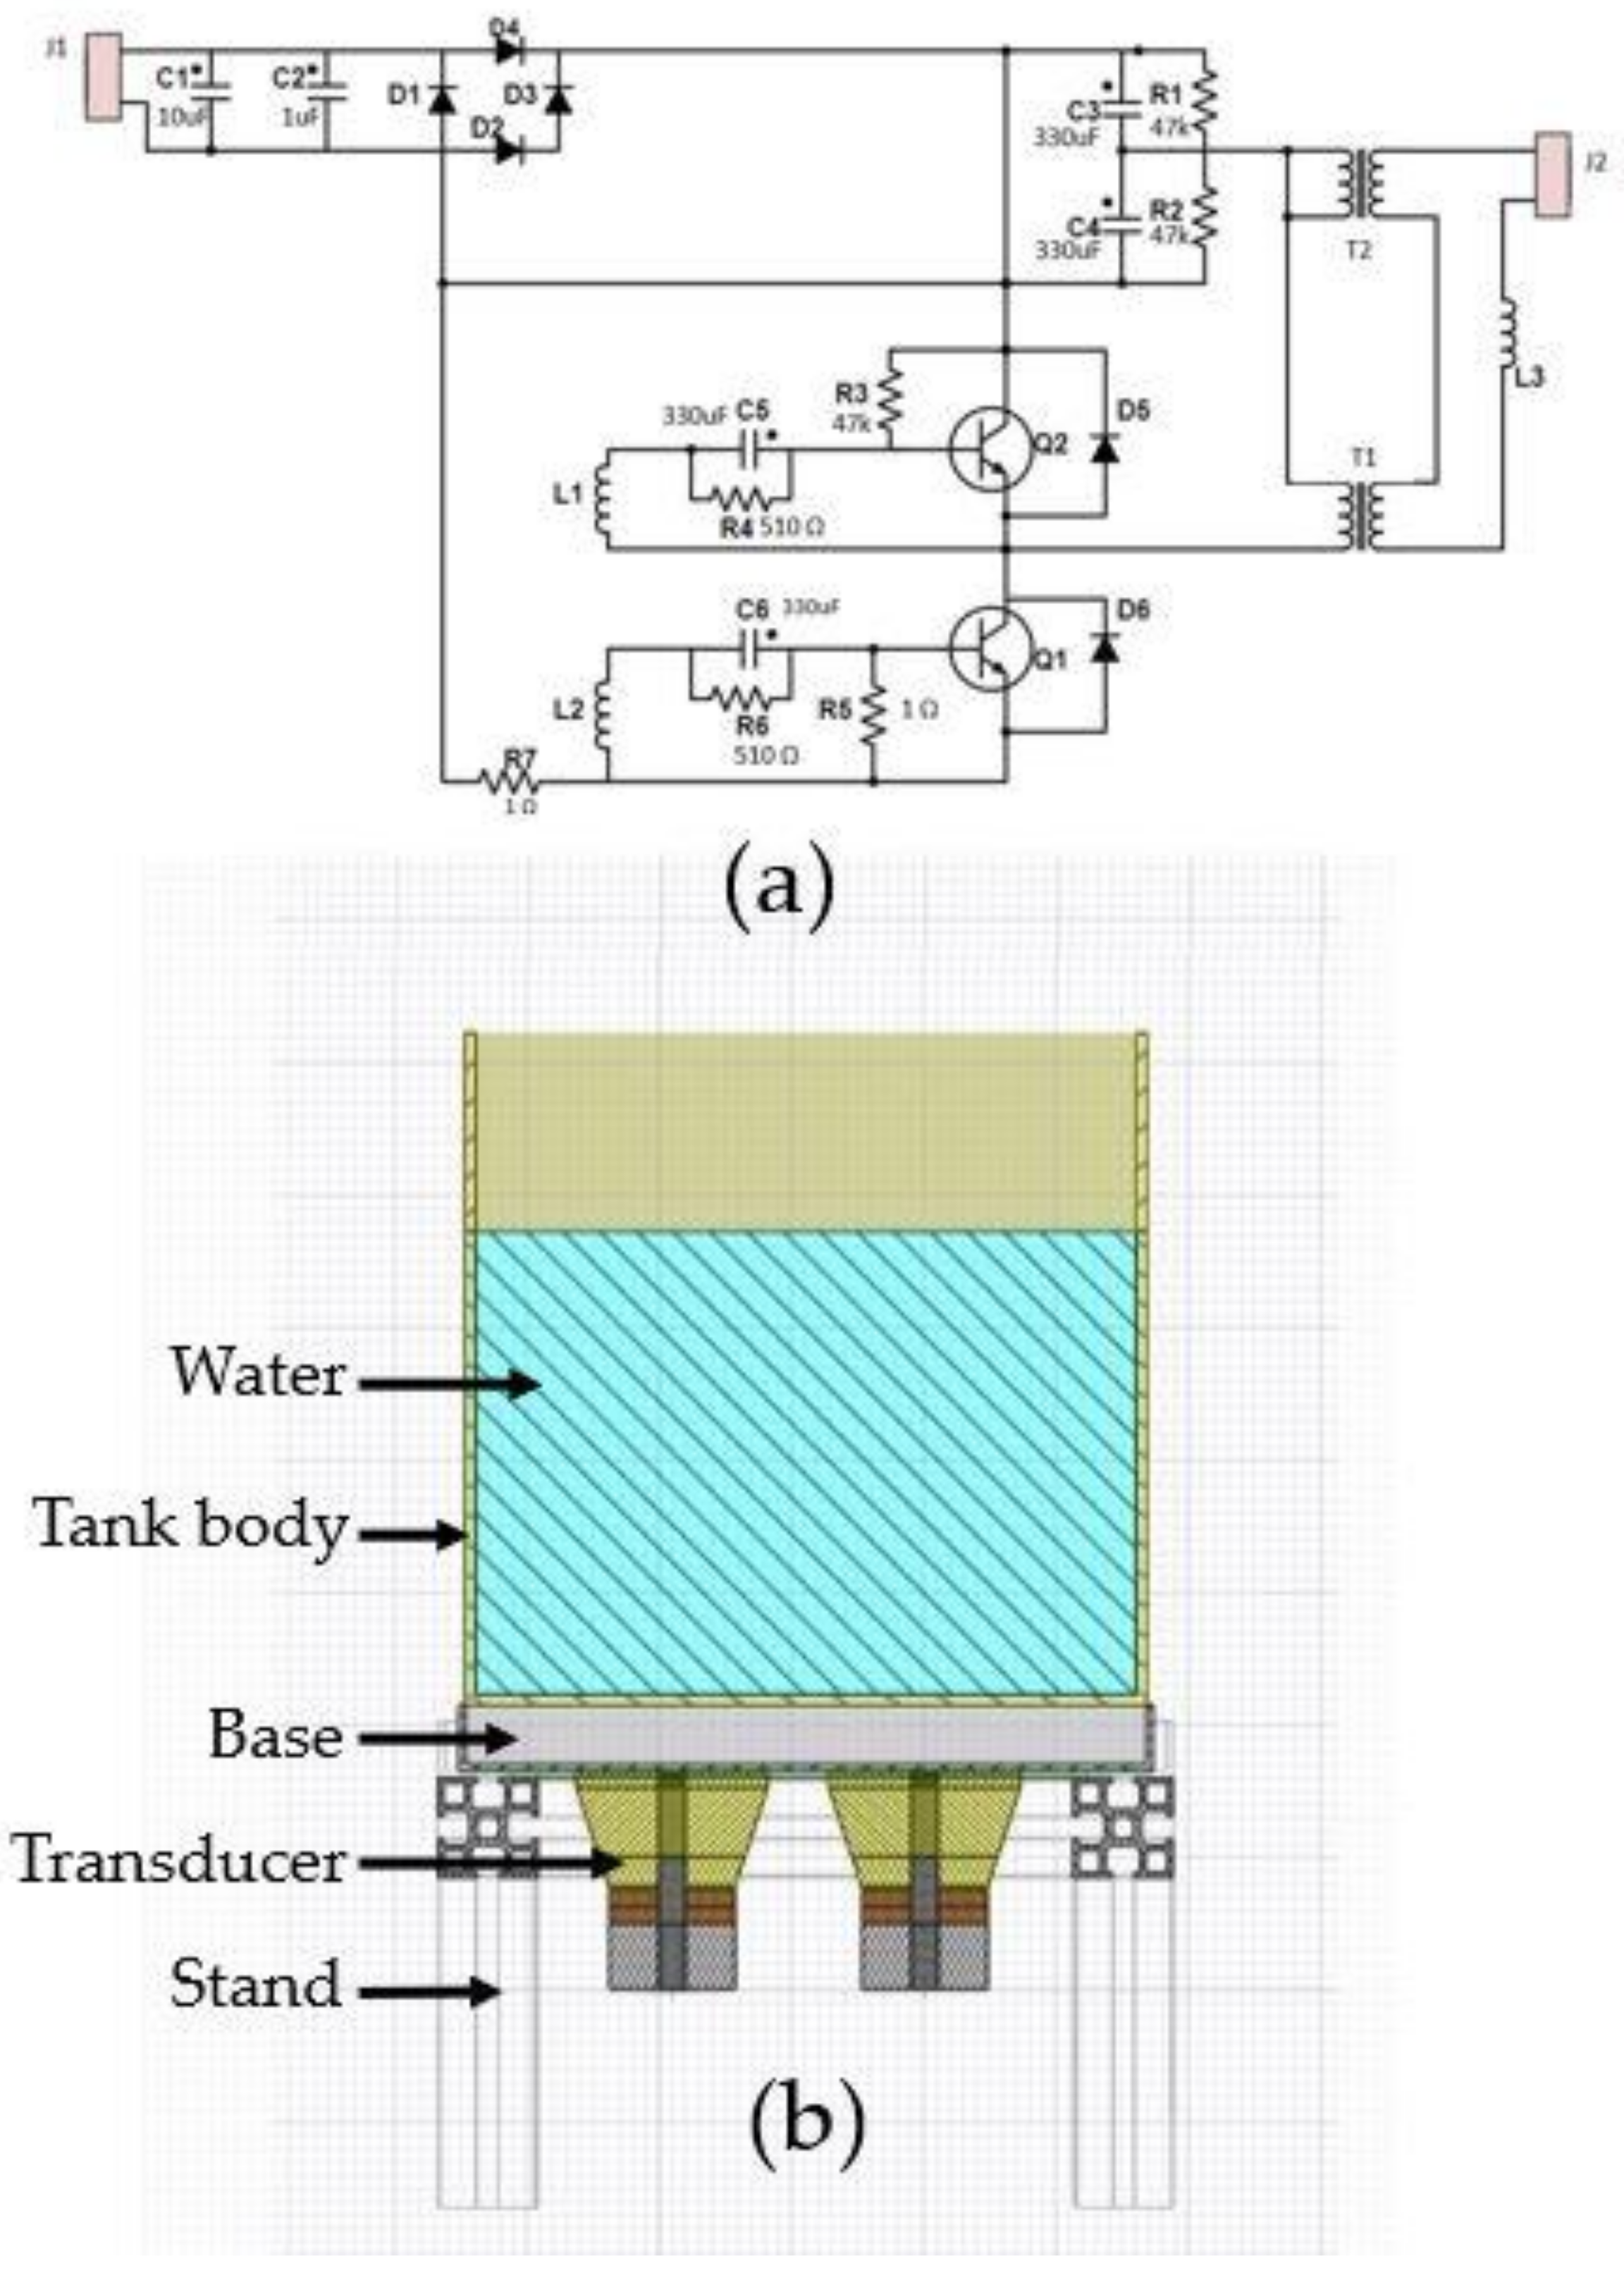
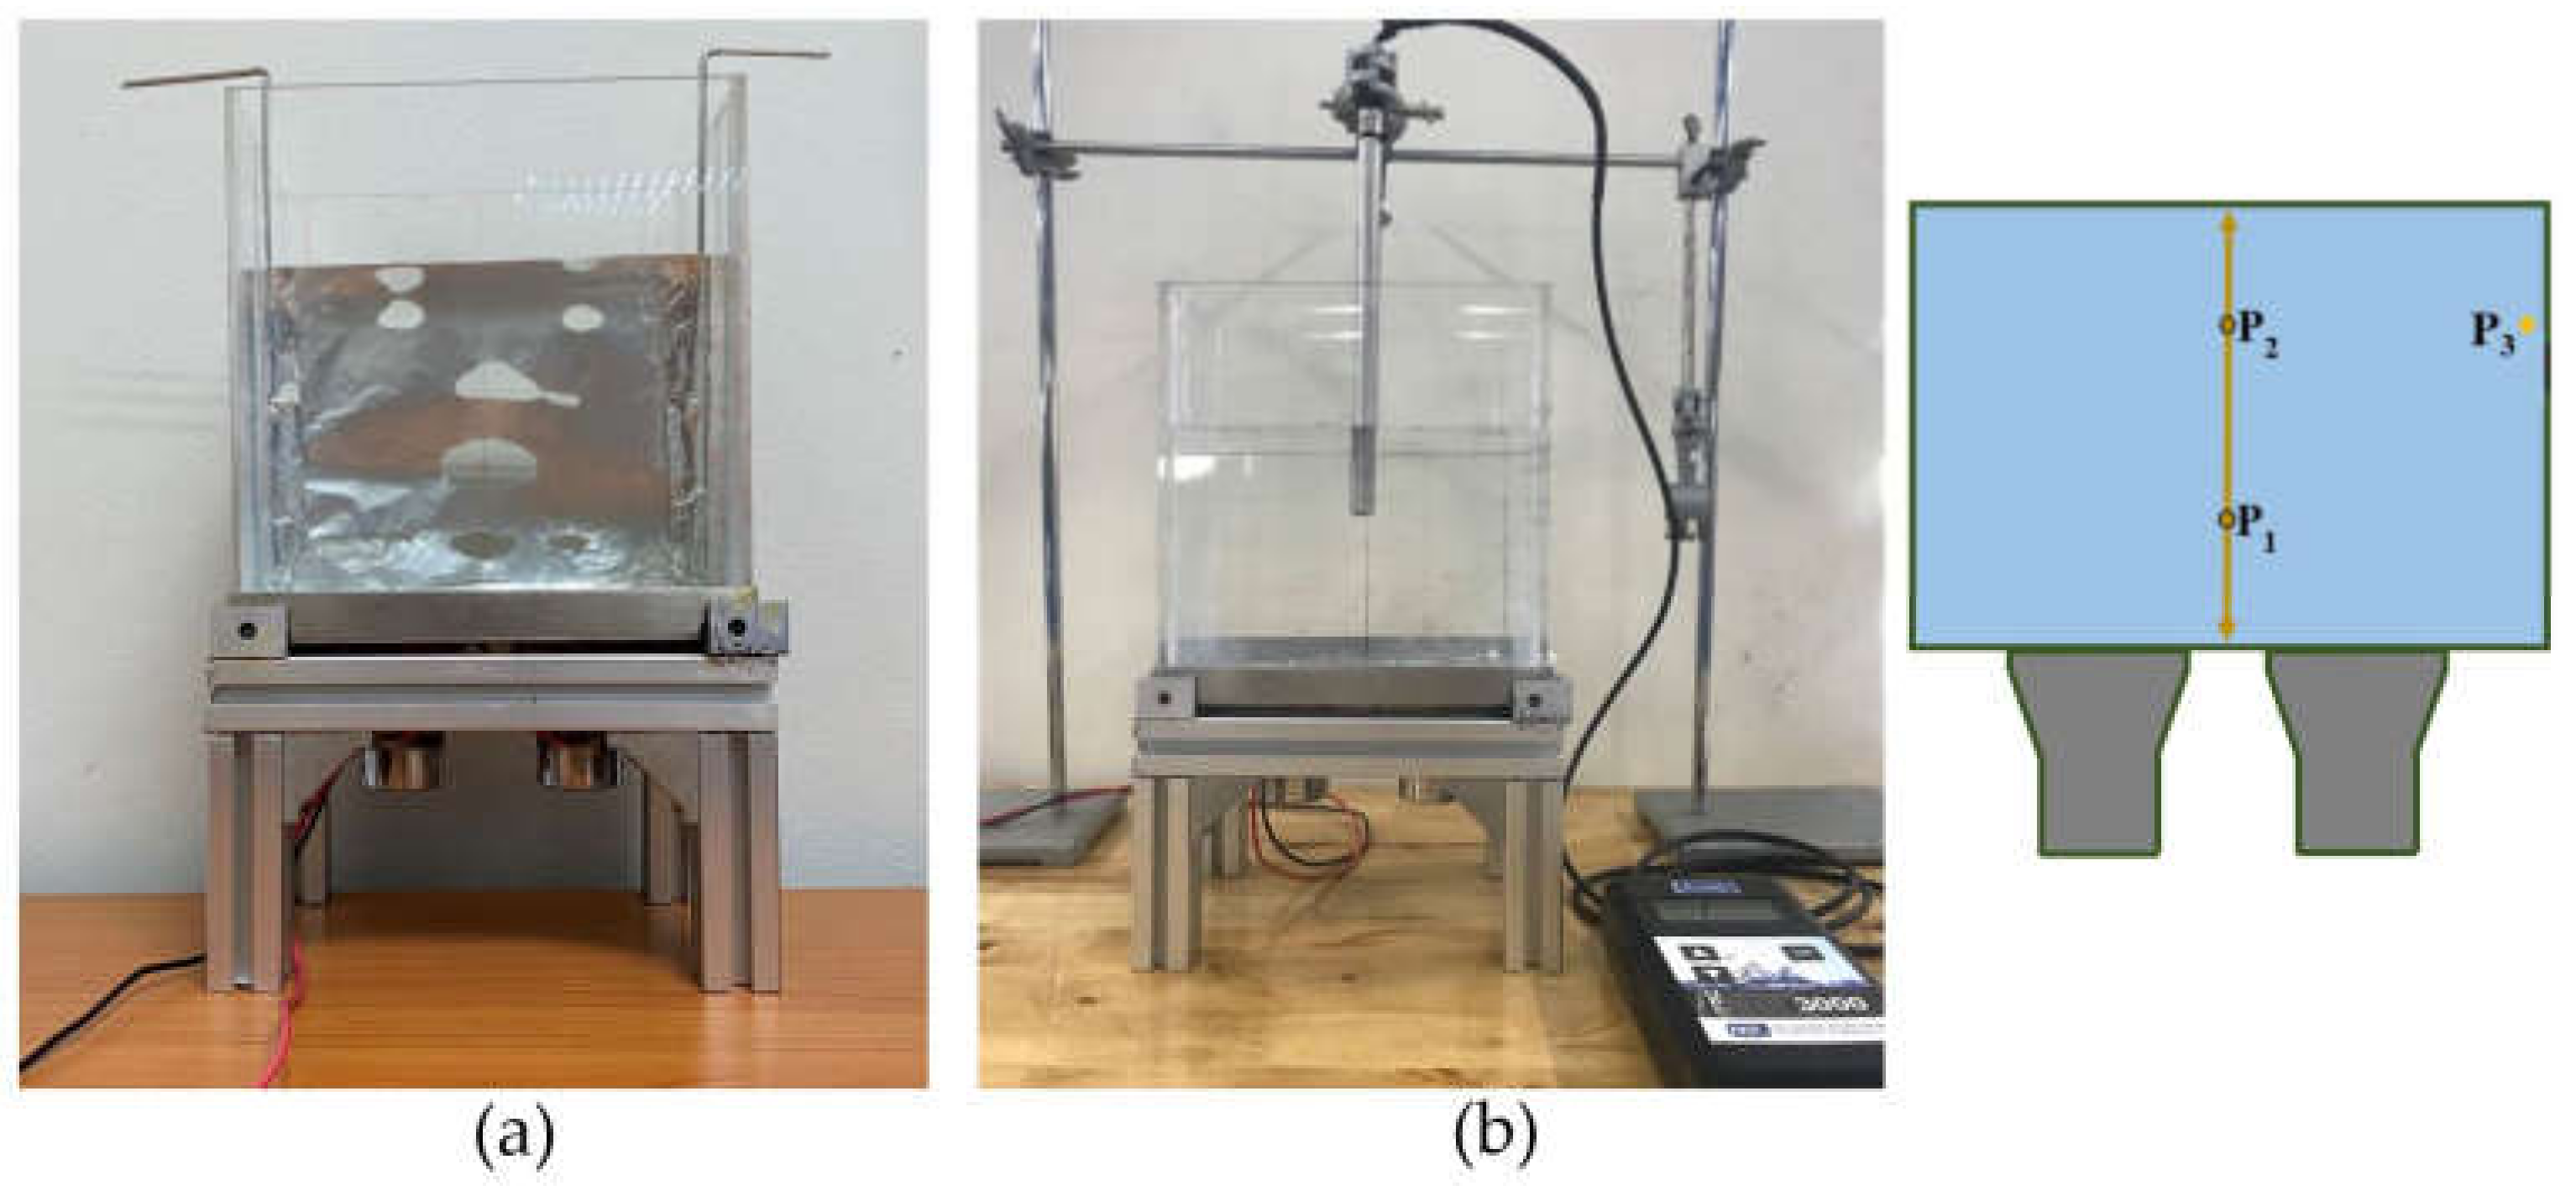
3.1. An Experimental UCT
3.2. Experiment
3.2.1. Foil Corrosion Experiment
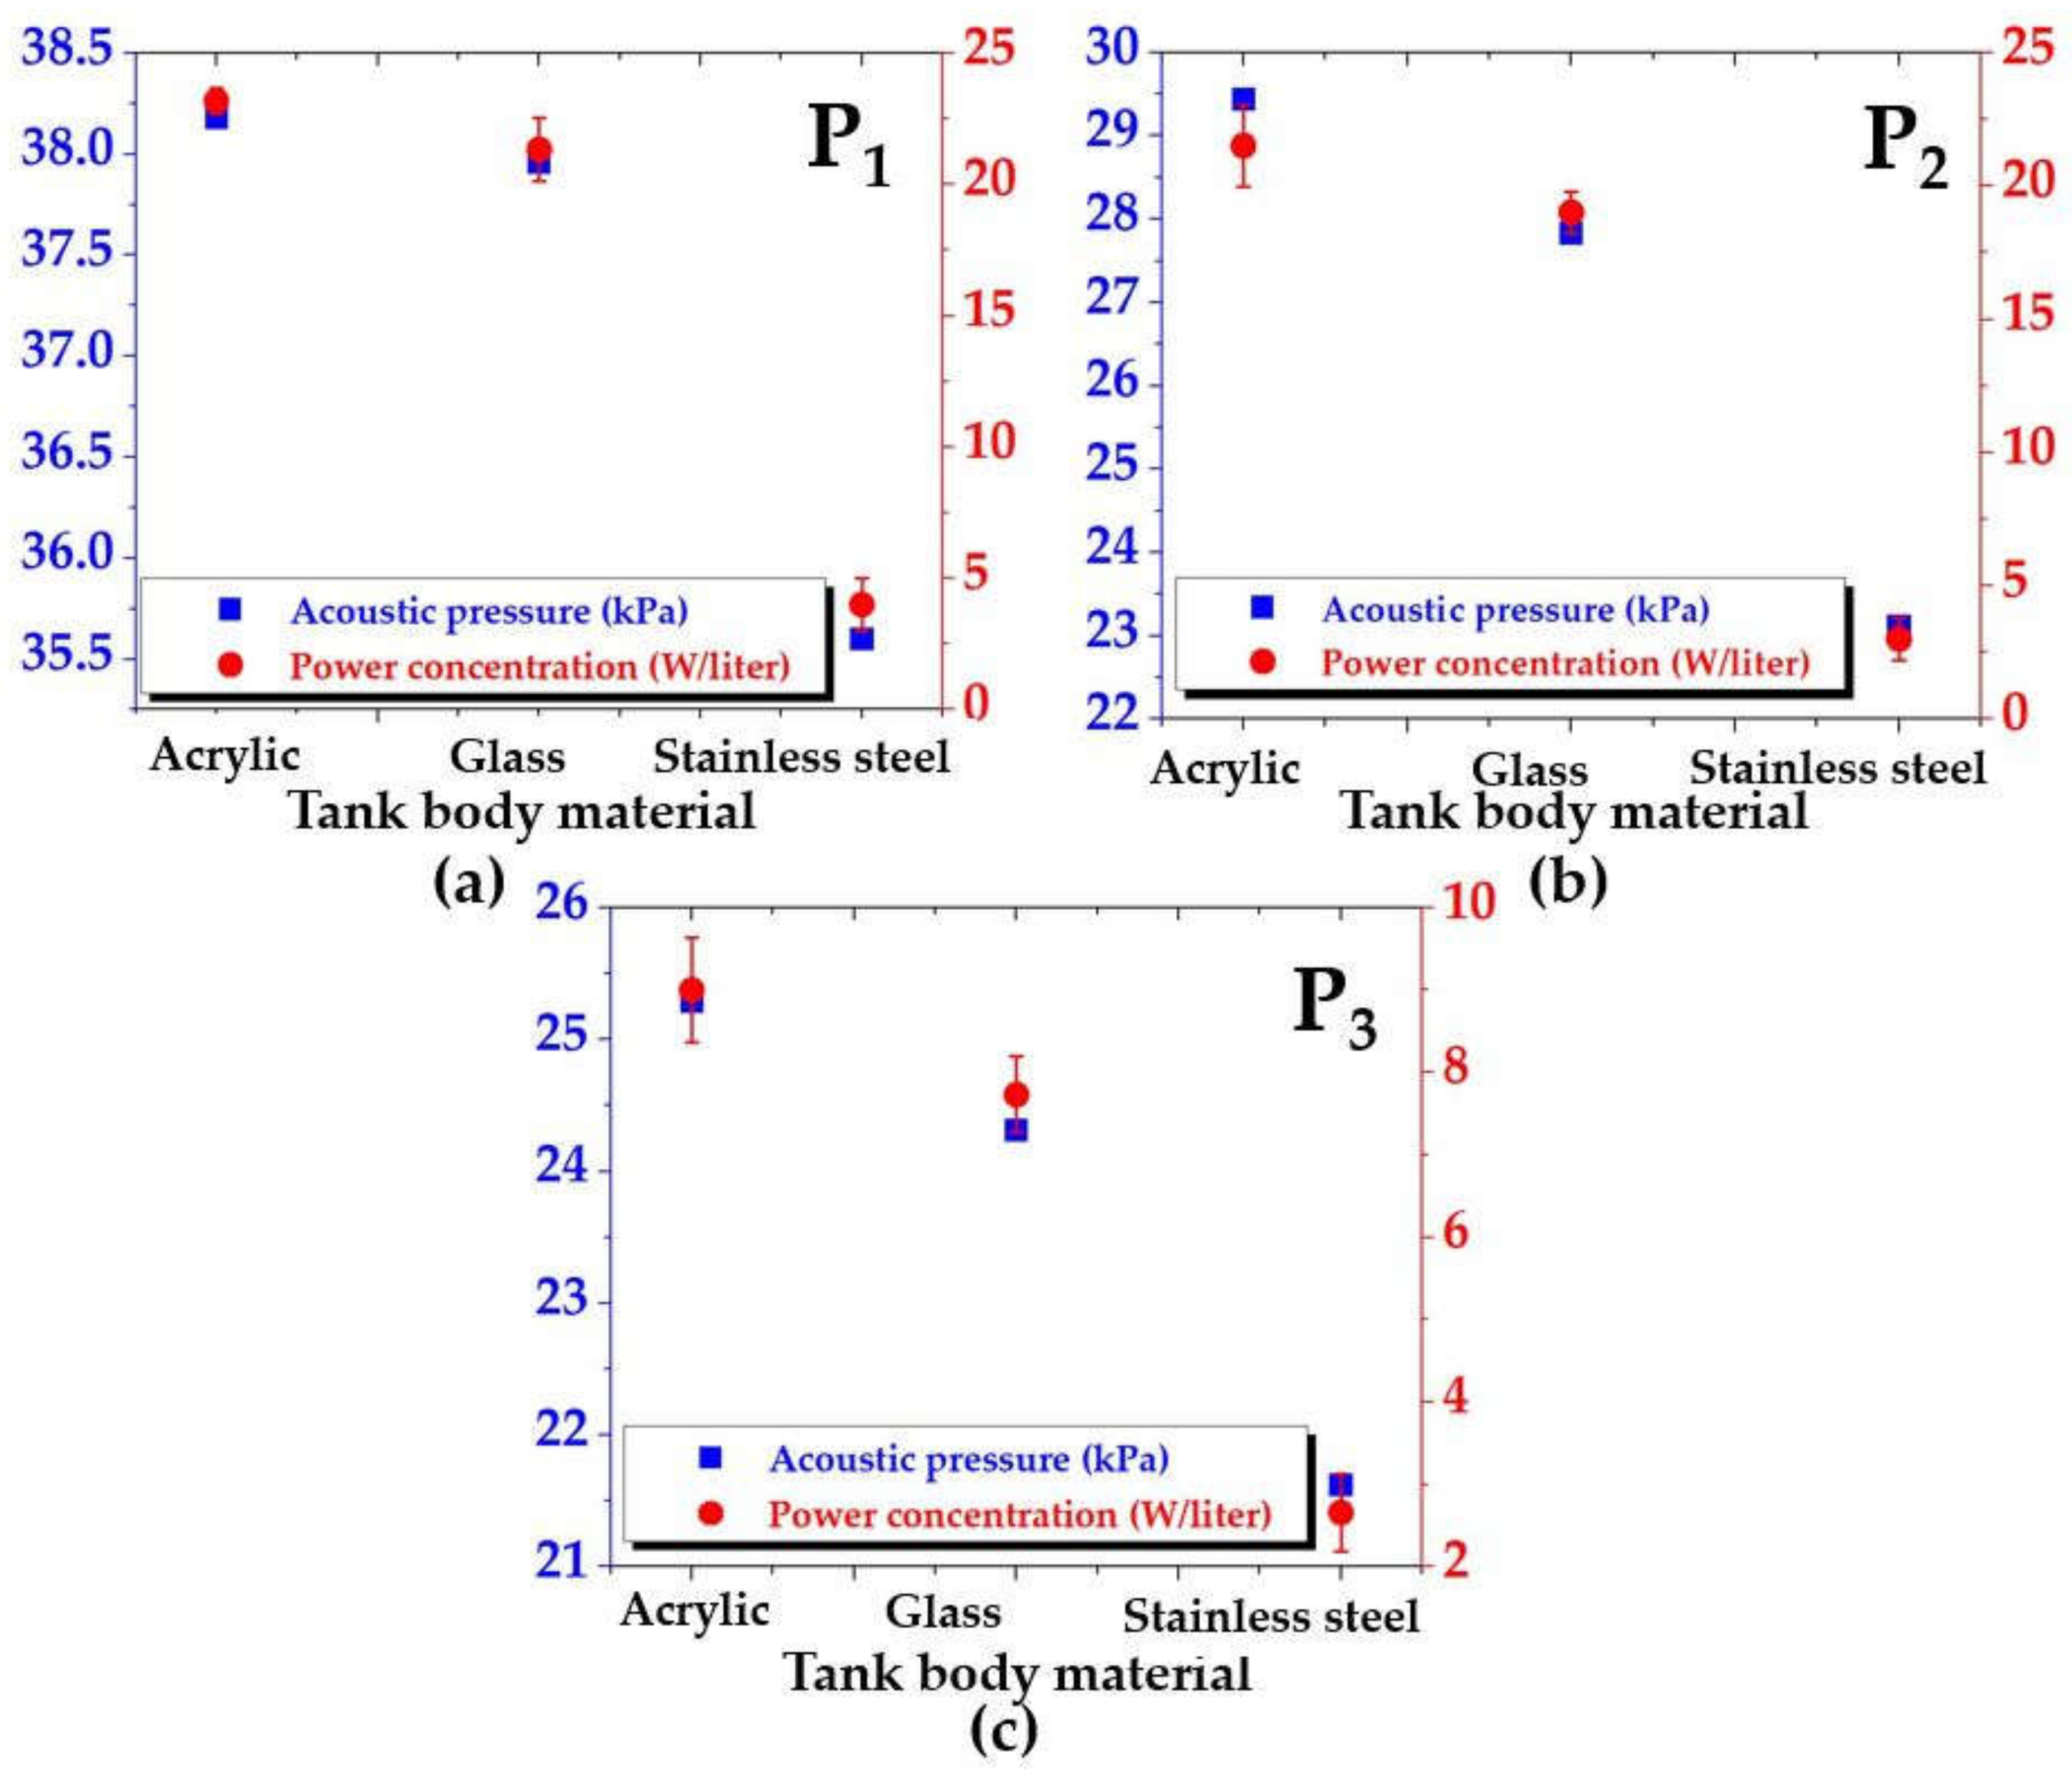
3.2.2. Power Concentration Experiment
3.3. HRA Simulation
3.3.1. Simplified and Mesh Models
3.3.2. Boundary Conditions and Material Properties
4. Results and Discussion
4.1. Validation
4.2. Tank Design Effect
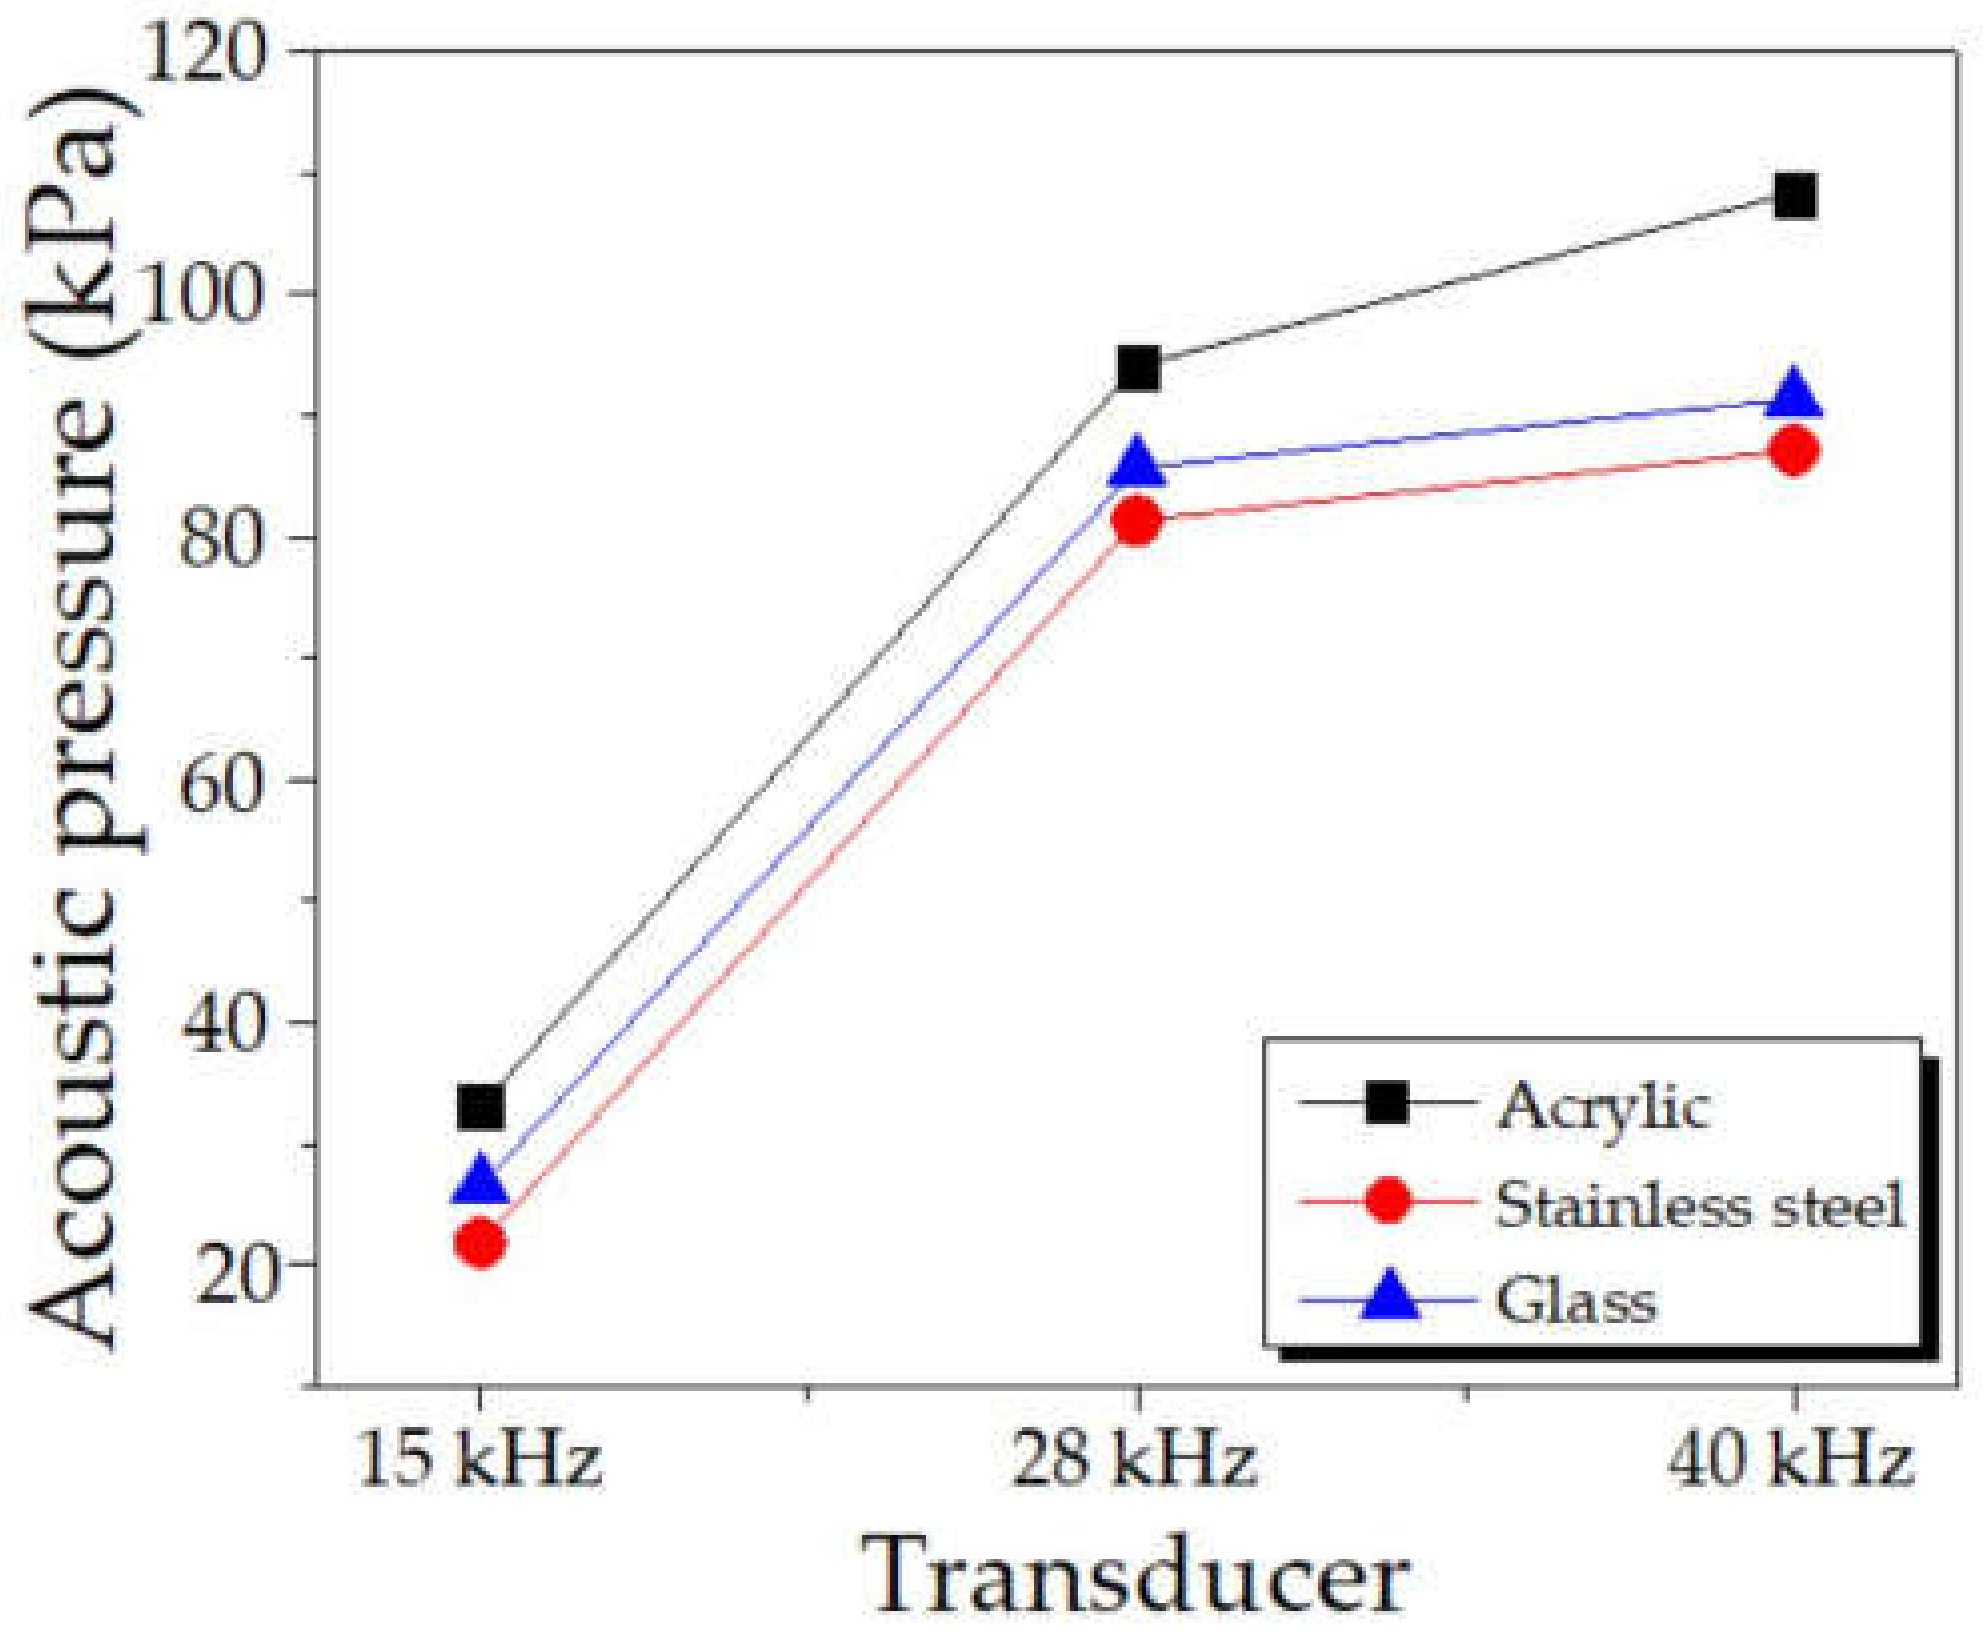
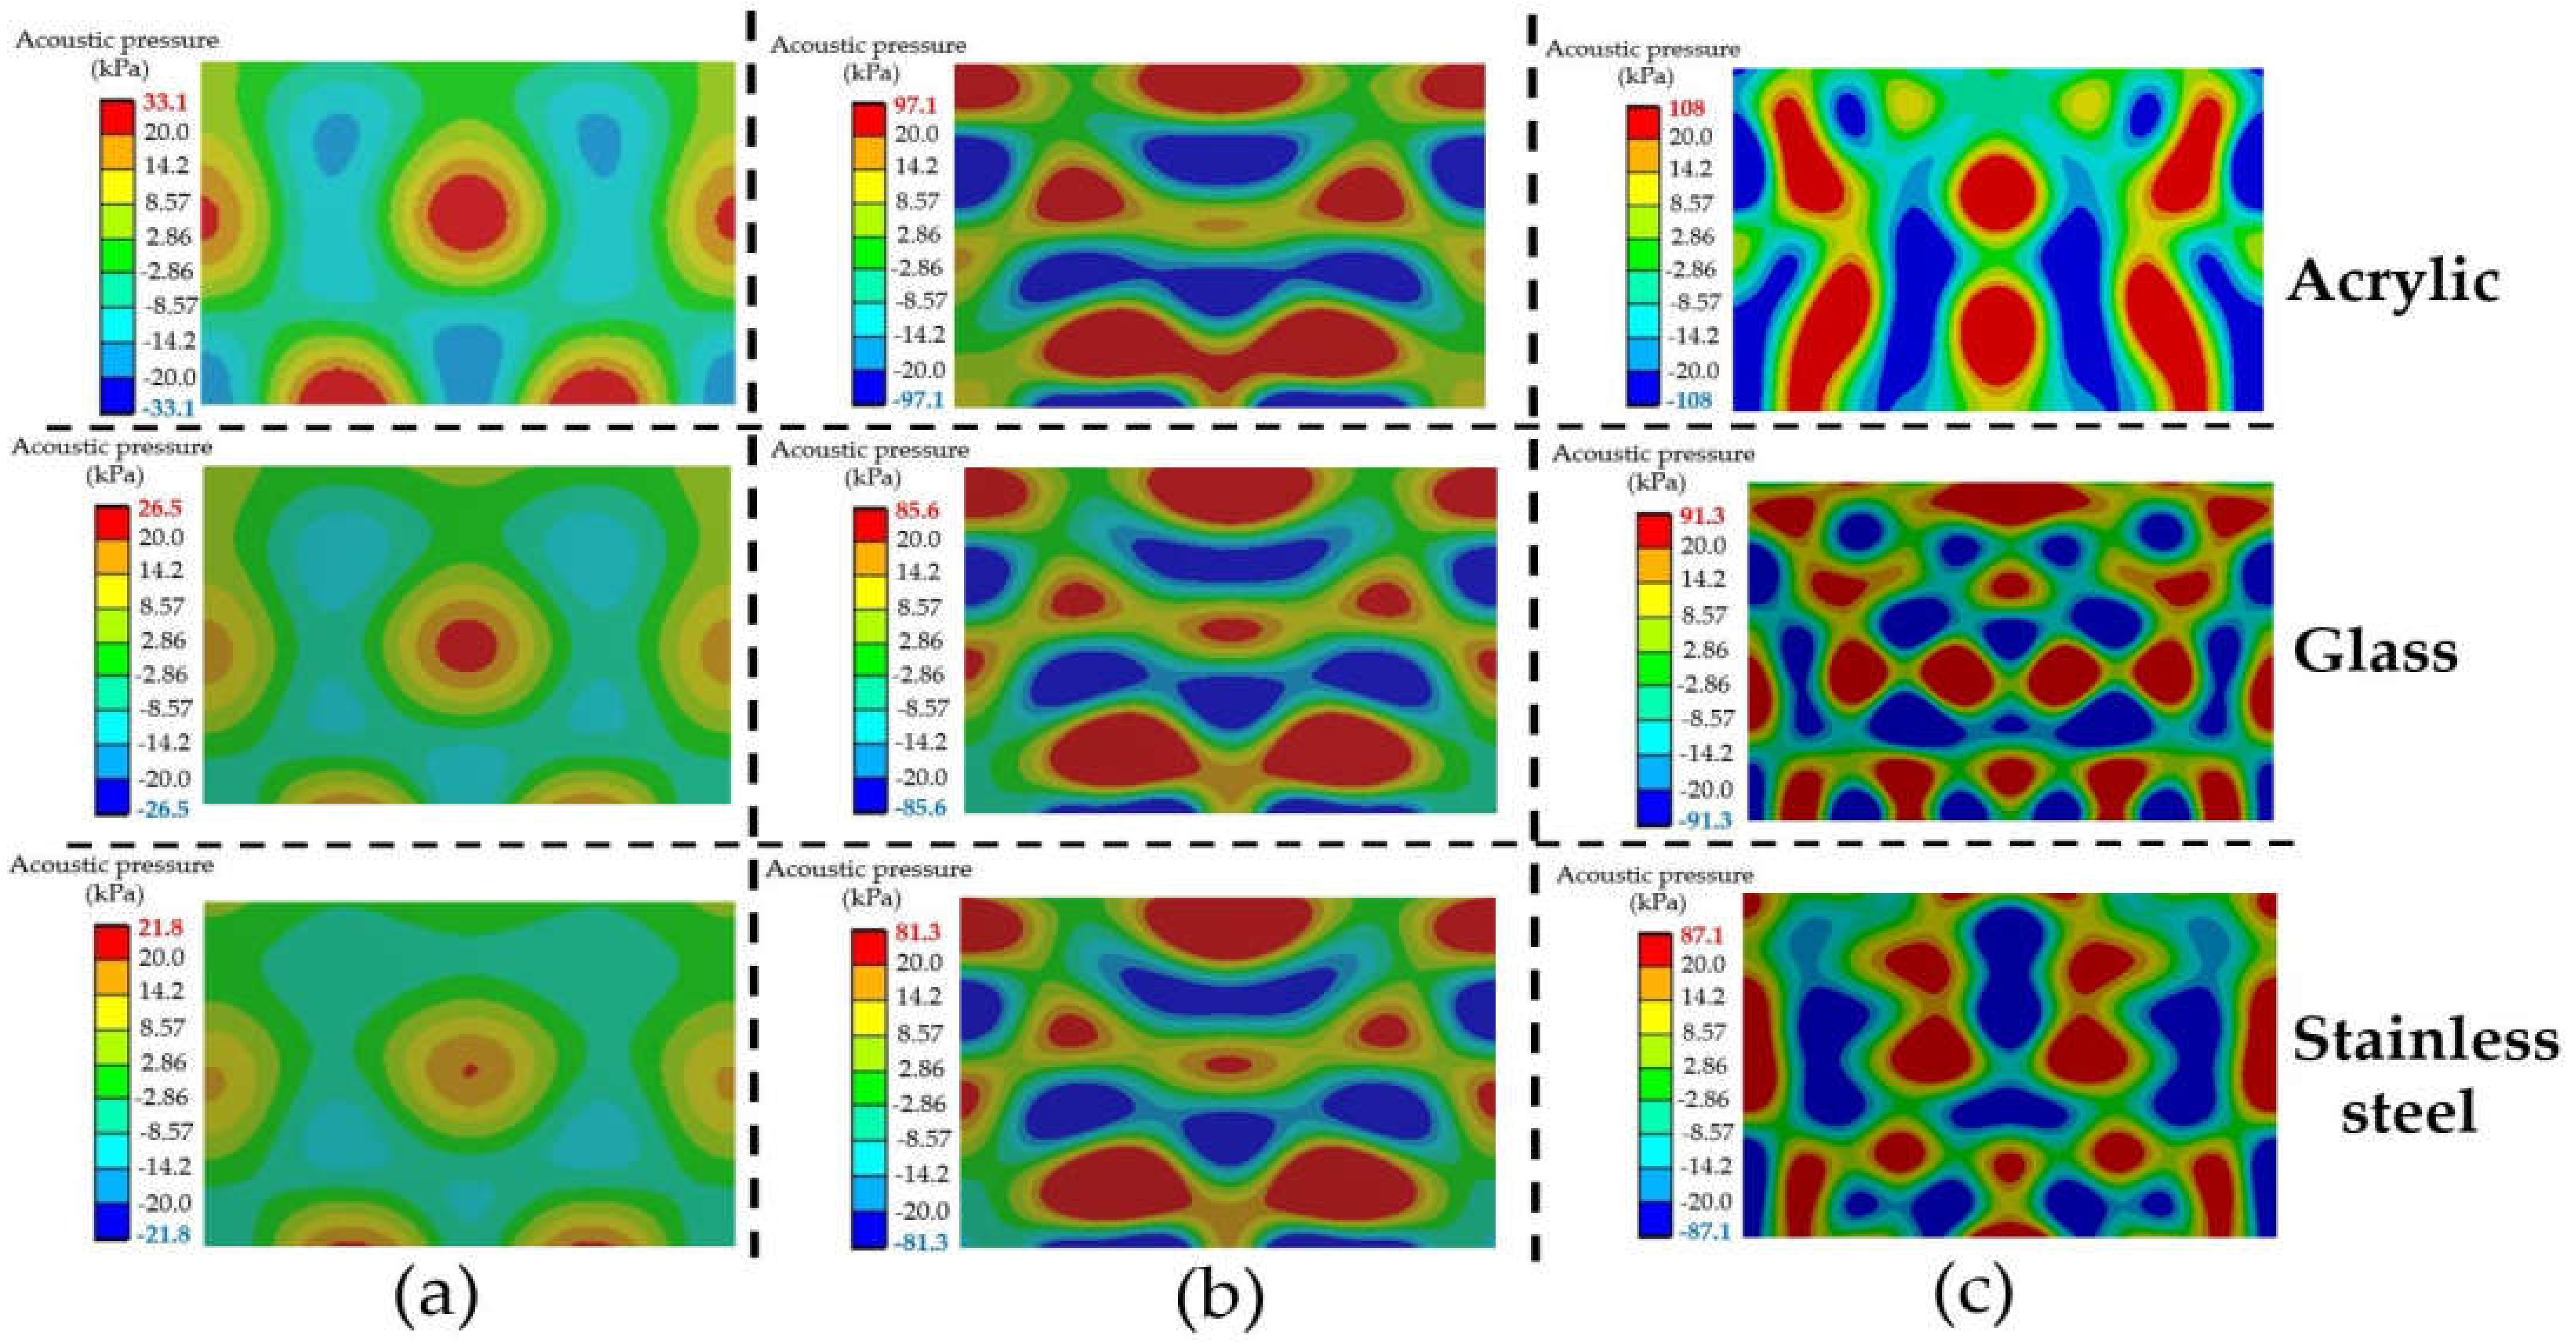
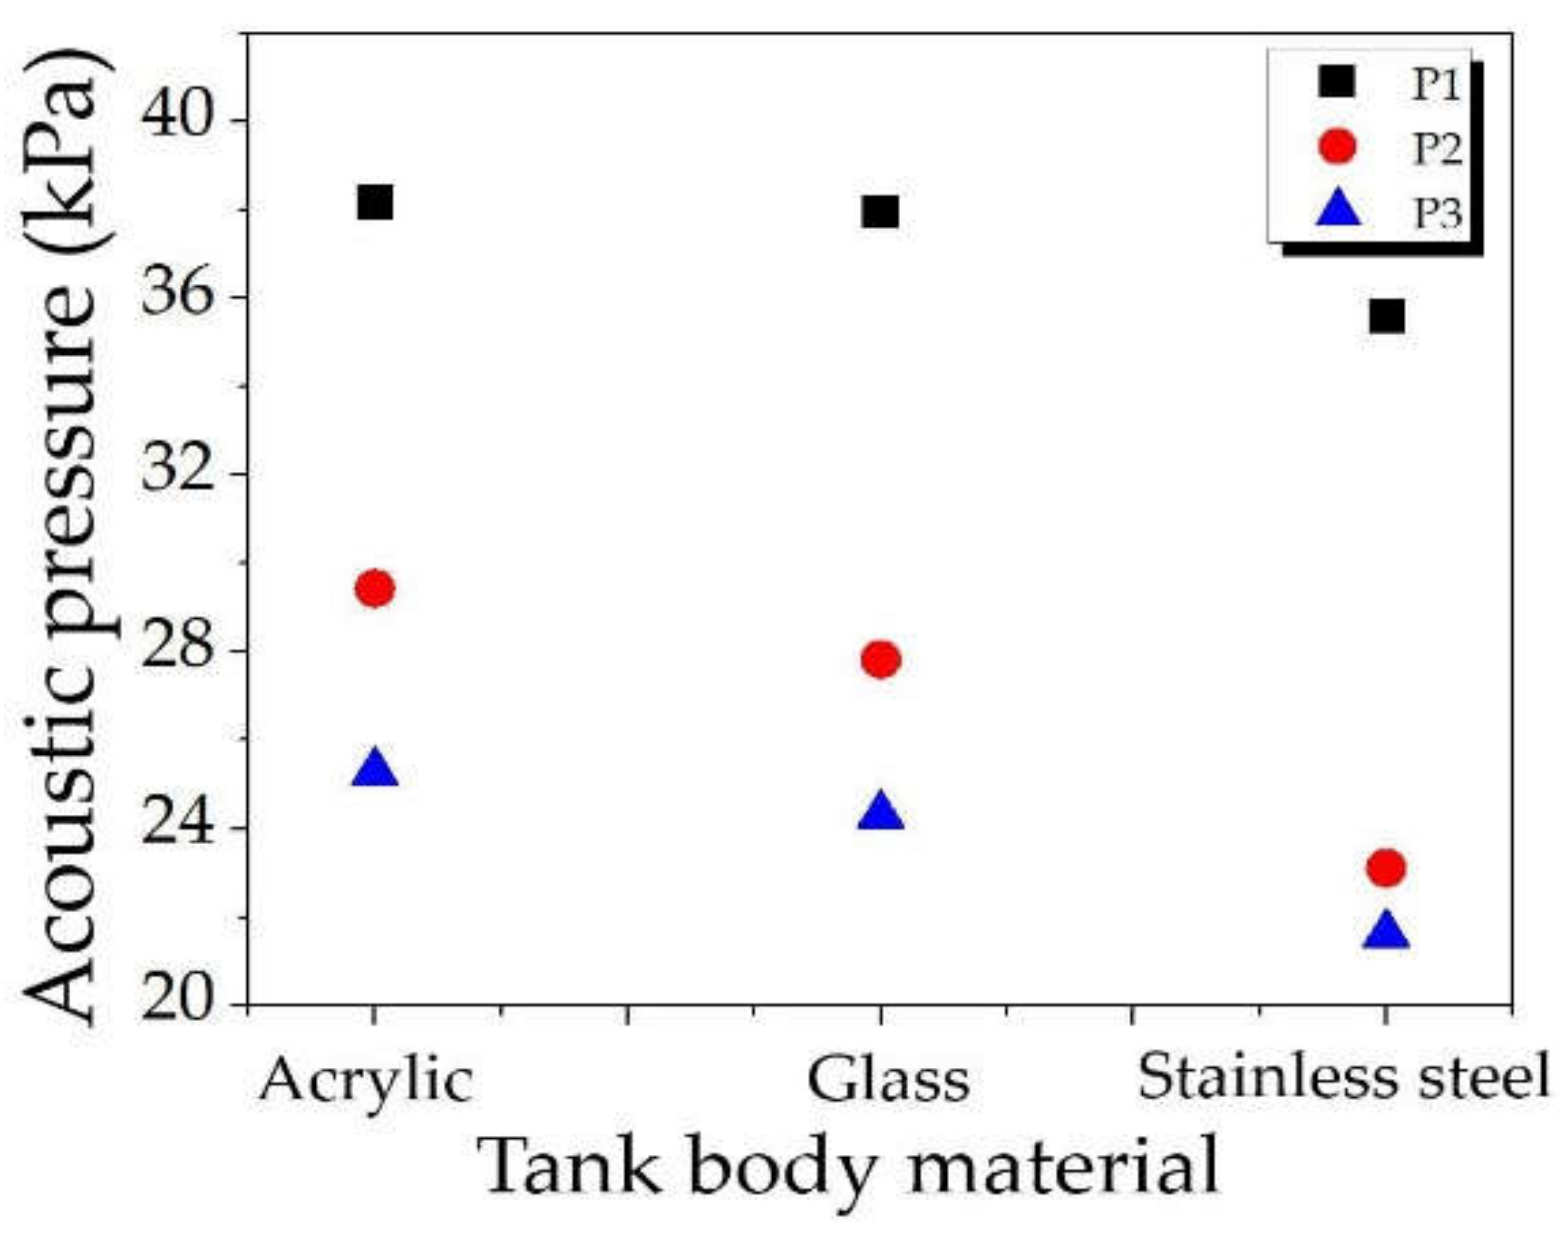
4.2.1. Materials
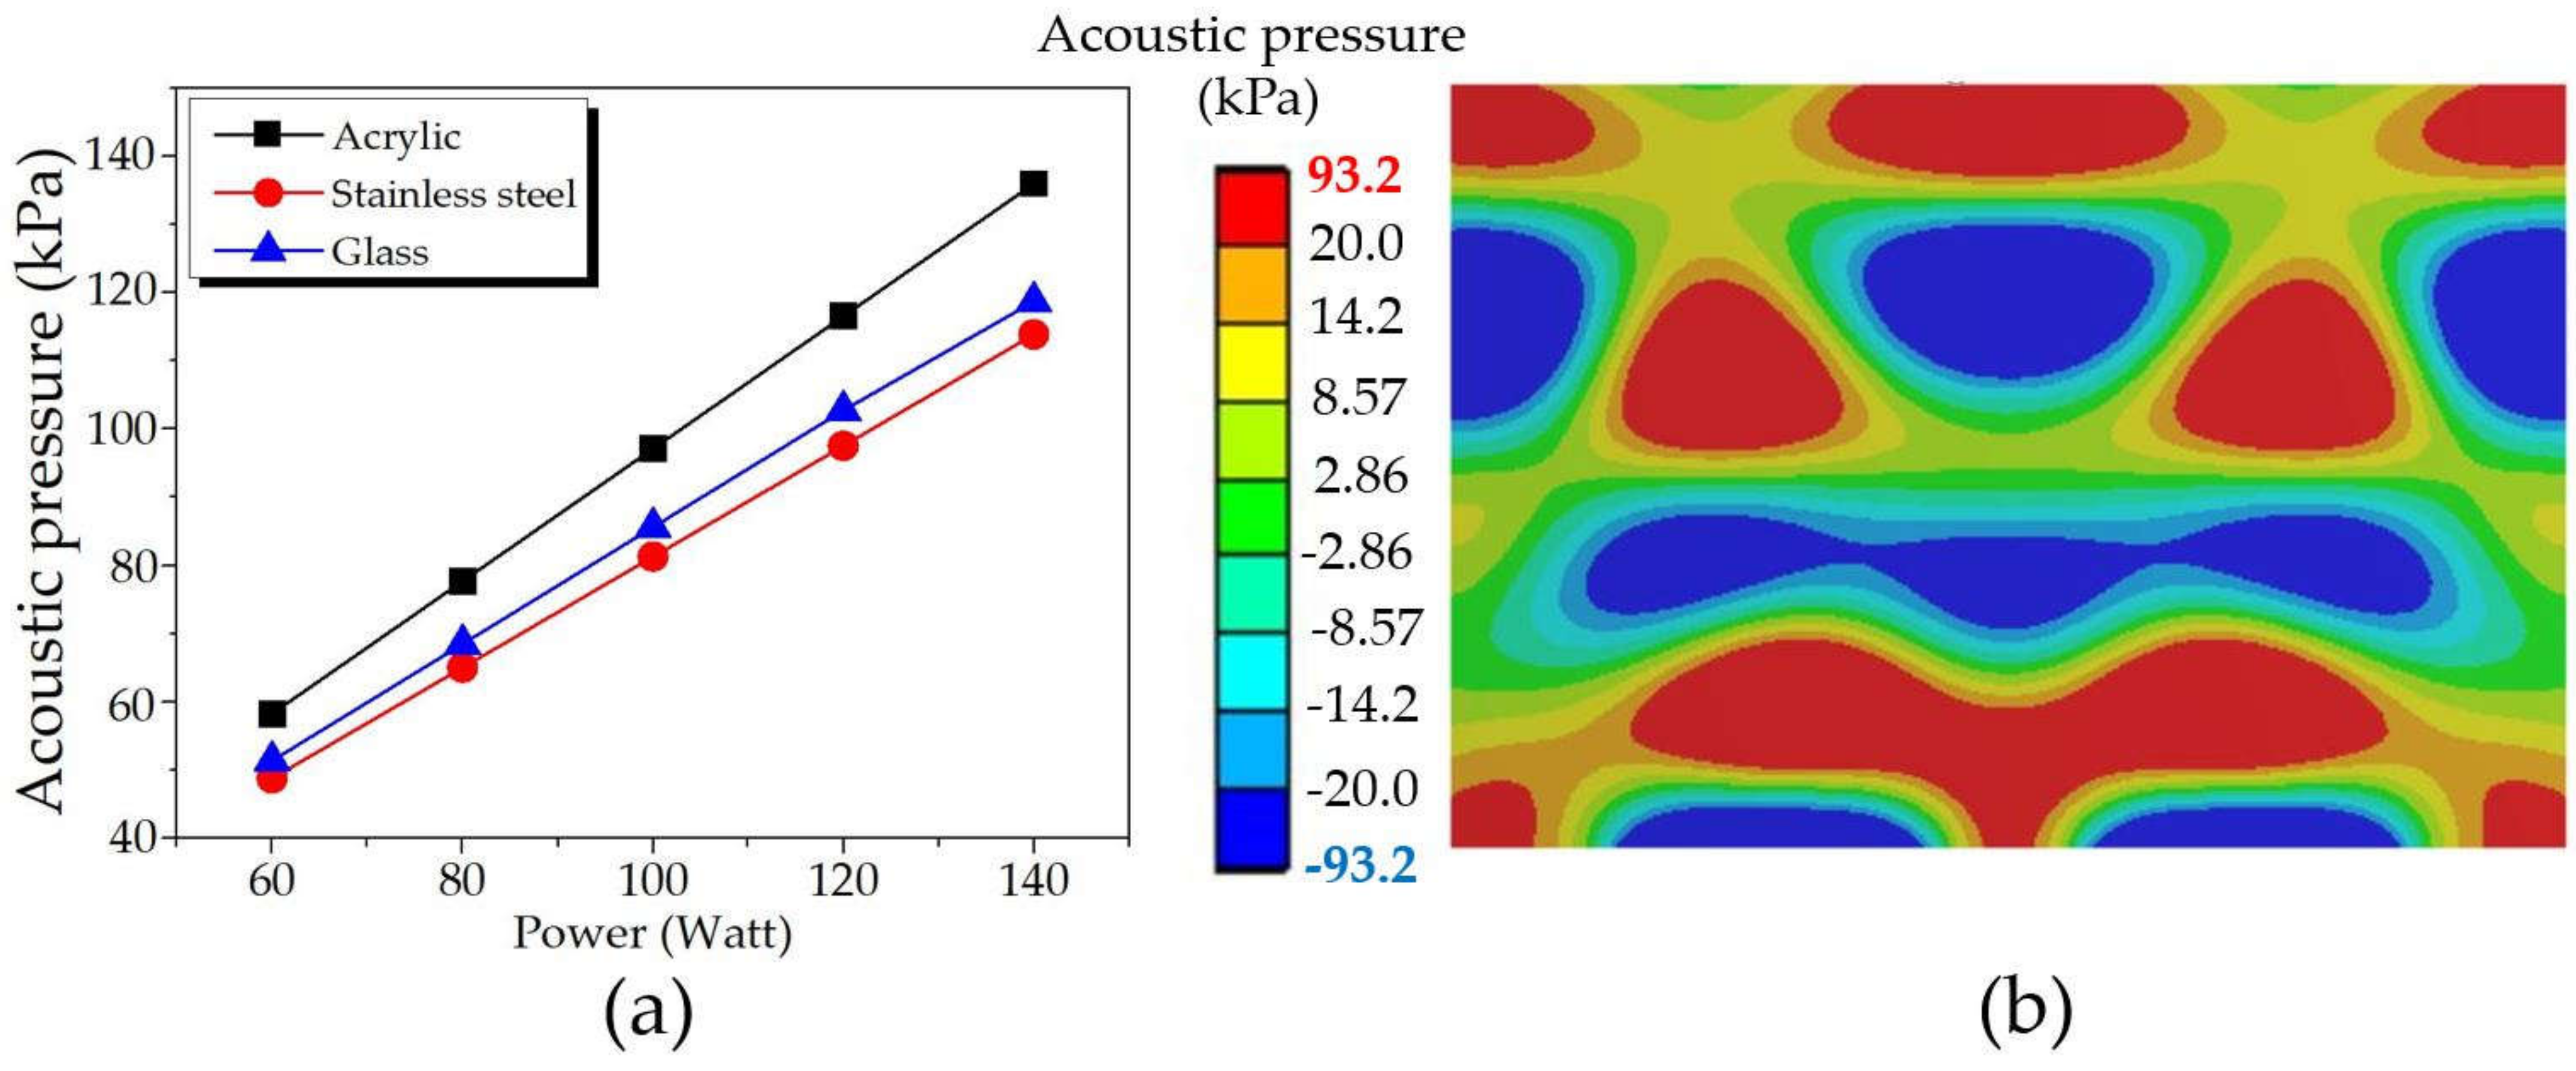
4.2.2. Power
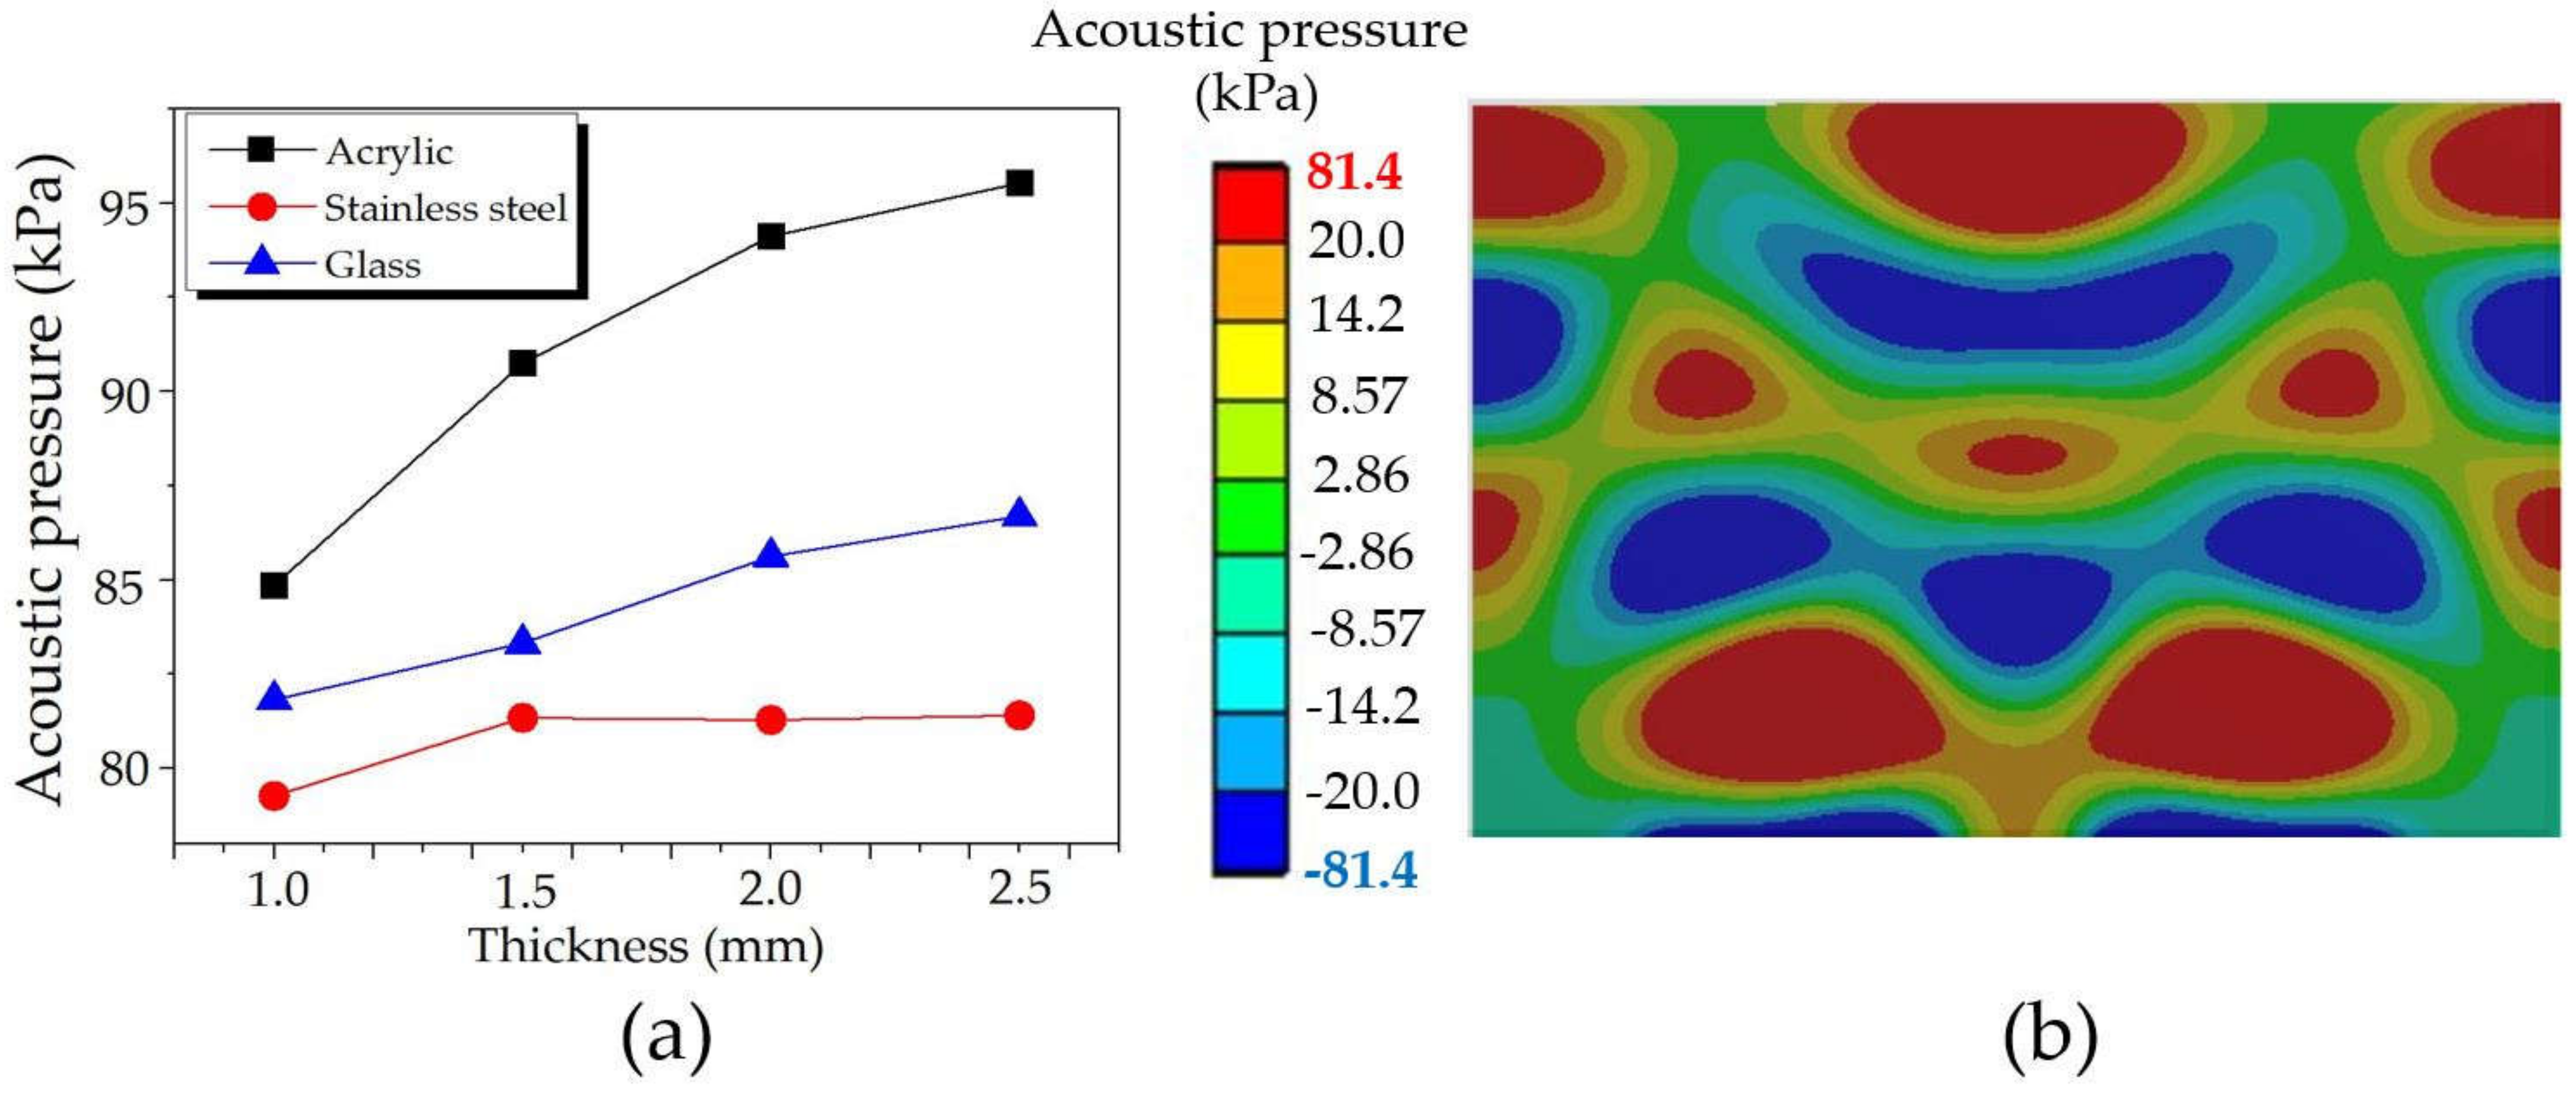
4.2.3. Thickness
4.2.4. Volume
4.2.5. Frequency
5. Conclusions and Further Study
Author Contributions
Funding
Institutional Review Board Statement
Informed Consent Statement
Data Availability Statement
Acknowledgments
Conflicts of Interest
References
- Chhabra, A.D.; Kumar, R.V.; Vundavilli, P.R.; Surekha, B. Design and Analysis of Higher Order Exponential Horn Profiles for Ultrasonic Machining. J. Manuf. Sci. Prod. 2016, 16, 13–19. [Google Scholar] [CrossRef]
- Dunst, P.; Hemsel, T.; Bornmann, P.; Littmann, W.; Sextro, W. Optimization of Ultrasonic Acoustic Standing Wave Systems. Actuators 2020, 9, 9. [Google Scholar] [CrossRef] [Green Version]
- Xu, J.; Huanhuan, R. Design and Finite Element Simulation of an Ultrasonic Transducer of Two Piezoelectric Discs. J. Meas. Eng. 2017, 5, 266–272. [Google Scholar] [CrossRef] [Green Version]
- Yang, J.; Ji, S.; Zhao, J.; He, Q. Theoretical Analysis and Finite Element Calculation of Ultrasonic Horn. IOP Conf. Ser. Mater. Sci. Eng. 2019, 612, 032032. [Google Scholar] [CrossRef]
- Addellpari, S.N. Modal Analysis of Horns used in Ultrasonic Vibration Assisted Drilling. Int. J. Innov. Eng. Technol. 2016, 7, 294–298. [Google Scholar]
- Xuan, Y.; Wand, A.; Zhang, N. Design and Simulation Technology of Piezoelectric UST with Sandwich Composite Horn. IOP Conf. Ser. Mater. Sci. Eng. 2019, 470, 012043. [Google Scholar] [CrossRef]
- Nakamura, K. Ultrasonic Transducers: Material and Design for Sensors, Actuators, and Medical Applications; Elsevier: Amsterdam, The Netherlands, 2012. [Google Scholar]
- Tangsopa, W.; Keawklan, T.; Kesngam, K.; Ngaochai, S.; Thongsri, J. Improved Design of Ultrasonic Cleaning Tank Using Harmonic Response Analysis in ANSYS. IOP Conf. Ser. Earth Environ. Sci. 2018, 159, 012042. [Google Scholar] [CrossRef]
- Srathonghuam, K.; Wonganu, B.; Busayaporn, B.; Thongsri, J. Vibration Analysis and Development of a Submersible Ultrasonic Transducer for an Application in the Inhibitory Activity of Pathogenic Bacteria. IEEE Access 2021, 9, 142362–142373. [Google Scholar] [CrossRef]
- Lais, H.; Lowe, P.S.; Kanfoud, J.; Gan, T.H. Advancements in Fouling Removal using High Power Ultrasonics for Industrial Applications. In Proceedings of the 2017 IEEE International Conference on Industrial and Information Systems (ICIIS), Peradeniya, Sri Lanka, 15–16 December 2017; pp. 1–6. [Google Scholar]
- Lais, H.; Lowe, P.S.; Gan, T.H.; Wrobel, L.C. Numerical Modelling of Acoustic Pressure Fields to Optimize the Ultrasonic Cleaning Technique for Cylinders. Ultrason. Sonochem. 2018, 7, 1–15. [Google Scholar] [CrossRef] [PubMed]
- Tangsopha, W.; Thongsri, J. Simulation of Ultrasonic Cleaning and Ways to Improve the Efficiency. In Proceedings of the 2017 International Electrical Engineering Congress (iEECON), Pattaya, Thailand, 8–10 March 2017; pp. 1–4. [Google Scholar]
- Tangsopa, W.; Thongsri, J. Development of an Industrial Ultrasonic Cleaning Tank Based on Harmonic Response Analysis. Ultrasonics 2019, 91, 68–76. [Google Scholar] [CrossRef] [PubMed]
- Tangsopa, W.; Thongsri, J. A Novel Ultrasonic Cleaning Tank Developed by Harmonic Response Analysis and Computational Fluid Dynamics. Metals 2020, 10, 335. [Google Scholar] [CrossRef] [Green Version]
- Tangsopa, W.; Thongsri, J. A Dual Frequency Ultrasonic Cleaning Tank Developed by Transient Dynamic Analysis. Appl. Sci. 2021, 11, 699. [Google Scholar] [CrossRef]
- Mason, T.J. Ultrasonic cleaning: An Historical Perspective. Ultrason. Sonochem. 2016, 29, 519–523. [Google Scholar] [CrossRef] [PubMed]
- Fuchs, F.J. Ultrasonic Cleaning and Washing of Surfaces. In Power Ultrasonics; Woodhead Publishing: Oxford, UK, 2015; pp. 577–609. [Google Scholar]
- Fuchs, J. Ultrasonics—Number and Size of Cavitation Bubbles. Available online: https://techblog.ctgclean.com/2011/12/ultrsonics-number-and-size-of-cavitation-bubbles/ (accessed on 1 February 2022).
- Kinsler, L.E.; Frey, A.R.; Coppens, A.B.; Sanders, J.V. Fundamentals of Acoustics; John Wiley & Sons: Hoboken, NJ, USA, 2000. [Google Scholar]
- Sulistiya, A.; Surtono, A.; Supriyanto, A. A Frequency Generator of 40–60 kHz Based on Arduino for Ultrasonic Cleaner Applications. J. Phys. Conf. Ser. 2020, 1572, 012014. [Google Scholar]
- Ansys. Harmonic Analysis; Ansys: Southpoint, FL, USA, 2016. [Google Scholar]


| Material | Property | Value |
|---|---|---|
| Acrylic | Density Young’s modulus Poisson’s ratio Bulk modulus Shear modulus Acoustic impedance Acoustic velocity | 1180 kg/m3 2.69 × 10⁹ Pa 0.395 4.270 × 10⁹ Pa 9.641 × 10⁸ Pa 3.249 × 10⁶ kg/m2 × s 2730 m/s |
| Glass | Density Young’s modulus Poisson’s ratio Bulk modulus Shear modulus Acoustic impedance Acoustic velocity | 2190 kg/m3 7.3 × 10¹⁰ Pa 0.155 3.527 × 10¹⁰ Pa 3.160 × 10¹⁰ Pa 11.486 × 10⁶ kg/m2 × s 4540 m/s |
| Stainless steel 304 | Density Young’s modulus Poisson’s ratio Bulk modulus Shear modulus Acoustic impedance Acoustic velocity | 7750 kg/m3 1.930 × 10¹¹ Pa 0.310 1.693 × 10¹¹ Pa 7.366 × 10¹⁰ Pa 44.95 × 10⁶ kg/m2 × s 1190 m/s |
| Aluminum alloy 356 | Density Young’s modulus Poisson’s ratio Bulk modulus Shear modulus Acoustic impedance Acoustic velocity | 2770 kg/m3 7.1 × 10¹⁰ Pa 0.33 6.9608 × 10¹⁰ Pa 2.6692 × 10¹⁰ Pa 17.23 × 10⁶ kg/m2 s 6220 m/s |
| Lead Zirconate Titanate (PZT4) | Density Permittivity constant (ε0) Stiffness matrix [CE] Piezoelectric stress matrix [e] Relative permittivity | 7500 kg/m3 ε0 = 8.854 × 10⁻¹² F/m C11 = C22 = 1.39 × 10¹¹, C21 = 7.78 × 10¹⁰, C31 = C32 = 7.43 × 10¹⁰, C44 = 3.06 × 10¹⁰, C55 = C66 = 2.56 × 10¹⁰ Pa e31 = −5.2, e33 = 15.1, e15 = 12.7 c/m2 ε11 = 1475, ε33 = 1300 |
| Water (35 °C) | Density Acoustic velocity Dynamic viscosity | 990.15 kg/m3 1507 m/s 5.7977 × 10⁻⁴ kg/m.s |
| Material | αR | αT |
|---|---|---|
| Acrylic Glass Stainless steel | 0.138 0.594 0.876 | 0.862 0.406 0.124 |
Publisher’s Note: MDPI stays neutral with regard to jurisdictional claims in published maps and institutional affiliations. |
© 2022 by the authors. Licensee MDPI, Basel, Switzerland. This article is an open access article distributed under the terms and conditions of the Creative Commons Attribution (CC BY) license (https://creativecommons.org/licenses/by/4.0/).
Share and Cite
Phophayu, S.; Kliangklom, K.; Thongsri, J. Harmonic Response Analysis of Tank Design Effect on Ultrasonic Cleaning Process. Fluids 2022, 7, 99. https://doi.org/10.3390/fluids7030099
Phophayu S, Kliangklom K, Thongsri J. Harmonic Response Analysis of Tank Design Effect on Ultrasonic Cleaning Process. Fluids. 2022; 7(3):99. https://doi.org/10.3390/fluids7030099
Chicago/Turabian StylePhophayu, Suchada, Ketmanee Kliangklom, and Jatuporn Thongsri. 2022. "Harmonic Response Analysis of Tank Design Effect on Ultrasonic Cleaning Process" Fluids 7, no. 3: 99. https://doi.org/10.3390/fluids7030099
APA StylePhophayu, S., Kliangklom, K., & Thongsri, J. (2022). Harmonic Response Analysis of Tank Design Effect on Ultrasonic Cleaning Process. Fluids, 7(3), 99. https://doi.org/10.3390/fluids7030099