Article

Analysis of Tip Clearance Effect on the Transportation Characteristics of a Multiphase Rotodynamic Pump Based on the Non-Uniform Bubble Model

School of Mechanical Engineering, Beijing Institute of Technology, Beijing 100081, China
*
Author to whom correspondence should be addressed.
Fluids 2022, 7(2), 58; https://doi.org/10.3390/fluids7020058
Submission received: 6 January 2022 / Revised: 23 January 2022 / Accepted: 25 January 2022 / Published: 28 January 2022

Abstract

:
The multiphase rotodynamic pump is widely used in petroleum and gas exploitation, and blade tip clearance may cause flow instability and performance deterioration. In the present work, the influence of tip clearance on the transportation characteristic in a multiphase rotodynamic pump is investigated based on the non-uniform bubble model, in which the bubbles’ coalescence and break-up are considered. The influence mechanism of tip clearance on the energy performance is revealed. The results show that the leakage flow rate increases linearly with the increase in tip clearance, but variation in pump energy performance shows the opposite trend. In addition, a larger tip clearance results in a sharply decreased pressure increment in the impeller, while in the guide vane, the increment is raised slightly. For the 0 mm tip clearance condition, a positive vortex (relative to the impeller rotation direction) is observed in the impeller passage. However, the opposite leakage vortex is also found in the region near the tip clearance when the tip clearance is considered, and the vortex strength increases for a larger tip clearance.

1. Introduction

Energy is related to human development and social progress, and petroleum and gas resource exploitation has received increasing attention in the recent decades. However, due to the limitation of exploitation technology, petroleum and gas resource extraction accounts for only 15% of the global production [1]; therefore, it is urgent to develop this technology. In recent years, the multiphase pump technique has received much attention [2,3]. Compared to the traditional production platform of delivering petroleum and gas resources in a single-phase pump and compressor, only one pipeline is needed if the multiphase pump’s technology is used [4,5]. It is reported that the multiphase pump method can reduce the operation and maintenance costs of the transport systems by 40% and increase recovery by 10% [6].
A variety of investigations have been carried out to obtain the detailed flow mechanisms of the multiphase pump by numerical and experimental methods. For the experiment, the gas liquid flow pattern can be visualized by high-speed photography technology, and the visualization results show four types of flow pattern in the flow passage: isolated bubbles flow, bubbly flow, gas pocket flow, and segregated gas flow [7]. Furthermore, the experimental results demonstrate that the bubble size is influenced by the inlet gas volume fraction and rotation speed [8]. Moreover, an increase in bubble size will result in a decline in energy performance [9].
Based on the experiment measurement results, the numerical method is widely used to understand the detailed flow characteristics [10,11], which has a unique advantage in internal flow field investigations. It is reported that multiphase pump energy performance is directly related to the interphase forces between liquid and gas phases [12,13]. Drag force plays a dominating role among the interphase forces, which has an important influence on simulation accuracy [14,15]. Notably, the interphase forces are affected by the bubble size and distribution. Therefore, the bubble number equation is used to predict the variation in bubble diameter caused by the bubbles’ break-up and coalescence [16]. Furthermore, the gas cavity equation is developed by considering the bubbles’ coalescence near the impeller suction side [17]. In addition, a modified drag coefficient model is proposed under turbulent flow conditions, which takes the effect of turbulent flow on the bubble path into consideration [18].
According to the discussion above, the bubble size and distribution have a close relationship with the flow pattern. For a single-phase vane pump, one of the main reasons for flow instability is tip leakage flow [19,20]. The tip leakage is caused by the pressure difference between the pressure side (PS) and suction side (SS) [21,22,23]; it can also induce pressure fluctuation [24], unbalanced radical force [25], intense noise [26], and the cavitation phenomenon [27]. Results show that the pressure rise of an axial flow pump decreases by 41.39% when the tip clearance size increases from 0 to 0.8 mm under the single-phase condition [28]. Moreover, with increasing tip clearance size, the pump head and efficiency of the mixed flow pump decrease accordingly with a nearly linear rule [29].
In recent years, considerable works [30,31] have been conducted to investigate the mechanism of tip leakage flow in hydraulic machinery under the single-phase condition. Moreover, based on previous works, some effective methods have been approved to suppress tip leakage flow, such as the T shape tip [32] and C groove [33] in simple hydrofoils. In addition, the T shape tip [34] is successfully used in a mixed flow pump. According to the report, this method can improve efficiency by 1.86%, and the leakage flow rate decreases by up to 15.95%. To our knowledge, a control method that can be effectively used in a multiphase pump has not been reported, and one of the prime reasons is that the mechanism of tip leakage flow and its effect on the main flow are not fully understood.
In this work, the influence of tip clearance on the energy performance and the transportation characteristics in a multiphase rotodynamic pump are systematically investigated as follows. Firstly, flow simulations of the pump are conducted using the non-uniform bubble model and modified drag force model. Then, the distributions of vorticity, gas volume fraction, turbulence kinetic energy, and pressure increment are presented under different tip clearance sizes. Finally, the energy performances are given to reveal the relationship between energy performance and flow field. The present work provides a foundation for the suppression of tip leakage flow.

2. Physical Model and Numerical Methods

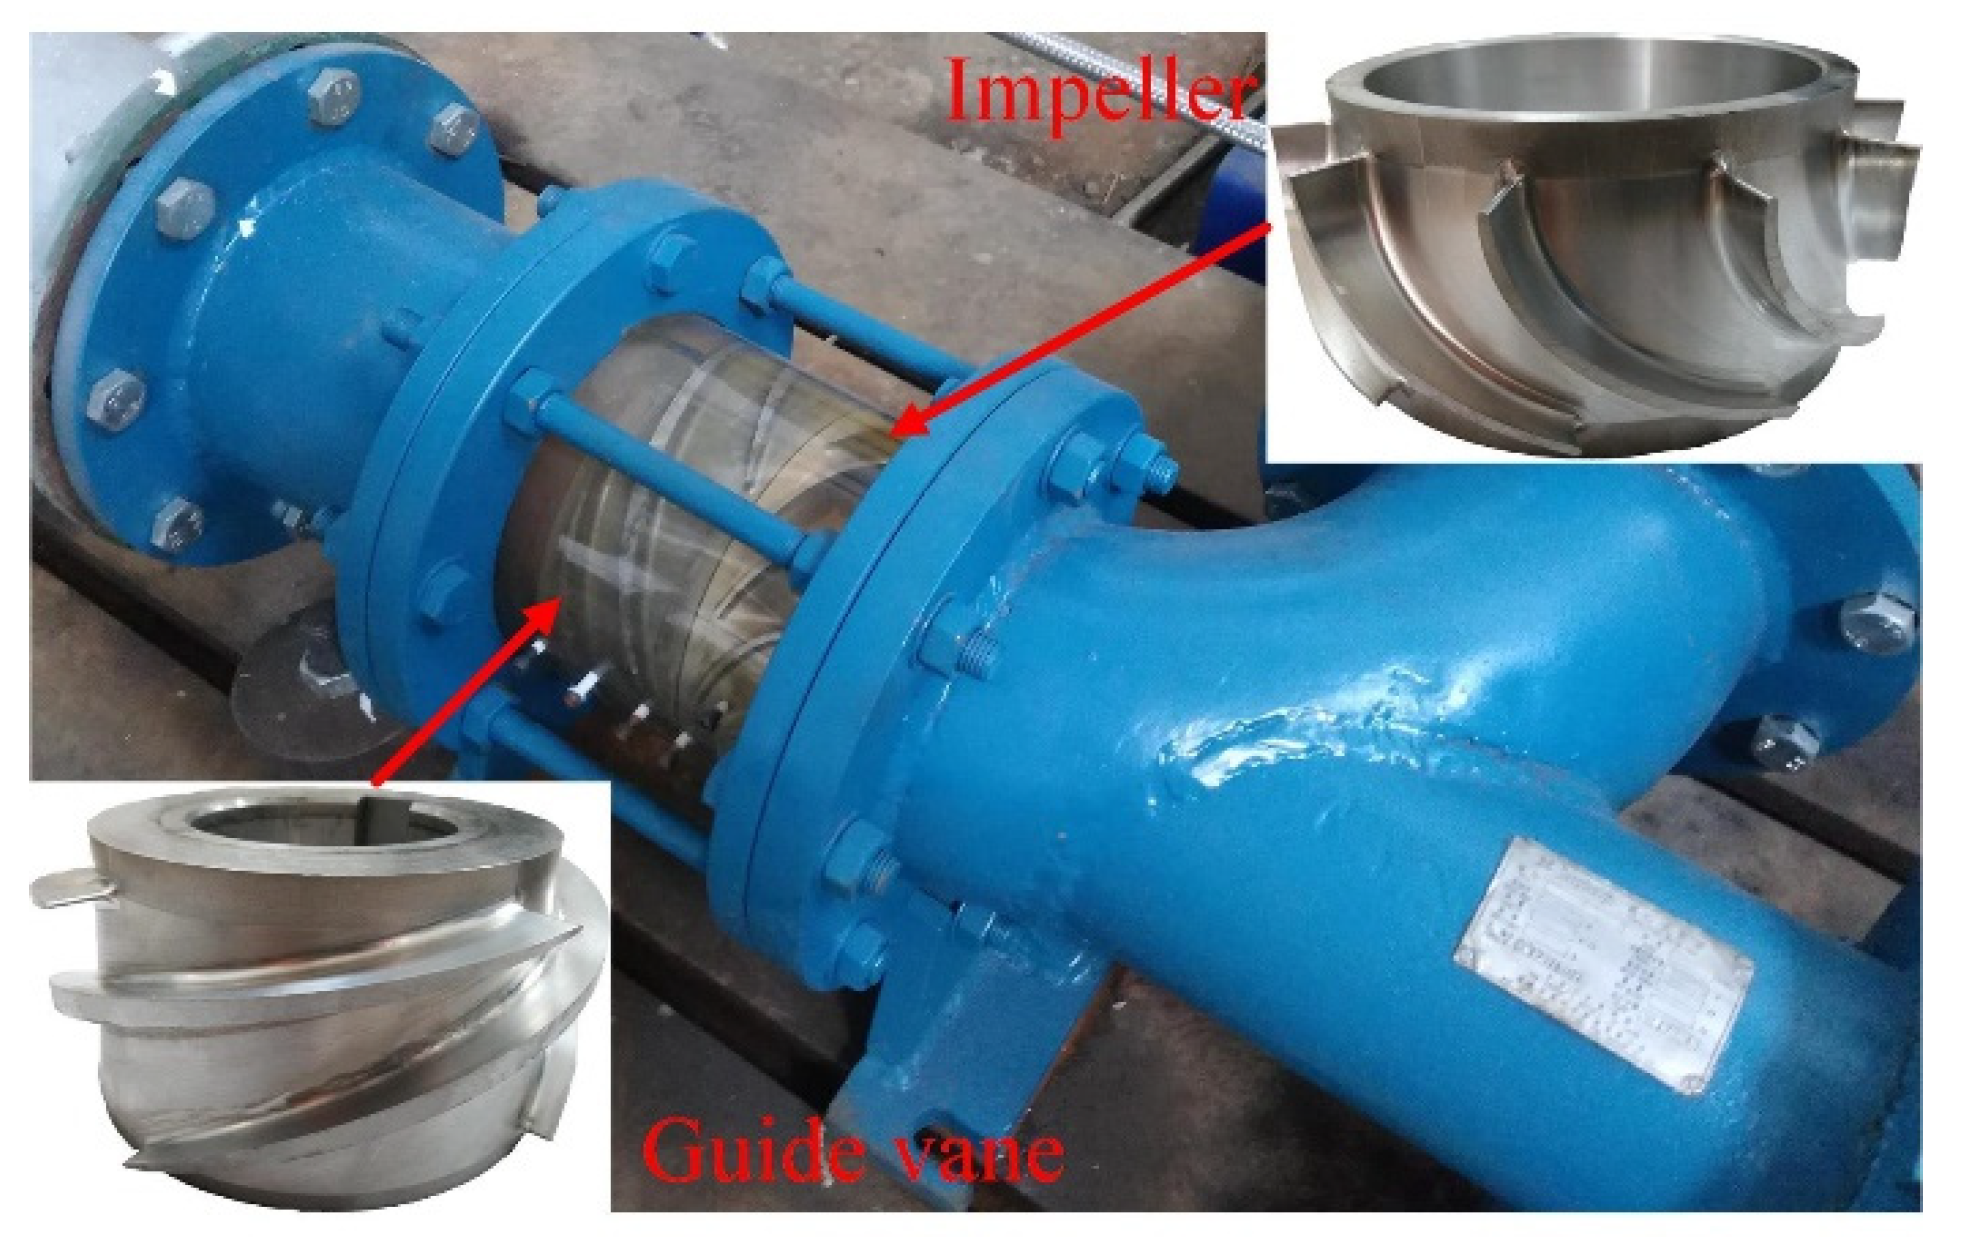
2.1. Geometrical Model of the Pump

A single-stage multiphase pump with 4 impeller blades and 11 guide vane blades was employed in this work. The primary parameters of the pump are given in Table 1, and the tested pump is shown in Figure 1. The tip clearance size δ of the tested pump is 0.4 mm.

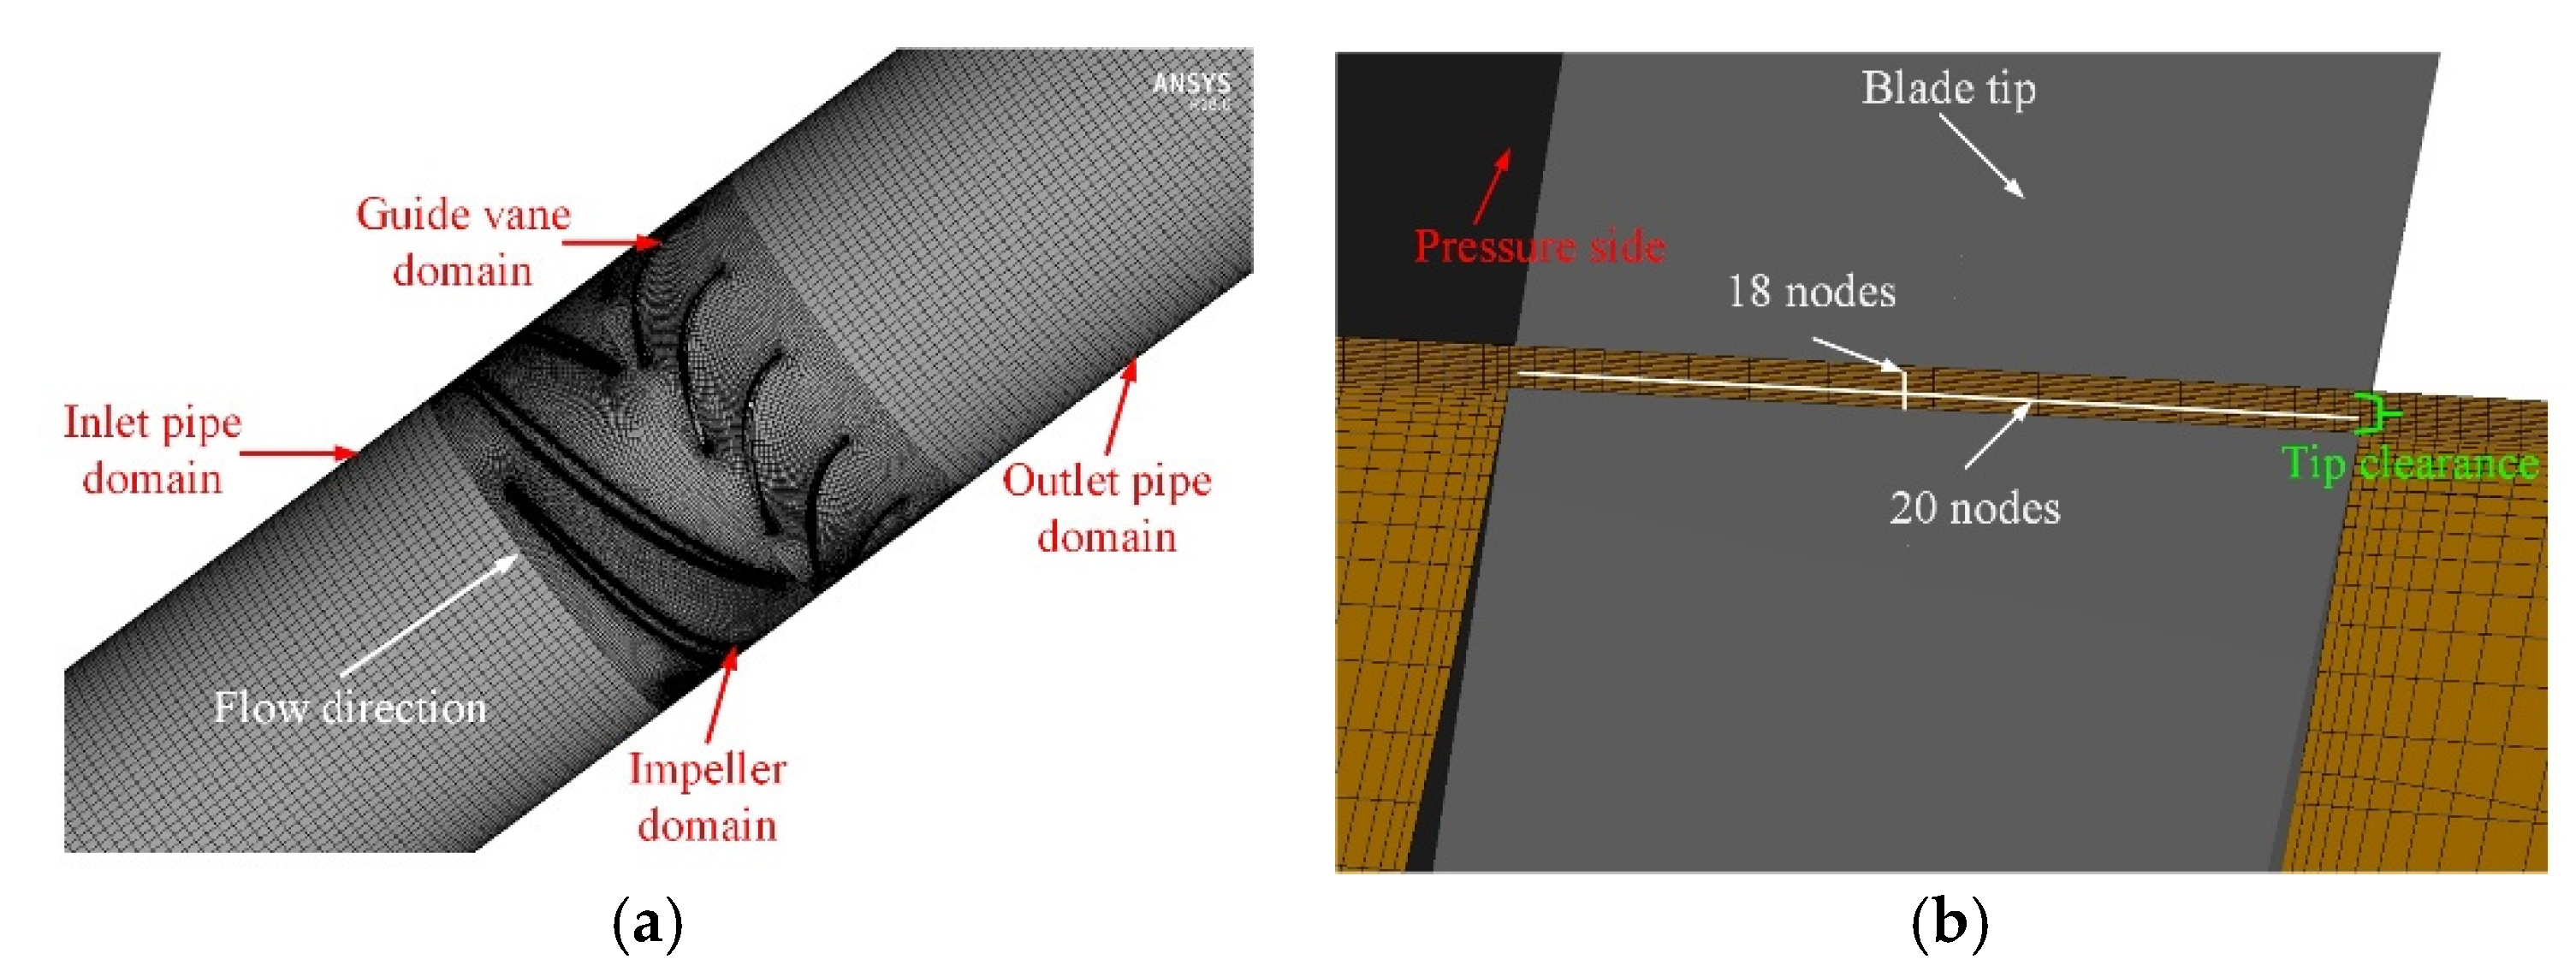
2.2. Mesh Arrangement

In this work, a hexahedral mesh is used to discretize the computational domain (as shown in Figure 2a). To obtain the detailed flow characteristics around the blade surface and tip clearance region, mesh refinement is adopted. As shown in Figure 2b, there are 20 nodes from the pressure side (PS) to the suction side (SS), and 18 nodes are arranged from the blade tip to the shroud. According to the independence test of mesh number, as shown in Table 2, when the number of whole passages increases to 3,583,423, there is limited influence on the pressure increment (Δp). Therefore, Mesh 3 with 3,583,423 elements is used in the present work, and detailed information is given in our previous work [17].

2.3. Non-Uniform Bubble Model (NUBM)

Based on the visualization results, the bubble diameter, Db, changes during the impeller rotation in the multiphase pump [8]. Therefore, a non-uniform bubble model is developed to simulate the Db variation. In this model, the variation is presented by the bubble number density, ξ, which is defined as follows:
ξ = α g π / 6 D b 3 ,
where, αg is the gas phase volume fraction.
As ξ is an unknown variable, the conservation equation of ξ is employed, which is expressed as follows:
ξ t + ( ξ U g ) = ψ br ψ co + ψ ph ,
where t denotes time. Ug is the gas phase relative velocity vector; and ψbr, ψco and ψph are the source terms relevant to break-up, coalescence, and phase change, respectively (the last term being neglected here). The expressions of ψbr and ψco are shown as follows:
ψ br = C br ( 1 α g ) ( ε D b ) 1 / 3 ξ exp ( W e c W e ) ,
W e = 2 ρ ε 2 / 3 D b 5 / 3 σ ,
where Cbr is the break-up coefficient, which is set as 1; ε is turbulent dissipation; ρl is the water density. σ is the surface tension coefficient; and We and Wec are the Weber number and the critical Weber number, respectively. The value of Wec has been studied extensively, and it is taken as 1.5 [35].
ψ co = C co ( 1 α g ) η co ε 1 / 3 D b 7 / 3 ξ 2 ,
where Cco is the coalescence coefficient, which is taken as 3.0, and ηco is the efficiency of coalescence behavior, defined as follows:
η co = exp ( W e 4 K co D b 3 ε ) .

2.4. Drag Force Model

According to previous investigations [12,13,14], the interphase force mainly includes drag force, FD,k; lift force, FL,k; added mass force, FA,k; and turbulent dispersion force, FT,k, in the multiphase pump. However, FD,k plays a leading role in those forces [14], and it is expressed as follows:
F D , l = F D , g = 3 4 C D ρ l D b α g | U g U l | ( U g U l ) ,
where Ul and Ug are the velocity vectors of the liquid phase and gas phase, respectively, and CD is the drag coefficient. The Schiller Naumann model (Equation (8)) has been widely used to calculate CD.
C D _ SN = max ( 24 ( 1 + 0.15 Re 0.687 ) Re , 0.44 ) .
The Schiller Naumann model is built based on the investigation of a single spherical particle. Therefore, CD is modified by considering the interaction of bubbles [36] in the present work, and the modified CD (CD_mod) is expressed as follows:
C D _ mod = max ( 24 ( 1 + 0.1 Re b 0.75 ) Re b , 2 3 D b ( ρ l ρ g ) σ ( 1 α g ) 0.5 ) ,
where Reb is the modified Reynolds number, which is shown as
Re b = ρ l D b | U l U g | μ l ( 1 α g ) ,
where μL is the liquid phase dynamic viscosity. Reb is usually calculated based on the specific Db. In the present work, Reb is modified using the non-uniform Db, as described in Section 2.3.

2.5. Calculation Settings

According to previous studies, the Shear Stress Transport (SST) k-ω turbulence model is used for the turbulent flow of the liquid phase, and the governing equations of the gas phase are solved by the Dispersed Phase Zero Equation [3,13,17]. The total mass flow rate and volume fraction for gas and liquid phases are set at the computational domain inlet, while at the outlet, the average pressure is defined. The no-slip wall condition is applied on the wall. As the tip clearance is considered in this simulation, a counter-rotating wall condition is applied on the impeller shroud. The non-uniform bubble model and the modified Schiller Naumann model are encoded in CFX using the CFX expression language [37].

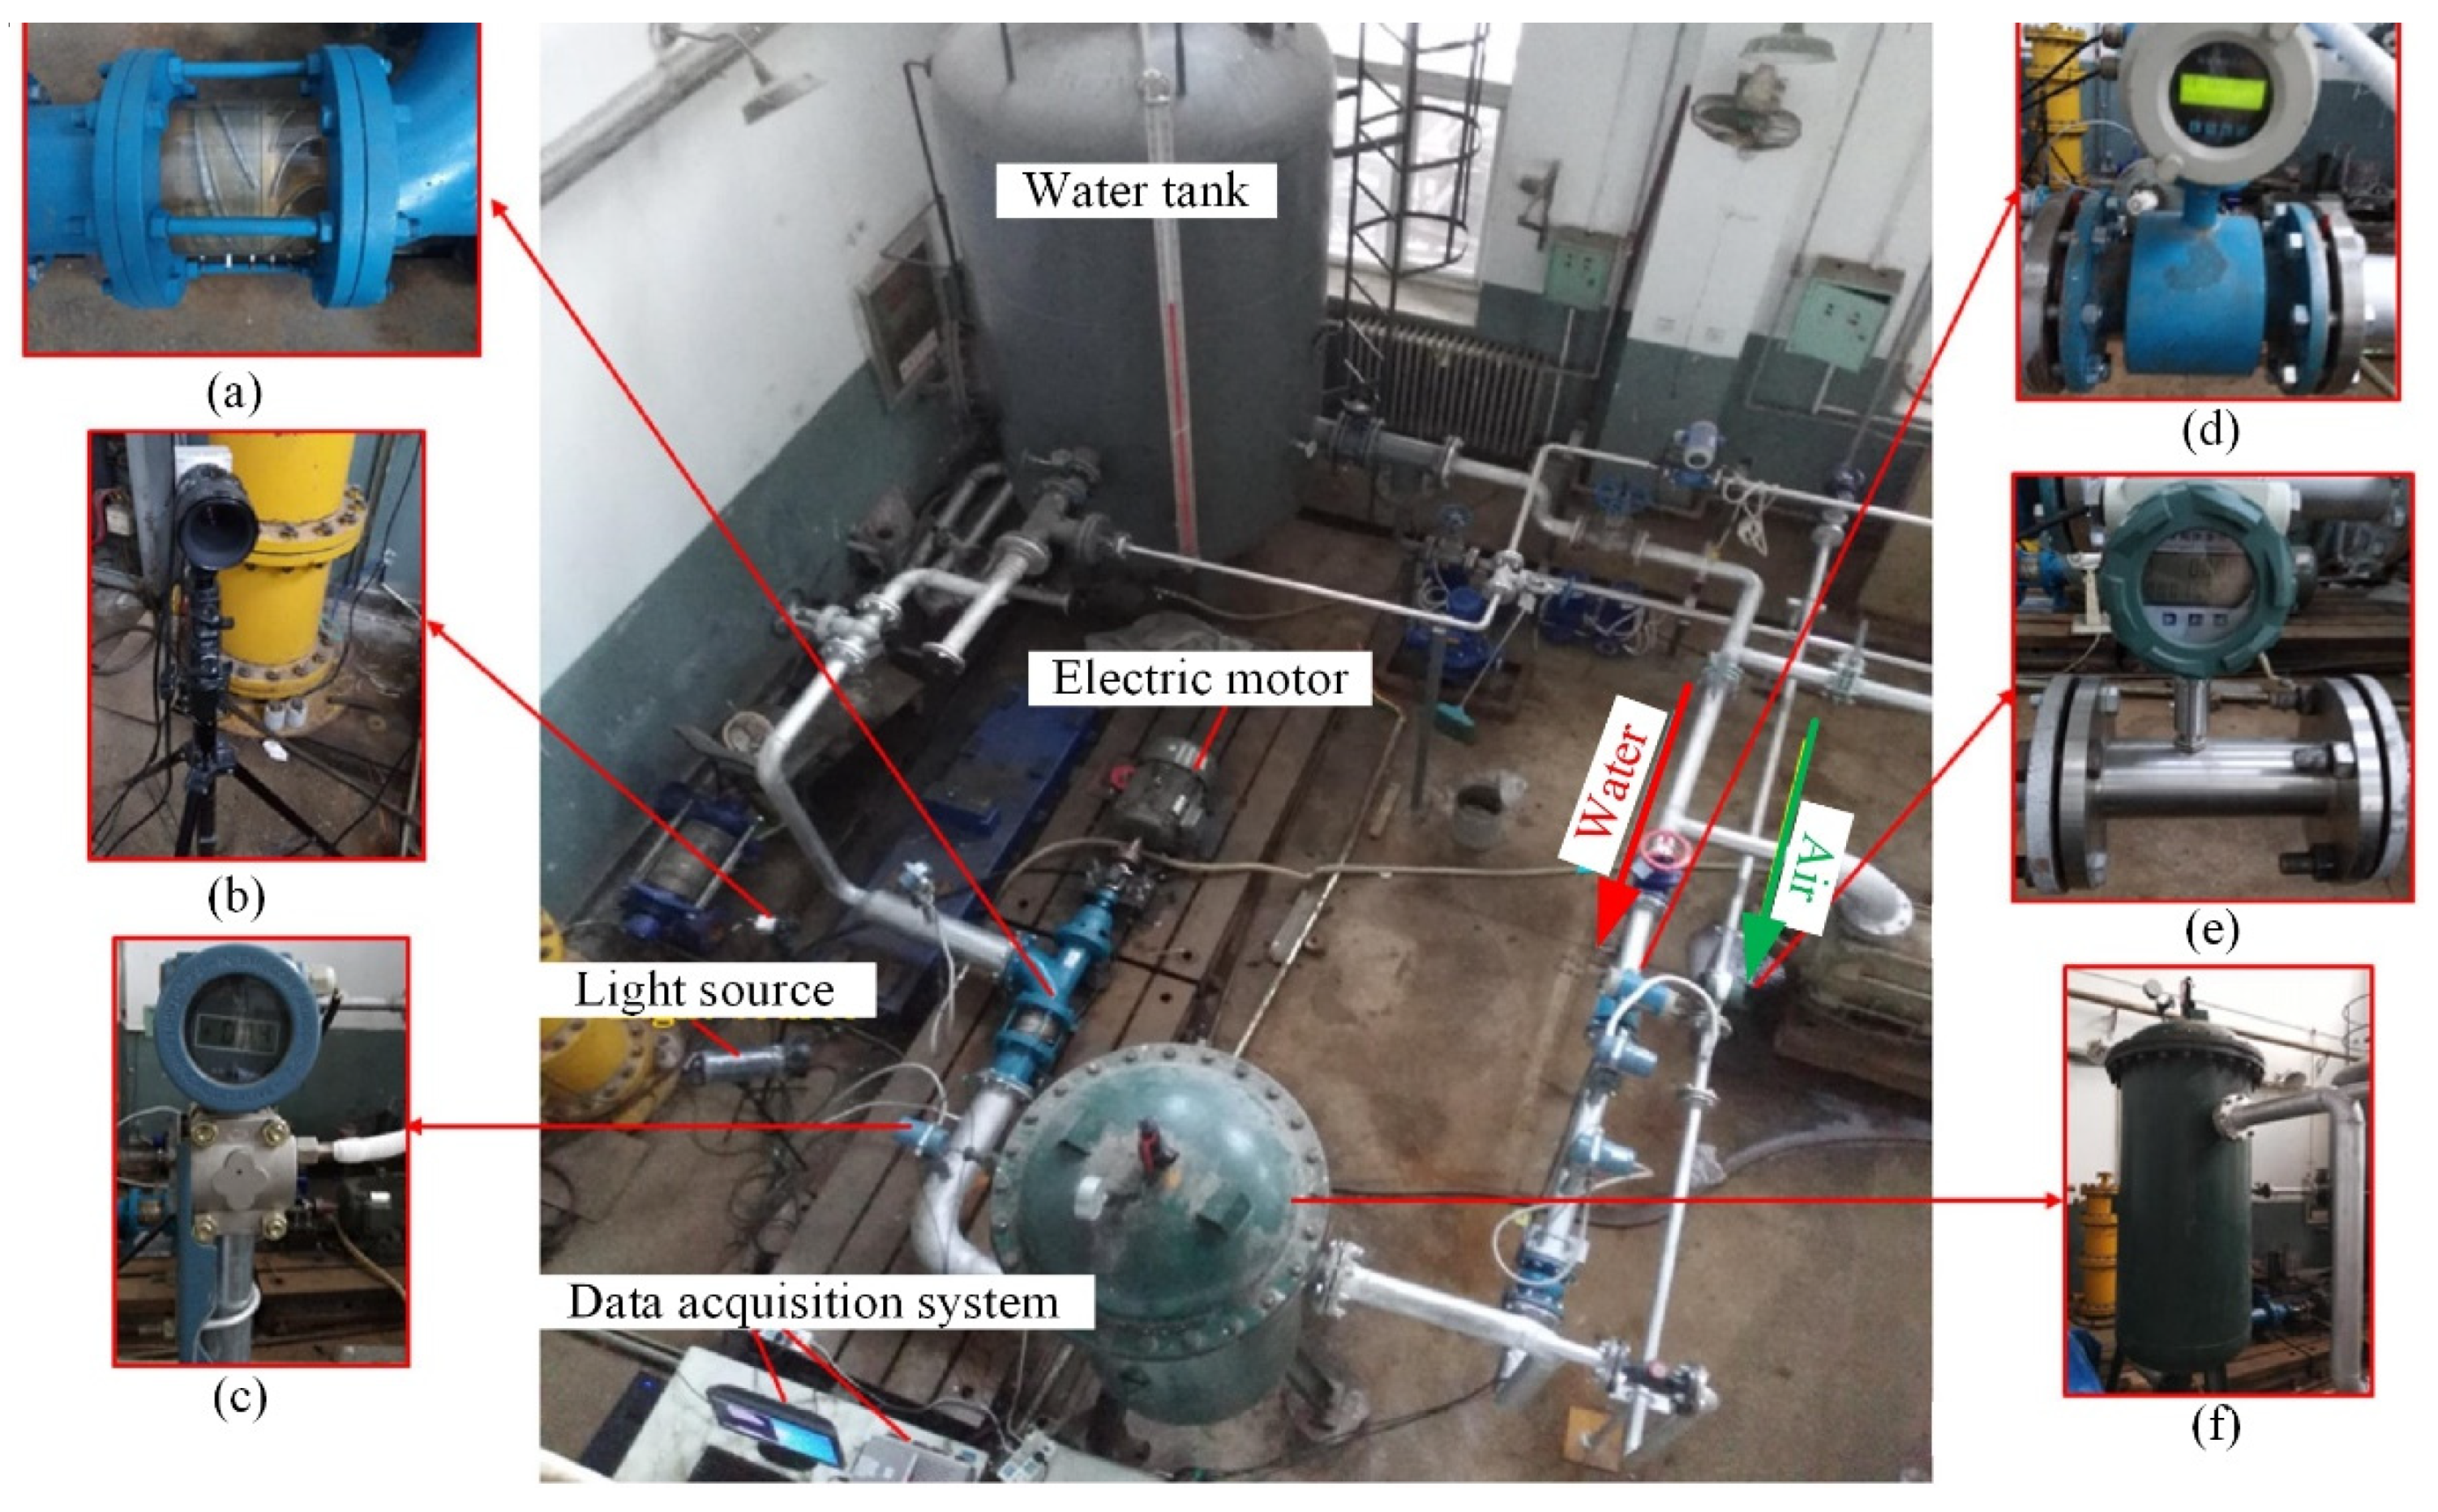
3. Experimental Setup

Experimental measurement of the energy performance when handling the mixture of water and air is carried out in a test bench for hydraulic machinery, as shown in Figure 3. The gas and liquid phases are provided by the air compressor and the water tank, respectively. The two fluids are mixed in the buffer tank and then transported to the water tank by the tested pump. The water tank is opened, so the gas phase eventually overflows from the water tank due to the density difference.
The water and air flow rates are measured by an LDBE-80 electromagnetic flowmeter (Jinhu Simeite Instrument Co., LTD, Huaian, China) with an accuracy of 0.5% and an LWQ-50 turbine flowmeter (Jiangsu Fenghui Instrument Co., LTD, Huaian, China) with an accuracy of 1.5%, respectively. A 1151 pressure transducer (Beijing Chengchuang Tiansheng Automation Technology Co., Ltd., Beijing, China) is used to measure the tested pump inlet and outlet pressure, and the accuracy is 0.1%. Considering the possibility of negative pressure at the pump entrance, the range of the inlet pressure transducer is −0.1–1.6 MPa. In addition, a CYT-302 torque speed sensor (Beijing Haibohua Technology Co., LTD, Beijing, China)is employed to test the pump shaft rotational speed and torque, and the accuracy is 0.2%. Thus, the uncertainties of the head and efficiency are 0.79% and 0.81%, respectively.

4. Results and Discussion

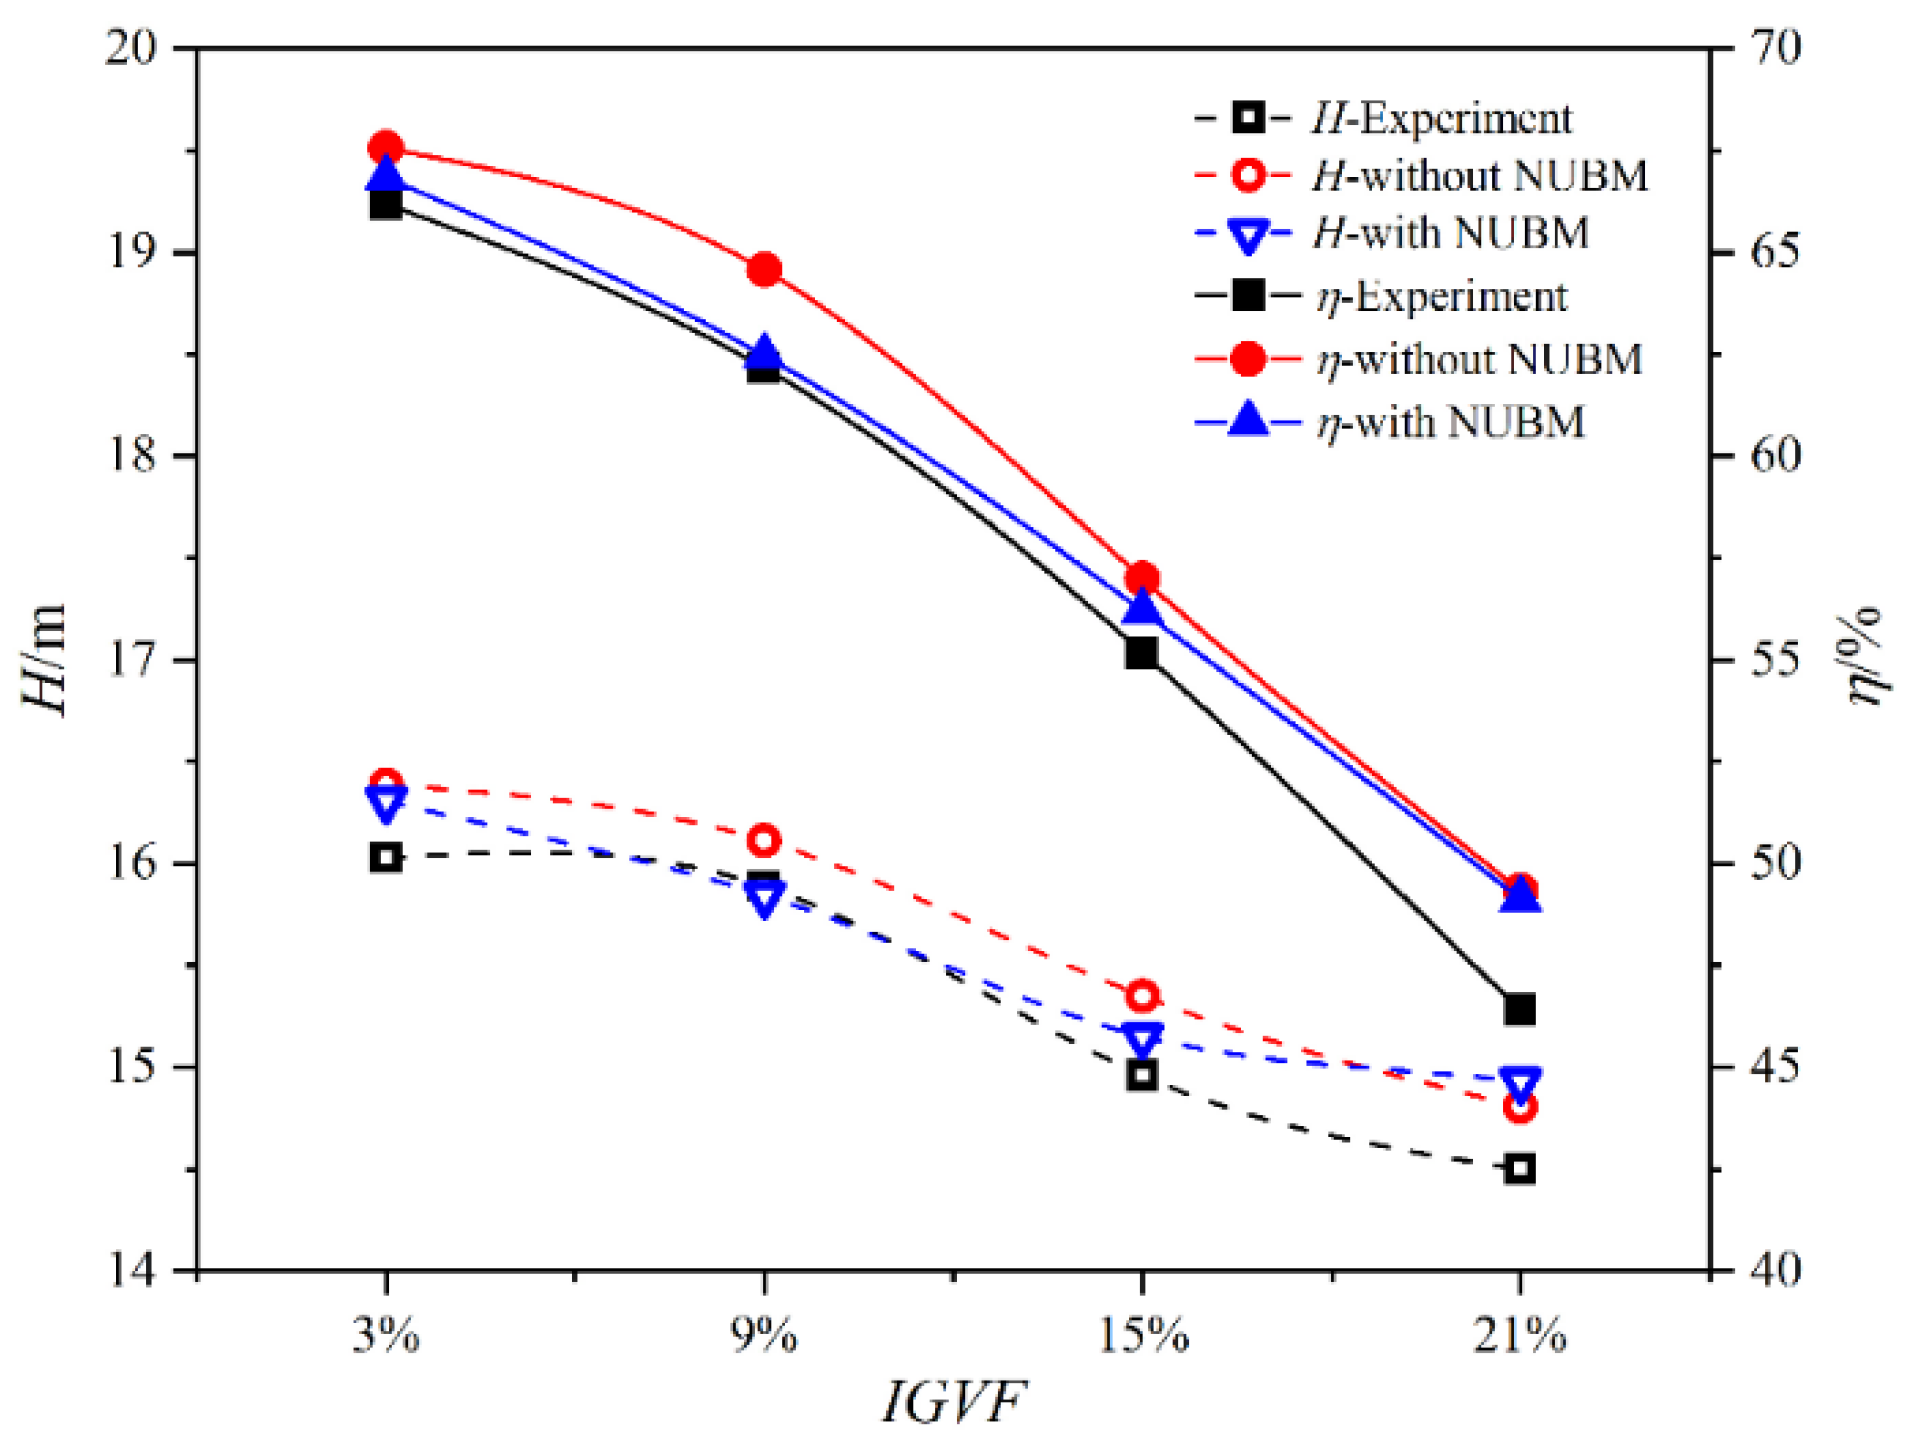
4.1. Validation of the Simulation

As shown in Figure 4, an experimental measurement with an inlet gas volume fraction (IGVF) ranging from 3% to 21% is chosen to verify the simulation result with and without the NUBM. In comparison with the NUBM case, the result with NUBM is closer to the experimental result, especially under low IGVF conditions (IGVF ≤ 15%). Therefore, the NUBM method is qualified for the following calculations. Notably, the IGVF = 9% is chosen for the following investigations.

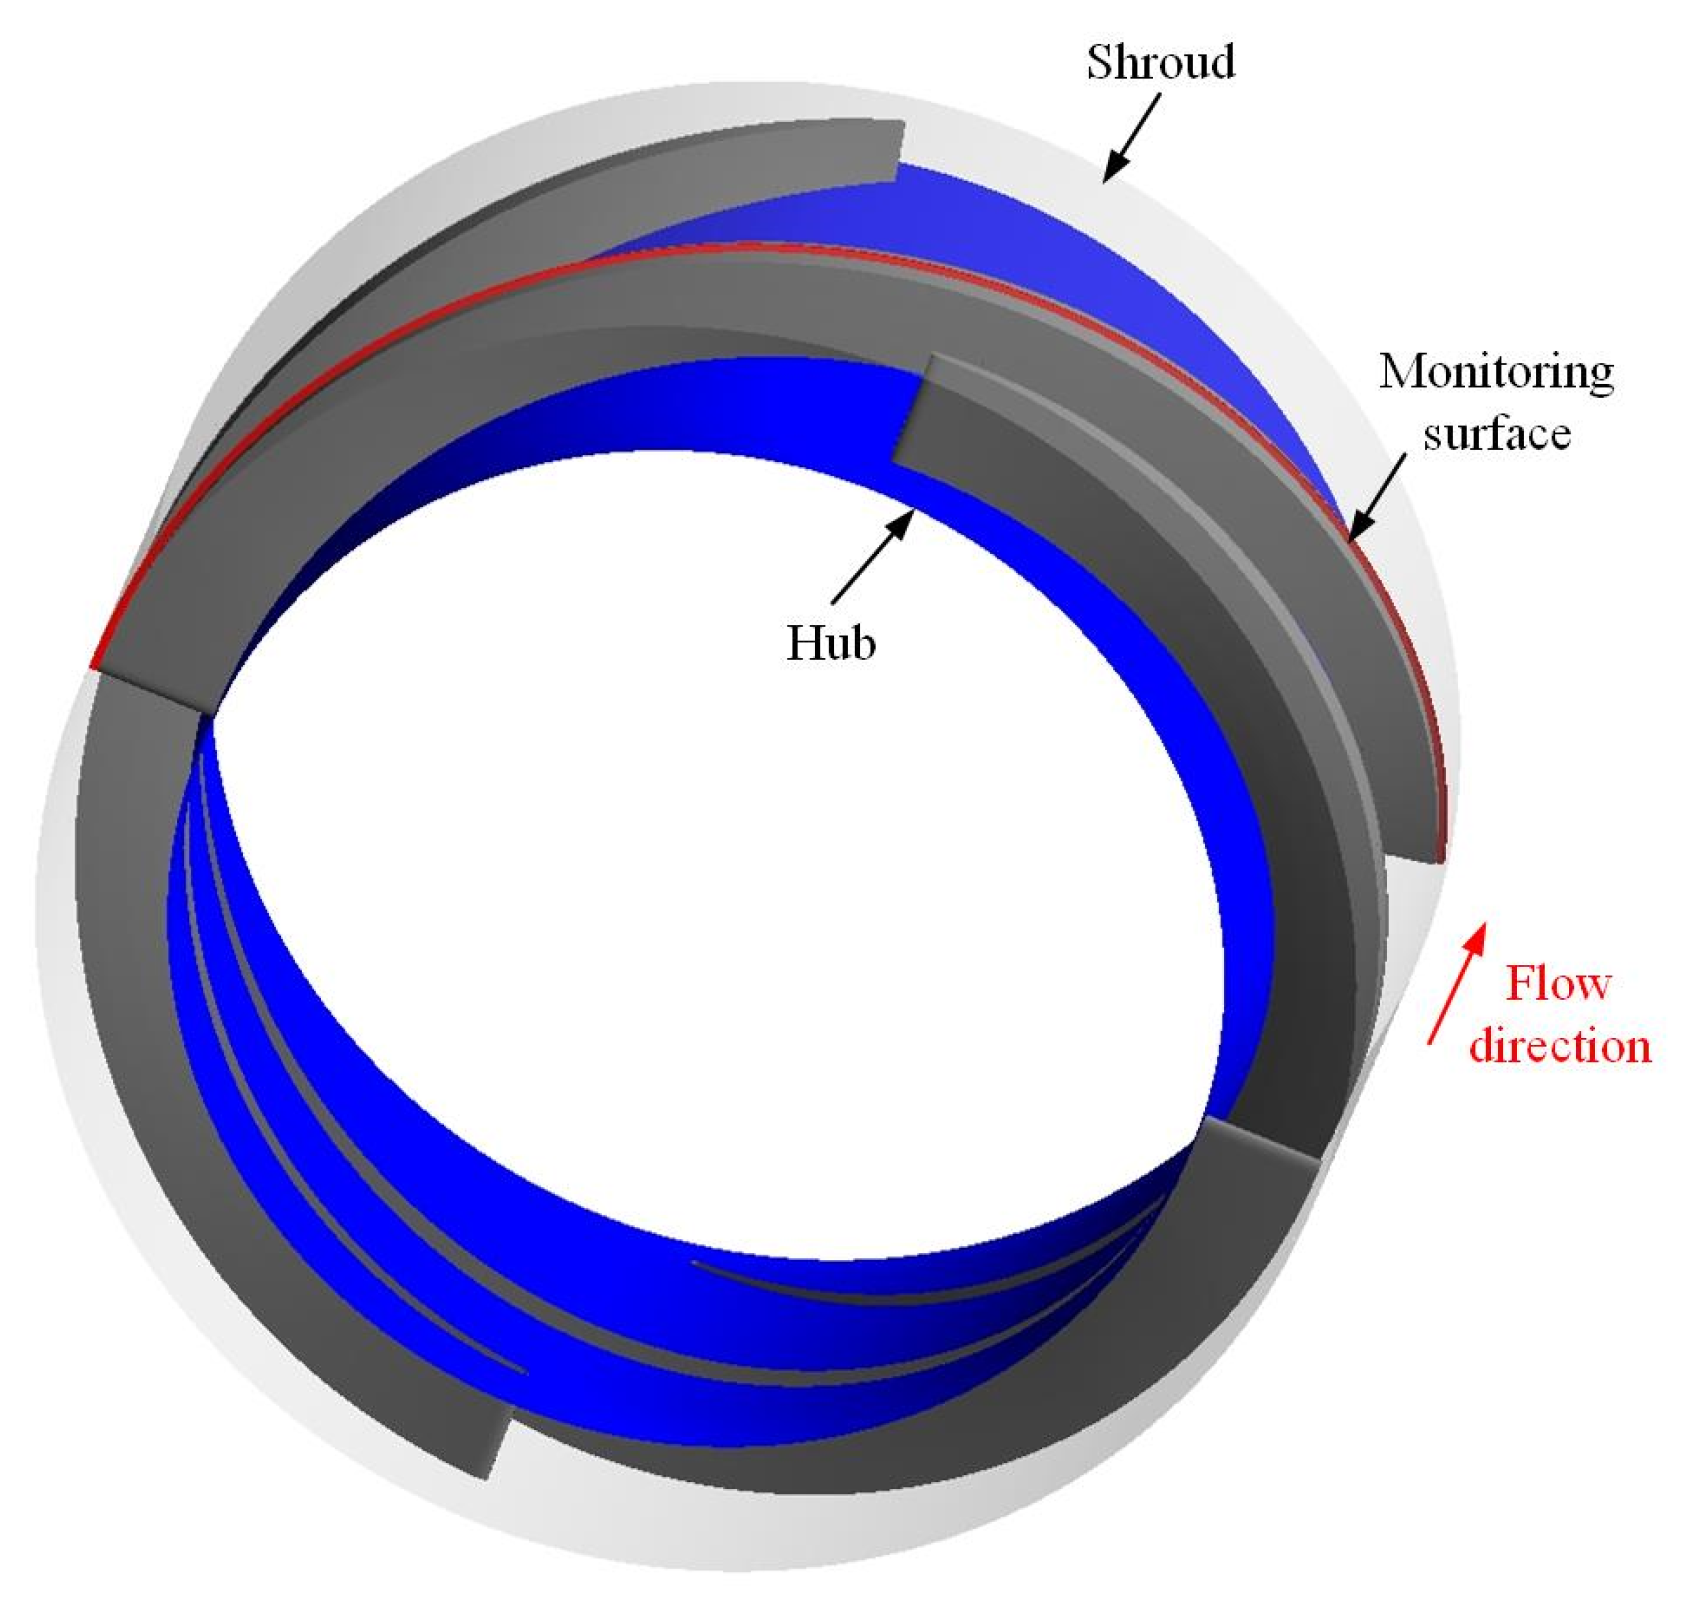
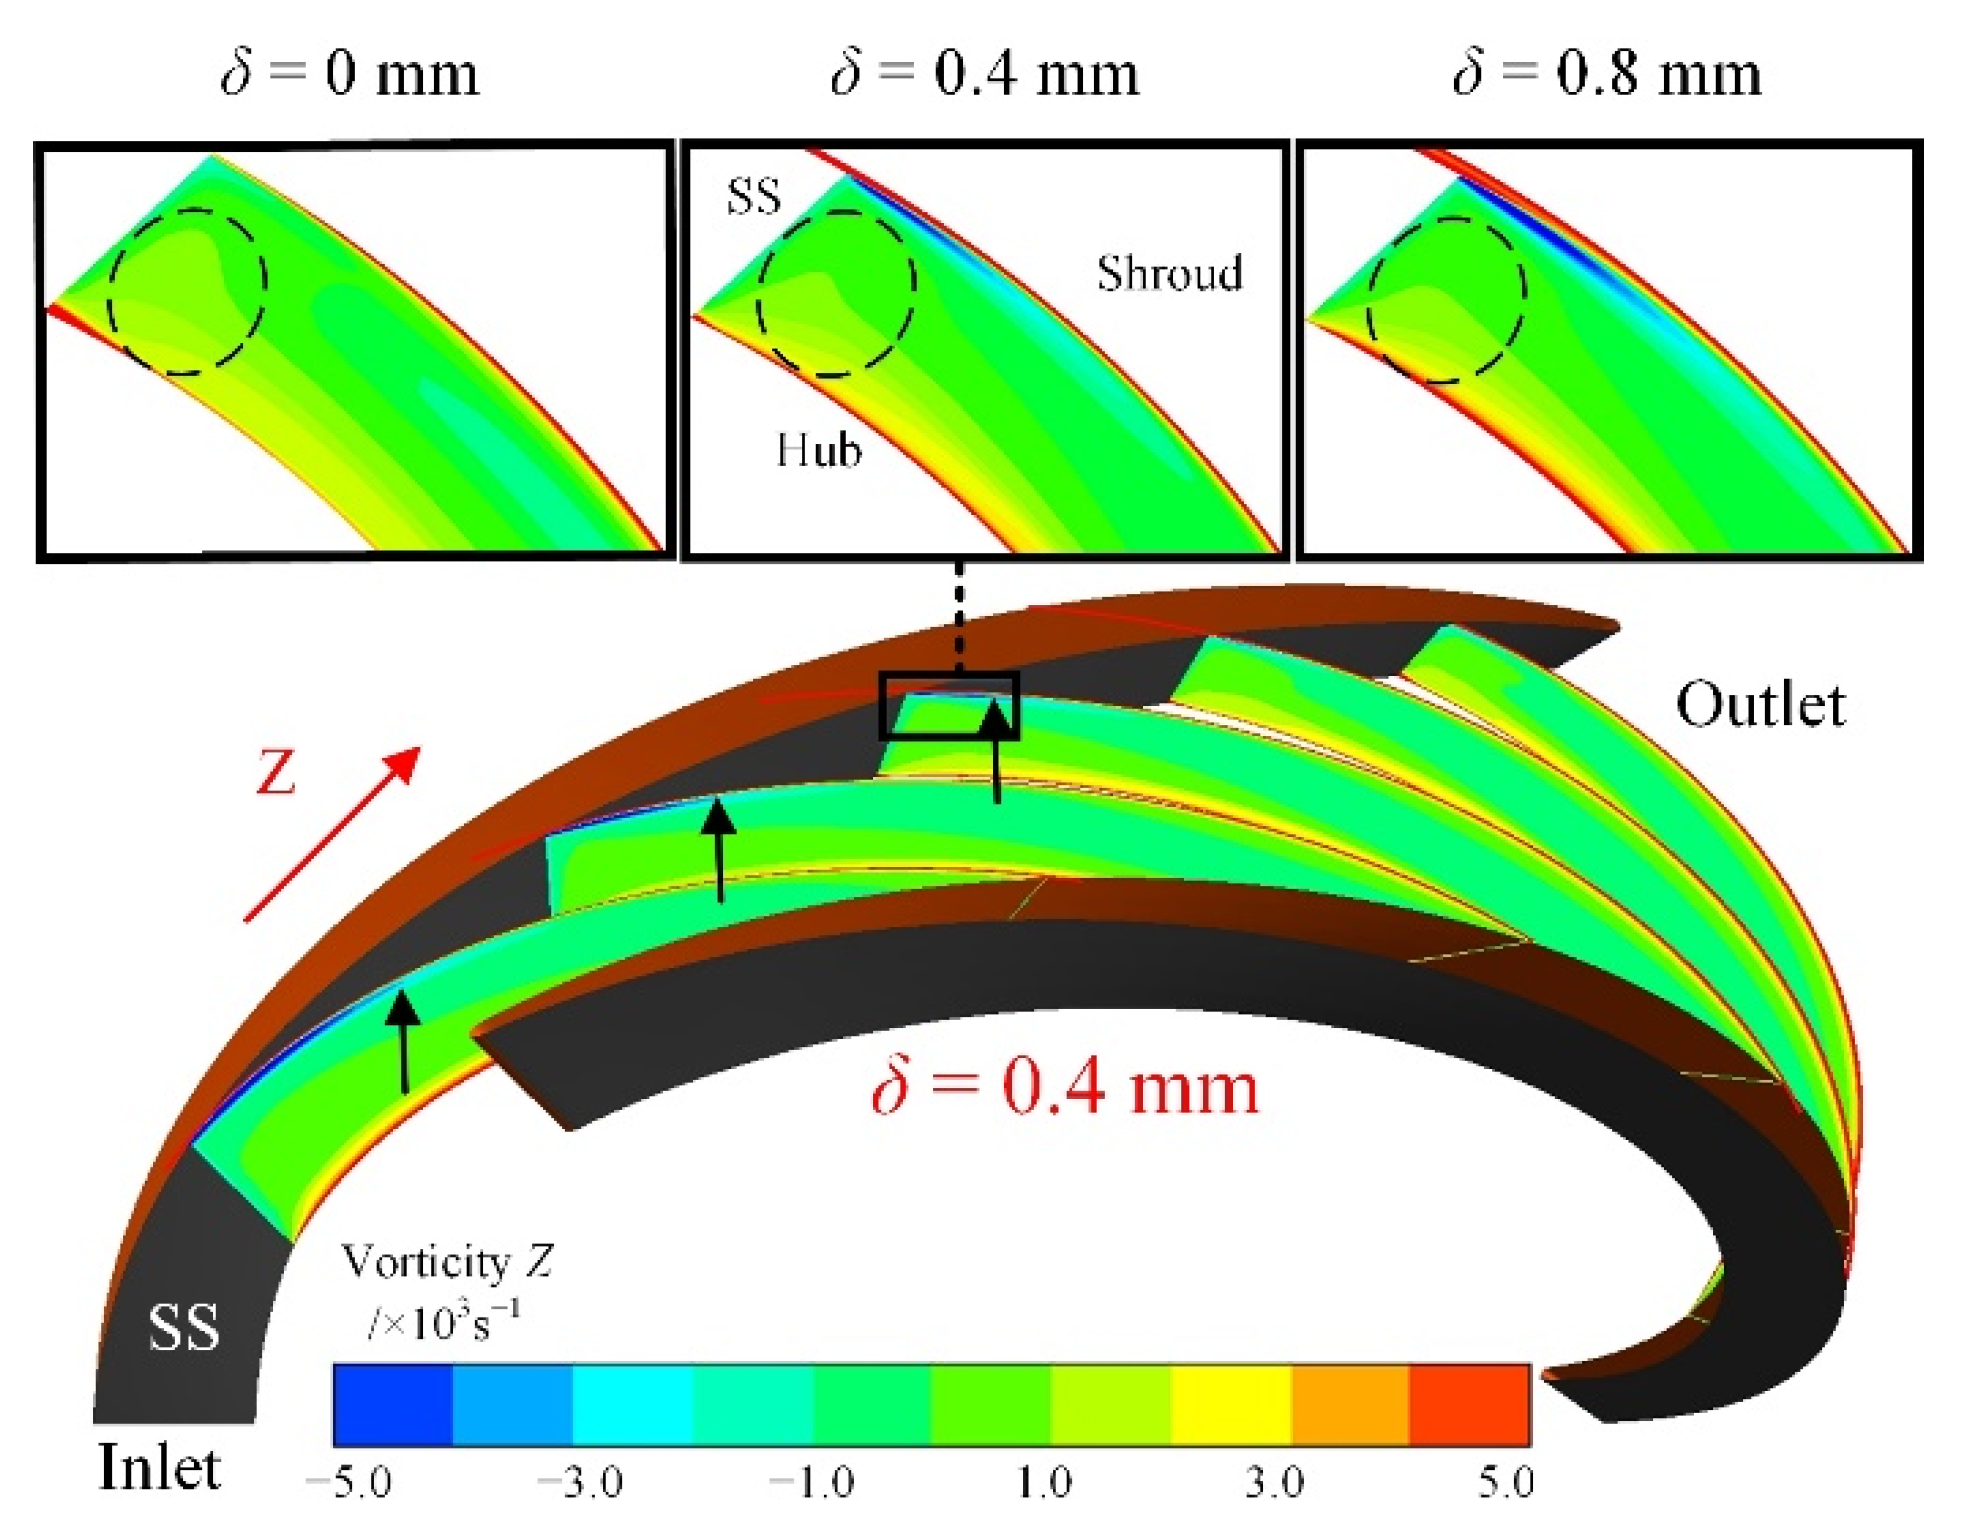
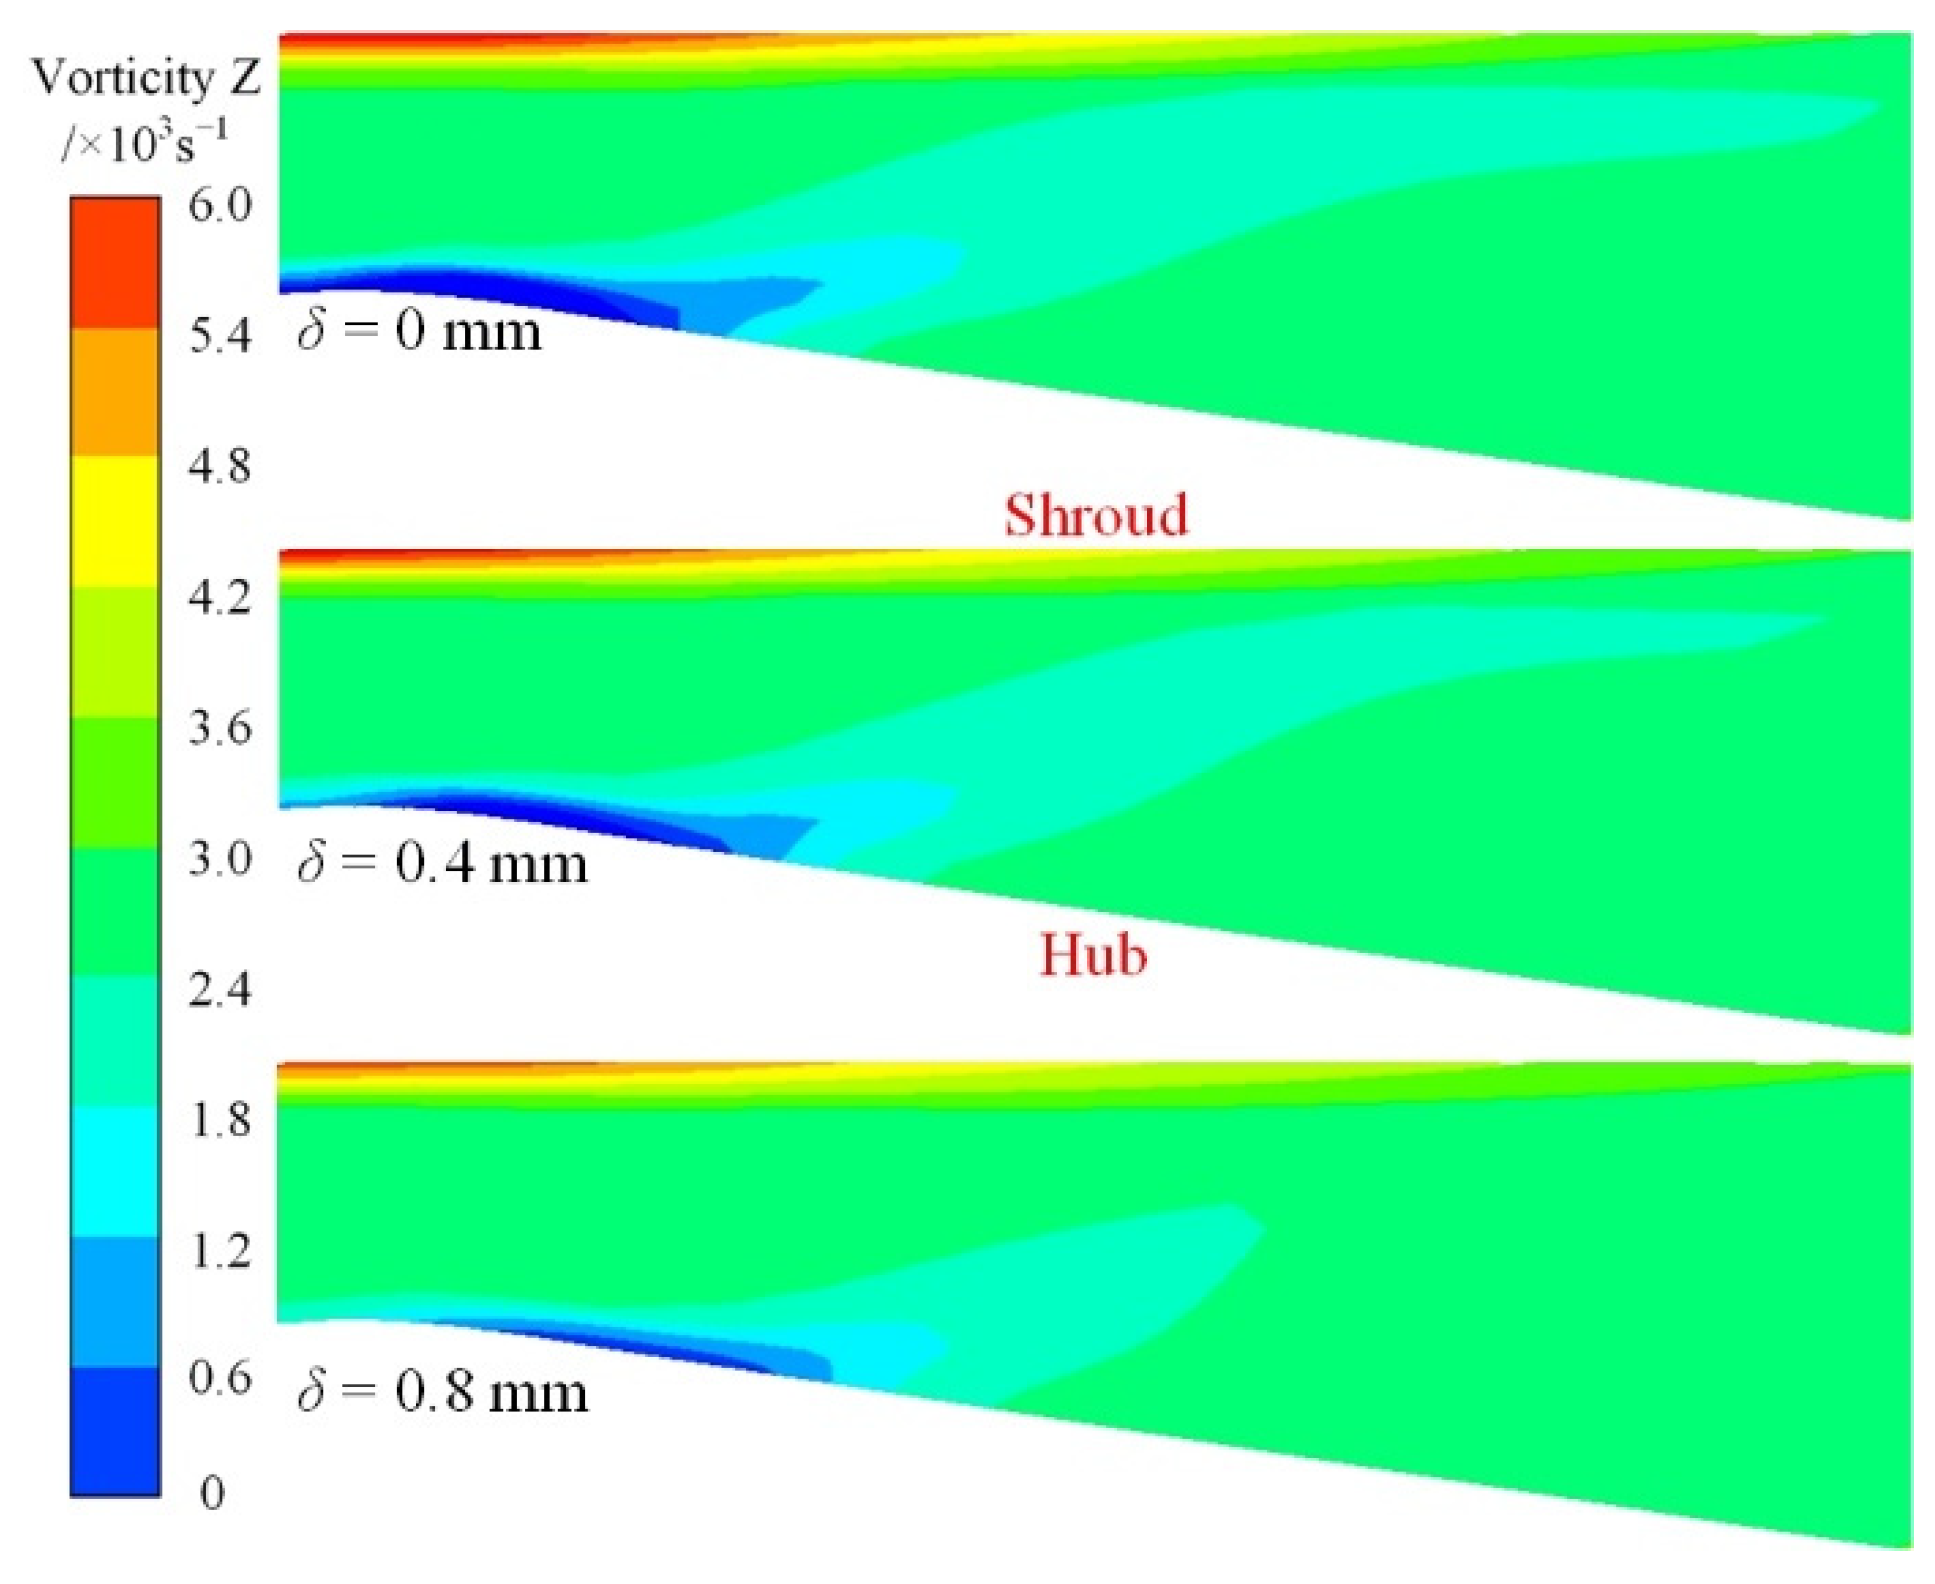
4.2. Leakage Flow Rate and Leakage Vortex

To reveal the influence of tip clearance on multiphase pump transportation by the numerical method, five tip clearance sizes ranging from 0.2 mm to 1.0 mm are employed in the investigation, which is approximately 1.74–8.70% of the mean blade height.
The mass flow rate of leakage flow, QL, is monitored to quantitatively analyze the effect of δ on the energy performance of the pump. Figure 5 shows the schematic diagram of the monitoring surface (marked by the red surface) in the region of tip clearance along the blade chord.
Figure 6 shows the variations in H, η, and QL/Q with the increase in δ under the design flow rate. It reveals that the QL sharply increases as the δ increases, and the variation is linear in the range 0 mm to 1 mm. The variations in H and η show the opposite trend due to the higher disturbance of the larger leakage flow rate. The fitting linear relationships for QL, H, and η with δ are expressed as QL = 2.00547 × δ + 0.03558, H = −8.12295 × δ + 18.42373, and η = −12.61436 × δ + 63.91689, respectively.
Leakage flow will lead to a tip leakage vortex, and the characteristics of the vortex can influence the distribution of the gas phase and further induce variation of the impeller pressurization ability. The Z component of vorticity (vorticity Z) on the circumferential sections is shown in Figure 7. In addition, the magnification (marked by the black rectangle) for different tip clearance sizes is also presented at the top of Figure 7. Comparing the vorticity distributions for different tip clearance sizes, a positive vortex (relative to the impeller rotation direction) can be observed in the impeller passage under the condition of δ = 0 mm. However, for a δ of 0.4 mm or 0.8 mm, the opposite leakage vortex is also found in the region near the tip clearance of the SS, and it will strengthen with the increase in δ. Moreover, an increase in δ leads to a reduction in the passage vortex (marked by the black dashed circle) strength, which is due to the interference of leakage vortex. The leakage vortex strength can also be seen to gradually weaken along the streamwise direction, as presented by the black arrow, which is related to the decreased pressure difference between the PS and SS.
Figure 8 displays the vorticity Z on the meridional plane in the guide vane. Due to the extended structure of the guide vane, the separation vortex occurs near the hub and develops to the shroud along the streamwise direction. In Figure 6 and Figure 7, the tip leakage flow rate and leakage vortex intensity increase sharply at larger δ, together with higher flow loss. Therefore, the fluid kinetic energy and inertia force decrease in the guide vane inlet, and the vortex intensity weakens as the δ increases accordingly. In addition, the effect of wall friction leads to the vortex structure near the shroud, while the vortex rotation direction is different from the separation vortex near the shroud. Similarly, an increase in δ causes a weakened vortex strength, which is also related to the increased flow loss in the impeller.
Figure 9 shows the variation in average turbulence kinetic energy (TKE) from the impeller inlet to the guide vane outlet for different tip clearance sizes. When the tip clearance is neglected, due to the effect of impeller work, the TKE gradually rises along the streamline in the impeller. For the condition of δ = 0.4 mm, the TKE increases sharply relative to δ = 0 mm, which is related to the disturbance of tip leakage flow. In addition, the variation in TKE shows the opposite trend, which can be explained by the decreased strength of the tip leakage vortex along the flow direction, as shown in Figure 7. As δ increases to 0.8 mm, the magnitude and descent rate of TKE further increase. When the fluid media flow into the vanless region, the flow is mainly influenced by the effect of rotor-stator interaction for δ = 0 mm, and it shows an increasing trend. The tip leakage flow is another factor in the flow stability for this region when the tip clearance is considered. In addition, Figure 9 shows that the variation in TKE in the vanless region will continue to decrease in this region, which indicates that the effect of tip leakage flow plays a leading role in the flow stability in this region for δ = 0.4 or 0.8 mm. In the guide vane, as a whole, the TKE gradually increases along the flow direction regardless of whether it is with or without tip clearance. However, the magnitude of TKE decreases with increasing δ, which can be explained by the weakened flow separation, as shown in Figure 8.

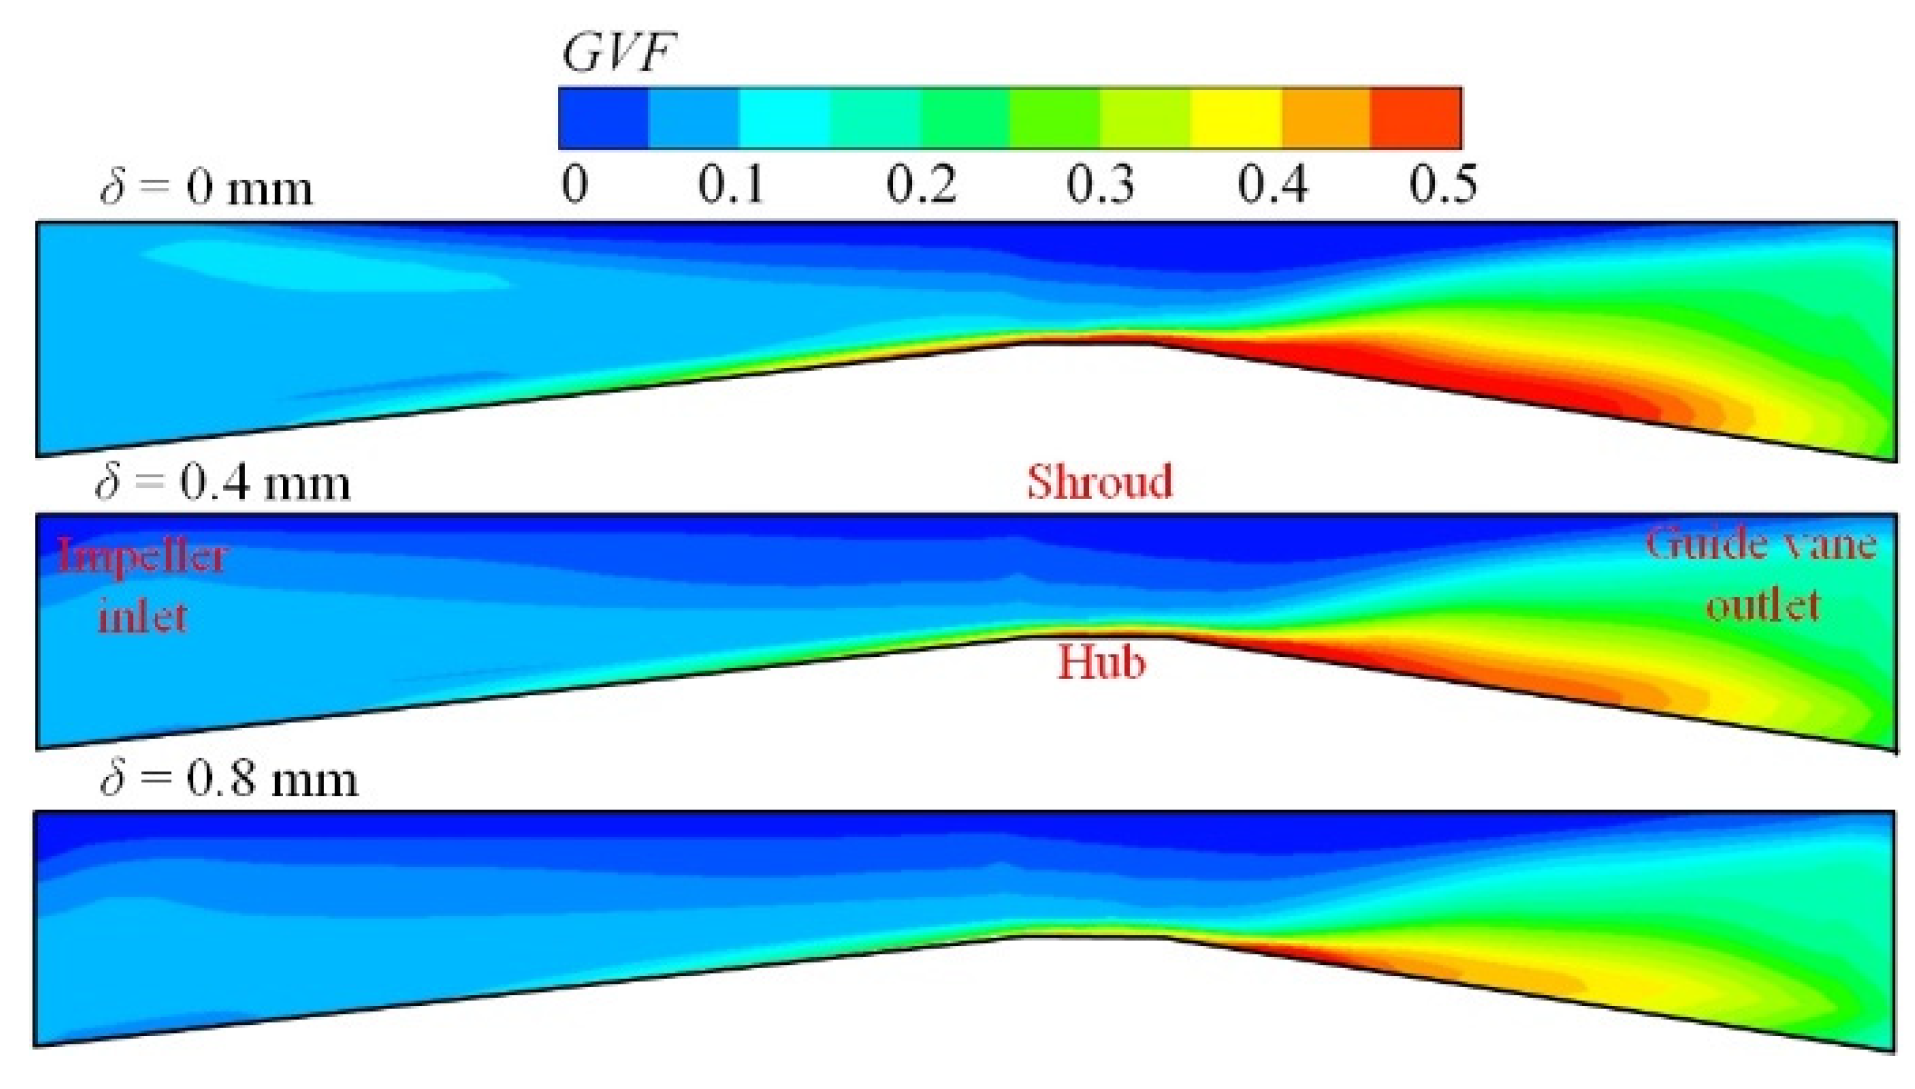
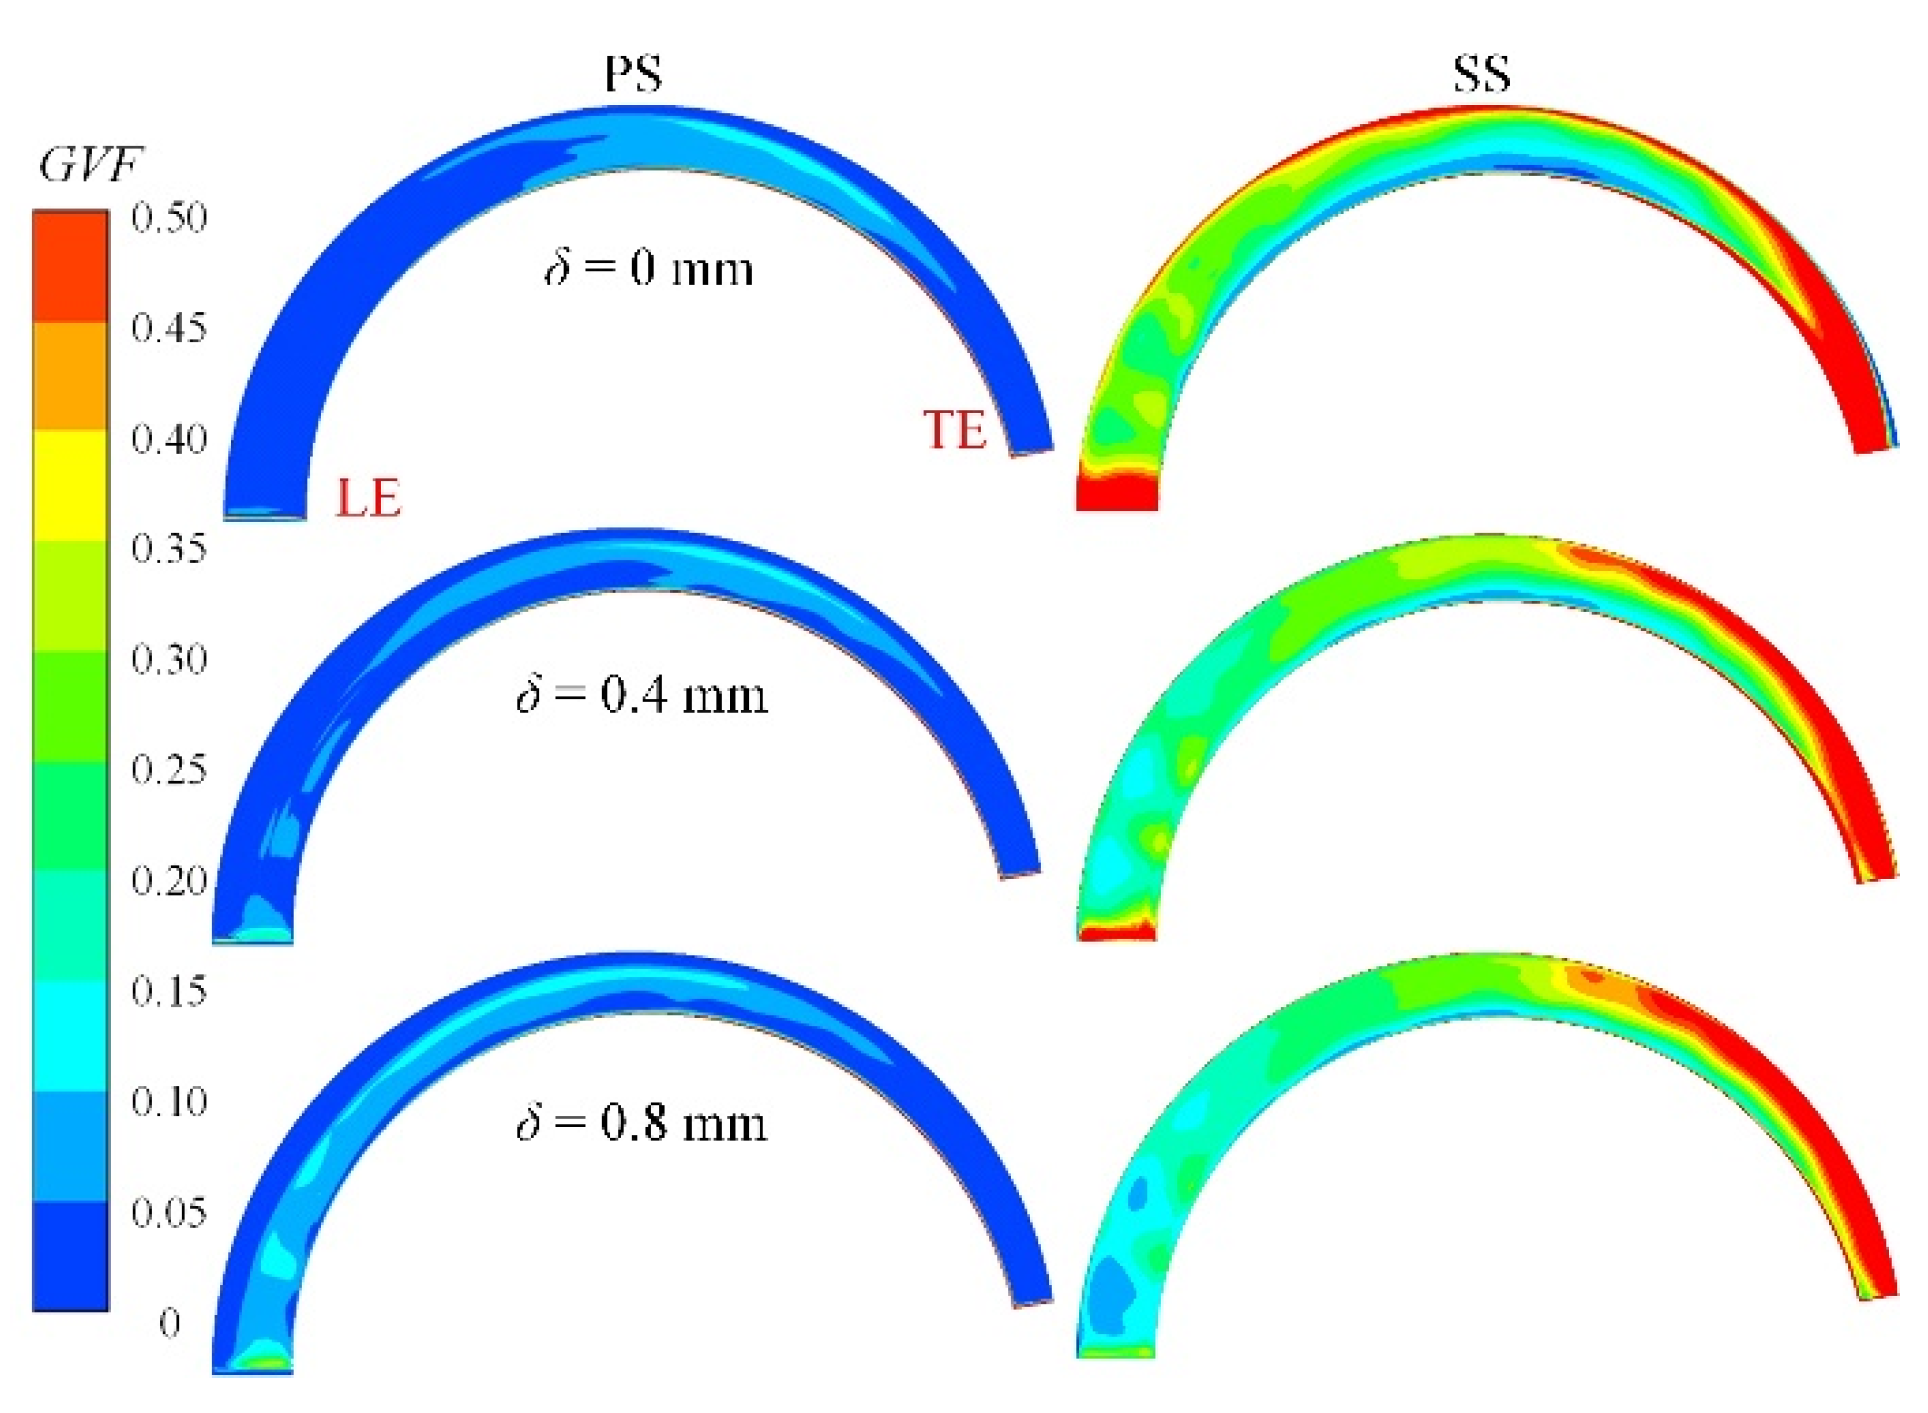
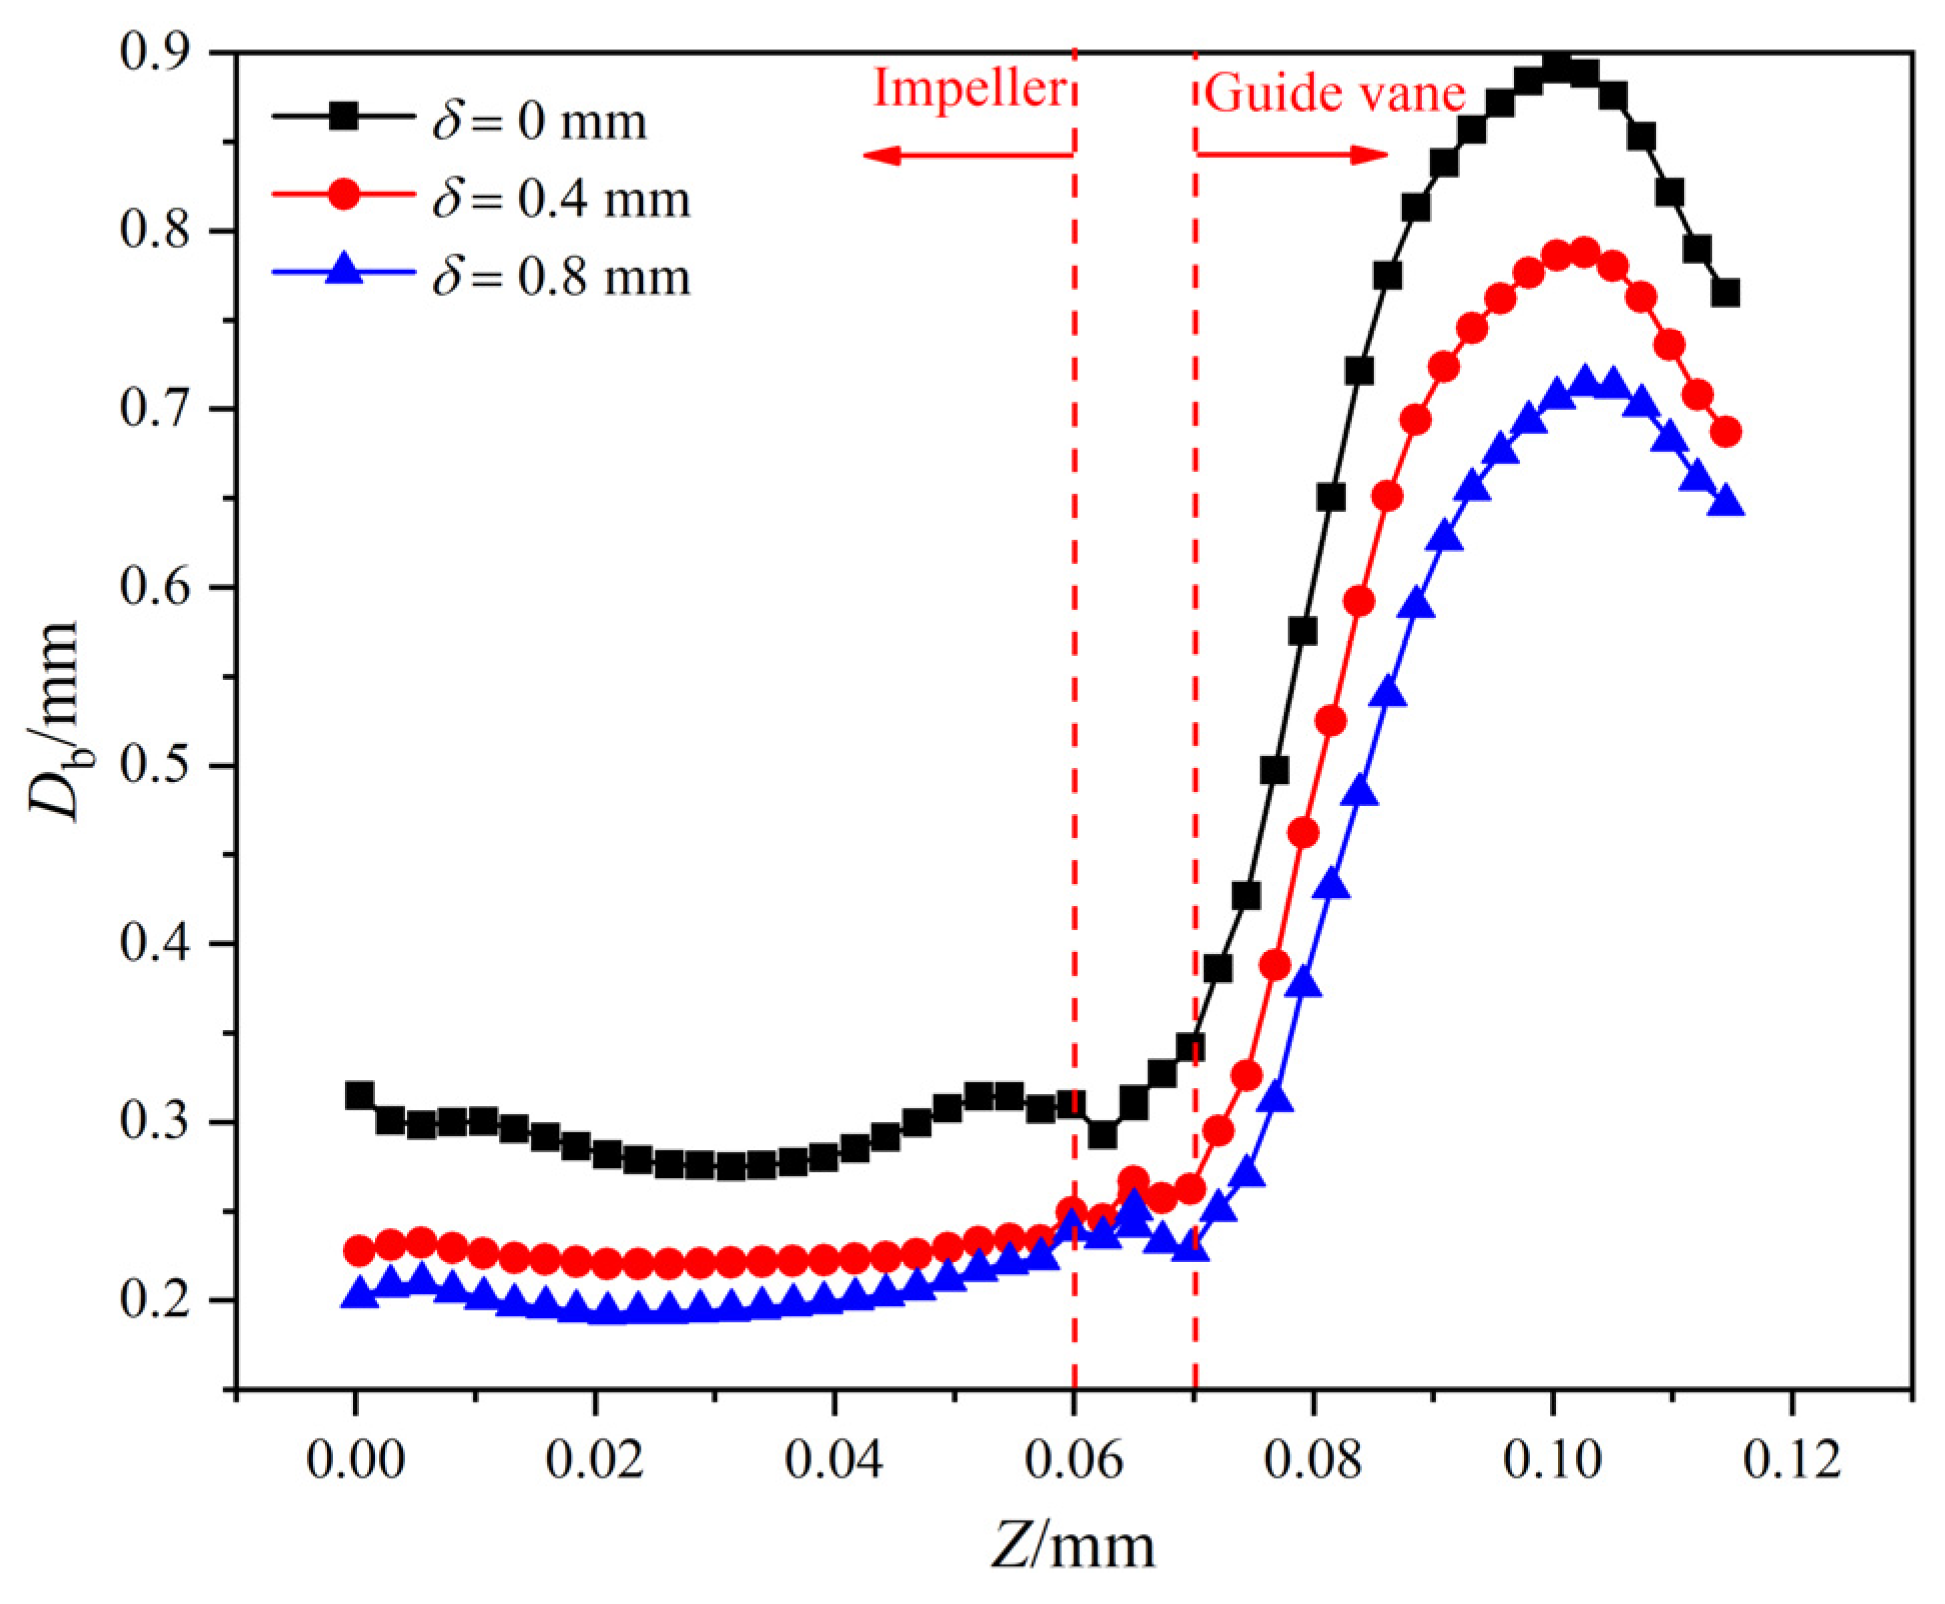
4.3. Gas Phase Distribution

Figure 10 displays the distribution of the gas volume fraction (GVF) on the meridional plane in the whole passage under various tip clearance sizes condition. In the impeller region, the gas phase mainly occurs near the hub caused by the density difference of gas and liquid phases. At larger δ, the blocking effect of the tip leakage vortex strengthens (Figure 7), and the liquid velocity near the hub increases accordingly. Therefore, the gas accumulation will be weakened with increasing δ. In the guide vane region, the effect of centrifugal force on the fluid media weakens along the streamwise direction, so the gas phase develops to the shroud. In addition, by comparing the distribution of the GVF for different tip clearance sizes, it can be found that the gas phase accumulation decreases with increasing δ, which is related to the weaker separation vortex, as shown in Figure 8.
The distribution of the GVF on the blade surface is directly related to the impeller’s ability, and the distributions of the GVF on the PS and SS for different tip clearance sizes are shown in Figure 11. Compared with the distribution on the PS, more severe gas accumulation occurs on the SS, which is related to the pressure difference between the two sides and the phase density difference. At δ = 0 mm, severe accumulation can be observed near the blade leading edge of the SS. As δ increases, the high magnitude region of GVF gradually disappears, while at the leading edge of the PS, the distribution shows the opposite trend. In the rear part of the PS, the gas phase distribution tends to be the same under different conditions. However, the gas accumulation near the hub weakens with the increase in δ in the SS rear part. This phenomenon can be explained by the strengthened blocking effect of the leakage vortex for larger δ, as shown in Figure 7, which leads to the increased liquid kinetic energy near the hub, together with the strengthened ability of the liquid to carry the gas phase.
Figure 12 shows the variation in the average Db from the impeller inlet to the guide vane outlet for different tip clearance sizes. The variation shows the same trend for different conditions. In the impeller region, overall, the Db is nearly unchanged, while it shows a trend of sharp increase followed by a gradual decrease in the guide vane region. Figure 10 reveals that as more severe gas phase accumulation occurs in the guide vane, the rate of collision between the bubbles will increase, so the Db in the impeller region is significantly larger than that of impeller. In addition, the Db tends to decrease with increasing δ, which is also related to the decreased gas accumulation (Figure 10).
Figure 13 shows the variation in pressure on the impeller blade PS and SS of the 0.5 span along the blade chord for different tip clearance sizes. According to Figure 10, with increasing δ, more severe phase accumulation occurs near the leading edge of the PS, so the pressure increment in this region decreases accordingly. However, the higher ability of the PS results in more severe flow separation in the SS leading edge together with lower pressure in this region as the δ decreases. In the rear part of the blade, the pressure tends to be uniform for different conditions in the PS, while in the SS, it decreases with increasing δ. This can also be explained by the difference in GVF distribution among those conditions, as shown in Figure 11.

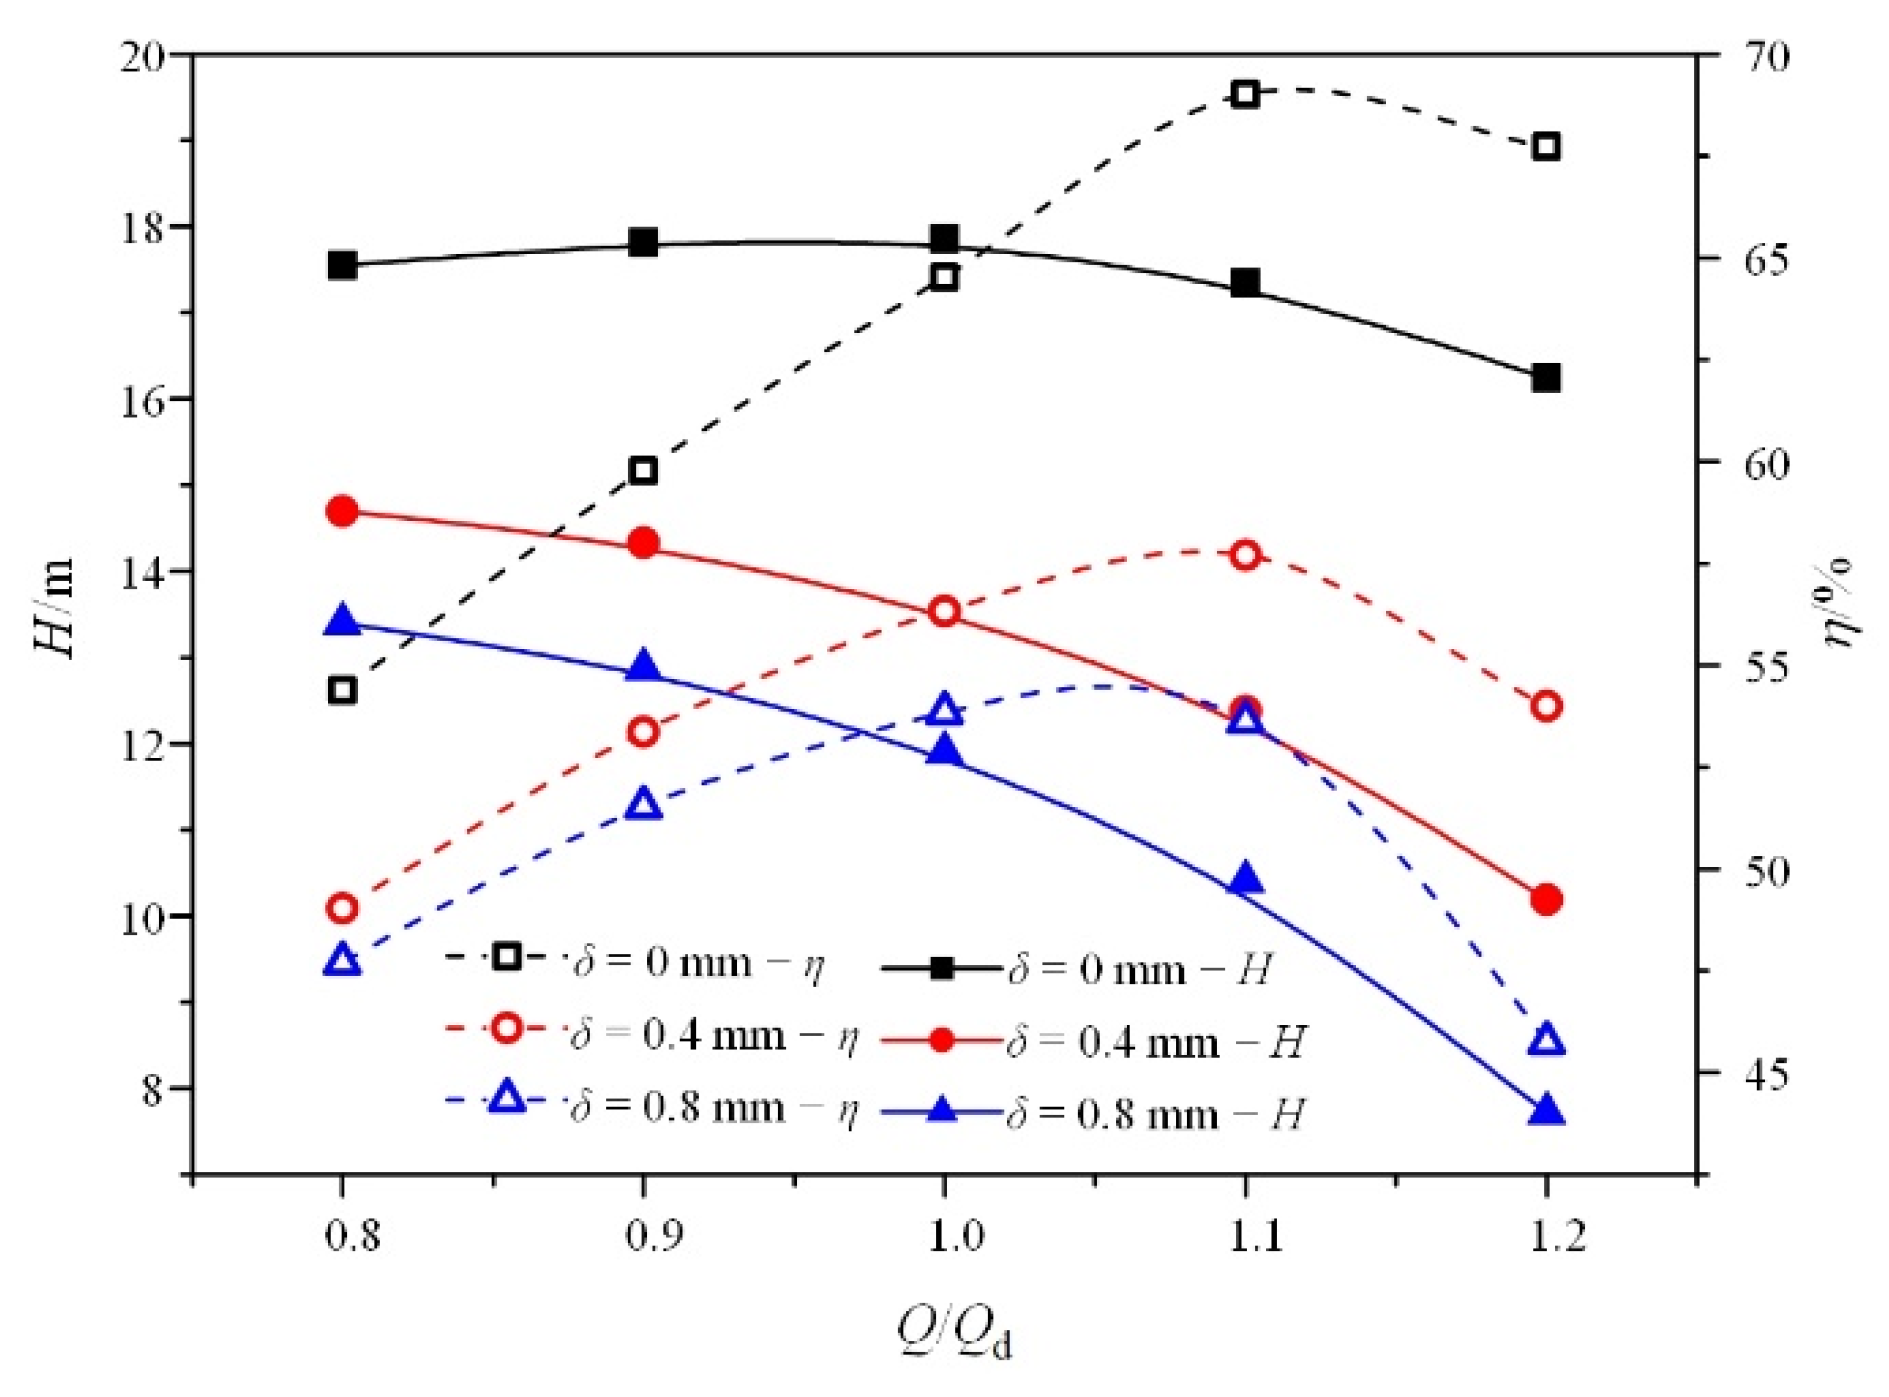
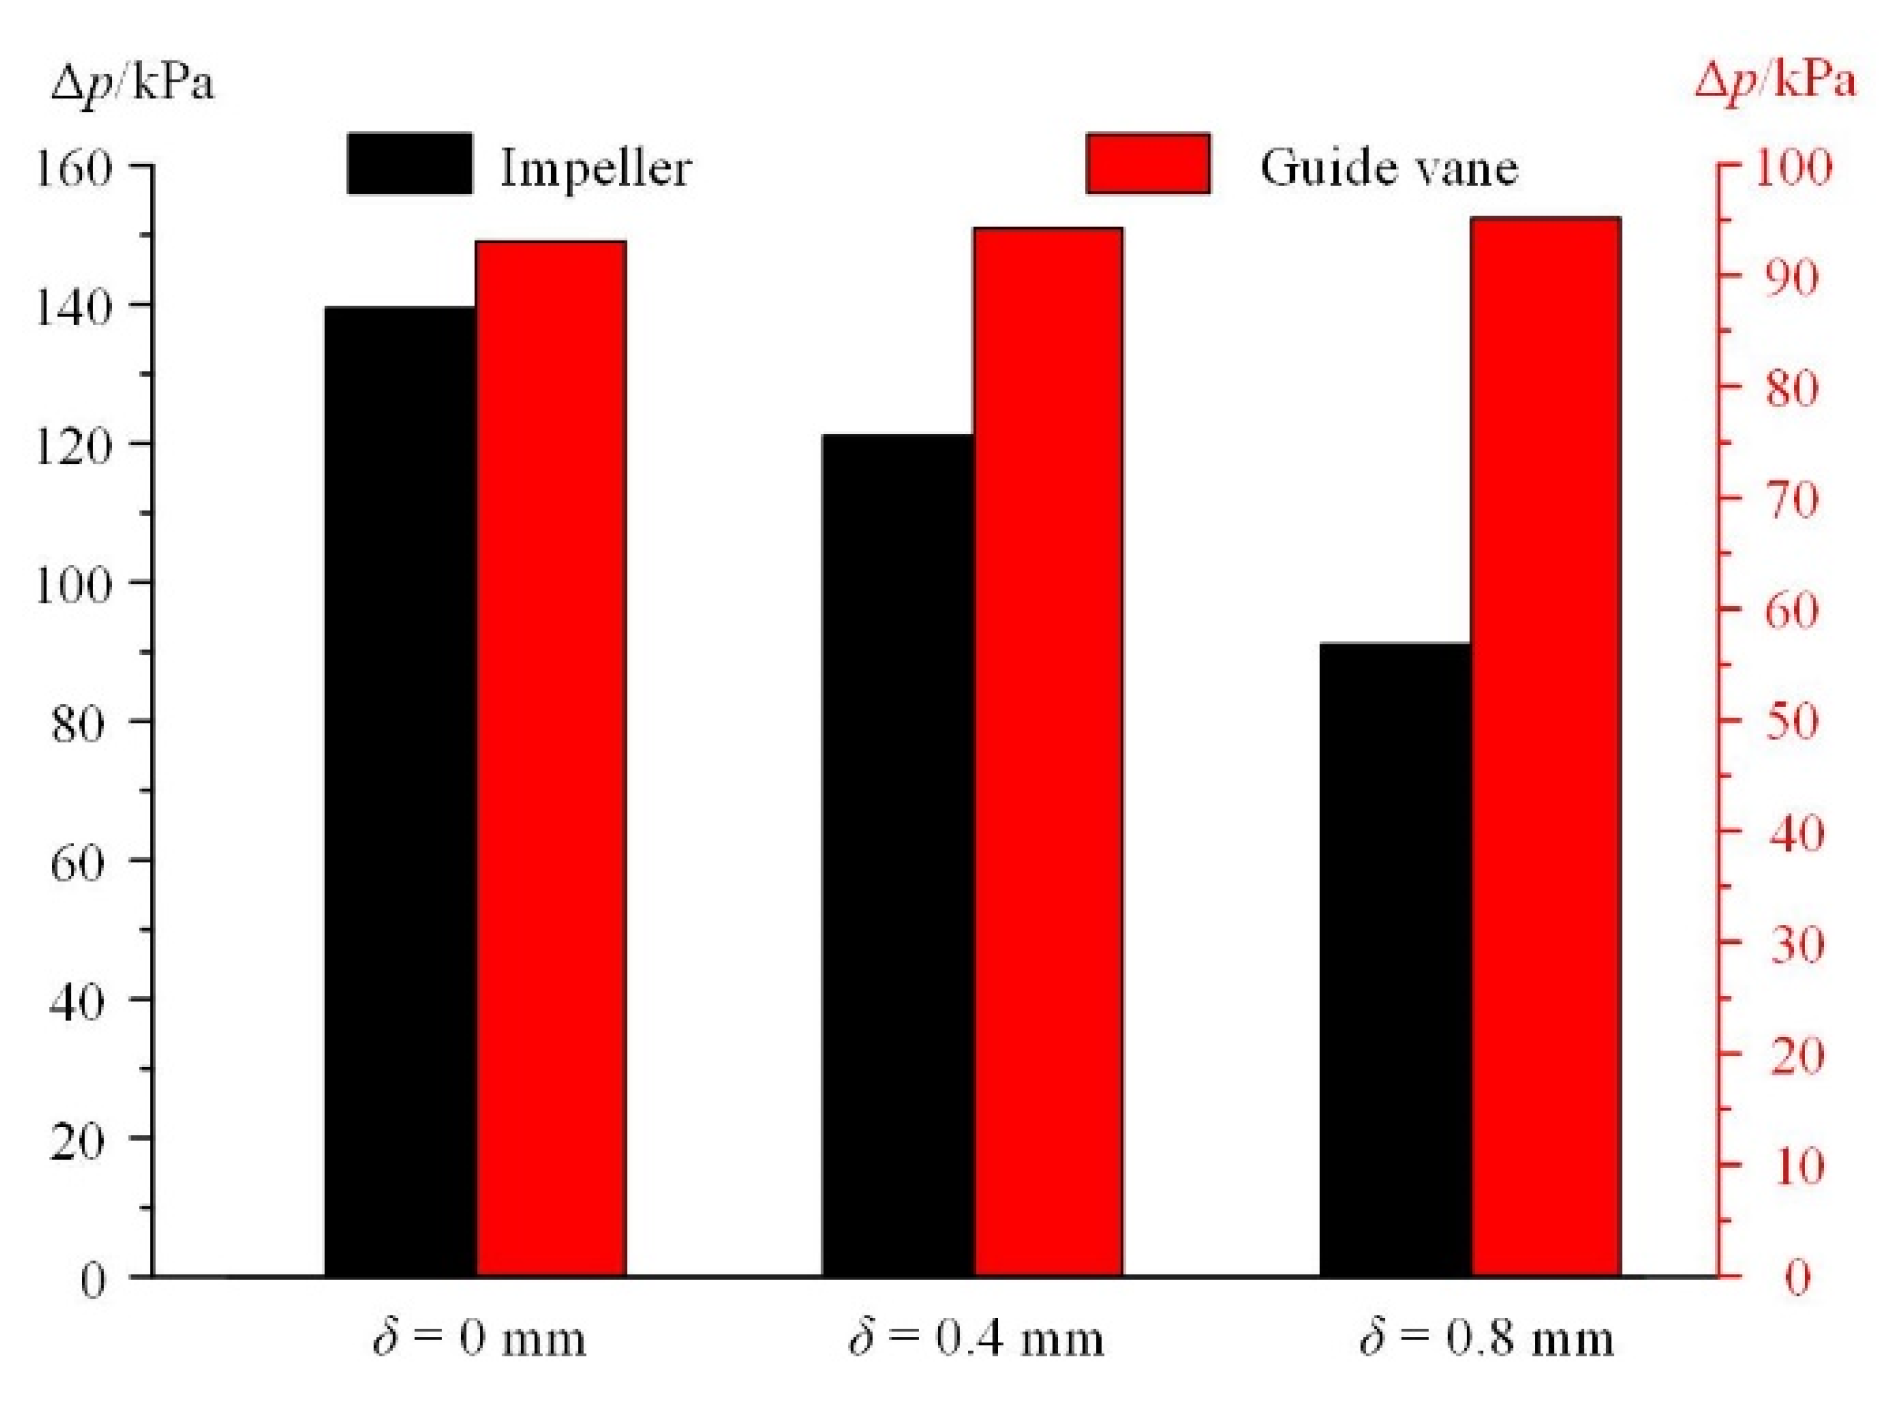
4.4. Energy Performance

Figure 14 shows the influence of δ on the pump energy performance. The energy performance shows a similar curve trend under the different conditions. An increase in δ results in a dramatic pump head and efficiency decrease, despite its relatively small size. Moreover, the influence of δ becomes more evident with the increasing flow rate. Under the 1.2 times design flow rate condition, the efficiency and head decrease by as much as 32.45% and 40.36%, respectively. In addition, the pump efficiency drops sharply when the flow rate is higher than the best efficiency point (BEF) for larger δ conditions, which indicates that a larger δ leads to the deterioration of the pump operation stability.
Figure 15 shows the pressure increments (Δp) in the impeller and the guide vane. As shown in Figure 10, a larger δ causes severe gas accumulation on the PS, which greatly restricts the impeller pressurization ability (Figure 13). Moreover, the strength of the leakage vortex and the leakage flow rate increase dramatically with increasing δ, which will lead to greater volume loss (Figure 6) and flow loss (Figure 12). Therefore, the most obvious difference in the pressure increment occurs in the impeller, and the reduction in the pressure increment reaches 34.69% as the δ increases from 0 mm to 0.8 mm. However, the pressure increment increases slightly (2.26%) in the guide vane with increasing δ, which is caused by the weaker flow separation for larger δ, as shown in Figure 8.

5. Conclusions

Based on the non-uniform bubble model, the effect of tip clearance size (δ) on the vortex structure, the distribution of the gas phase, and the energy performance in a multiphase pump are systematically investigated, and the main conclusions are as follows:
(1)
A larger δ causes a rise in the leakage flow rate and further strengthens the leakage vortex. However, due to the higher flow loss in the impeller, the separation vortex is reduced in the guide vane passage with increasing δ;
(2)
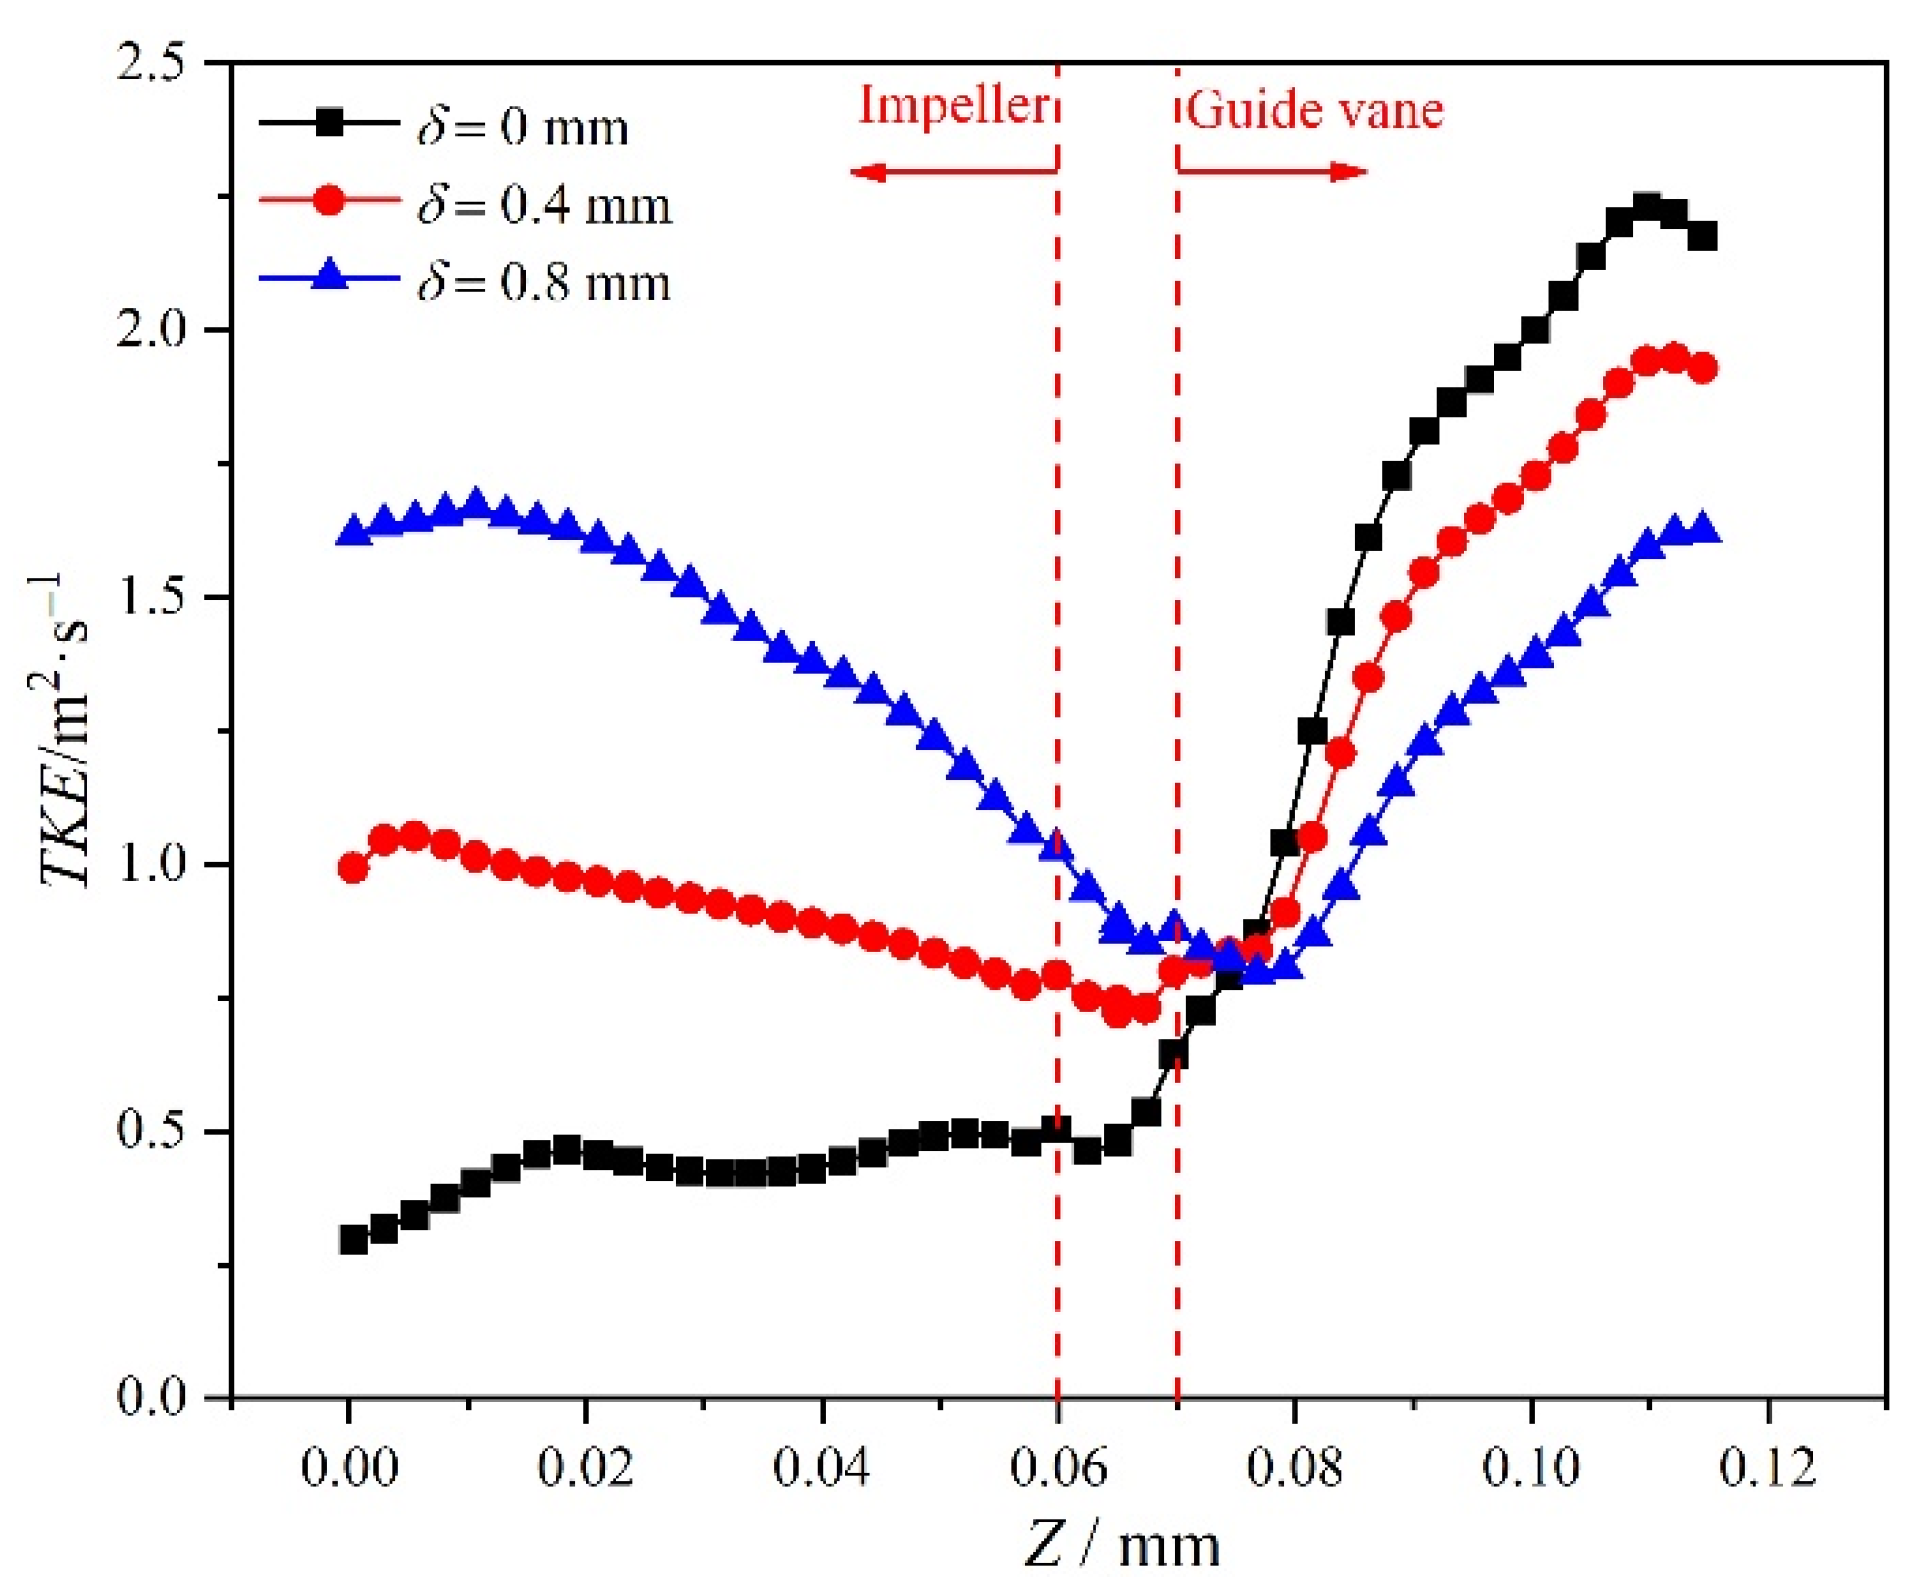
As δ increases, the disturbance of the tip leakage vortex makes the average TKE increase obviously in the impeller region. The variation in TKE shows the opposite trends with or without tip clearance, and the vortex strength weakens along the streamwise direction, which leads to a decreasing trend of TKE when the tip clearance is considered;
(3)
In the impeller inlet, a larger δ leads to more severe accumulation on the PS and decreased gas content on the SS. The blocking effect of the tip leakage vortex makes the liquid kinetic energy increase near the impeller hub; thus, gas accumulation weakens in this region;
(4)
Due to the combined effect of more severe gas accumulation and higher flow loss caused by the leakage flow, the pressure increment drops sharply in the impeller region as the δ increases. In the guide vane, however, the pressure increment is raised slightly with a larger δ because of the weaker flow separation in this condition.
In future work, we will assess the spatial-temporal evolution of tip leakage. Furthermore, based on the in-depth investigation of leakage flow, a suppressing the tip leakage flow will be proposed.

Author Contributions

Conceptualization, W.S.; methodology, W.S.; formal analysis, K.Z. and Z.L.; investigation, W.S.; resources, Z.Y.; writing—original draft preparation, W.S.; writing—review and editing, Z.Y.; supervision, K.Z. and Z.L. All authors have read and agreed to the published version of the manuscript.

Funding

This research was funded by Beijing Municipal Natural Science Foundation (3212021); the Open Research Fund Program of State Key Laboratory of Hydroscience and Engineering (sklhse-2021-E-01); the Open Research Subject of Key Laboratory of Fluid and Power Machinery (Xihua University), Ministry of Education (szjj2019-005); National Natural Science Foundation of China (52109107).

Institutional Review Board Statement

Not applicable.

Informed Consent Statement

Not applicable.

Data Availability Statement

Not applicable.

Conflicts of Interest

The authors declare no conflict of interest. The funders had no role in the design of the study, in the collection, analyses, or interpretation of data, in the writing of the manuscript, or in the decision to publish the results.

Nomenclature

Cbrbreak-up coefficient, constant
Ccocoalescence coefficient, constant
CDdrag coefficient, dimensionless
CD_modmodified drag coefficient, dimensionless
CD_SNdrag coefficient calculated by the Schiller Naumann model, dimensionless
Dbbubble diameter, m
FD,kdrag force, N/m3
FL,klift force, N/m3
FA,kadded mass force, N/m3
FT,kturbulent dispersion force
Hdesign head, m
IGVFinlet gas volume fraction, dimensionless
nrotating speed, r/min
nsspecific speed, dimensionless
ppressure, Pa
Ppower, kw
Qddesign flow rate, m3/h
ReReynolds number, dimensionless
Rebmodified Reynolds number, dimensionless
ttime, s
TKEturbulence kinetic energy, m2/s2
Uggas phase relative velocity vector, m/s
Ulliquid phase relative velocity vector, m/s
WeWeber number, dimensionless
Weccritical Weber number, dimensionless
Greek symbols
δtip clearance size, m
αggas phase volume fraction, dimensionless
ξbubble number density, m−3
εturbulence dissipation rate, m2/s3
σsurface tension coefficient, N/m
ηcocoalescence efficiency, dimensionless
ρggas phase density, kg/m3
ρlliquid phase density, kg/m3
μlliquid phase dynamic viscosity, N·s/m2

References

  1. Xiao, W.Y.; Tan, L. Design method of controllable velocity moment and optimization of pressure fluctuation suppression for a multiphase pump. Ocean Eng. 2021, 220, 108402. [Google Scholar] [CrossRef]
  2. Zhang, J.Y.; Cai, S.J.; Li, Y.J.; Zhu, H.W.; Zhang, Y.X. Optimization design of multiphase pump impeller based on combined genetic algorithm and boundary vortex flux diagnosis. J. Hydrodyn. 2017, 29, 1023–1034. [Google Scholar] [CrossRef]
  3. Liu, M.; Tan, L.; Xu, Y.; Cao, S.L. Optimization design method of multi-stage multiphase pump based on Oseen vortex. J. Petrol. Sci. Eng. 2020, 184, 106532. [Google Scholar] [CrossRef]
  4. Yang, X.; Qu, Z.; Wu, Y.Y. Frictional loss studies and experimental performance of a new synchronal rotary multiphase pump. J. Fluid. Eng. 2011, 133, 041303. [Google Scholar] [CrossRef]
  5. Kim, J.H.; Lee, H.C.; Kim, J.H.; Choi, Y.S.; Yoon, Y.H.; Yoo, S.; Choi, W.C. Improvement of hydrodynamic performance of a multiphase pump using design of experiment techniques. J. Fluid. Eng. 2015, 137, 181301. [Google Scholar] [CrossRef]
  6. Cao, S.L.; Peng, G.; Yu, Z.Y. Hydrodynamic design of rotodynamic pump impeller for multiphase pumping by combined approach of inverse design and CFD analysis. J. Fluid. Eng. 2005, 127, 330–338. [Google Scholar] [CrossRef]
  7. Zhang, J.Y.; Cai, S.J.; Zhu, H.W.; Zhang, Y.X. Experimental investigation of the flow at the entrance of a rotodynamic multiphase pump by visualization. J. Petrol. Sci. Eng. 2015, 126, 254–261. [Google Scholar] [CrossRef]
  8. Zhang, J.Y.; Cai, S.J.; Li, Y.J.; Zhu, H.W.; Zhang, Y.X. Visualization study of gas-liquid two-phase flow patterns inside a three-stage rotodynamic multiphase pump. Exp. Therm. Fluid Sci. 2016, 70, 125–138. [Google Scholar] [CrossRef]
  9. Shi, Y.; Zhu, H.W.; Zhang, J.Y.; Zhang, J.T.; Zhao, J.L. Experiment and numerical study of a new generation three-stage multiphase pump. J. Petrol. Sci. Eng. 2018, 169, 471–484. [Google Scholar] [CrossRef]
  10. Zhu, J.J.; Zhu, H.W.; Zhang, J.C.; Zhang, H.Q. A numerical study on flow patterns inside an electrical submersible pump (ESP) and comparison with visualization experiments. J. Petrol. Sci. Eng. 2019, 173, 339–350. [Google Scholar] [CrossRef]
  11. Suh, J.; Kim, J.; Choi, Y. Development of numerical Eulerian-Eulerian models for simulating multiphase pumps. J. Petrol. Sci. Eng. 2010, 22, 35–43. [Google Scholar] [CrossRef]
  12. Yu, Z.Y.; Zhu, B.S.; Cao, S.L.; Liu, Y. Effect of virtual mass force on the mixed transport process in a multiphase rotodynamic pump. Adv. Mech. Eng. 2014, 6, 958352. [Google Scholar] [CrossRef] [Green Version]
  13. Zhang, W.W.; Xie, X.; Zhu, B.S.; Ma, Z. Analysis of phase interaction and gas holdup in a multistage multiphase rotodynamic pump based on a modified Euler two-fluid model. Renew. Energ. 2021, 164, 1496–1507. [Google Scholar] [CrossRef]
  14. Yu, Z.Y.; Zhu, B.S.; Cao, S.L. Interphase force analysis for air-water bubbly flow in a multiphase rotodynamic pump. Eng. Computation. 2015, 32, 2166–2180. [Google Scholar] [CrossRef] [Green Version]
  15. Pourtousi, M.; Sahu, J.; Ganesan, P. Effect of interfacial forces and turbulence models on predicting flow pattern inside the bubble column. Chem. Eng. Process. 2014, 75, 38–47. [Google Scholar] [CrossRef]
  16. Zhang, W.W.; Yu, Z.Y.; Li, Y.J. Application of a non-uniform bubble model in a multiphase rotodynamic pump. J. Petrol. Sci. Eng. 2018, 173, 1316–1322. [Google Scholar] [CrossRef]
  17. Li, Y.J.; Yu, Z.Y. Distribution and motion characteristics of bubbles in a multiphase rotodynamic pump based on modified non-uniform bubble model. J. Petrol. Sci. Eng. 2020, 195, 107569. [Google Scholar] [CrossRef]
  18. Li, Y.J.; Yu, Z.Y.; Sun, W.H. Drag coefficient modification for turbulent gas-liquid two-phase flow in a rotodynamic pump. Chem. Eng. J. 2021, 417, 128570. [Google Scholar] [CrossRef]
  19. Zhang, H.; Shi, W.D.; Chen, B.; Zhang, Q.H.; Cao, W.D. Experimental study of flow field in interference area between impeller and guide vane of axial flow pump. J. Hydrodyn. 2014, 26, 894–901. [Google Scholar] [CrossRef]
  20. Liu, Y.B.; Tan, L. Tip clearance on pressure fluctuation intensity and vortex characteristic of a mixed flow pump as turbine at pump mode. Renew. Energ. 2018, 129, 606–615. [Google Scholar] [CrossRef]
  21. Hayat, T.; Yasmin, H.; Ahmad, B.; Chen, G.Q. Exact solution for peristaltic transport of a micropolar fluid in a channel with convective boundary conditions and heat source/sink. Z. Für Nat. A 2014, 69, 425–432. [Google Scholar] [CrossRef]
  22. Yasmin, H.; Iqbal, N. Convective mass/heat analysis of an electroosmotic peristaltic flow of ionic liquid in a symmetric porous microchannel with soret and dufour. Math. Probl. Eng. 2021, 2021, 2638647. [Google Scholar] [CrossRef]
  23. Iqbal, N.; Yasmin, H.; Bibi, A.; Attiya, A.A. Peristaltic motion of Maxwell fluid subject to convective heat and mass conditions. Ain. Shams. Eng. J. 2021, 12, 3021–3031. [Google Scholar] [CrossRef]
  24. Xu, Y.; Tan, L.; Liu, Y.B.; Cao, S.L. Pressure fluctuation and flow pattern of a mixed-flow pump with different blade tip clearances under cavitation condition. Adv. Mech. Eng. 2017, 9, 2071938710. [Google Scholar] [CrossRef]
  25. Hao, Y.; Tan, L. Symmetrical and unsymmetrical tip clearances on cavitation performance and radial force of a mixed flow pump as turbine at pump mode. Renew. Energ. 2018, 127, 368–376. [Google Scholar] [CrossRef]
  26. Huang, Z.W.; Huang, Z.; Fan, H.G. Influence of C groove on energy performance and noise source of a NACA0009 hydrofoil with tip clearance. Renew. Energ. 2020, 159, 726–735. [Google Scholar] [CrossRef]
  27. Zhang, D.S.; Shi, L.; Shi, W.D.; Zhao, R.J.; Wang, H.Y.; van Esch, B.P.M. Numerical analysis of unsteady tip leakage vortex cavitation cloud and unstable suction-side-perpendicular cavitating vortices in an axial flow pump. Int. J. Multiphas. Flow 2015, 77, 244–259. [Google Scholar] [CrossRef]
  28. Zhang, J.S.; Fan, H.G.; Zhang, W.; Xie, Z.F. Energy performance and flow characteristics of a multiphase pump with different tip clearance sizes. Adv. Mech. Eng. 2019, 11, 1–14. [Google Scholar] [CrossRef]
  29. Liu, Y.B.; Tan, L.; Hao, Y.; Xu, Y. Energy performance and flow patterns of a mixed flow pump with different tip clearance sizes. Energies 2017, 10, 191. [Google Scholar] [CrossRef]
  30. Han, C.Z.; Xu, S.; Cheng, H.Y.; Ji, B.; Zhang, Z.Y. LES method of the tip clearance vortex cavitation in a propelling pump with special emphasis on the cavitation-vortex interaction. J. Hydrodyn. 2020, 32, 736–746. [Google Scholar] [CrossRef]
  31. Wang, L.K.; Lu, J.L.; Liao, W.L.; Guo, P.C.; Feng, J.J.; Luo, X.Q.; Wang, W. Numerical investigation of the effect of T-shaped blade on the energy performance improvement of a semi-open centrifugal pump. J. Hydrodyn. 2021, 11, 2072152310. [Google Scholar] [CrossRef]
  32. Liu, Y.B.; Tan, L. Method of T shape tip on energy improvement of a hydrofoil with tip clearance in tidal energy. Renew. Energ. 2020, 149, 42–54. [Google Scholar] [CrossRef]
  33. Liu, Y.B.; Tan, L. Method of C groove on vortex suppression and energy performance improvement for a NACA0009 hydrofoil with tip clearance in tidal energy. Energy 2018, 155, 448–461. [Google Scholar] [CrossRef]
  34. Tan, L.; Xie, Z.; Liu, Y.B.; Hao, Y.; Xun, Y. Influence of T-shape tip clearance on performance of a mixed-flow pump. P. I. Mech. Eng. A-J. Pow. 2018, 232, 386–396. [Google Scholar]
  35. Lane, G.; Schwarz, M.; Evans, G. Numerical modelling of gas-liquid flow in stirred tanks. Chem. Eng. Sci. 2005, 60, 2203–2214. [Google Scholar] [CrossRef]
  36. Tabib, M.; Schwarz, P. Quantifying sub-grid scale (SGS) turbulent dispersion force and its effect using one-equation SGS large eddy simulation (LES) model in a gas-liquid and a liquid-liquid system. Chem. Eng. Sci. 2011, 66, 3071–3086. [Google Scholar] [CrossRef]
  37. Sun, W.H.; Tan, L. Cavitation-vortex-pressure fluctuation interaction in a centrifugal pump using bubble rotation modified cavitation model under partial load. J. Fluid. Eng. 2020, 142, 051206. [Google Scholar] [CrossRef]
Figure 1. Tested multiphase pump.
Fluids 07 00058 g001
Figure 2. Mesh agreement: (a) whole domain; (b) around the tip clearance.
Fluids 07 00058 g002
Figure 3. Test bench for the multiphase pump: (a) Multiphase rotodynamic pump; (b) High-speed camera; (c) Pressure transducer; (d) Electromagnetic flowmeter; (e) Turbine flowmeter; (f) Buffer tank.
Fluids 07 00058 g003
Figure 4. Comparison between experimental measurement and numerical simulation.
Fluids 07 00058 g004
Figure 5. Schematic diagram of the monitoring surface.
Fluids 07 00058 g005
Figure 6. Influence of tip clearance size on the leakage flow rate and energy performance.
Fluids 07 00058 g006
Figure 7. Distribution of the Z component of vorticity on the circumferential sections in the impeller.
Fluids 07 00058 g007
Figure 8. Distributions of the Z component of vorticity on the meridional plane in the guide vane.
Fluids 07 00058 g008
Figure 9. Average turbulence kinetic energy from the impeller inlet to the guide vane outlet.
Fluids 07 00058 g009
Figure 10. Distribution of gas volume fraction on the meridional plane.
Fluids 07 00058 g010
Figure 11. Distributions of gas volume fraction on PS and SS.
Fluids 07 00058 g011
Figure 12. Variation in average bubble diameter.
Fluids 07 00058 g012
Figure 13. Variation in pressure on the impeller blade surface of the 0.5 span.
Fluids 07 00058 g013
Figure 14. Energy performance of different tip clearance sizes.
Fluids 07 00058 g014
Figure 15. The pressure increment in the impeller and the guide vane.
Fluids 07 00058 g015
Table 1. Parameters of the multiphase pump.
Multiphase PumpItemsValuesUnits
ImpellerNumber of impeller blade4-
Shroud diameter of impeller inlet150mm
Shroud diameter of impeller outlet150mm
Hub diameter of impeller inlet120mm
Hub diameter of impeller outlet134mm
Guide vaneNumber of guide vane blade11-
Shroud diameter of guide vane outlet150mm
Hub diameter of guide vane outlet120mm
Design operating pointRotating speed n2950r/min
Specific speed ns166-
Design head H15m
Design flow rate Qd50m3/h
Power P7.35KW
Table 2. Independence test of the mesh number.
ItemMesh1Mesh2Mesh3Mesh4
Pipe54,51654,51654,51654,516
Impeller660,3841,226,6402,364,6673,237,444
Guide vane386,848619,0801,164,2401,424,192
Total1,101,7481,900,2363,583,4234,716,152
Δpp11.00000.98310.97830.9775
Publisher’s Note: MDPI stays neutral with regard to jurisdictional claims in published maps and institutional affiliations.

