3.1. Density and Excess Molar Volume
The density of pure MDEA, DEEA, DMEA, and MEA are available in the literature. The measured densities of pure amines over a temperature range from 293.15 K to 343.15 K are listed in
Table 2 with the relevant literature data and references. The measured density in this work is in good agreement with values reported in literature, which indicates the density meter was properly calibrated during the experiments.
The measured densities of MDEA + MEA + H
2O, DMEA + MEA + H
2O, and DEEA + MEA + H
2O mixtures over different amine concentrations (mass% of amine) and temperatures from 293.15 K to 343.15 K are listed in
Table 3,
Table 4 and
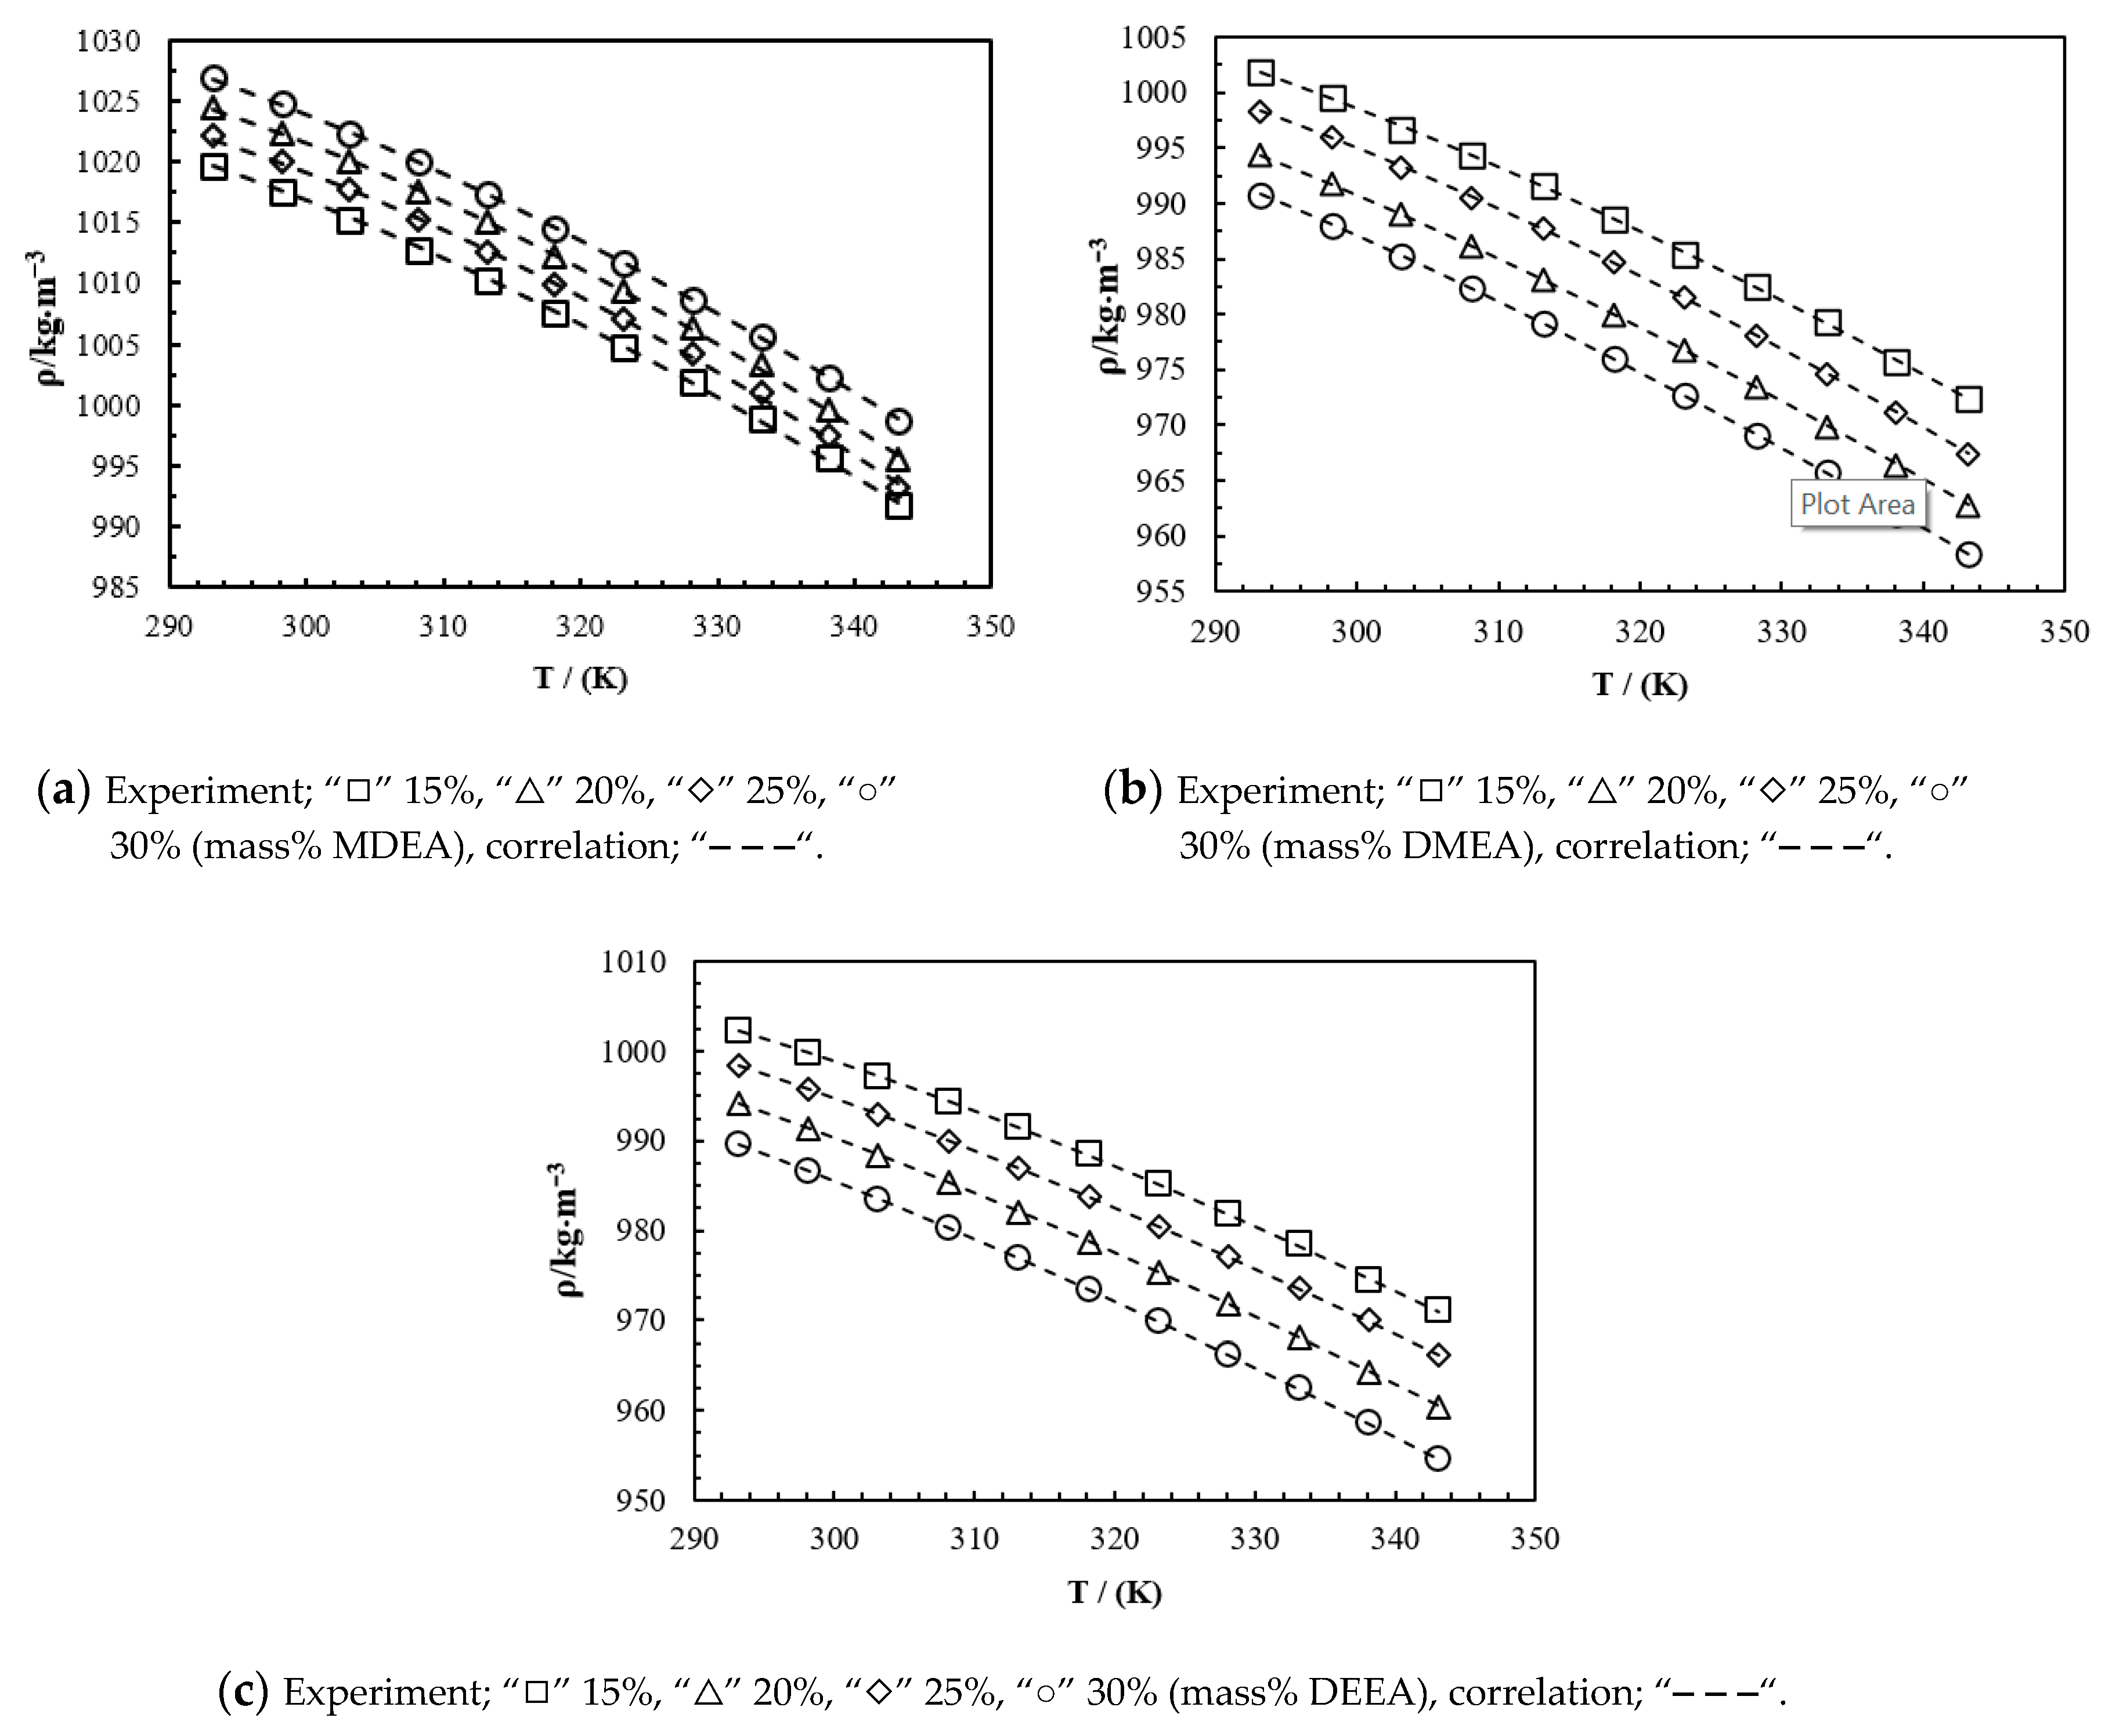
Table 5, respectively. For the density of MDEA + MEA + H
2O mixtures, the density increased with the increase of the MDEA concentration in the mixture. Moreover, for the DMEA + MEA + H
2O and DEEA + MEA + H
2O mixtures, the density increased with the decrease of the DMEA and DEEA concentration in the mixtures.
The excess molar volume
of the mixtures were determined using the molar volume of the mixture and pure components as follows:
where
,
, and
refer to the molar volume of the mixture, molar volume of the pure component, excess molar volume of the mixture, and mole fraction, respectively. Here,
= 3 to represent the ternary mixture and subscripts are as follows:
= 1 for the tertiary amine,
= 2 for the primary amine (MEA), and
= 3 for H
2O.
The calculated
from Equation (1) for MDEA + MEA + H
2O, DMEA + MEA + H
2O, and DEEA + MEA + H
2O mixtures are given in
Table 3,
Table 4 and
Table 5, respectively. The following correlation was adopted to correlate the density data at different amine concentrations and temperatures. Redlich–Kister [
35] polynomials are one of the most common approaches toward correlating the excess properties of binary mixtures because polynomial expressions are simple and easy to understand. Here, it was assumed that excess molar volume of a ternary mixture as a sum of excess molar volumes from different binary pairs, as given in Equation (3). The binary mixture polynomial shown in Equation (4) was extended by adding ternary coefficients for the ternary mixture with a temperature dependency, as described in Equation (5). Finally, the density was determined as follows:
where
,
,
,
, and
are the density of the mixture, density of the pure amine, excess molar volume of the mixture, mole fraction, and molecular weight of the pure component, respectively. The subscripts are as follows:
= 1 for tertiary amine,
= 2 for primary amine (MEA), and
= 3 for H
2O.
where
are pair parameters and are assumed to be temperature dependent.
Other correlations have been suggested for the excess molar volume of ternary mixtures were reported by Domínguez et al. [
36] and Samanta and Bandyopadhyay [
37]. References [
38,
39,
40] suggested correlations for CO
2-loaded solutions, but in this work, emphasis is on non-loaded aqueous amine mixtures.
The accuracy of the proposed correlation for the fitting of measured densities was examined through the average absolute relative deviation (AARD (%)) and the absolute maximum deviation (AMD) as defined in Equations (6) and (7), respectively.
Average absolute relative deviation:
and the absolute maximum deviation:
where
,
, and
indicate the number of data points, the measured property, and the calculated property, respectively.
Figure 1 shows a comparison between the measured versus correlated density data for aqueous amine mixtures. The study reveals that the proposed correlation fits the density data with an acceptable accuracy. The calculated parameters for the excess volume
correlation are given in
Table 6,
Table 7 and
Table 8. The reported
AARD and
AMD for the density correlation of MDEA + MEA + H
2O, DMEA + MEA + H
2O, and DEEA + MEA + H
2O are listed in
Table 9. The regression performed with a linear temperature dependency in Equation (5) revealed a 13% increase of
AARD for MDEA + MEA + H
2O mixtures, as given in
Table 9. This indicated that the proposed correlation gave a better fit for the density data.
The
Supplementary Materials provide the information of the used MATLAB program for the calculation of parameters involve in density correlation.
The excess molar volume
of the ternary mixtures showed a negative sign for the considered amine concentrations and temperatures. The negative sign of
can be explained by the intermolecular packing effect and strong intermolecular interactions, such as H-bonding between unlike molecules. The relatively small structures of MEA and H
2O compared to MDEA, DMEA, and DEEA could help to pack molecules efficiently, which resulted in the decrease of the mixture volume. In addition, the formation of H-bonds among the tertiary amines, MEA, and H
2O could also lead the volume of tertiary mixtures to show a negative deviation of
. The highest negative values were reported in the mixtures with a 0 mass% MEA concentration. The
increased with the increasing of MEA concentration in the mixtures. Further,
increased with the increase of temperature. At high temperatures, the increase of the energy of molecular motion weakens the interaction strength of H-bonds and inhibits the packing effect by leading to an increase of volume [
41,
42].
3.2. Viscosity and Excess Free Energy of Activation for Viscous Flow
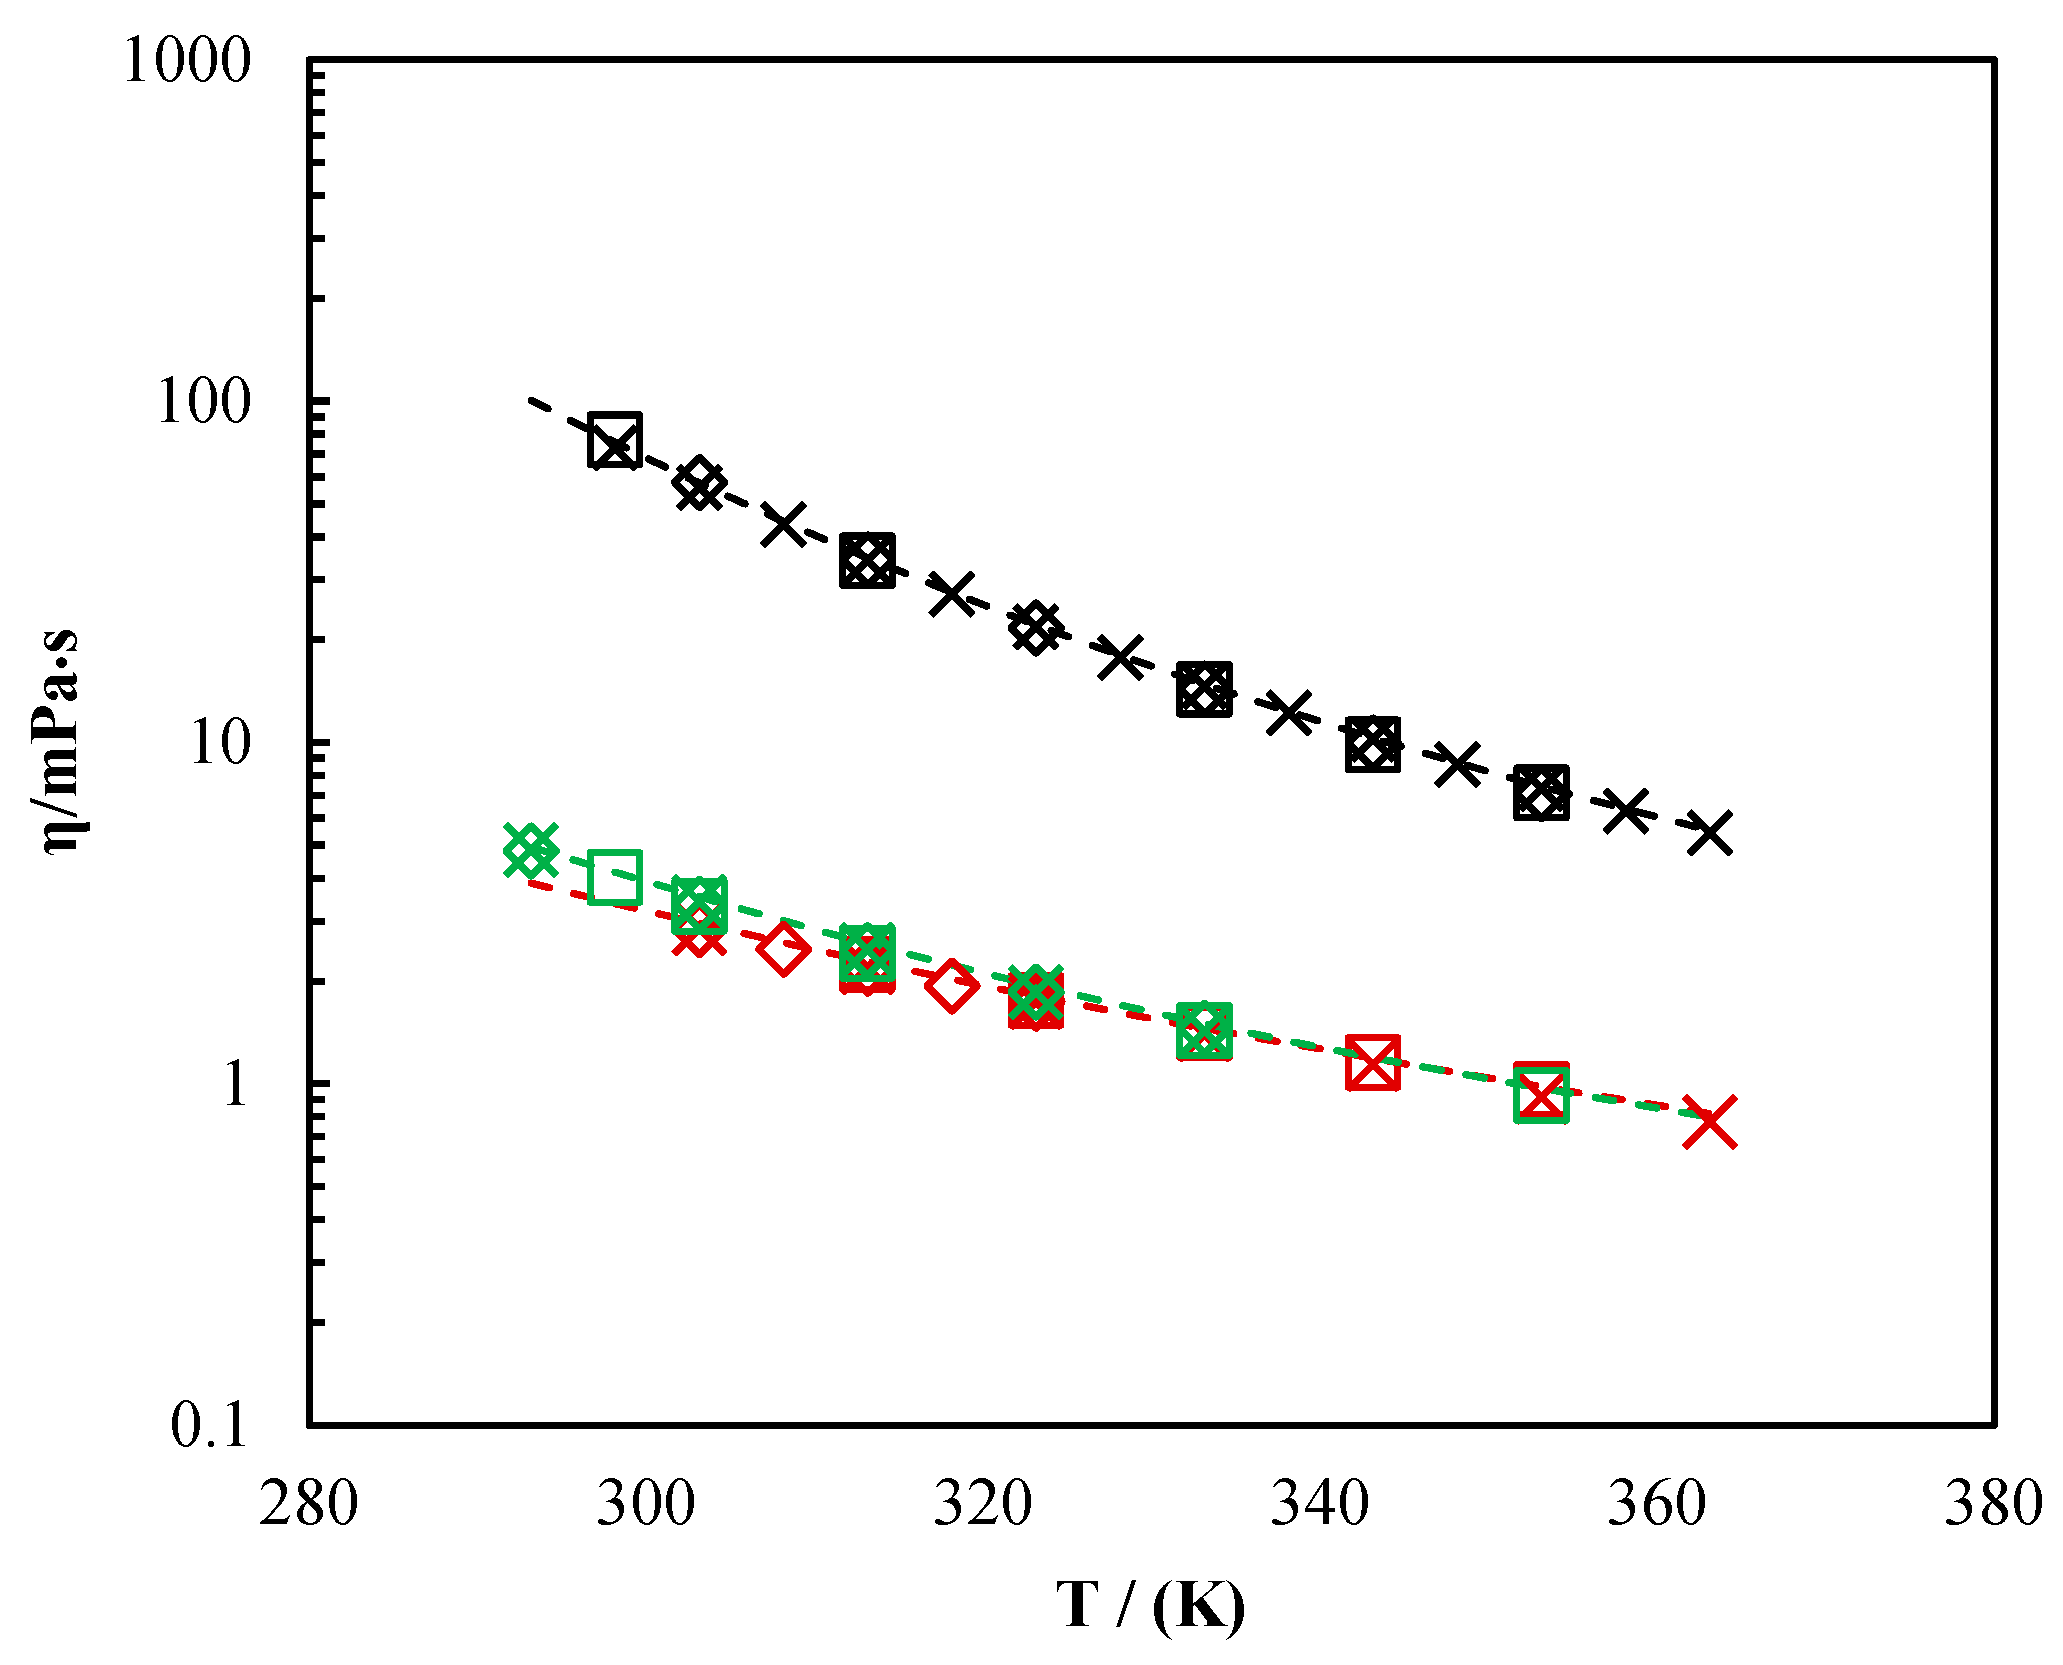
Table 10 provides an overview of the measured viscosities of pure MDEA, DMEA, and DEEA from this study and literature at different temperatures from 293.15 K to 363.15 K. As shown in
Figure 2, the measured viscosities in this work were in good agreement with data in the literature. It indicated that the measuring system was properly calibrated during the viscosity measurements. The measured viscosities for MDEA + MEA + H
2O, DMEA + MEA + H
2O, and DEEA + MEA + H
2O mixtures are listed in
Table 11,
Table 12 and
Table 13, respectively, with the relevant concentrations and temperatures. For the mixtures, the viscosity increased with the increase of the tertiary amine concentration and the viscosity decreased with the increase of temperature.
The viscosity deviation of the mixtures was calculated as follows:
where
,
,
, and
refer to the viscosity of the mixture, viscosity of the pure component, viscosity deviation of the mixture, and mole fraction, respectively. Here,
= 3 represents the ternary mixture and the subscripts are as follows:
= 1 for the tertiary amine,
= 2 for the primary amine (MEA), and
= 3 for H
2O.
The viscosity deviation
is a property that provides a qualitative measure of intermolecular interactions between component molecules in a liquid mixture. A negative deviation (
< 0) indicates weak intermolecular interactions, while a positive deviation points out strong intermolecular interactions like H-bonding among unlike molecules in the mixture [
42,
49]. This method is widely used to analyze binary mixtures and the same analogy is adopted to study ternary mixtures [
42]. The MDEA + MEA + H
2O mixtures showed a negative deviation for
at temperatures <343.15 K, and
gradually increased with increasing temperature. As described by Domínguez et al. [
50], the
can become negative when intermolecular interactions between the molecules are stronger for the pure compounds than for their mixtures. The gradual increase of
with increasing temperature implies that the strength of the interactions between the component molecules in mixtures decreases, which may be attributed to the breaking of the cohesive force in like molecules [
51]. The mixtures of DMEA + MEA + H
2O and DEEA + MEA + H
2O showed a positive deviation for
for the considered concentrations and temperatures. This revealed the association of strong intermolecular interactions of H-bonds in the mixtures. The increase of temperature resulted in a decrease of
owing to weakening of intermolecular interaction between unlike molecules.
Eyring [
52] explained that in a liquid at rest, the molecules are constantly undergoing rearrangements. This was elaborated by Bird et al. [
53] in terms of one molecule at a time escaping from its cage into an adjacent hole. A cage is an available space for a molecule to vibrate due to the surrounding closely packed neighboring molecules. An energy barrier of height
represents the cage in which
and
are the free energy of activation for viscous flow and Avogadro’s number, respectively.
The dynamic viscosity model for liquids found by Eyring [
52] is given as follows:
where
,
,
,
,
,
, and
refer to the viscosity, molar volume, Planck’s constant, Avogadro’s number, gas constant, temperature, and free energy of activation for viscous flow, respectively.
Equations (10) and (11) enable the determination of the excess free energy of activation for viscous flow
in terms of the viscosity and molar volume of the pure components:
where
,
,
,
,
,
,
, and
refer to the viscosity of the mixture, viscosity of pure component, molar volume of the mixture, molar volume of the pure component, mole fraction, gas constant, temperature, and excess free energy of activation for viscous flow, respectively. The subscripts are as follows:
= 1 for the tertiary amine,
= 2 for the primary amine (MEA), and
= 3 for H
2O.
A Redlich–Kister-type [
35] polynomial, as given by Equations (12)–(14), was proposed to fit the calculated
for the considered amine mixtures:
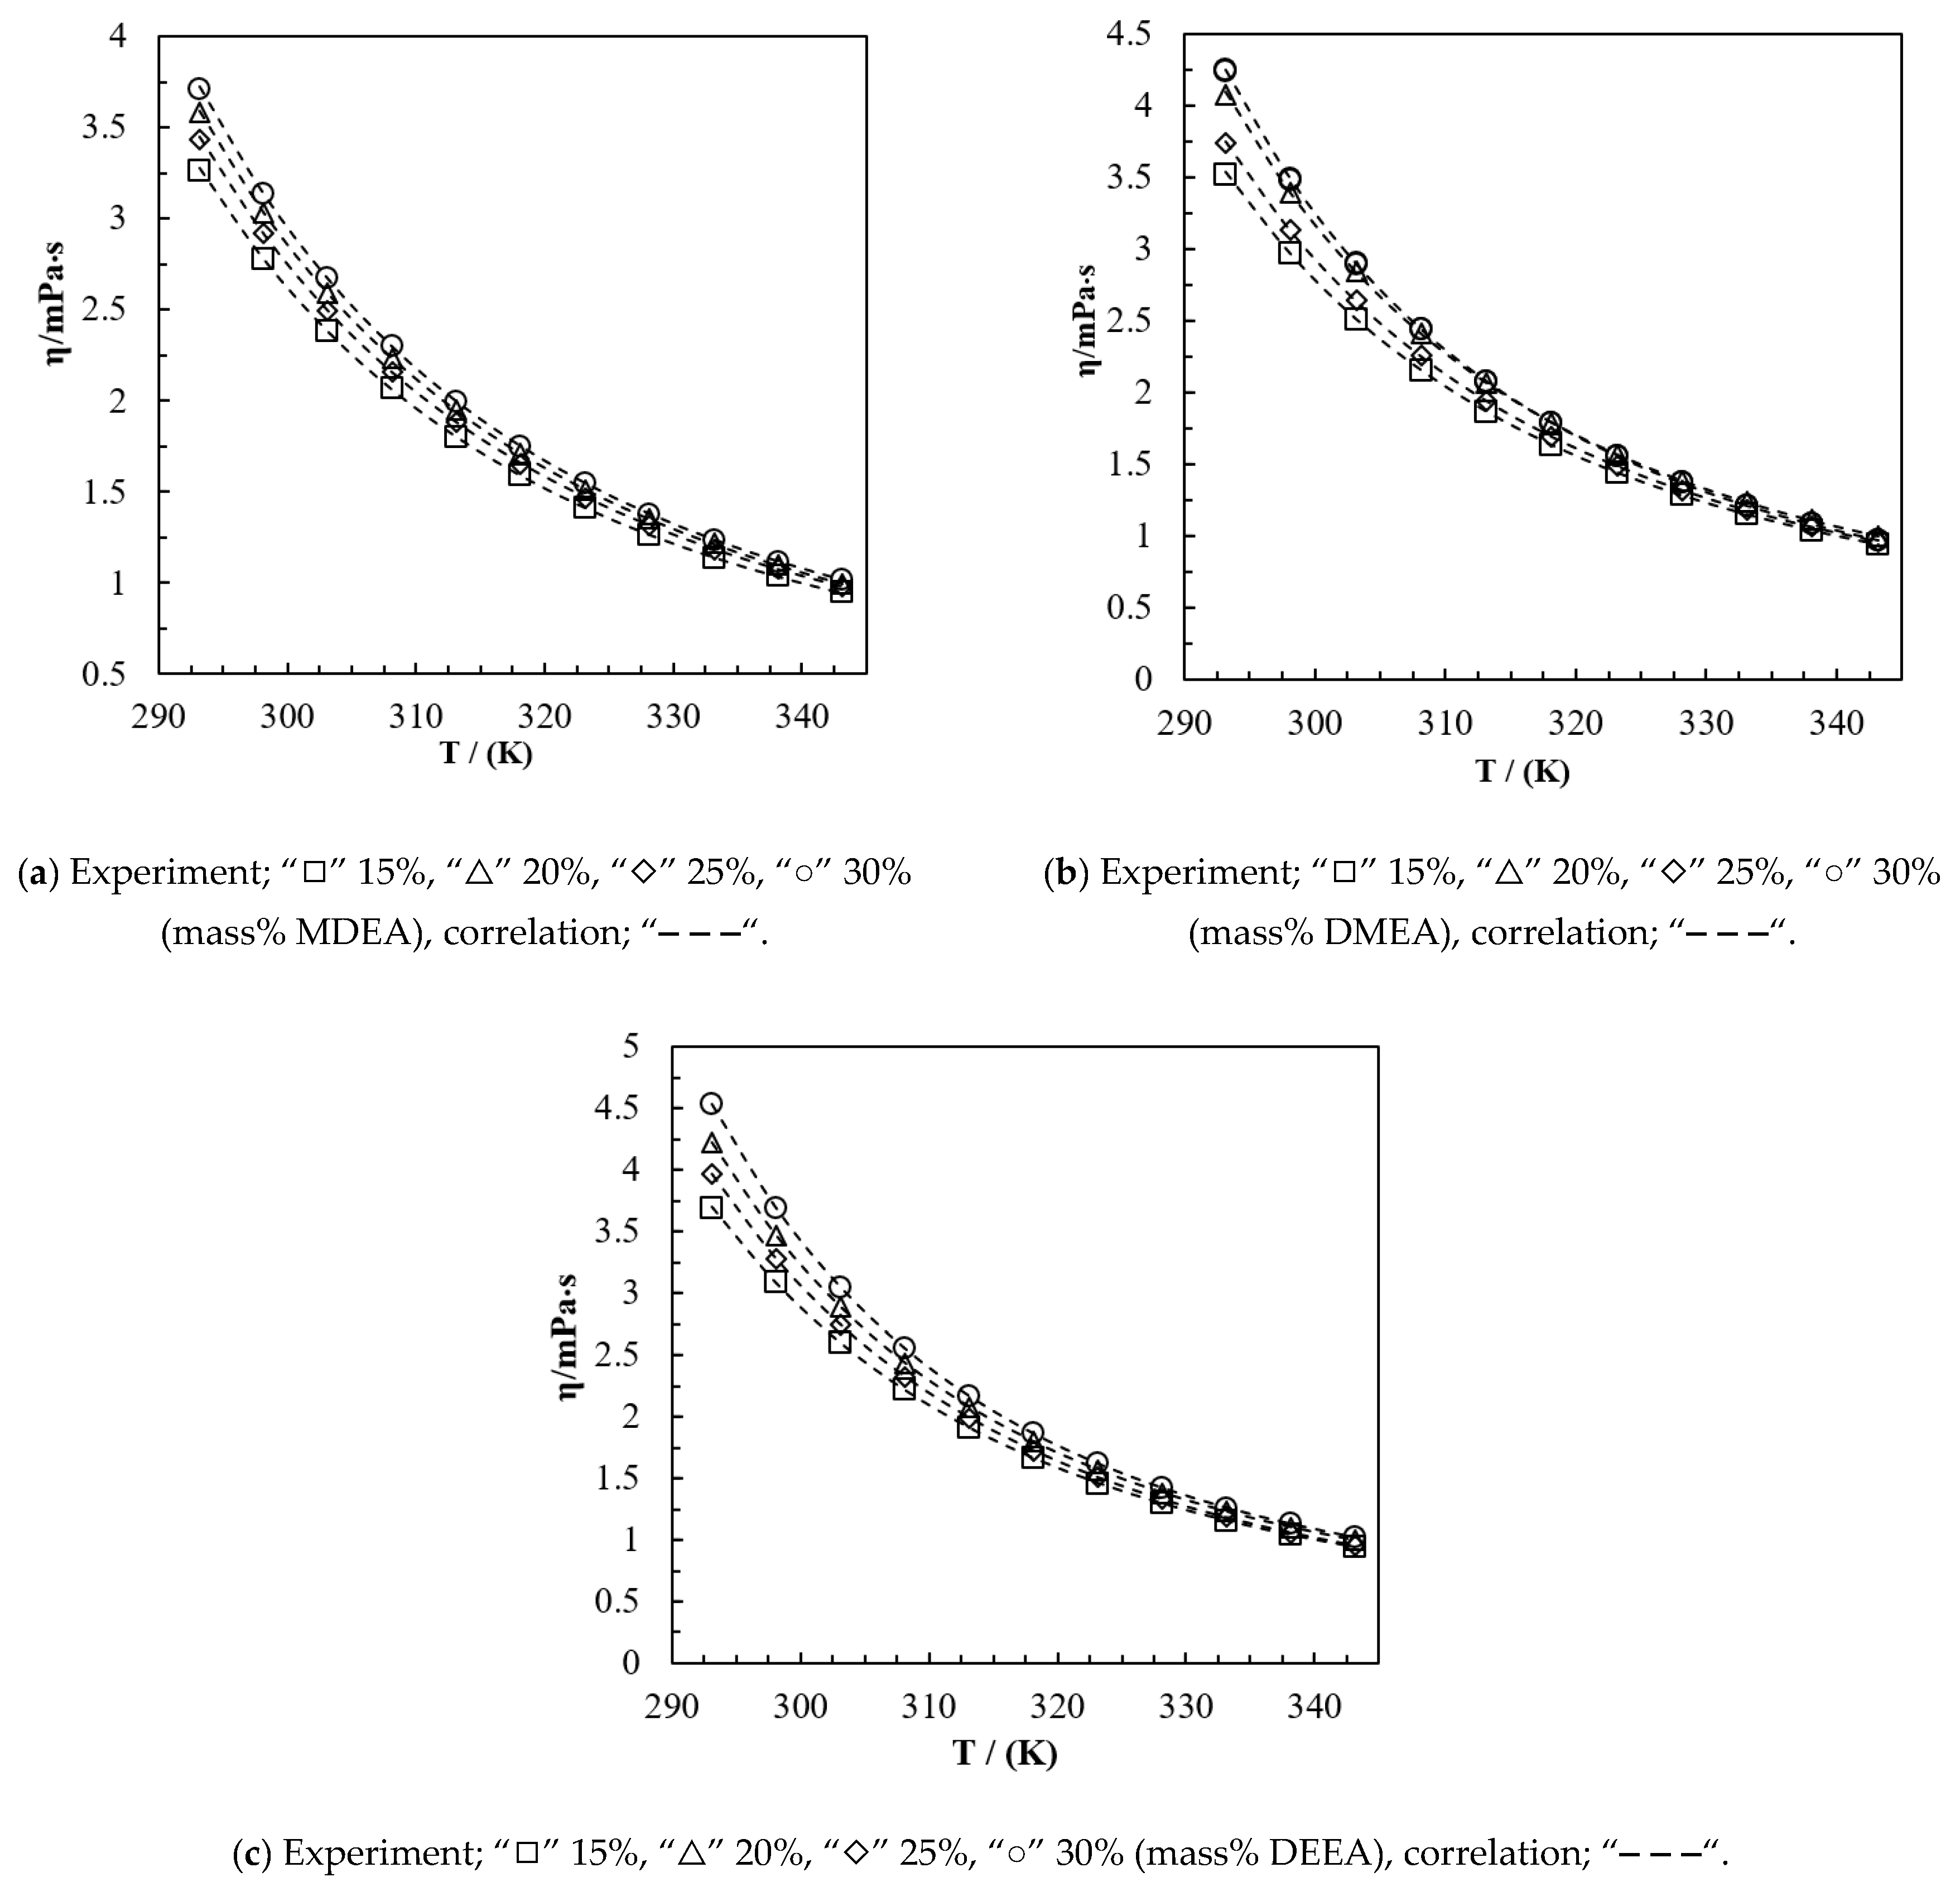
The correlation proposed for
was adopted to represent the measured viscosities, as illustrated in
Figure 3. Due to the non-availability of measured density data beyond 343.15 K, the correlation represents viscosities only in the temperature region of 293.15 K–343.15 K. The calculated parameters of correlation for
are given in
Table 14,
Table 15 and
Table 16. The reported
AARD and
AMD for the correlated viscosities of MDEA + MEA + H
2O, DMEA + MEA + H
2O, and DEEA + MEA + H
2O mixtures are listed in
Table 17 and show that the proposed correlations fit viscosity data with acceptable accuracy.
The
Supplementary Materials provide the information of the used MATLAB program for the calculation of parameters involve in viscosity correlation.
According to Meyer et al. [
54], molecular interactions in liquid mixtures can be studied by adopting
, similar to the
. Studies performed in References [
41,
55,
56,
57] suggested that a positive deviation of
indicates strong intermolecular interactions, such as H-bonds among unlike molecules, while a negative deviation of
signifies weak molecular interactions, such as dispersive forces.
The mixtures examined in this study demonstrated positive deviations for
for the considered amine concentrations and temperatures, indicating the presence of strong intermolecular interactions like H-bonds between the molecules in the mixtures. The presence of (–OH) and (–NH
2) groups in amines contributes to the formation of H-bonds between unlike molecules. For the MDEA + MEA + H
2O mixtures, the highest
was reported for the mixture of 30 mass% MDEA + 0 mass% MEA + 70 mass% H
2O. The highest
for DEEA + MEA + H
2O was reported for the mixture of 30 mass% DEEA + 0 mass% MEA + 70 mass% H
2O, while for DMEA + MEA + H
2O, the highest
was reported for the mixture of 30 mass% DMEA + 0 mass% MEA + 70 mass% H
2O. The increases of MEA concentration gradually decreased the
for all mixtures, as shown in the
Figure 4.
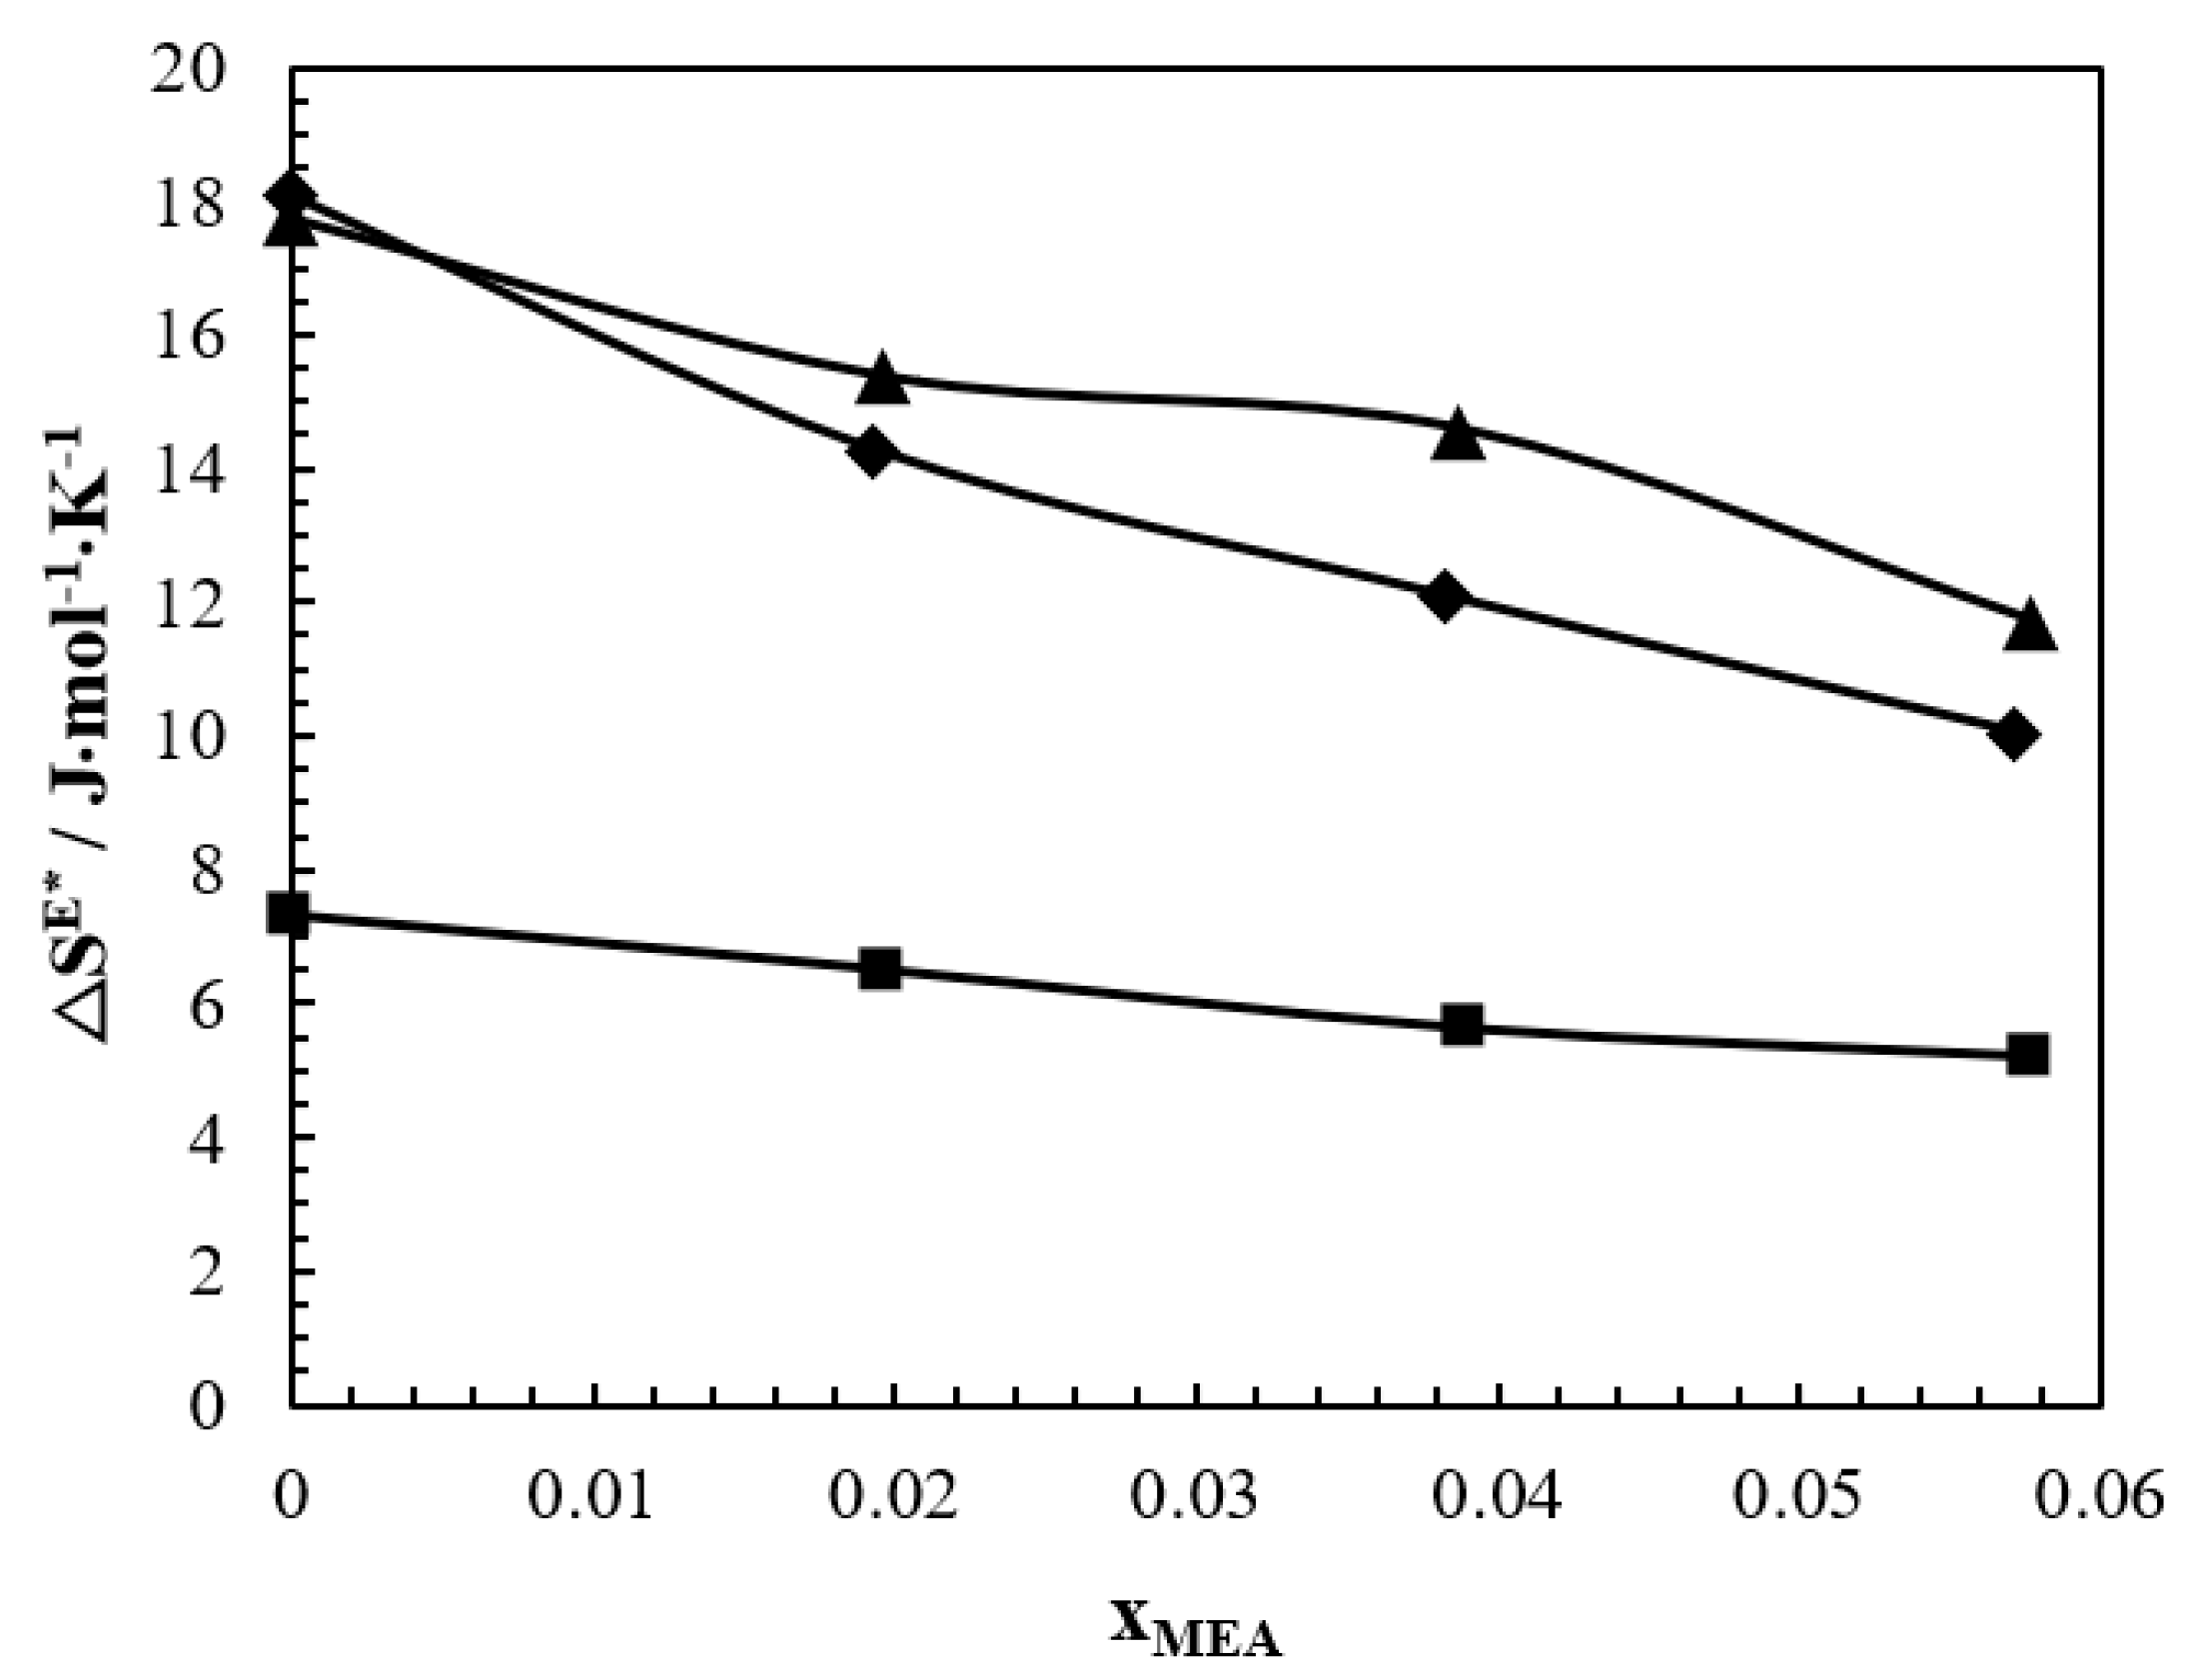
The slope of the excess free energy of activation
against temperature
at certain mole fractions gives the excess entropy of activation
for the viscous flow:
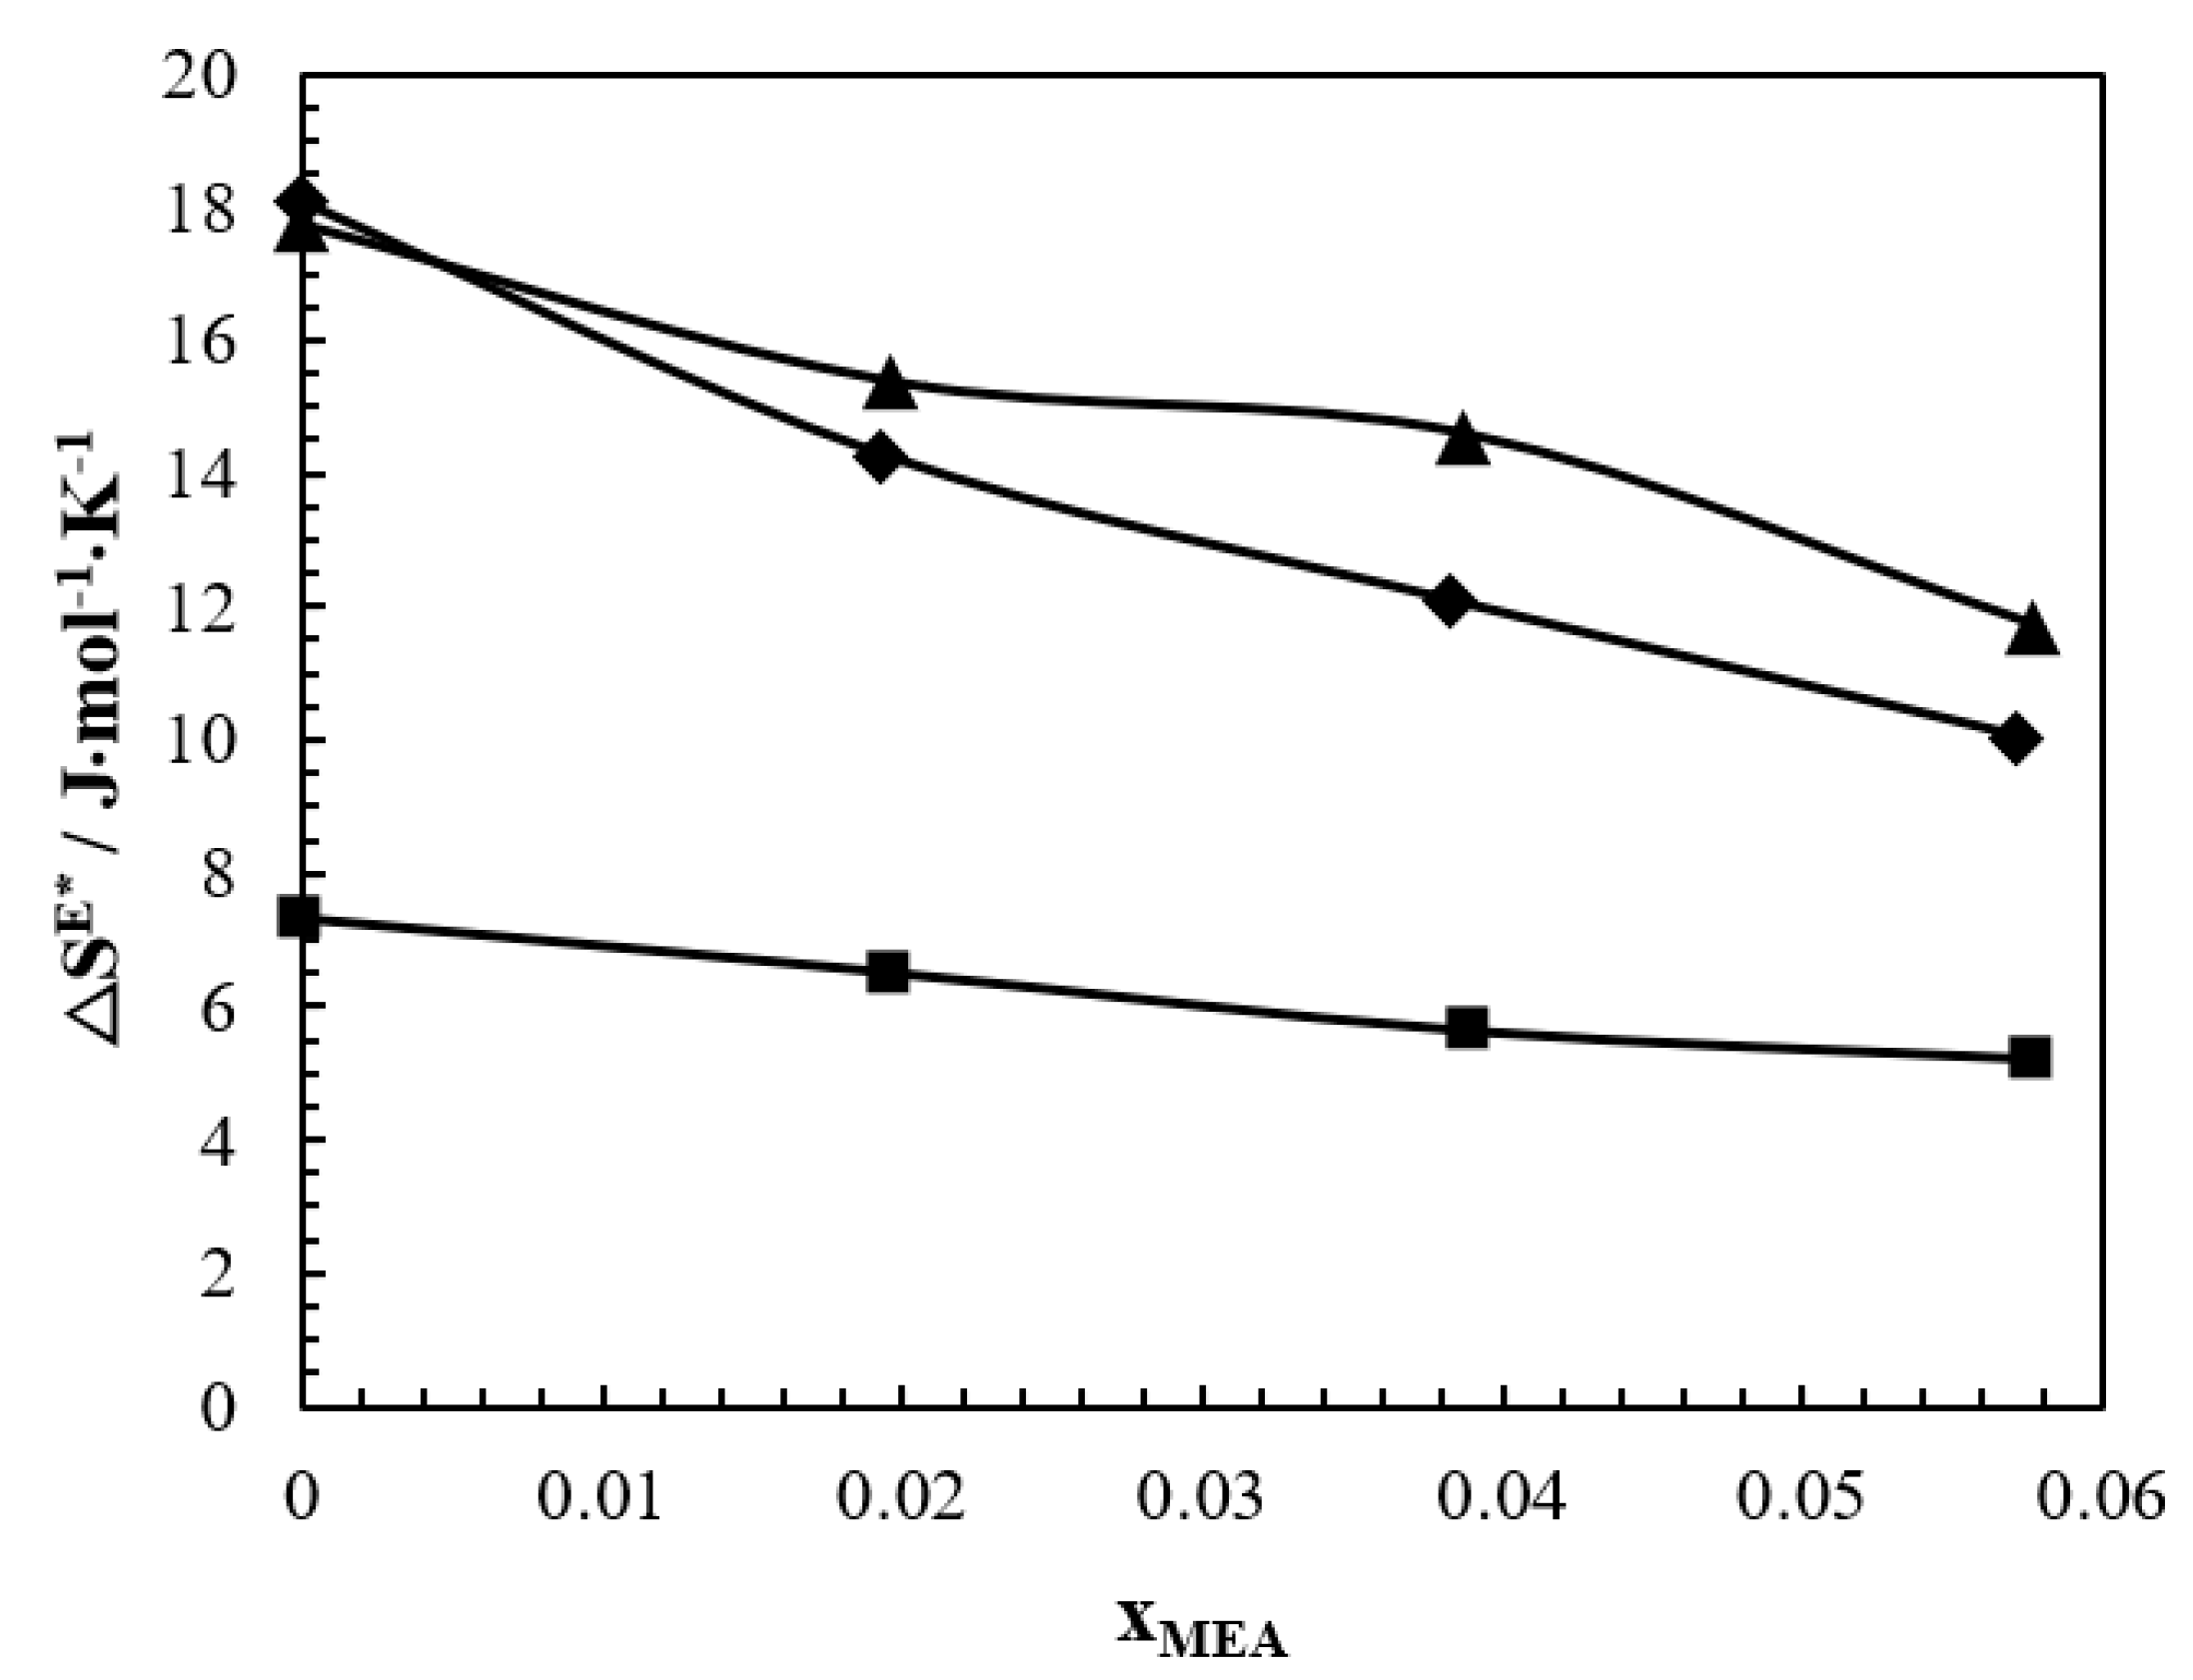
Figure 5 shows the excess entropy of activation
for the viscous flow of MDEA + MEA + H
2O, DMEA + MEA + H
2O, and DEEA + MEA + H
2O in the temperature range of 293.15 K–343.15 K over the whole range of concentrations. The values for
were determined using Equation (15).
Figure 5 reveals that the excess entropy
followed the same trend as
, that is,
decreased with the increase of MEA concentration in the mixture. A maximum value for
was observed at solutions with 0 mass% MEA.


