Article

Inertial Micromixing in Curved Serpentine Micromixers with Different Curve Angles

1
Faculty of Engineering and Natural Science, Sabanci University, 34956 Istanbul, Turkey
2
Sabanci University Nanotechnology and Application Center (SUNUM), Sabanci University, 34956 Istanbul, Turkey
3
Center of Excellence for Functional Surfaces and Interfaces for Nano-Diagnostics (EFSUN), Sabanci University, 34956 Istanbul, Turkey
*
Author to whom correspondence should be addressed.
Fluids 2019, 4(4), 204; https://doi.org/10.3390/fluids4040204
Submission received: 28 October 2019 / Revised: 1 December 2019 / Accepted: 5 December 2019 / Published: 8 December 2019

Abstract

:
Micromixers are of considerable significance in many microfluidics system applications, from chemical reactions to biological analysis processes. Passive micromixers, which rely solely on their geometry, have the advantages of low cost and a less-complex fabrication process. Dean vortices seen in curved microchannels are one of the useful tools to enhance micromixing. In this study, the effects of curve angle on micromixing were experimentally investigated in three curved serpentine micromixers consisting of ten segments with curve angles of 180 ° , 230 ° and 280 ° , at Dean numbers between 12 and 87. To characterize and compare the performance of the micromixers, fluorescence intensity maps and mixing indices were utilized. Accordingly, the micromixer having segments with 280 ° curve angle had significantly higher mixing index values up to the Dean number 60 and outperformed the other two micromixers. This was due to the severe distortion of flow streamlines by Dean vortices and the occurrence of chaotic advection at lower Dean numbers. Beyond the Dean number of 70, no difference was observed in the performance of the micromixers and the mixing index at their outlets had the asymptotic value of 0.93 ± 0.02. Furthermore, the flow behavior of the micromixers was numerically simulated to provide further insight about the mixing phenomena.

1. Introduction

Microfluidics involves the manipulation of fluids and particles in channels with dimensions in the order of magnitude of tens to hundreds of micrometer and has offered exciting dimensions and applications for both academia and industry during the last decade. Lab-on-a-chip (LOC) devices and micro total analysis systems ( μ TAS) are notable examples of microfluidics applications. Such systems require integration with micromixers to mix reagent molecules, fluids or species for chemical reactions [1], which emphasizes on the significance of mixing in micro-scale. The applications of micromixing cover a variety of fields, including biomedical systems [2], sample concentration [3], chemical synthesis [4], chemical reactors [5], polymerization [6], extraction [7], DNA purification [8], biological analysis processes [9], droplet [10] and emulsion [11] processes. The growing demand for micromixers in such fields necessitates the understanding of the involved mechanisms in order to improve their design for effective mixing.
Micromixers are commonly classified into two main categories—active and passive micromixers [1,12]. Active micromixers employ external sources to manipulate the fluid flow to have a larger contact area or to enhance chaotic advection [13]. Some of the common external sources in active micromixers include magnetic [14], acoustic [15], electrical field [16] and thermal [17] sources. Although such forces may lead to effective mixing, there are major drawbacks such as additional required components which raise fabrication costs, the need for more space on the chips and more difficult integration [18,19].
On the other hand, passive micromixers rely solely on the microchannel geometry, rather than external sources. Hence, they benefit from lower fabrication costs, less-complicated fabrication processes and ease of control. In passive micromixers, mixing is achieved through enhancing chaotic advection by disturbing the laminar flow or amplifying molecular diffusion by enlarging contact time and area between the fluids [12]. The most common types of passive micromixers include parallel and serial lamination, injection, and droplet micromixers. Another important type of passive micromixers relies on chaotic advection, in which the microchannel geometry distorts the laminar flow streamlines by stretching, folding, splitting or breaking, which results in a higher degree of mixing [20]. Particularly, curved serpentine and spiral [21] micromixers induce chaotic advection by introducing secondary flows (also known as Dean vortices) perpendicular to the main flow stream. This type of micromixers is efficient for flows with Reynolds numbers of a few hundred [1]. Important studies on this type of micromixers are available in the literature. For example, Jiang et al. numerically investigated helical flows and chaotic mixing in curved serpentine microchannels of square cross section with width of 200 μ m and radius of curvature of 1000 μ m [22]. Chen et al. studied micromixing in a staggered curved channel and continuous curved channels with curve angles of 180 ° and 270 ° at Reynolds numbers in the range of 0.5 to 50 [23]. Wu et al. proposed a converging-diverging curved serpentine microchannel with curve angle of 180 ° , which induced both Dean vortices and separation vortices into the flow stream at Reynolds numbers below 100 [24]. Cook et al. carried out a numerical study followed by its experimental validation on a scaled-up micromixer composed of mixing elements of 180 ° curve angle with slanted grooves at the bottom surface of the mixer at Reynolds numbers between 0.5 and 100 [19]. Alam et al. performed a numerical study on the mixing performance of curved microchannels with curve angle of 180 ° with different circular obstructions at Reynolds numbers from 0.1 and 60 [25]. Akgönül et al. investigated the micromixing performance of a symmetric and an asymmetric curvilinear microchannel having curve angle of 280 ° for Reynolds numbers below 60 [26]. Clark et al. numerically studied passive mixing in serpentine curved channels with curve angle of 180 ° having non-circular cross-sections [27].
In this study, three micromixers with ten mixing segments with curve angles of 180 ° , 230 ° , and 280 ° (which will be denoted as M180, M230 and M280 hereafter, respectively) were fabricated to investigate the effects of curve angle on micromixing, which is the main contribution of this study. In this regard, their mixing performances under different flow conditions were characterized and the involved mechanisms were discussed. On this matter, deionized (DI) water and diluted Rhodamine B fluorescent solutions were pumped into the micromixers at total flow rates ranging from 400 μ L/min to 3000 μ L/min, which corresponded to Dean numbers from 12 to 87 and Reynolds numbers from 30 to 227. While Reynolds numbers in typical micromixing studies rarely exceed 100, the wide range of Reynolds number is a strength point of this study. The mixing ability of each micromixer was assessed by calculating mixing index at various locations along them under each flow condition. In addition to high throughput, in-depth study of three different curve angles is included in this study. Furthermore, using a commercial finite element software, the flow behavior in the micromixers was simulated at a low, medium and large flow rate for providing further discussion and understanding of the involved mixing mechanisms. The results of this study could be used to better design microfluidic devices having curved serpentine micromixers.

2. Materials and Methods

2.1. Theory

The fluid flow in a channel is governed by continuity:
ρ · u = 0
and Navier-Stokes equations:
ρ u · u = [ p I + μ ( u + ( u ) T ) ] ,
where ρ is fluid density, u is fluid velocity, p is fluid pressure and μ is fluid viscosity. It is a well-known fact that turbulence is one of the most desired phenomena for rapid mixing in conventional mixing systems. However, generating turbulent flows in microscale is rather challenging due to low Reynolds numbers in typical microchannels. An important dimensionless number in micromixing is Reynolds number, R e , which represents the ratio of the fluid inertia to viscous forces and is defined as:
R e = ρ U D h μ ,
where U is average flow velocity and D h is hydraulic diameter of the channel. In a microfluidic system assuming water as the working fluid with density and dynamic viscosity of 1000 kg/m3 and 0.001 Pa·s, respectively, R e would be in the order of 0.1 for flow velocities in the order of 0.001 m/s and channel hydraulic diameters in the order of hundreds of micrometer [28]. Knowing the typical lower limit of R e c r 2300 as critical Reynolds number, micromixing cannot be achieved by turbulence. At low Reynolds numbers, the mixing process relies only on molecular interdiffusion, which is a slow process compared to turbulent mixing [29]. The molecular diffusion is theoretically modelled by Fick’s law as:
j = D C ,
where j is mass flux, D is diffusion coefficient of species and C is concentration of species. Accordingly, mixing is affected by diffusion length and diffusivity. Diffusivity is a property of the mixing chemical and is therefore not adjustable. To increase the mixing efficiency, the interfacial surface area and concentration gradient should be increased. Thus, fundamentally, rapid mixing could be obtained by decreasing the diffusion length. Besides the molecular interdiffusion, chaotic trajectories can be achieved using advection. Chaotic advection mixing can be generated by specific microchannel geometries, which cause vortices in the flow and enhance the micromixing.
Another important dimensionless number to be considered is Péclet number, P e , which is the ratio of convective to diffusive mass transfers and is defined as [23]:
P e = U D h D .
Accordingly, when P e < 1, the diffusion dominates over convection mass transfer in a mixing process; and when P e > 1, convection, which is achieved by external forces and/or geometry of the microchannel, dominates over the diffusive mass transfer [30]. Notably, the diffusion coefficient of Rhodamine B in water is 3.6 × 10⁻¹⁰ m2/s [31]. In addition, considering the hydraulic diameter of the micromixers in this work to be 143 μ m and the lowest flow rate of 400 μ L/min, the smallest P e is 8.4 × 10⁴. Thus, it could be concluded that micromixing mainly takes place by advection, rather than by diffusion. It is worth mentioning that a relatively long straight channel is required for mixing two fluids at Péclet numbers greater than 100. In this study, curvature is introduced to the microchannels geometry to induce mixing withing short lengths [24]. In this case, transverse secondary flows form, which leads to a beneficial interaction between the inertial and centrifugal forces. The centrifugal forces push the fluid from the microchannel center to the outer wall, where the fluid has a lower velocity. At the outer wall, double vortex forms by pressing the fluid and causing the fluid flows to upward and downward directions. On the other hand, the viscous wall friction dampens the double vortex by acting against the centrifugal force, which depends on the average fluid velocity and the radius of the bend. According to Dean [32], the flow regimes and generation of vortices in laminar flows with low Reynolds numbers in curved channels and pipes depend on the dimensionless Dean number, which includes R e , the dimension ratio (the ratio of the pipe) and radius of the bend. Dean number, D e , is defined as:
D e = R e D h 2 R ,
where R is radius of curvature of the microchannel. At low flow rates with D e < 1, mixing of two parallel streams mainly occurs by diffusion. In a curved channel, however, at Dean numbers greater than 10, the first double vortex forms [33] and enhances micromixing.

2.2. Micromixers Design

Three curved serpentine micromixers utilized in this study consist of 10 mixing segments. Each segment is an arc with curve angles of 180 ° , 230 ° or 280 ° and corresponding lengths of 3.06, 3.91, and 4.76 mm, respectively. Accordingly, three micromixers—denoted as M180, M230 and M280—have total lengths (calculated along the serpentine) of 33.7, 42.2 and 52.2 mm, respectively. The width, height and inner radius of curvature of the mixing segments for all three micromixers are 350 μ m, 90 μ m and 800 μ m, respectively. Figure 1 shows the schematic of the three micromixers along with the location of the inlets of the two streams, main flow direction and zoom-in views of the mixing segments.
It is worth mentioning that the fabrication of a micromixer with a curve angle higher than 280 ° is very challenging as the smallest space between two consecutive turns becomes very narrow. Also, with curve angles closer to 360 ° , the curves come in contact with each other and such a microchannel is impossible to be fabricated. Therefore, 280 ° is the upper fabrication limit of a curved serpentine micromixer. It is notable that this is only valid for microchannels with constant radius. In spiral microchannels, the curve angle of 360 ° is achieved by variation of radius along the microchannel.

2.3. Micromixers Fabrication

The micromixers were fabricated using the standard soft lithography fabrication techniques. First, their geometries were printed on an acetate mask with 10,000 DPI resolution (by CAD/Art Services, Inc., Bandon, OR, USA). To fabricate each micromixer, the polished side of a 3″ silicon wafer (UniversityWafer, Inc., South Boston, MA, USA) was coated with SU-8 3050 photoresist (Microchem Corp.) with a spinner (Dorutek). Then, it was put on a hot plate at 95 ° C for 20 min. After soft baking, a Mask Aligner UV-Lithography device (Midas System Co., Ltd., MDA-60MS Mask Aligner 4″) exposed the coated wafer to UV light through the printed acetate mask. Next, the wafer was put on a hot plate at 65 ° C for one minute and then on a hot plate at 95 ° C for 5 min. Afterwards, the unexposed parts of the photoresist were washed off by SU-8 Developer (Microchem Corp.). In the next step, the silicon wafer was put in a glass petri dish and a well-stirred 10:1 ratio mixture of PDMS (polydimethylsiloxane) prepolymer and curing agent (Sylgard 184 silicone elastomer kit, Dow Corning) was poured over it. The dish was placed inside a heater-integrated vacuum chamber (Sheldon Manufacturing, Inc.) under 76 mTorr to eliminate the trapped air bubbles inside the PDMS mixture. After curing, the agent for two hours at 75 ° C, the PDMS was peeled off the wafer and cut with a surgical blade. Subsequently, the inlets and outlets holes were punched with a 21-guage needle. The PDMS piece along with a microscope slide was washed with isopropyl alcohol (IPA) and DI water and was blow-dried with Nitrogen. In the following step, the parts were put inside an oxygen plasma cleaner Device (Harrick Plasma Cleaner), activated for 60 seconds under vacuum and were bonded to each other. Finally, the chip was placed on a hotplate (Dorutek) at 75 ° C for 15 min to strengthen the bond.

2.4. Solution Preparation

To prepare the fluorescent solution, Rhodamine B powder (Merck KGaA, Darmstadt, Germany) was solved in DI water to obtain a 0.5 mM solution. Then, the mixture was magnetically stirred for 15 min to ensure the uniform distribution of Rhodamine B.

2.5. Experimental Procedure

Two 60-ml plastic syringes were filled with DI water and the 0.5 mM Rhodamine B fluorescent solution, mounted on a dual syringe pump (LEGATO® 200, KD Scientific, Holliston, MA, USA) and connected to the micromixers through TYGON tubing with 250 μ m internal diameter (IDEX Corp., Lake Forest, IL, USA) and metal fittings (IDEX Corp.). Each micromixer was placed on an inverted fluorescence microscope (Carl-Zeiss Live Cell Imaging), while its outlets were put to a reservoir with similar tubings and fittings. For each micromixer, the experiment started with pumping the fluids to the micromixer at the total flow rate of 400 μ L/min. When a sufficient amount of time passed to ensure that the flow reached the steady-state condition and no significant change was observed in the flow behavior, the image of the whole micromixer was taken with the microscope camera system. Then, the flow rate was increased in 100 μ L/min increments up to 3000 μ L/min and the same procedure was followed. Supplementary Videos S1–S3 include the consecutive display of the fluorescence intensity maps of the micromixers M180, M230 and M280, respectively, at all of the flow rates.

2.6. Image Processing

The images were taken with the microscope software (ZEN Blue 2.3). For each image, the fluorescence intensity along the green lines marked in Figure 1 was extracted with the software to obtain intensity versus length profiles. To quantify the mixing degree, mixing index, M, was calculated as [34]
M = 1 1 n i = 1 n ( I i I ¯ I ¯ ) 2 ,
where n is the number of pixels, I i is the fluorescence intensity of the ith pixel and I ¯ is the average fluorescence intensity of all pixels. The values of zero and unity for M correspond to no mixing and perfect mixing, respectively.
It must be noted that to assure the reproducibility of the experiments, three sets of experiments were performed on each micromixer and the standard deviation of data was calculated and reported in the Results section. The average standard deviation of M calculated at the outlet was 0.05, 0.03 and 0.02 for M180, M230 and M280, respectively. In addition, the maximum value of the standard deviation was around 0.10. Thus, the experiments are claimed to be repeatable in this study.

2.7. Numerical Simulations

The flow behavior in the micromixers was simulated using the COMSOL Multiphysics 5.4a laminar flow module, which numerically solves the continuity and Navier-Stokes equations. The simulations were performed for incompressible flows under steady-state conditions. The boundary conditions include constant inlet velocity for the inlets, no-slip velocity for the walls and zero pressure for the outlet. The working fluid was water and the effect of Rhodamine B on the physical properties of water was not taken into account as the concentration is very dilute.
Importantly, since the ultimate numerical solution strongly depends on simulation parameters, a set of preliminary simulations were performed to find out the optimum simulation parameters. In this regard, different options of discretization of laminar flow and mesh size were selected for each micromixer under the lowest total flow rate (400 μ L/min). For discretization of velocity and pressure, the options of P2 + P1, P3 + P2 and P2 + P2 were selected. The meshing was built-in free tetrahedral, calibrated for fluid dynamics. The options included predefined element sizes of Fine and Finer. Then, the average velocity through the micromixers was computed with built-in surface integral function of the COMSOL software, and compared with the nominal theoretical value calculated by dividing flow rate by the cross-section area of the micromixer. Table 1 shows the simulation parameters including number of elements, degree of freedom and relative error of each simulation. The optimum set of simulation parameters was selected by considering computation time and accuracy of the results. Accordingly, the Finer mesh size distribution and P2 + P1 discretization were chosen for further simulations. For this combination, the relative error of velocity calculation was less than 8% in all of the micromixers.

3. Results and Discussion

3.1. M180

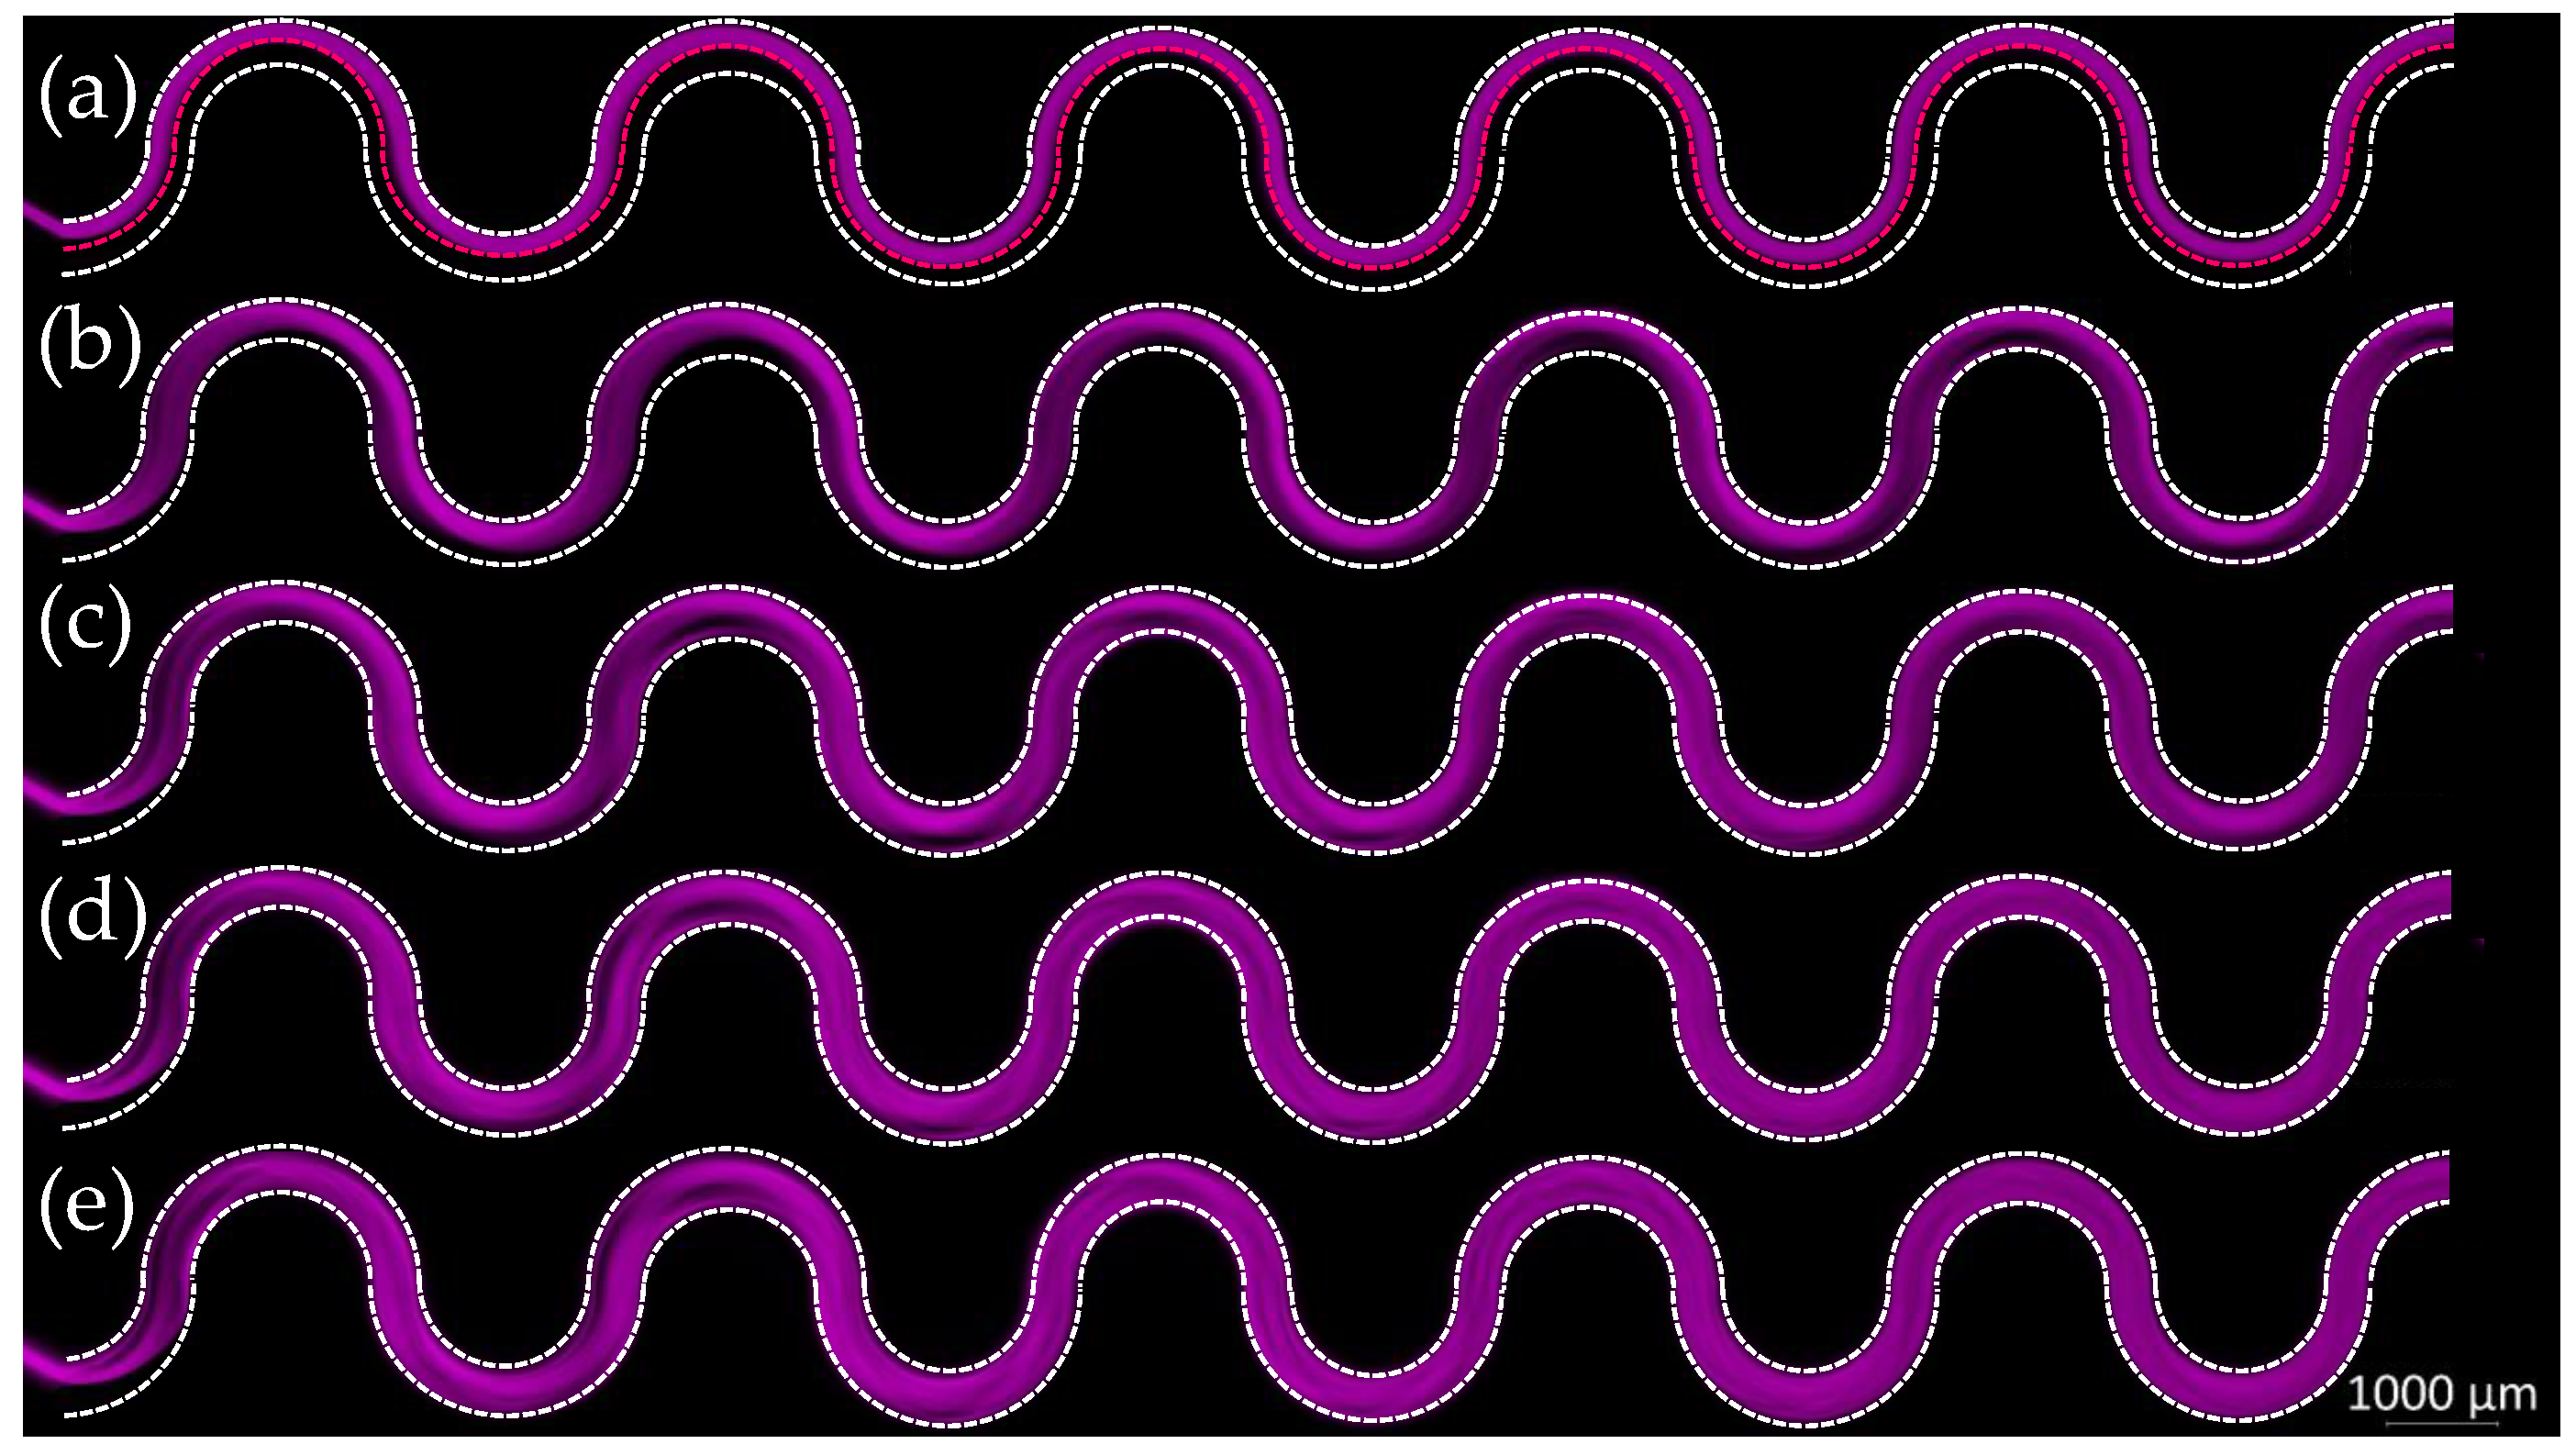
The variation of M along the micromixer M180 at different Dean numbers is presented in Figure 2a. At D e = 12, M had a fluctuating (increasing and decreasing) trend along the micromixer, which is due to the minor reversible inward and outward transversal flow in a curved microchannel. When the curvature sign of the channel is reversed by moving from one segment to the next, the fluid near the inner wall tends to move towards the outer wall and the fluid near the outer wall tends to move towards the inner wall. However, since D e was relatively low, the two fluids follow the main flow streamlines, which are slightly deformed, while remaining on the distinctive sides of the micromixer along its entire length. The interface between the two streams is denoted by a dashed line in magenta in Figure 3a. Accordingly, weak Dean vortices are not able to deform the diffusion layer [26]. In this figure, the diluted Rhodamine B stream slightly widens and narrows repetitively, which causes a repetitive increase and decrease in M, yet on an average basis, M has a very small increasing slope towards the outlet. However, overall, only a low degree of mixing occurs. As the flow rate increases, the fluctuations happen less frequently; and they almost disappear at D e = 26.
The outlet M is plotted against R e and D e in Figure 4a for the micromixer M180. Accordingly, for the range of 12 D e 35, the increase in outlet M is associated with a minor widening of the diluted Rhodamine B flow stream, which is inferred from the fluorescence intensity map for D e = 12 shown in Figure 4a and other Dean numbers presented in Supplementary Movie S1. In other words, this minor widening is most probably due to the weak Dean vortices, which disturb the shape of the interface between the two fluids—from a symmetric (a path following the channel mid-width) to an asymmetric serpentine curve. In this range, although the value of outlet M doubles from 0.19 ± 0.04 at D e = 12 to 0.42 ± 0.08 at D e = 35, this value is still regarded as a poor degree of mixing.
As observed in Figure 4a, when D e increases from 35 to 38, outlet M experiences a 30% jump from 0.42 ± 0.08 to 0.55 ± 0.10 and the diluted Rhodamine B solution touches the walls on the water side of the micromixer for the first time at the fourth segment, that is, it spans the entire channel width. Considering Figure 2a, at this D e , unlike at lower Dean numbers, M continuously increases along the micromixer with a noticeably higher slope, which indicates that the Dean vortices irreversibly exchange the fluids near the outer and inner walls. Accordingly, Dean vortices start to benefit the mixing starting at D e = 38. Moreover, some voids (low intensity areas) appear in the corresponding fluorescence intensity map (Figure 3b) in the last three segments, which indicates intermixing of water in the diluted Rhodamine B solution. This trend is observed at the Dean numbers 41 and 44 as well. From this point, the interface between the two fluids is no longer distinguishable, because the two streams start to twist into each other due to stronger Dean vortices. At the range of 35 D e 41, outlet M reaches a plateau of 0.64 ± 0.05 (Figure 4a) since the major fraction of mixing is caused by the secondary flow due to the interfolding of the two streams. In this range, water and diluted Rhodamine B start to severely twist into each other, which leads to appearances of voids in fluorescence intensity maps in all of the segments.
When 55 D e 70, the streams of the fluids more severely fold into each other, voids in the fluorescence intensity maps become gradually smaller (according to Figure 3c) and the fluorescence intensity becomes more uniform along the micromixer, all of which indicate that a step-change in the mixing is apparent. Apparently, the laminar flow streamlines are severely distorted by Dean vortices in this range and transversal flow leads to an increasing linear trend for outlet M (Figure 4a). Therefore, D e = 55 (corresponding to R e = 144) marks the onset of chaotic advection in M180. In other words, the laminar regime distortion by secondary flow enhances chaotic advection and starts to promote the mixing of the two fluids. In addition, since chaotic advection commences, M strictly increases with the highest slope, along the micromixer (Figure 2a) in this range.
For 73 D e 87, the two fluids are completely mixed by the eighth segment of the micromixer. The ultimate value of outlet M is 0.91 ± 0.02 (Figure 4a). According to Figure 3d,e, the fluorescence intensity becomes almost uniform all along the micromixer, intensity voids become the smallest and there is no change in the flow pattern, all of which suggest that the chaotic advection reaches its maximum contribution to mixing the two fluids.

3.2. M230

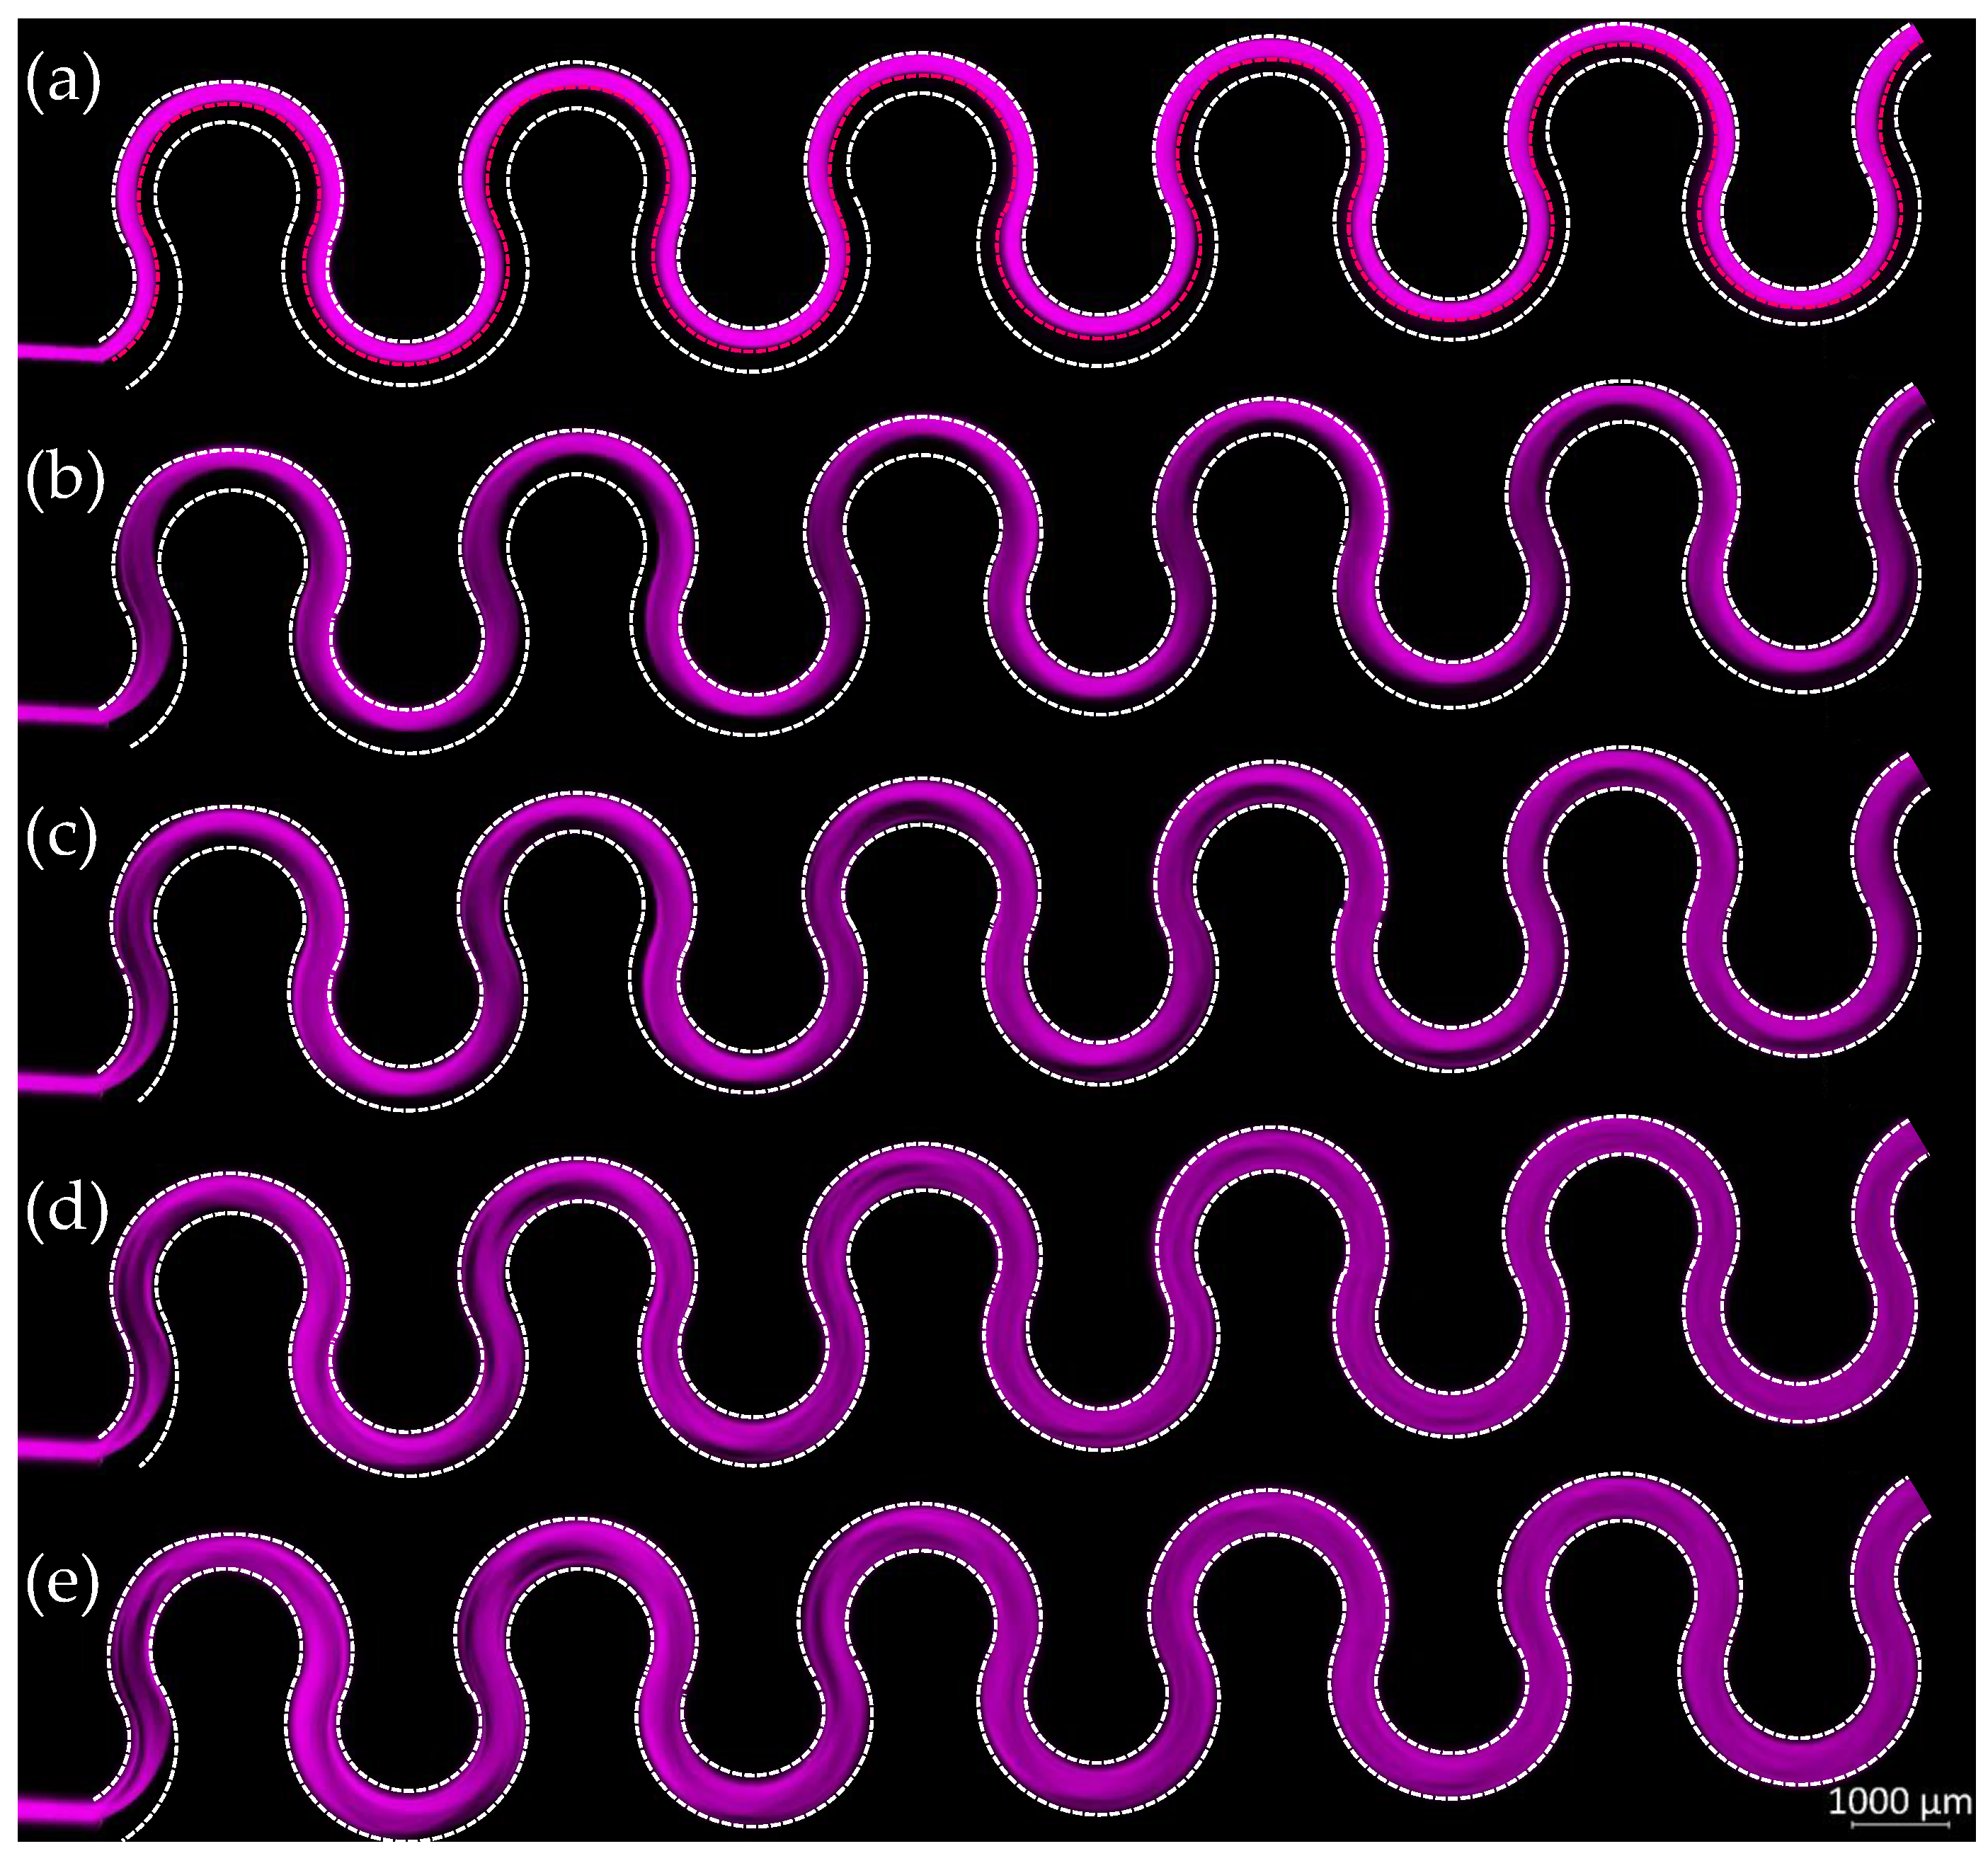
At D e = 12, the two streams remain on their distinctive sides of the micromixer with a clear interface marked in magenta in Figure 5a. In the range of 12 D e 35, Dean vortices only partially widen the diluted Rhodamine B stream at the inflection points of the micromixer, which can be observed in Figure 5a. In other words, secondary vortices are not sufficiently strong to expand the diffusion layer at the interface between the two streams [26]. Hence, as shown in Figure 2b, M increases along the micromixer with a mild slope. However, no substantial change occurs in outlet M over this range; the values of outlet M at the lower and upper limits of this range are 0.35 ± 0.08 and 0.36 ± 0.04, respectively (Figure 4b). In particular, at 12 D e 23, few fluctuations are observed in M along the micromixer. While this trend occurs because of the repetitive widening and narrowing of the diluted Rhodamine B stream, the amplitude of the fluctuations is noticeably lower than that in M180, as the two streams are more exposed to secondary flow before the sign of the curve angle is reversed. Thus, M230 has a higher outlet M compared to M180 (Figure 4a,b). At D e = 23, outlet M of M180 reaches that of M230 and the two micromixers show a similar mixing performance.
Similar to M180, M230 experiences a 27% jump in outlet M, from 0.36 ± 0.04 to 0.45 ± 0.06, when D e increases from 35 to 38, which indicates that Dean vortices start to contribute to the micromixing at D e = 38. According to Figure 5b, at this D e , starting from the second segment, the diluted Rhodamine B stream for the first time touches the water side of the micromixer and covers its entire width at the inflection points. Considering Figure 4b, the increase in outlet M stops at D e = 41 and in the range of 41 D e 46, outlet M becomes approximately constant (0.59 ± 0.06). The voids in the fluorescence intensity maps are first observed in this range, where better intermixing of water into the diluted Rhodamine B stream occurs. Importantly, D e = 49 (corresponding to R e = 129) marks the onset of chaotic advection (Figure 5c) since M increases with a higher slope than lower Dean numbers, which can be observed in Figure 2b and Figure 4b. Beyond this D e , multiple low intensity streams are observed along the micromixer (Figure 5c), which are indications of severe folding of the two streams into each other. Also, the intensity distribution along the micromixer starts to become uniform, which results in a boost in intermixing of the two streams. It is worth mentioning that, as shown in Figure 2a,b and Figure 4a,b, for the approximate range of 32 D e 46, the micromixer M180 shows higher M values at the same lengths and at the outlet as well. This behavior, considering the increasing trend of outlet M at lower Dean numbers for the micromixer M180 in Figure 4a, could be attributed to the greater contribution of secondary flows in M180 in this range compared to M230.
At 49 D e 73, M230 has a higher M compared to M180. Notably, when chaotic advection starts to contribute to the mixing, outlet M for M230 increases with a greater slope compared to M180. Ultimate mixing performance of M230 (outlet M of 0.92 ± 0.01 in Figure 4b) is achieved in the range of 64 D e 87 from the eighth segment of the micromixer. Comparing Figure 2b with Figure 2a at these high Dean numbers, M values along M230 are approximately the same as those at the corresponding locations along M180. Moreover, the invariable fluorescence intensity maps in this range (Figure 5d–e) imply that the combination of Dean vortices and chaotic advection leads to the highest degree of fluids intermixing. Although M230 reaches its maximum performance at a lower D e (64) compared to M180 (73), considering their trends in outlet M and uncertainties shown in Figure 4a,b, it can be inferred that M180 and M230 basically offer the same mixing performance over the flow conditions of this study. In other words, even 230 ° of curve angle is still unable to make a significant enhancement in mixing the two fluids.

3.3. M280

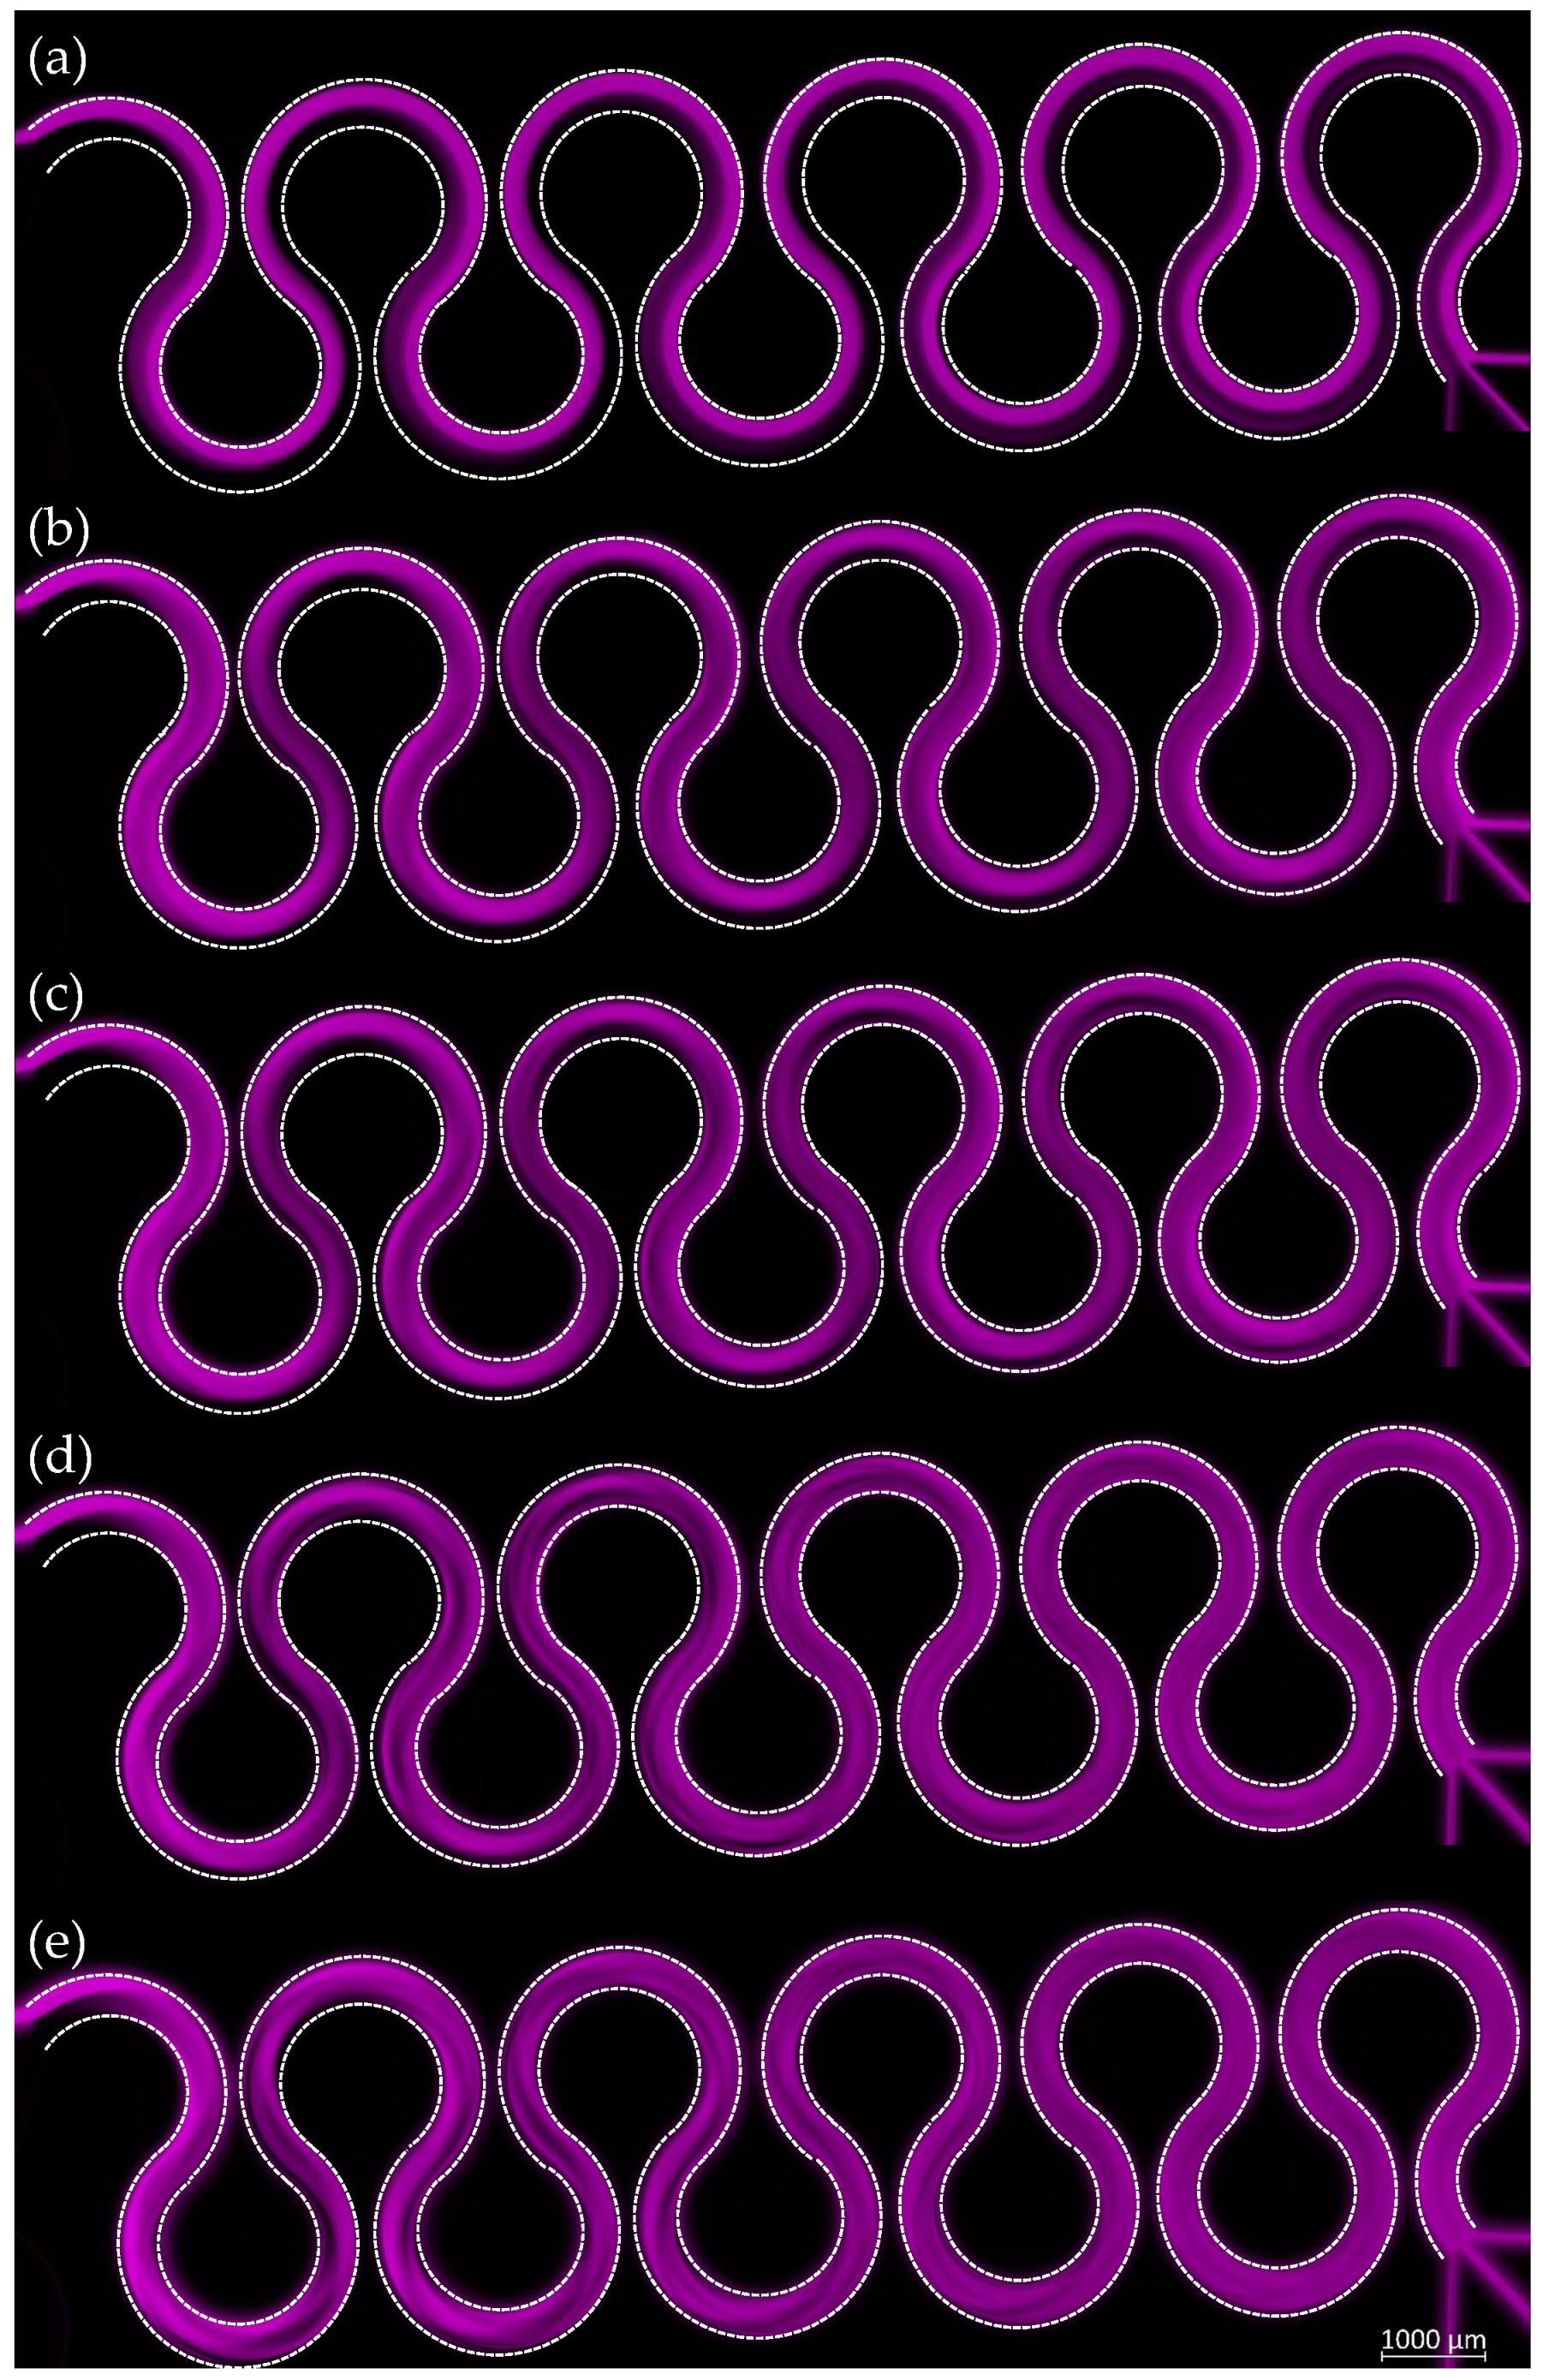
M280 exhibits a completely different mixing behavior compared to both M180 and M230. According to Figure 2c, at the lowest flow rate (corresponding to D e = 12 and R e = 30), M has a strictly increasing trend along the micromixer with a relatively steep slope and unlike M180 and M230, no fluctuation is observed in M along the micromixer. During the repetitive widening and narrowing of the diluted Rhodamine B stream, it spans the entire width of the micromixer for the first time at the first inflection point, although this stream shrinks repetitively in the next segments (Figure 6a). As a comparison, the diluted Rhodamine B stream covers the micromixer width for the first time at a higher flow rate (corresponding to D e = 35 and R e = 91) in M180 and M230. Referring to Figure 2a–c, at D e = 12, M280 leads to higher M values along its length compared to corresponding locations along M180 and M230. Moreover, at D e = 12, M280 has an outlet M of 0.66 ± 0.02, which is approximately 3.5 and 1.9 times those of micromixers M180 and M230, respectively (Figure 4). At this D e , the interface between the two fluids is almost not distinguishable due to severe distortion by Dean vortices. Compared to M180 and M230 at D e = 12, although the magnitude of Dean vortices is the same ( D e is independent of curve angle), the two fluids are influenced by the secondary flow over the length of 4.76 mm in each segment (1.6 and 1.2 times the segment lengths of M180 and M230, respectively). In other words, Dean vortices with the same magnitude have a greater impact on the fluids in M280 most likely due to a longer influence. Consequently, a higher degree of intermixing occurs.
Moreover, in the range of 12 D e 29, the increasing trend in outlet M (Figure 4c) is associated with the strengthening of the Dean vortices, which can also be concluded by the appearance of some low intensity streams in fluorescence intensity maps along the micromixer, especially after the eighth segment. At 29 D e 38, the outlet M has a constant value of 0.80 ± 0.02 (Figure 4c), which can be linked with the maximum contribution of Dean vortices in the mixing. In this range, voids in the fluorescence intensity maps of the micromixer start to appear, while the fluorescence intensity distribution remains almost unchanged (Figure 6b). Another increase in outlet M is observed starting from D e = 41 (corresponding to R e = 106), which can be attributed to the onset of chaotic mixing, while the diluted Rhodamine B stream spans the micromixer width starting from the third segment. This boost in the intermixing of the two fluids indicates that M280 significantly enhances the chaotic advection at a lower D e compared to M180 and M230.
At 41 D e 49, M sharply increases along the micromixer up to the sixth segment (Figure 2c), after which it gently reaches the ultimate mixing performance of M280. This can also be observed in the plot of outlet M in Figure 4c, in which M280 reaches a plateau of 0.93 ± 0.01 starting from D e = 49. In this range, chaotic advection contributes to the intermixing of fluids and an increasing trend is seen in M. Comparing the mixing performance of micromixers M280 and M230 at D e = 49 plotted in Figure 2b,c, respectively, it is noticeable that at any arbitrary length, M280 has a higher M value than M230. Therefore, by eliminating the parameter of micromixer length, it could be concluded that a higher curve angle exposes the two fluids to Dean vortices to a larger extent. In the range of 49 D e 87, the low intensity streams in the fluorescence intensity maps vanishes after the sixth segment and the fluorescence intensity becomes homogeneous all along the width of the micromixer (Figure 6c–e), which indicates a perfect intermixing of the two fluids due to combined effects of Dean vortices and chaotic advection. Considering Figure 6c–e, it could be noticed that the first segments substantially contribute to the micromixing, as the two fluids start to severely twist into each other starting from the very first segment. This is further confirmed by relatively high M values in Figure 2c. This is an additional evidence of the effective performance of a curved geometry in enhancing Dean vortices and chaotic advection for better mixing. Therefore, in this plot, the values of M cannot be extrapolated to zero for D e 49. Furthermore, comparing Figure 2a–c, once all micromixers reach their maximum mixing performance, M values along their length have similar values at any similar location along their length. This is due to the extensive contribution of chaotic advection to the mixing in all micromixers. Therefore, all micromixers have a similar performance under identical flow conditions at any location. The mixing performance of the three micromixers under different flow conditions is summarized in Table 2.

3.4. Simulation Results

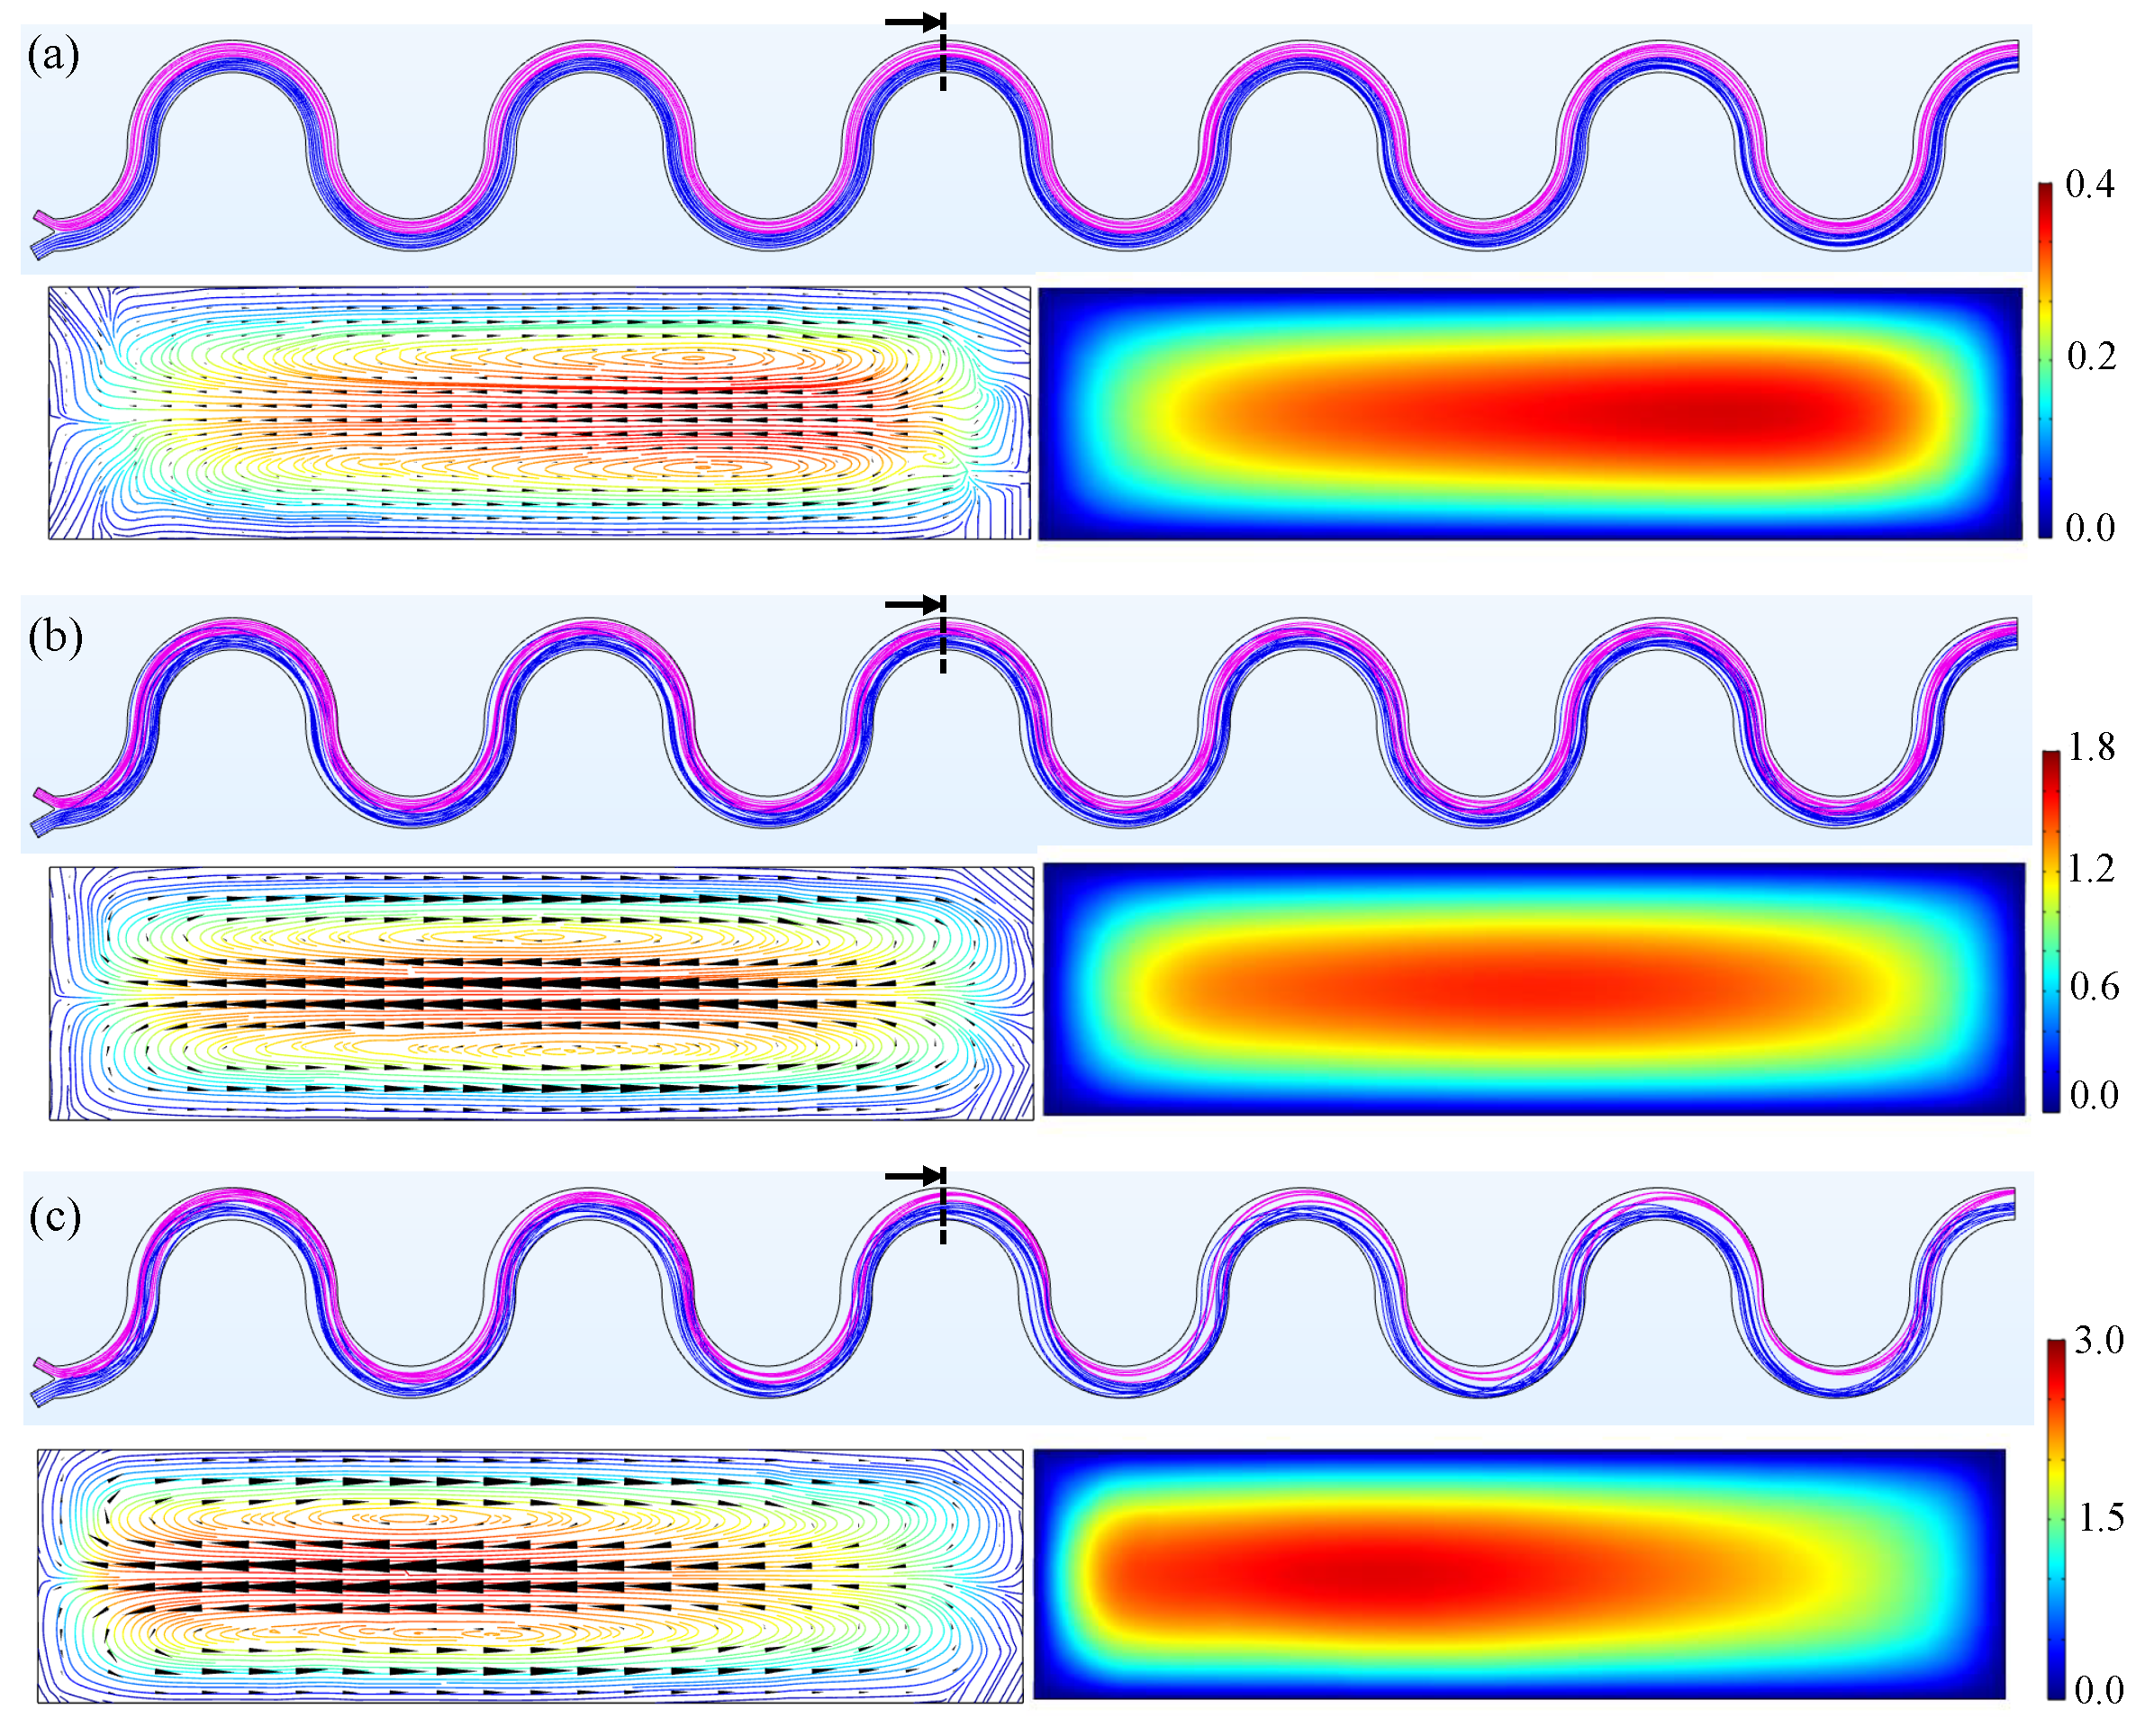
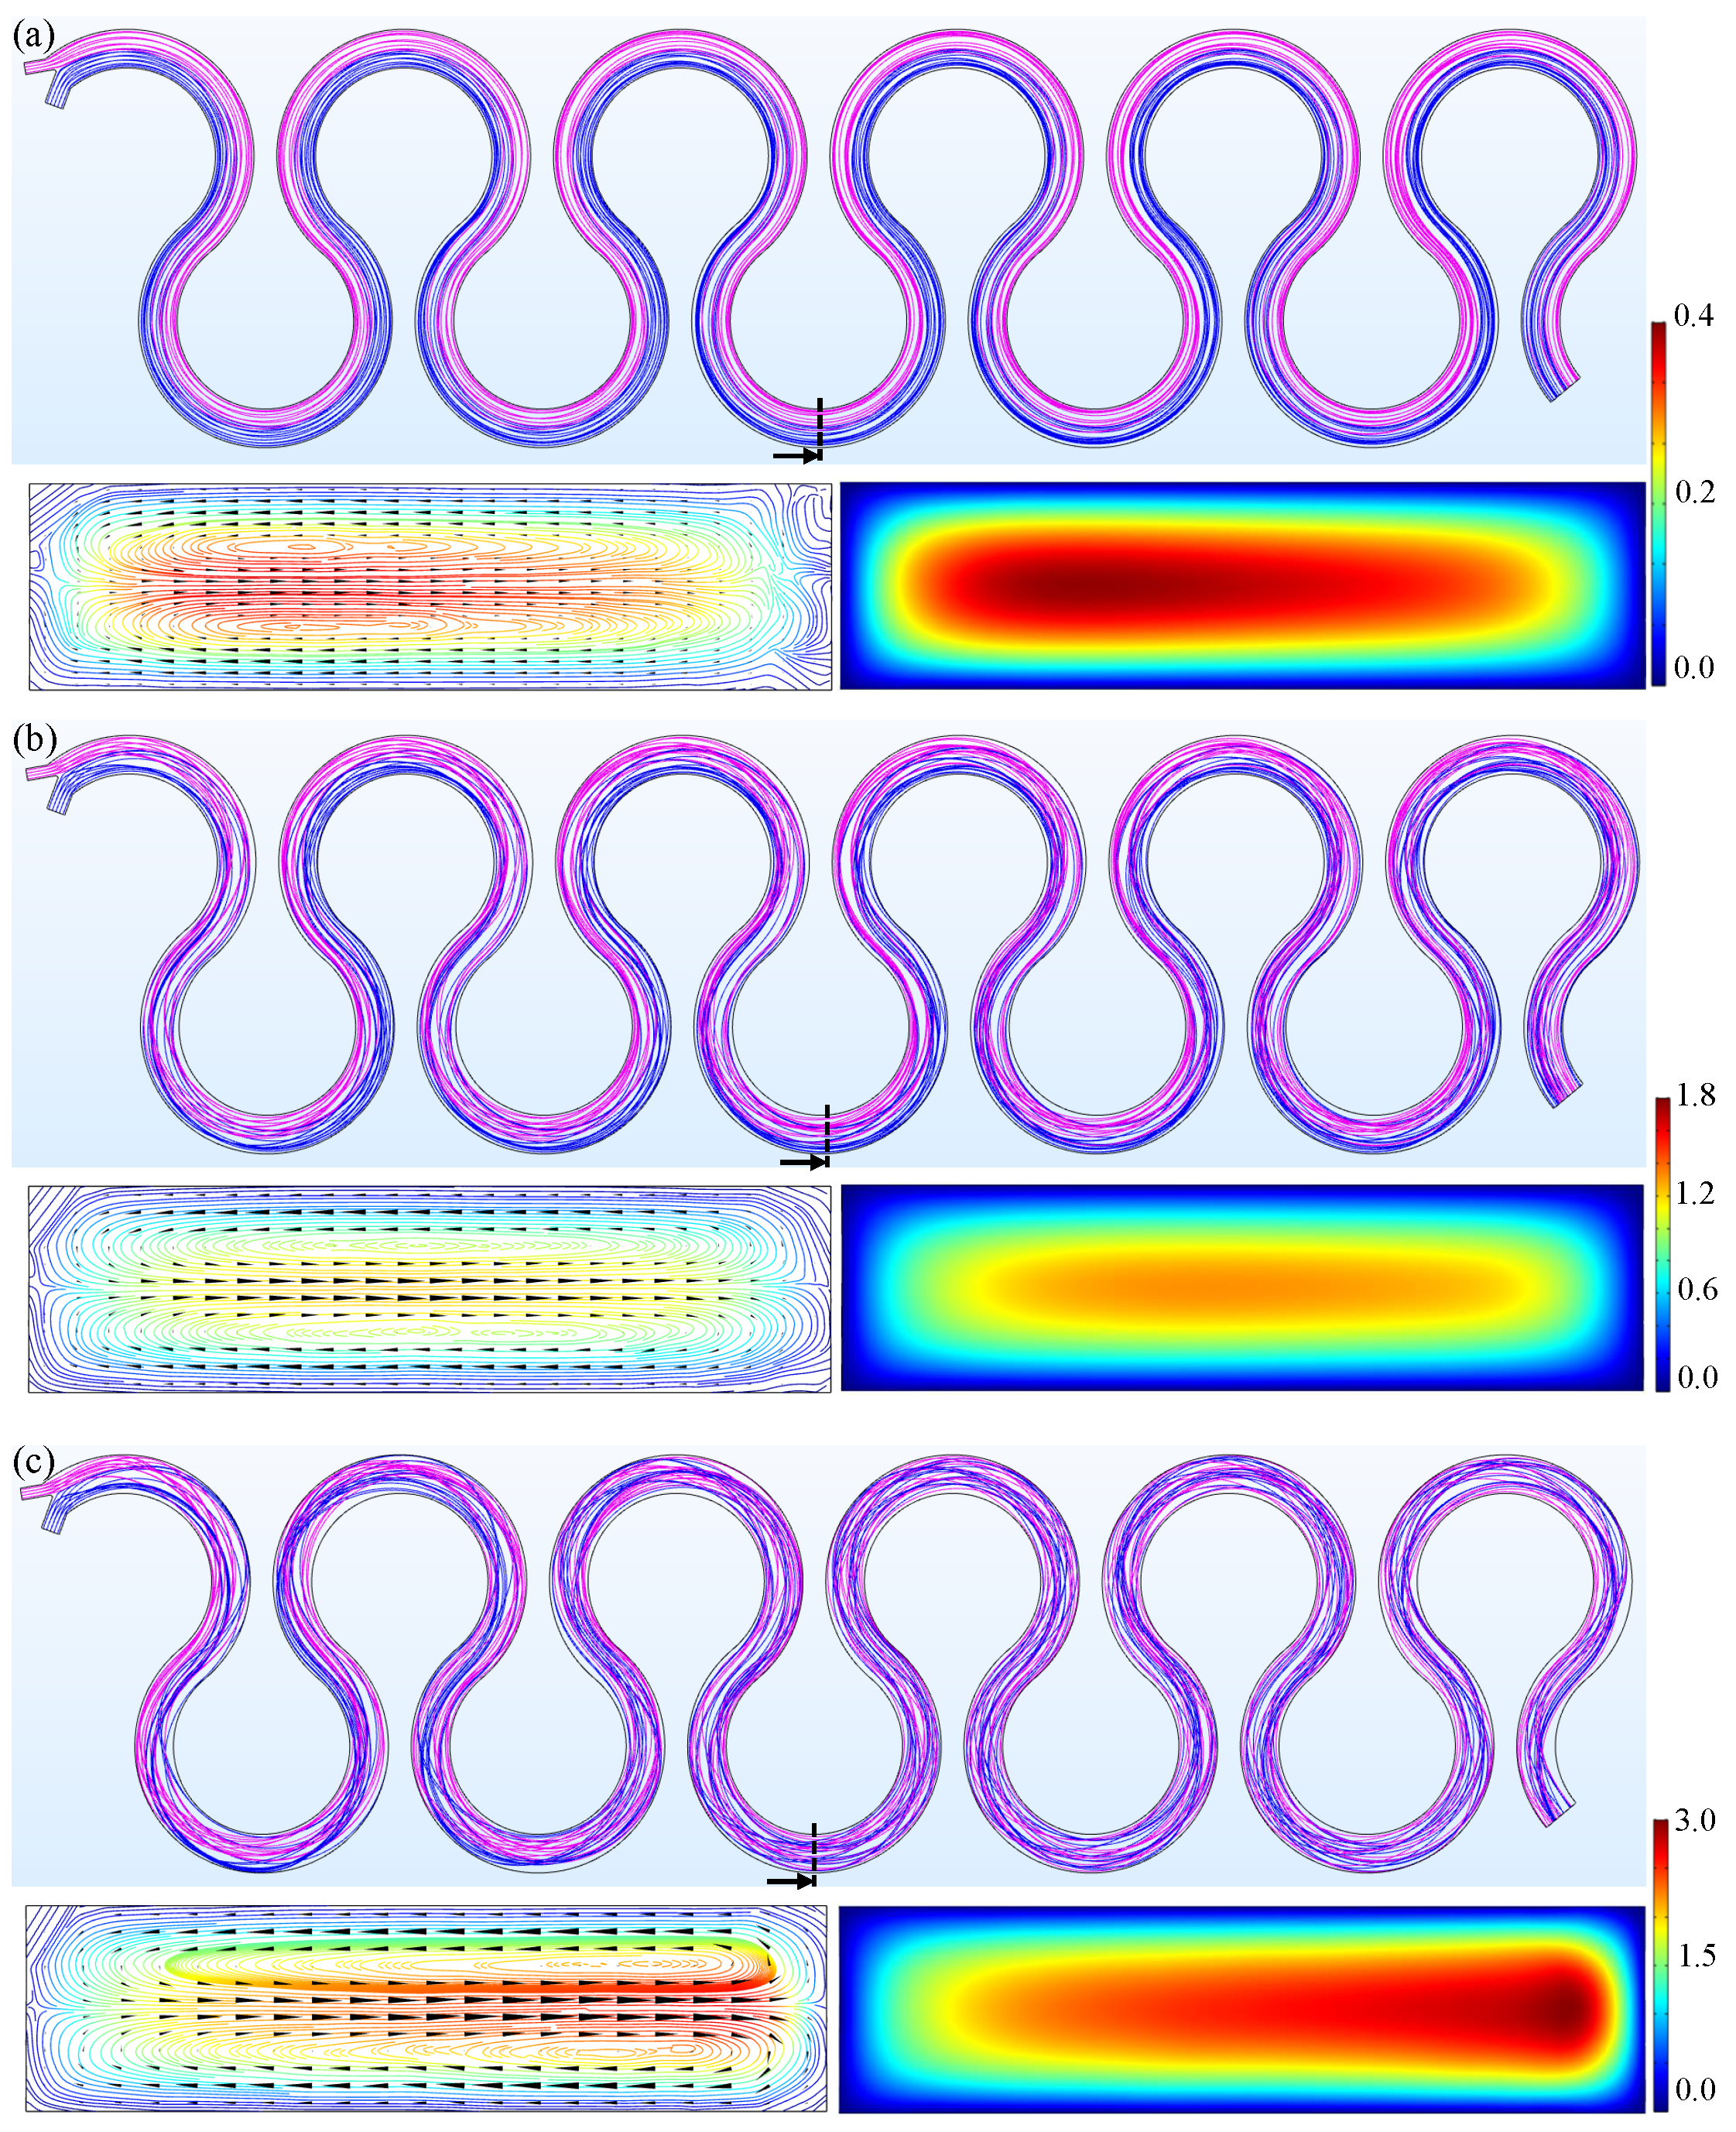
The simulation results are presented with streamlines of water and diluted Rhodamine B streams, perpendicular streamlines, Dean arrows and velocity profiles at the cross-section of the fifth segment. They are used to provide further qualitative discussion about the mixing performance of the micromixers. Figure 7, Figure 8 and Figure 9 show the simulation results for micromixers M180, M230 and M280, respectively.
For micromixers M180 and M230 at D e = 12, according to Figure 7a and Figure 8a, the interface of streamlines of water and diluted Rhodamine B remains almost intact all along the micromixer. In other words, the streams slightly penetrate into each other only at their interface, that is, both streams follow the laminar flow path near their distinctive walls of the micromixers. In this case, mixing is diffusion-dominant and M is very low in lack of convective mixing [35]. Under this flow condition, although two counter-rotating vortices form, Dean vortices are not able to fold the streamlines into each other. All of these results in poor mixing, which leads to low mixing indices in the corresponding experimental results, 0.19 ± 0.04 and 0.35 ± 0.07 for M180 and M230, respectively. On the contrary, the micromixer M280 shows a different flow behavior under the same flow condition. Comparing flow streamlines in the micromixer M280, Figure 9a, with those in the micromixers M180 and M230, Figure 7a and Figure 8a, it is evident that a higher folds the streams into each other to a greater extent along the micromixer. Moreover, the interface between the two streams is more distorted, which is also supported by the experimental value of M = 0.66 ± 0.02 at the outlet.
Figure 7b represents the simulation results for the micromixer M180 at D e = 55. Compared to D e = 12, the streamlines of water and diluted Rhodamine B are intermixed into each other along the microchannel due to the stronger transverse motion of the fluids in curved microchannels by Dean vortices. This happens because the Dean flow is stronger at D e = 55 and the transverse fluid motion has a higher velocity. As a result, the streams tend to detach from their distinctive sides of the micromixer, which results in a better mixing compared to D e = 12. For this flow condition, the corresponding experimental value of outlet M is 0.70 ± 0.07. The flow behavior of the micromixer M230 at D e = 49 is displayed in Figure 8b. Similar to M180, with an increase in Dean number, the interface of the two streams is severely distorted and consequently, water and diluted Rhodamine B no longer stay at their distinctive sides of the micromixer. Rather, they move in the transverse direction to a larger extent (compared to D e = 12) and are mixed into each other. This flow behavior leads to an experimental outlet M value of 0.68 ± 0.00.
Flow pattern in the micromixer M280 at D e = 41 is shown in Figure 9b. According to the experimental results, at this Dean number the micromixer M280 starts to reach its maximum mixing performance. Severe deformation of flow streamlines and intermixing of the two streams are observed in simulation results. Under this flow condition, the interface between the water and diluted Rhodamine B stream is no longer distinguishable and they are substantially folded into each other. The corresponding experimental outlet M for this case is 0.82 ± 0.06, which is considered as a high degree of mixing.
In accordance with the experimental data, the flow behavior of all three micromixers at D e = 87 has almost no significant difference. Considering Figure 7c, Figure 8c and Figure 9c, the streamlines of water and diluted Rhodamine B completely twist into each other and no interface between them can be observed. Due to the strong Dean vortices, the velocity maxima occur at the closest distance to the outer wall of the represented segment. At this Dean number, all the three micromixers reach their maximum mixing performance and the experimental outlet M is stabilized at 0.93 ± 0.01, 0.92 ± 0.01, and 0.91 ± 0.02 for the micromixers M180, M230 and M280, respectively (Figure 4).

4. Conclusions

In this study, inertial micromixing of two fluids was studied in three curved serpentine micromixers with curve angles of 180 ° , 230 ° and 280 ° (M180, M230 and M280, respectively) over Dean numbers between 12 and 87 (corresponding to Reynolds numbers ranging from 30 to 227). Under these flow conditions, since P e 1, the mixing phenomenon was advective-dominant. The involved mechanisms in intermixing included Dean vortices and chaotic advection. According to the experimental results, up to D e = 35, Dean vortices were too weak to contribute to mixing in micromixers M180 and M230 and almost no mixing was possible below this D e , which was also indicated with mixing index values less than 0.40. On the contrary, due to larger curve angle and longer segment path, M280 exposed the fluids to Dean vortices to a larger extent and the interface of the two fluids highly deformed in this micromixer, which led to a larger contact area between the fluids and consequently, larger mixing index. Moreover, the onset of chaotic advection, which was marked with an abrupt increase in outlet mixing index, took place at a lower D e in M280 compared to the other two micromixers. It occurred at D e = 41, D e = 49 and D e = 55 for the micromixers M280, M230 and M180, respectively. As a result, as the curve angle increased, the ultimate performance of the micromixers was achieved at lower Dean numbers. The ultimate mixing indices at the outlet of the three micromixers were 0.93 ± 0.01, 0.92 ± 0.01 and 0.91 ± 0.02, respectively. Importantly, this maximum outlet M was obtained at D e = 49, D e = 64 and D e = 73, for the micromixers M280, M230 and M180, respectively. Overall, the micromixer M280 was superior to the two other micromixers, as it provided effective mixing at lower flow rates. Nevertheless, perfect mixing does not occur at a relatively low D e , which might be the case in some specific biological applications. Thus, a possible next step of the current study would be further enhancing the mixing performance of the micromixer M280 by introducing baffles at the inner and/or outer side walls or obstacles in the flow path, which could lead to perfect mixing at much lower D e numbers by further disturbing the laminar streamlines. In addition, the effect of other parameters such as inner and outer radii and microchannel hydraulic diameter and aspect ratio on micromixing could be investigated.

Supplementary Materials

The following are available online at https://www.mdpi.com/2311-5521/4/4/204/s1, Video S1: fluorescence intensity maps of the micromixer M180, Video S2: fluorescence intensity maps of the micromixer M230, Video S3: fluorescence intensity maps of the micromixer M280.

Author Contributions

A.Ö. conceived the study. H.A. fabricated micromixers, designed and performed the experiments, and analyzed the results. A.Ö. and M.K. wrote the Theory section. H.A. drafted the main manuscript. H.A. and A.K. edited the manuscript. A.K. supervised the study. All authors reviewed and approved the final manuscript.

Funding

This research received no external funding.

Acknowledgments

The authors would like to thank Batu Erman and Hakan Taşkıran from Molecular Biology program in Sabanci University for instructing the use of the fluorescent microscope. The authors are also grateful to Javed Kolkar from Sabanci University Nanotechnology Research and Application Center (SUNUM) for providing Rhodamine B. The fabrication of the micromixers were performed in Micro & Nanofabrication Laboratory & Cleanroom at SUNUM. Graduate financial support was provided by Faculty of Engineering and Natural Sciences of Sabanci University. The authors also thank Daniel L. Calvey from Sabanci University for his kind help in editing the manuscript.

Conflicts of Interest

The authors declare no conflict of interest.

References

  1. Capretto, L.; Cheng, W.; Hill, M.; Zhang, X. Micromixing within microfluidic devices. Top. Curr. Chem. 2011, 304, 27–68. [Google Scholar] [PubMed]
  2. Lee, C.Y.; Fu, L.M. Recent advances and applications of micromixers. Sens. Actuators B Chem. 2018, 259, 677–702. [Google Scholar] [CrossRef]
  3. Ibarlucea, B.; Munoz-Berbel, X.; Ortiz, P.; Büttgenbach, S.; Fernández-Sánchez, C.; Llobera, A. Self-validating lab-on-a-chip for monitoring enzyme-catalyzed biological reactions. Sens. Actuators B Chem. 2016, 237, 16–23. [Google Scholar] [CrossRef]
  4. Thiele, M.; Knauer, A.; Malsch, D.; Csáki, A.; Henkel, T.; Köhler, J.M.; Fritzsche, W. Combination of microfluidic high-throughput production and parameter screening for efficient shaping of gold nanocubes using Dean-flow mixing. Lab Chip 2017, 17, 1487–1495. [Google Scholar] [CrossRef] [PubMed]
  5. Chen, Y.T.; Chen, K.H.; Fang, W.F.; Tsai, S.H.; Fang, J.M.; Yang, J.T. Flash synthesis of carbohydrate derivatives in chaotic microreactors. Chem. Eng. J. 2011, 174, 421–424. [Google Scholar] [CrossRef]
  6. Ryu, M.; Kimber, J.; Sato, T.; Nakatani, R.; Hayakawa, T.; Romano, M.; Pradere, C.; Hovhannisyan, A.; Kazarian, S.; Morikawa, J. Infrared thermo-spectroscopic imaging of styrene radical polymerization in microfluidics. Chem. Eng. J. 2017, 324, 259–265. [Google Scholar] [CrossRef]
  7. Peng, G.; He, Q.; Lu, Y.; Huang, J.; Lin, J.M. Flow injection microfluidic device with on-line fluorescent derivatization for the determination of Cr (III) and Cr (VI) in water samples after solid phase extraction. Anal. Chim. Acta 2017, 955, 58–66. [Google Scholar] [CrossRef]
  8. Kastania, A.S.; Tsougeni, K.; Papadakis, G.; Gizeli, E.; Kokkoris, G.; Tserepi, A.; Gogolides, E. Plasma micro-nanotextured polymeric micromixer for DNA purification with high efficiency and dynamic range. Anal. Chim. Acta 2016, 942, 58–67. [Google Scholar] [CrossRef]
  9. Lee, T.Y.; Hyun, K.A.; Kim, S.I.; Jung, H.I. An integrated microfluidic chip for one-step isolation of circulating tumor cells. Sens. Actuators B Chem. 2017, 238, 1144–1150. [Google Scholar] [CrossRef]
  10. Giuffrida, M.C.; Zanoli, L.M.; D’Agata, R.; Finotti, A.; Gambari, R.; Spoto, G. Isothermal circular-strand-displacement polymerization of DNA and microRNA in digital microfluidic devices. Anal. Bioanal. Chem. 2015, 407, 1533–1543. [Google Scholar] [CrossRef]
  11. Larrea, A.; Clemente, A.; Luque-Michel, E.; Sebastian, V. Efficient production of hybrid bio-nanomaterials by continuous microchannel emulsification: Dye-doped SiO2 and Au-PLGA nanoparticles. Chem. Eng. J. 2017, 316, 663–672. [Google Scholar] [CrossRef] [Green Version]
  12. Lee, C.Y.; Chang, C.L.; Wang, Y.N.; Fu, L.M. Microfluidic mixing: A review. Int. J. Mol. Sci. 2011, 12, 3263–3287. [Google Scholar] [CrossRef] [PubMed] [Green Version]
  13. Cai, G.; Xue, L.; Zhang, H.; Lin, J. A review on micromixers. Micromachines 2017, 8, 274. [Google Scholar] [CrossRef] [PubMed]
  14. Hejazian, M.; Nguyen, N.T. A rapid magnetofluidic micromixer using diluted ferrofluid. Micromachines 2017, 8, 37. [Google Scholar] [CrossRef] [Green Version]
  15. Luong, T.D.; Phan, V.N.; Nguyen, N.T. High-throughput micromixers based on acoustic streaming induced by surface acoustic wave. Microfluid. Nanofluid. 2011, 10, 619–625. [Google Scholar] [CrossRef] [Green Version]
  16. Wu, Y.; Ren, Y.; Tao, Y.; Hou, L.; Hu, Q.; Jiang, H. A novel micromixer based on the alternating current-flow field effect transistor. Lab Chip 2017, 17, 186–197. [Google Scholar] [CrossRef]
  17. Kunti, G.; Bhattacharya, A.; Chakraborty, S. Rapid mixing with high-throughput in a semi-active semi-passive micromixer. Electrophoresis 2017, 38, 1310–1317. [Google Scholar] [CrossRef]
  18. Ward, K.; Fan, Z.H. Mixing in microfluidic devices and enhancement methods. J. Micromech. Microeng. 2015, 25, 094001. [Google Scholar] [CrossRef]
  19. Cook, K.J.; Fan, Y.; Hassan, I. Mixing evaluation of a passive scaled-up serpentine micromixer with slanted grooves. J. Fluid. Eng. 2013, 135, 081102. [Google Scholar] [CrossRef]
  20. Nguyen, N.T.; Wu, Z. Micromixers—A review. J. Micromech. Microeng. 2004, 15, R1. [Google Scholar] [CrossRef]
  21. Sudarsan, A.P.; Ugaz, V.M. Fluid mixing in planar spiral microchannels. Lab Chip 2006, 6, 74–82. [Google Scholar] [CrossRef] [PubMed]
  22. Jiang, F.; Drese, K.S.; Hardt, S.; Küpper, M.; Schönfeld, F. Helical flows and chaotic mixing in curved micro channels. AIChE J. 2004, 50, 2297–2305. [Google Scholar] [CrossRef]
  23. Chen, J.J.; Chen, C.H.; Shie, S.R. Optimal designs of staggered Dean vortex micromixers. Int. J. Mol. Sci. 2011, 12, 3500–3524. [Google Scholar] [CrossRef] [PubMed]
  24. Wu, C.Y.; Tsai, R.T. Fluid mixing via multidirectional vortices in converging–diverging meandering microchannels with semi-elliptical side walls. Chem. Eng. J. 2013, 217, 320–328. [Google Scholar] [CrossRef]
  25. Alam, A.; Afzal, A.; Kim, K.Y. Mixing performance of a planar micromixer with circular obstructions in a curved microchannel. Chem. Eng. Res. Des. 2014, 92, 423–434. [Google Scholar] [CrossRef]
  26. Akgönül, S.; Özbey, A.; Karimzadehkhouei, M.; Gozuacik, D.; Koşar, A. The effect of asymmetry on micromixing in curvilinear microchannels. Microfluid. Nanofluid. 2017, 21, 118. [Google Scholar] [CrossRef] [Green Version]
  27. Clark, J.; Kaufman, M.; Fodor, P.S. Mixing Enhancement in Serpentine Micromixers with a Non-Rectangular Cross-Section. Micromachines 2018, 9, 107. [Google Scholar] [CrossRef] [Green Version]
  28. Geschke, O.; Klank, H.; Telleman, P. Microsystem Engineering of Lab-on-a-Chip Devices; John Wiley & Sons: Hoboken, NJ, USA, 2004. [Google Scholar]
  29. Hessel, V.; Löwe, H.; Schönfeld, F. Micromixers—A review on passive and active mixing principles. Chem. Eng. Sci. 2005, 60, 2479–2501. [Google Scholar] [CrossRef]
  30. Marques, M.P.; Fernandes, P. Microfluidic devices: Useful tools for bioprocess intensification. Molecules 2011, 16, 8368–8401. [Google Scholar] [CrossRef]
  31. Rani, S.A.; Pitts, B.; Stewart, P.S. Rapid diffusion of fluorescent tracers into Staphylococcus epidermidis biofilms visualized by time lapse microscopy. Antimicrob. Agents Chemother. 2005, 49, 728–732. [Google Scholar] [CrossRef] [Green Version]
  32. Dean, W.; Hurst, J. Note on the motion of fluid in a curved pipe. Mathematika 1959, 6, 77–85. [Google Scholar] [CrossRef]
  33. Kockmann, N.; Kiefer, T.; Engler, M.; Woias, P. Convective mixing and chemical reactions in microchannels with high flow rates. Sens. Actuators B Chem. 2006, 117, 495–508. [Google Scholar] [CrossRef]
  34. Fan, L.L.; Zhu, X.L.; Zhao, H.; Zhe, J.; Zhao, L. Rapid microfluidic mixer utilizing sharp corner structures. Microfluid. Nanofluid. 2017, 21, 36. [Google Scholar] [CrossRef]
  35. Khaydarov, V.; Borovinskaya, E.; Reschetilowski, W. Numerical and Experimental Investigations of a Micromixer with Chicane Mixing Geometry. Appl. Sci. 2018, 8, 2458. [Google Scholar] [CrossRef] [Green Version]
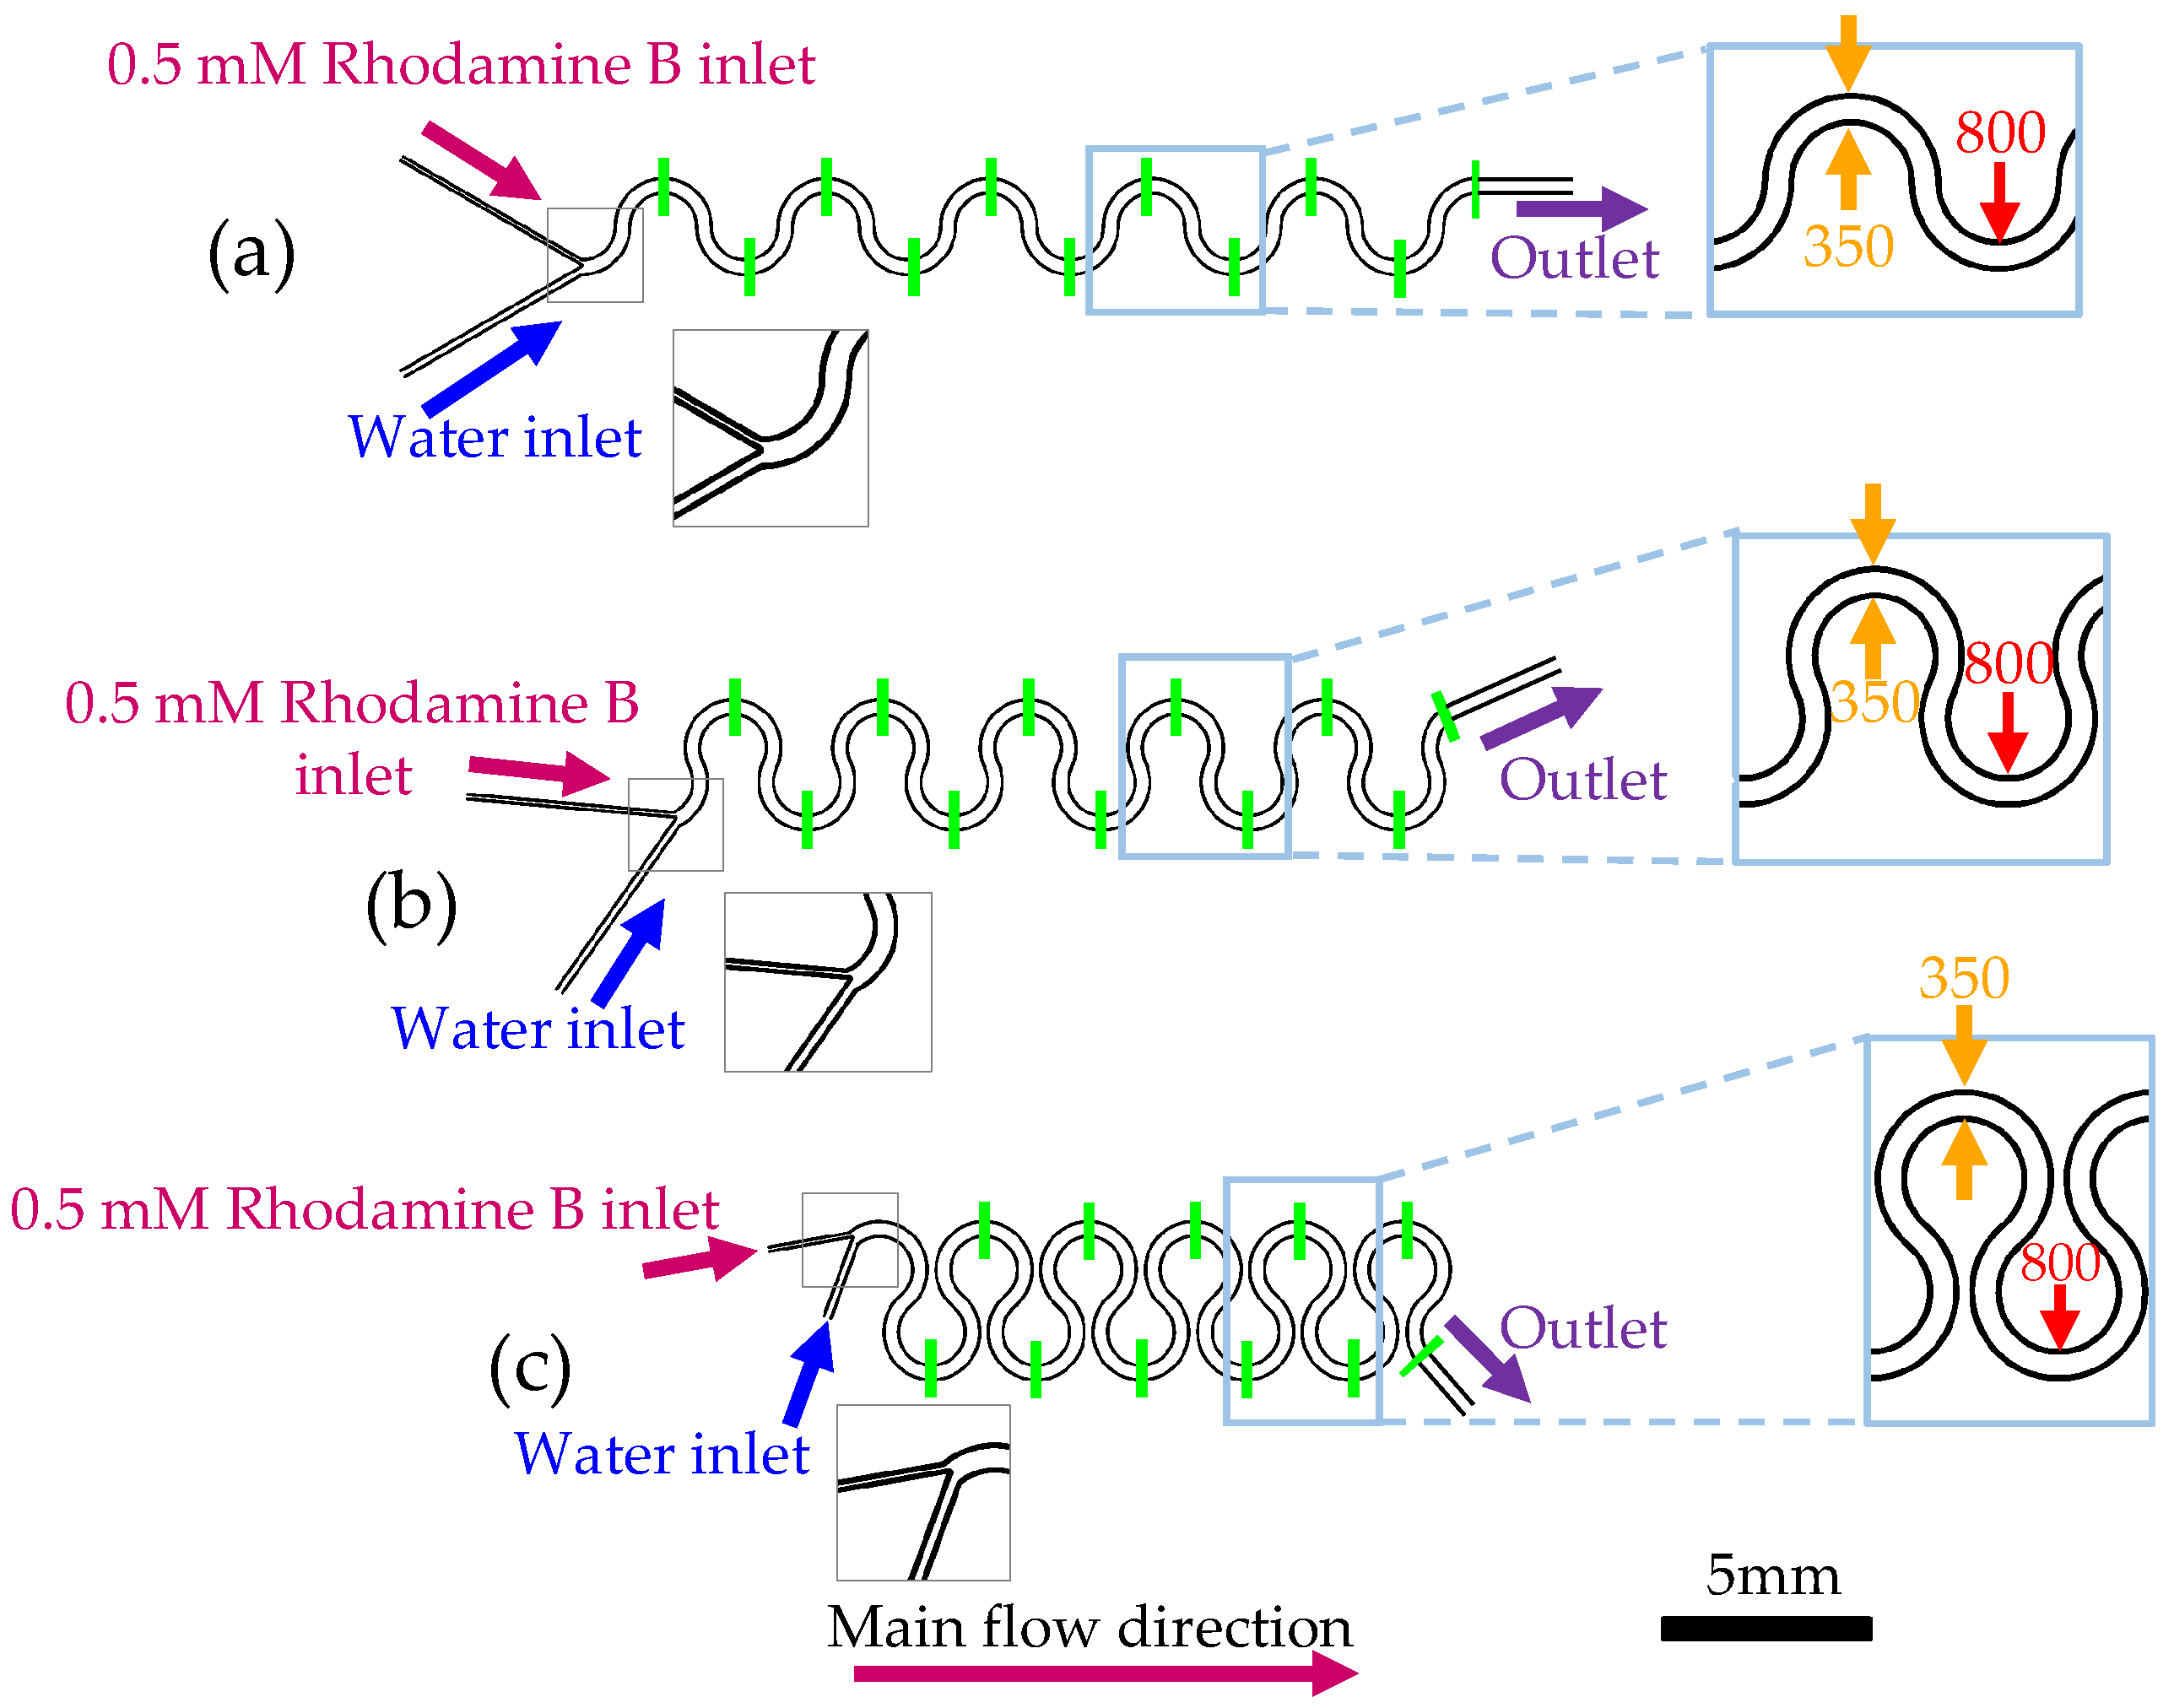
Figure 1. The schematic drawing of micromixer (a) M180, (b) M230 and (c) M280. Zoom-in views show the channels width (in orange) and inner radius of curvature (in red). Green lines indicate the locations, at which mixing index is evaluated. Dimensions are in μ m.
Fluids 04 00204 g001
Figure 2. Variation of M with D e along the micromixers (a) M180, (b) M230 and (c) M280. Error bars represent the standard deviation of three sets of experiments.
Fluids 04 00204 g002
Figure 3. The fluorescence intensity maps of micromixer M180 at (a) D e = 12, (b) D e = 38, (c) D e = 55, (d) D e = 73 and (e) D e = 87. White dashed lines indicate channel walls.
Fluids 04 00204 g003
Figure 4. Experimental values of outlet M against R e and D e for micromixers (a) M180, (b) M230 and (c) M280. Error bars represent the standard deviation of three sets of experiments. The fluorescence intensity maps correspond to the outlet of the micromixers at indicated data points.
Fluids 04 00204 g004
Figure 5. The fluorescence intensity maps of micromixer M230 at (a) D e = 12, (b) D e = 38, (c) D e = 49, (d) D e = 64 and (e) D e = 87. White dashed lines indicate channel walls.
Fluids 04 00204 g005
Figure 6. The fluorescence intensity maps of micromixer M280 at (a) D e = 12, (b) D e = 38, (c) D e = 41, (d) D e = 49 and (e) D e = 87. White dashed lines indicate channel walls.
Fluids 04 00204 g006
Figure 7. Fluid flow simulation results of micromixer M180 at (a) D e = 12, (b) D e = 55 and (c) D e = 87. Streamlines of water and diluted Rhodamine B are in blue and magenta, respectively. Cross-sectional velocity profile and vectors correspond to the peak of the fifth segment, which is marked by a black arrow. Dean flow vectors are directed towards the outer wall. Color legend indicates velocity magnitude in m/s.
Fluids 04 00204 g007
Figure 8. Fluid flow simulation results of micromixer M230 at (a) D e = 12, (b) D e = 49 and (c) D e = 87. Streamlines of water and diluted Rhodamine B are in blue and magenta, respectively. Cross-sectional velocity profile and vectors correspond to the peak of the fifth segment, which is marked by a black arrow. Dean flow vectors are directed towards the outer wall of the fifth peak. Color legend indicates velocity magnitude in m/s.
Fluids 04 00204 g008
Figure 9. Fluid flow simulation results of micromixer M280 at (a) D e = 12, (b) D e = 41 and (c) D e = 87. Streamlines of water and diluted Rhodamine B are in blue and magenta, respectively. Cross-sectional velocity profile and vectors correspond to the peak of the fifth segment, which is marked by a black arrow. Dean flow vectors are directed towards the outer wall of the fifth peak. Color legend indicates velocity magnitude in m/s.
Fluids 04 00204 g009
Table 1. Simulation parameters and relevant results.
Mesh SizeNo. of ElementsAverage Element QualityDiscretization of FluidsDegree of FreedomCalculated U at the Fifth Segment (m/s)Relative Error
M180Fine1442290.648P2 + P17202720.191959.31%
P2 + P29156320.191949.31%
P3 + P224198380.197766.56%
Finer4500120.678P2 + P121127010.197406.73%
P2 + P226918800.197406.73%
P3 + P272356200.201314.88%
M230Fine1273680.663P2 + P16554390.1875911.37%
P2 + P28323120.1875911.37%
P3 + P221820420.195047.84%
Finer4869130.673P2 + P122821800.195507.63%
P2 + P229079000.195507.63%
P3 + P278191970.200015.50%
M280Fine2139930.661P2 + P110620640.190669.91%
P2 + P213499600.190649.92%
P3 + P235705360.196996.92%
Finer6387230.693P2 + P129948550.196147.33%
P2 + P238152080.196147.33%
P3 + P2102531510.200405.31%
Table 2. Summarized performance of the micromixers under different flow conditions.
Inlet Velocity [m/s] Outlet M
P e R e D e M180M230M28
0.218.4E + 0430120.19 ± 0.040.35 ± 0.080.66 ± 0.02
0.321.3E + 0545170.26 ± 0.090.38 ± 0.040.71 ± 0.05
0.481.9E + 0568260.36 ± 0.010.40 ± 0.030.79 ± 0.02
0.632.5E + 0591350.42 ± 0.080.36 ± 0.040.80 ± 0.02
0.793.2E + 05114440.63 ± 0.050.59 ± 0.070.87 ± 0.06
0.953.8E + 05136520.66 ± 0.060.74 ± 0.030.94 ± 0.02
1.114.4E + 05159610.80 ± 0.060.90 ± 0.010.94 ± 0.02
1.275.1E + 05182700.89 ± 0.040.93 ± 0.020.93 ± 0.01
1.435.7E + 05205780.92 ± 0.020.93 ± 0.020.92 ± 0.01
1.596.3E + 05227870.90 ± 0.020.92 ± 0.010.92 ± 0.01