Abstract
Production from gas condensate reservoir poses the major challenge of condensate banking or blockage. This occurs near the wellbore, around which a decline in pressure is initially observed. A good sign of condensate banking is a rise in the gas–oil ratio (GOR) during production and/or a decline in the condensate yield of the well, which leads to considerable reductions in well deliverability and well rate for gas condensate reservoirs. Therefore, determining the well deliverability of a gas condensate reservoir and methods to optimize productivity is paramount in the industry. This research study aims to investigate fluid phase change behaviour in a gas condensate reservoir during depletion, to understand the problems encountered in well deliverability during production and to evaluate optimization techniques that could enhance deliverability. This requires a review of different techniques and methods used in the analysis of gas condensate reservoirs and of condensate saturation build-up in the system as a function of time to determine the occurrence of condensate in the vicinity of wellbore and a sensitivity analysis of the different parameters and how they affect well deliverability. A commercial compositional simulator (E300) was used to study gas condensate fluid flow using synthetic data to simulate a gas condensate reservoir by studying the compositional changes (i.e., C1, C2, C3, C4-C6...) in hydrocarbon content over time and/or distance from the wellbore by determining the timing of condensate banking as well as its distance from a well, and the results were used in turn as guidance to optimize condensate production. Typical scenarios such as those involving water injection and gas recycling were adopted in studying condensate banking. The result shows a considerable change in the composition of the fluid components with respect to fluid phase changes as the pressure declines during depletion. The earlier the pressure decline occurs, the quicker the change in phase and the closer to the wellbore the transition takes place, which leads to significant condensate loss. Simulation results show that water injection with the minimum pressure decline produces a higher condensate recovery factor of 93%, while gas recycling suffered from early phase change and a condensate recovery factor of only 66% was achieved. Altering the gas production rate in the gas recycling case reduced the phase change near to the wellbore and produced a better recovery factor of up to 82%. The findings of this study help to provide a better understanding of the hydrocarbon phase change near wellbores in gas condensate reservoirs from the gas phase to condensate. The suggested approach to tracking the timing and location of condensate formation can also assist the production engineers in managing condensate production and selecting appropriate optimization techniques to improve condensate recovery.
1. Introduction
A gas condensate reservoir is a type of reservoir whose phase and fluid flow exhibit complex behaviour due to the formation of hydrocarbon liquid which condenses out of the system when the bottom hole pressure drops below the dew point pressure. The accumulation of condensate around the wellbore results in condensate blockage, causing a reduction in effective permeability in the reservoir. Condensate loss is a major issue in production from gas condensate reservoirs and is of the utmost concern since large volumes of fluid become residual and unrecoverable [1].
Numerous studies have been carried out on gas condensate reservoirs and their deliverability and on optimization methods which can improve recovery from this type of reservoir [1,2,3,4,5,6,7,8,9,10,11,12]. The first study to refer to this phenomenon as condensate banking was conducted by Muskat [13], who found that liquid condensates concentrate in the wellbore vicinity as the pressure declines below the dew point pressure. O’Dell (1967) [14] presented a basic method for the investigation of steady state flow concepts that could be used in estimating the productivity from a well and the effect of production rate based on the steady state concept. This study found that the prediction of the production rate is critical if the average reservoir pressure is below the saturation pressure of the in-situ fluid. Roebuck et al. (1968) [15] developed the first models that accounted for component mass transfer between phases in accordance with phase equilibria data and for an individual component flow. Furthermore, Fussell (1973) [16] questioned the O’Dell [14] equation and used a pseudo-pressure function to describe the condensate blockage effect. Based on a modified version of the model developed by Roebuck et al. [15], it was found that the level of productivity in a gas condensate reservoir is higher than that derived from the proposed theory using the O’Dell [14] equation based on the steady state flow concept. It was shown that the effect of condensate accumulation on well productivity, with a small correction to account for gas dissolved in the flowing oil phase, dramatically overpredicts the deliverability loss due to condensate blockage, as compared with the results provided by the method used and simulation output. Also evaluated in this study was the effect of phase behaviour and relative permeability characteristics on production performance. It was concluded that the effect of condensate blockage depends on (1) the relative permeabilities, (2) pressure volume temperature (PVT) properties, and (3) how the well is being produced in terms of constant rate vs. constant bottom hole flowing pressure (BHFP).
Bourbiaux et al. 1994 [17] and Kalaydjian et al. 1996 [18] performed experimental studies of critical condensate saturation (Scc) and relative permeabilities (kr) in gas condensate fluid systems in order to measure local condensate saturation and condensate drop-out. Two procedures were used to determine the critical condensate saturation: The injection of equilibrium and two-phase or steady state injection. Innovative characteristics on the visual onstream control of fluid PVT behaviour and local condensate saturation measurements using gamma-ray attenuation techniques with specified calibration were used in their studies. It was found that the experimental methods enable a reliable determination of IFT Indexed of kr curves required to predict the productivity of a gas condensate field subjected to pressure depletion.
Fevang (1995) [19] suggested that a decline in well deliverability due to condensate banking depends mainly on relative permeability within a narrow and well-defined range between 1 to 50 md. In addition, no direct effect of critical saturation on well deliverability was found and the influence of gas–oil interfacial tension on relative permeability was insignificant in terms of the performance of a gas condensate well.
Fevang and Whitson (1996) [1] and Penuela and Civan (2000) [20] addressed the physics of condensate banking and developed a three-flow region theory. In the outer region 3, the pressure is above the dew-point pressure and only gas exists. In region 2, condensate saturation is below the critical level; only gas flows in this region while the condensate is immobile. Finally, in the inner region 1, the pressure decreases further, condensate saturation exceeds the critical level, and both condensate and gas flow.
A numerical study was performed by Roussennac (2001) [21] to demonstrate the compositional changes in hydrocarbon fluid during production. It was found that the fluid located near the wellbore could change from a retrograde gas into a volatile oil during early production. This occurs in the vicinity of the wellbore because it contains a heavier component which initiates a change in behaviour of the overall fluid from its initial behaviour. Wheaton and Zhang (2000) [22] suggested that gas-condensate rich reservoirs experience a higher rate of change in heavy component composition compared to that in a lean gas-condensate reservoir.
Ayala and Ertekin 2005 [23] used a neuro simulation to study the gas recycling performance of a gas condensate reservoir, which helped in solving production-related optimization challenges. Their parametric study identified the most influential parameters and fluid characteristics in enhancing an optimum production approach in the application of pressure maintenance in gas and condensate reservoirs. They showed that pressure maintenance could be justified economically when the reservoir pressure is above the dew point pressure or if there is any re-vaporization of condensate.
Work performed by Shi et al. (2006) [7] and Shi (2009) [9] showed that a combination of condensate phase behaviour and the relative permeability of the rock strata results in a compositional change in the reservoir fluid as heavier components separate into the reduced liquid, while the flowing gas phase becomes leaner in composition. This was quantified by developing a scientific understanding of the phenomenon and the results derived were used to investigate ways to enhance the production of gas and condensate by controlling the liquid composition that drops out from the gas in the vicinity of the wellbore. Recent research by Bilal et al. (2017) [24] and Min et al. (2018) [25] has demonstrated that the miscibility and vaporization of condensate by injected gas is a more efficient mechanism for condensate recovery. They found that the application of gas recycling in a five-spot well pattern greatly enhances condensate recovery, helping to prevent financial, economic and resources losses.
Recently, an experimental investigation on CO2 injection process at different periods during gas-condensate reservoir development was carried out by Su et al. 2017 [26]. A series of water/CO2 flooding experiments was conducted with a numerical core flooding model built in a generalized equation of state model reservoir simulator (GEM). They concluded that CO2 treatment can improve gas productivity as compared to water flooding mode. They concluded that CO2 treatment can improve gas productivity as compared to water flooding.
A more complex method was proposed by Qiu et al. (2018 [27], 2019 [28]) to measure the vapor-liquid transition, in which a new isochoric procedure was developed using a differential scanning calorimeter (DSC) to measure the onset of vapor-liquid phase transitions. The procedure was successfully utilized in experiments measuring the vapor pressures of pure substances and the dew points of gas mixtures. The results showed that the phase transition boundaries of the fluids in nanopores are below those of the bulk fluids on the phase diagram, and that the boundaries of fluids in a smaller pore are below those in a larger pore.
Although various methods have been proposed for the performance evaluation of condensate reservoirs, knowledge of phase behaviour and optimization techniques for enhanced condensate recovery from gas-condensate reservoirs is still lacking. Another knowledge gap concerns the need to understand how hydrocarbon composition correlates with time and space characteristics and how changes in composition impact on gas production and condensate recovery [9]. Models developed by Wheaton and Zhang (2000) [22] focus on the description of condensate banking and they only demonstrate the behavior of heavy components from production wells over time as production progresses. Compositional change has been observed in the field, but studies of its effects have rarely been reported.
Therefore, in this work, we introduce a novel approach to investigate the performance of a gas condensate reservoir by tracking the phase change with respect to time and distance from the wellbore. Moreover, the proposed approach is applied to evaluate the efficiency of different condensate recovery techniques such as gas recycling and water flooding.
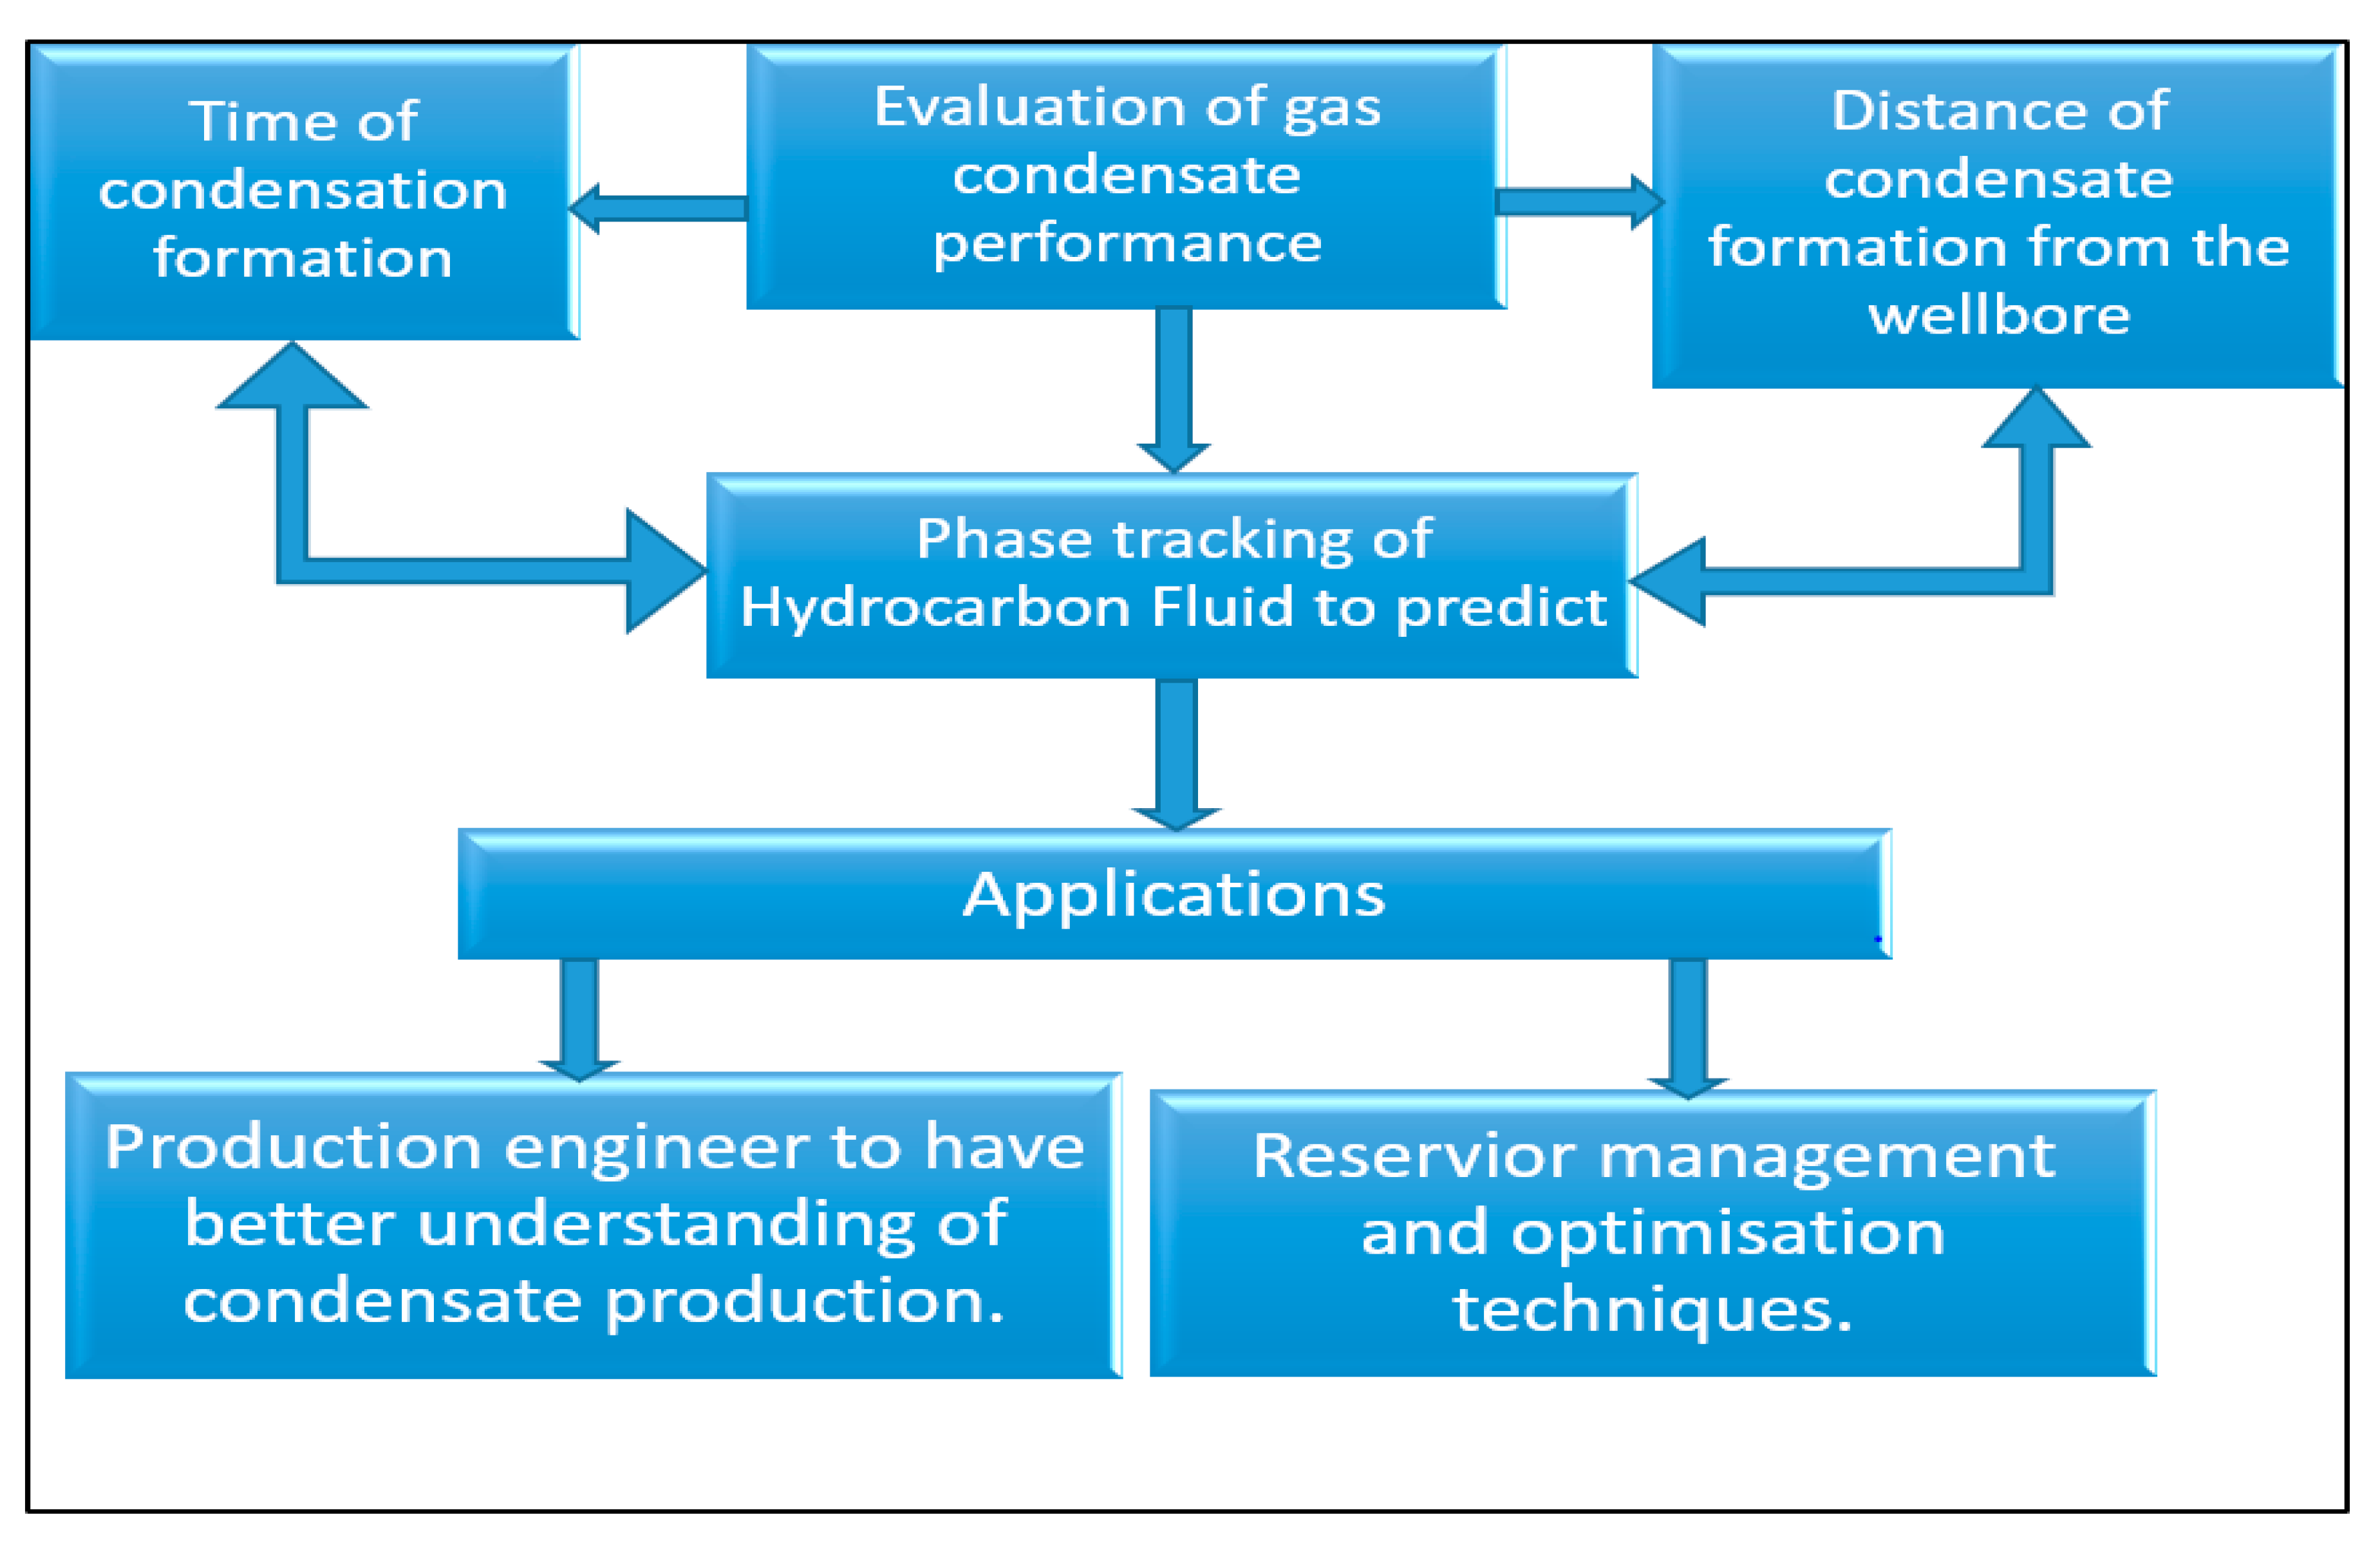
An obvious advantage of this study is its simplicity compared to others in the evaluation of the timing and location of condensate formation in the proximity of wellbores. Even though in the proposed approach the heterogeneity of the reservoir is ignored, this concept can still be used for reservoirs with different degrees of heterogeneity which can be captured in terms of changes in the timing of condensate formation and its distance from the wellbore. Figure 1 illustrates the procedure used in formulating the general problem and the application of the proposed approach to tackle it.
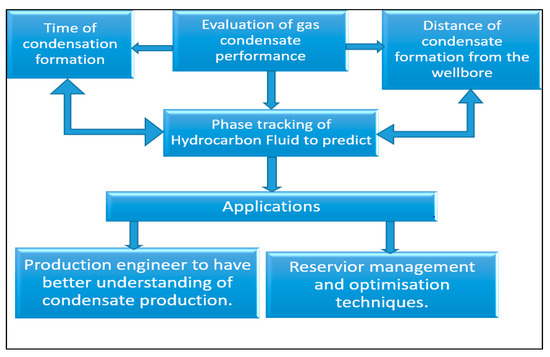
Figure 1.
Schematic illustration of the formulation of the general problem and application of the proposed approach to tackle it.
2. Model Description and Methodology
A commercial compositional simulator (E300) made by Schlumberger was used to build a 3D model. All input data for this study were derived from Kenyon 1987 [29]. The E300 simulator serves as a good tool in understanding the behaviour of the fluid flow in the reservoir and in predicting the liquid dropout based on reservoir operating conditions using the Peng Robinson (PR) equation of state (EOS) model. The PVT model is generated using a PVTi, which was used to develop the phase envelope of the reservoir fluids. This is achieved by initially defining the reservoir fluid and fluid components and their weight compositions. These are then used to generate a base case of natural depletion without an injection well for the study and run for a production period of 15 years. The following procedures are applied in achieving the aims of this study:
- Evaluate the fluid composition of C1 and C4-6 as a function of time for each optimization technique to determine the phase behaviour and changes of production components over time.
- Determine the condensate saturation build-up in the reservoir as a function of time for each grid block under different optimization techniques.
- Compare the composition of fluid components (C1 & C4-6) with the reservoir pressure to evaluate the effect of pressure upon the condensate formation.
The reservoir model’s specification and definition are shown in Table 1 and the composition of fluid components in Table 2.

Table 1.
Reservoir rock and Fluid properties adopted from Kenyon and Behie 1987 [29].
Table 2.
Fluid Components and their respective composition in moles, Kenyon and Behie 1987 [29].
2.1. Gas Condensate Reservoir Model Characterization
A symmetrical grid model made up of 9 × 9 × 4 grid cells, making a total of 324 grid cells, was utilized for the simulation in cartesian coordinates. There are four layers with a single production well located at the corner of the grid in a cell placed at (7, 7, 1) in the XYZ direction respectively. The layers perforated at the third and fourth layer have multiple components of gas condensate reservoir fluid. The reservoir has a homogenous layer with permeability and porosity being constant along different layers and having values of thickness of 50 ft, 50 ft, 30 ft, and 30 ft respectively. The reservoir model is initially at single gaseous phase with an initial pressure of 3550 psia and dew point pressure of 3428 psia. The condensates are immobile until a saturation of 20% is achieved and the value of Krg reduced from 0.74 to 0.078 with the irreducible water saturation at 1%.
Nine pseudo-components used by Kenyon and Behie 1987 [29] were used as input to generate the fluid model (Table 2). The developed model was used to generate a base case of natural depletion without an injection well for the study and was run for a period of 15 years of production.
2.2. Methods to Track Phase Change in the Reservoir
Production below the dew point of the reservoir fluids causes a significant change in the composition of the fluid, and the heavier hydrocarbon components condense out of the fluid. This liquid dropout occurs near the wellbore and alters the relative permeability of the fluid. Depending on the distance from the wellbore, the saturation of condensate may vary.
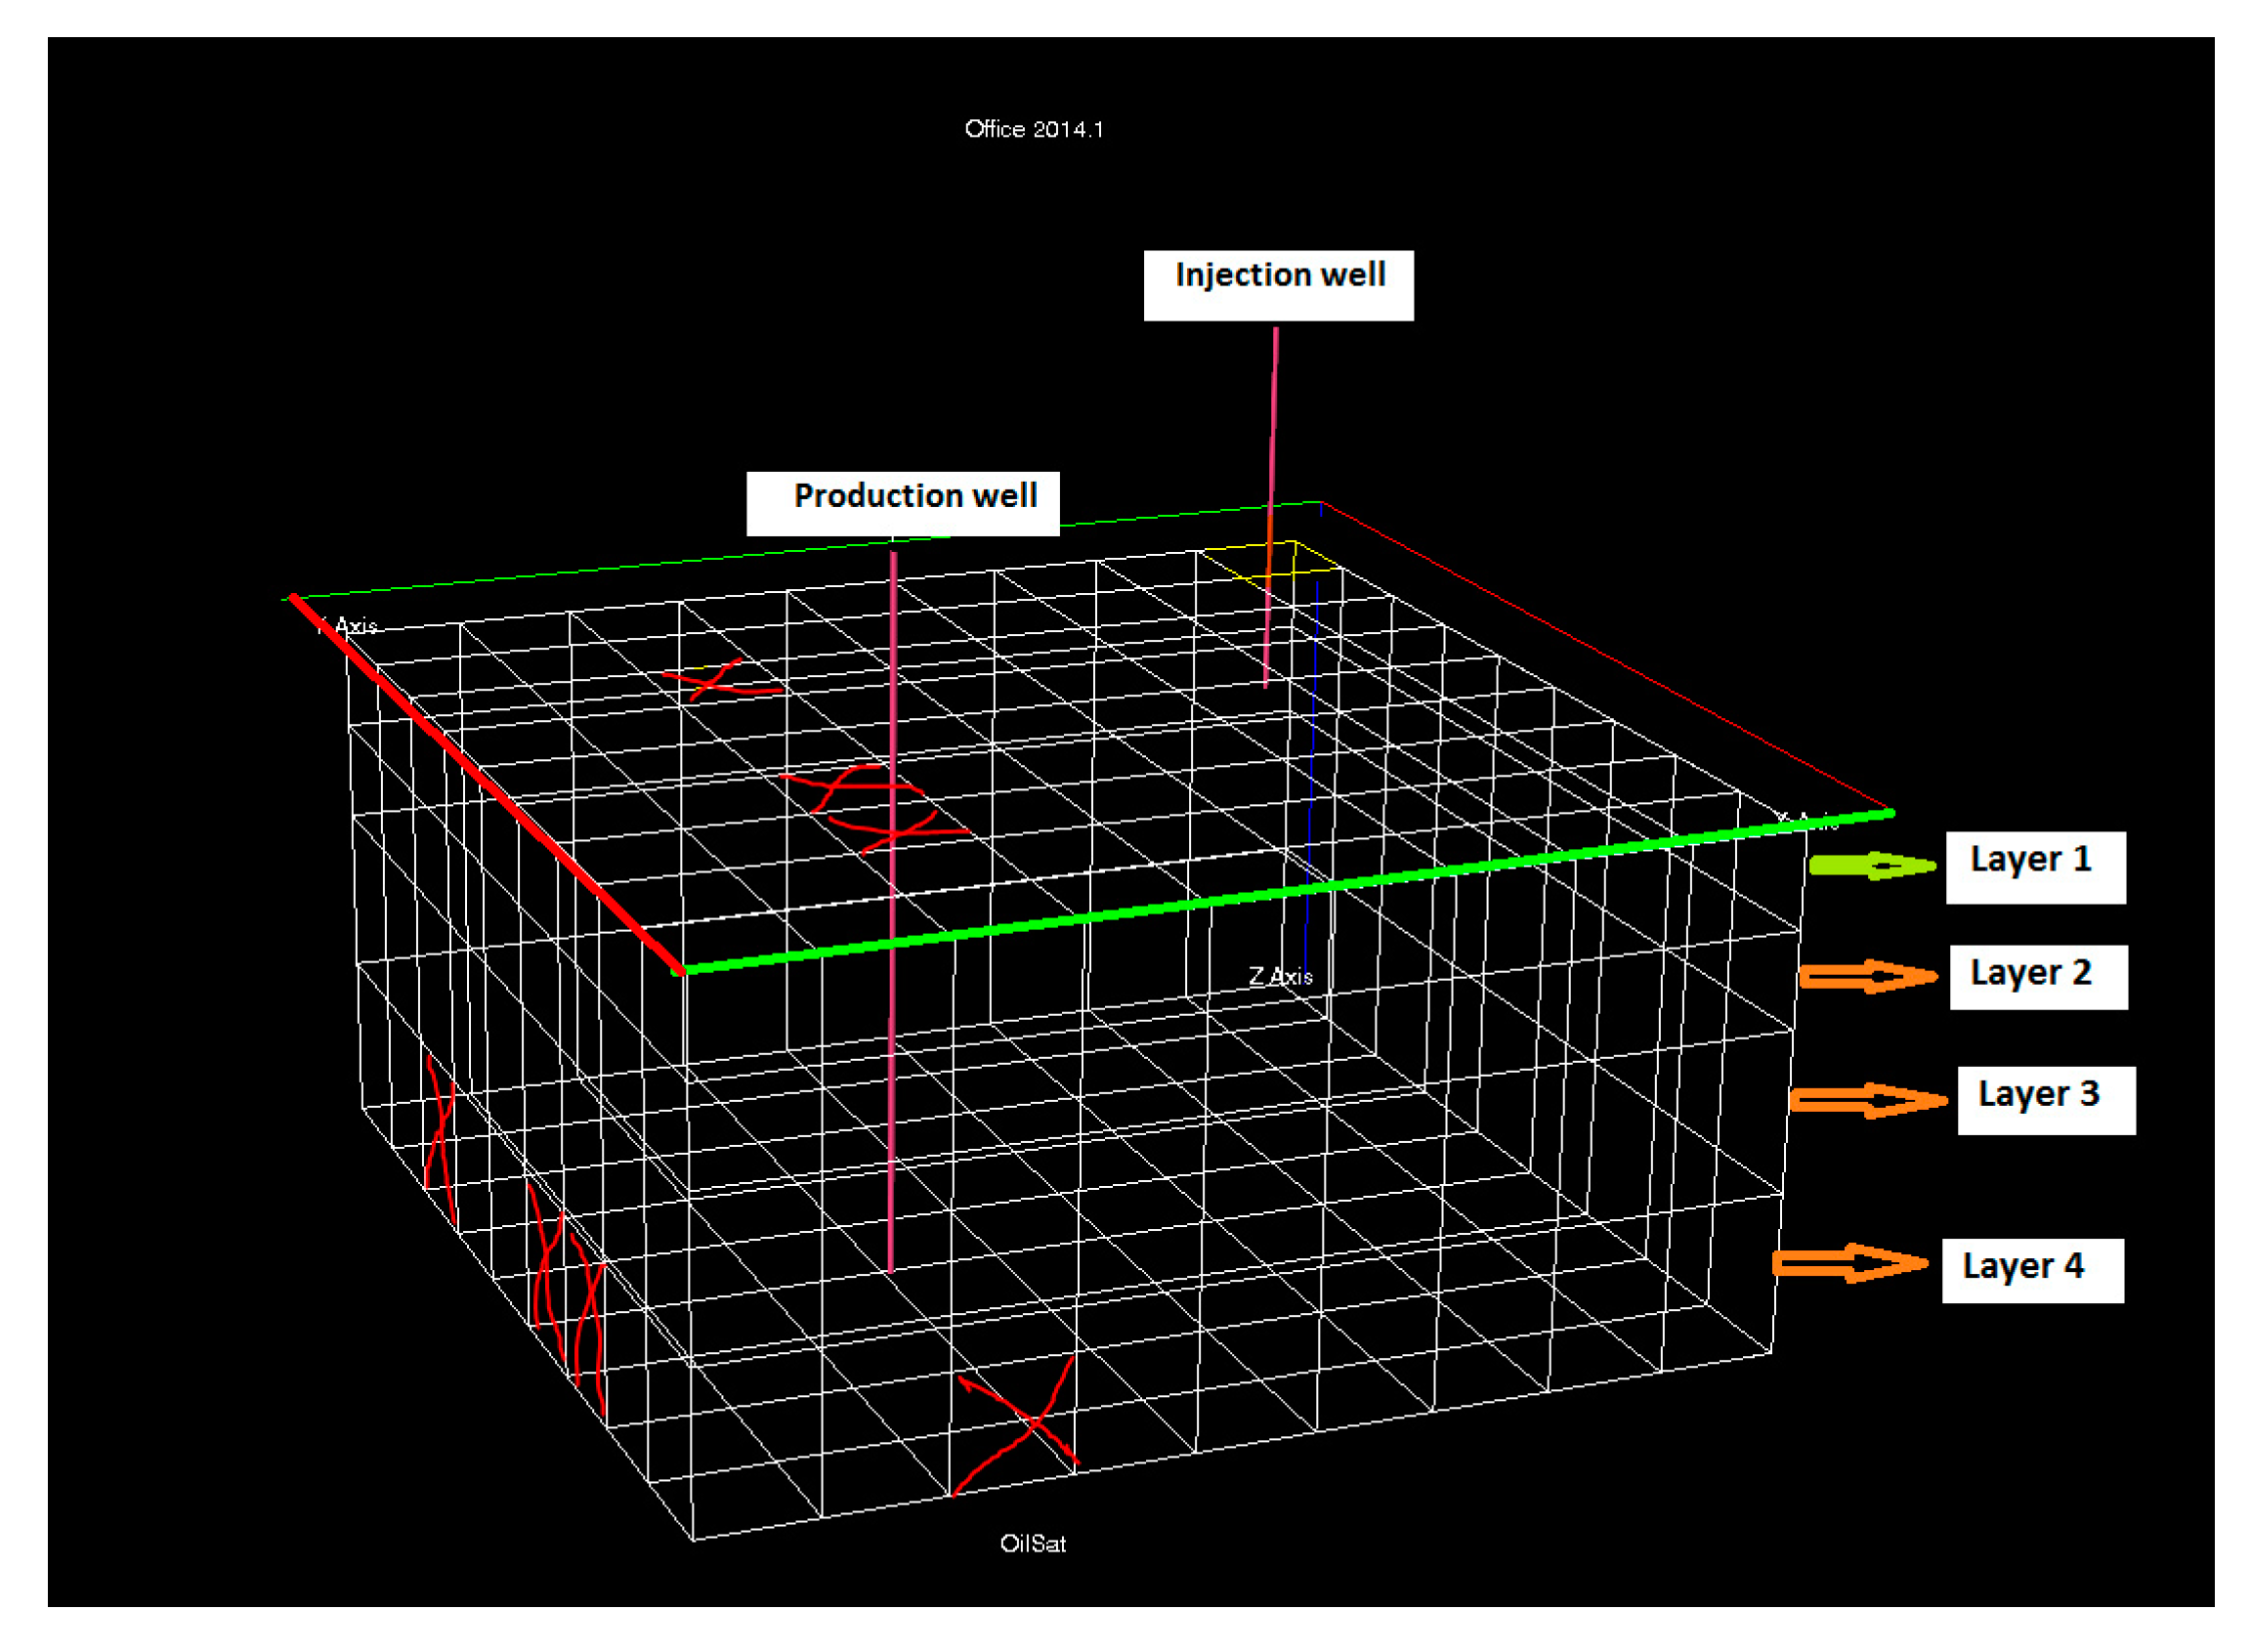
Selected blocks close to the wellbore and away from the production well were studied with compositional changes being recorded, in order to analyze the phase changes over time in the reservoir. Figure 2 presents the selected blocks where the change in fluid composition was tracked during production. The major emphasis was on C1 (lighter hydrocarbons) and C4-6 (heavier hydrocarbons). It is known that heavier hydrocarbon components have little or no effect on liquid-vapour phase behaviour in common hydrocarbon fluids. The 3D image shows the top view with the position of the production well and the injection well with some selected marked grid blocks of interest (7, 7, 4; 6, 7, 4; and 3, 7, 4) being marked. The side view shows four different layers of the reservoir. The fourth layer represents the main area of interest (wellbore) used for the study.

Figure 2.
A 3D Image of selected blocks of interest; from top to the two sides.
3. Results and Discussions
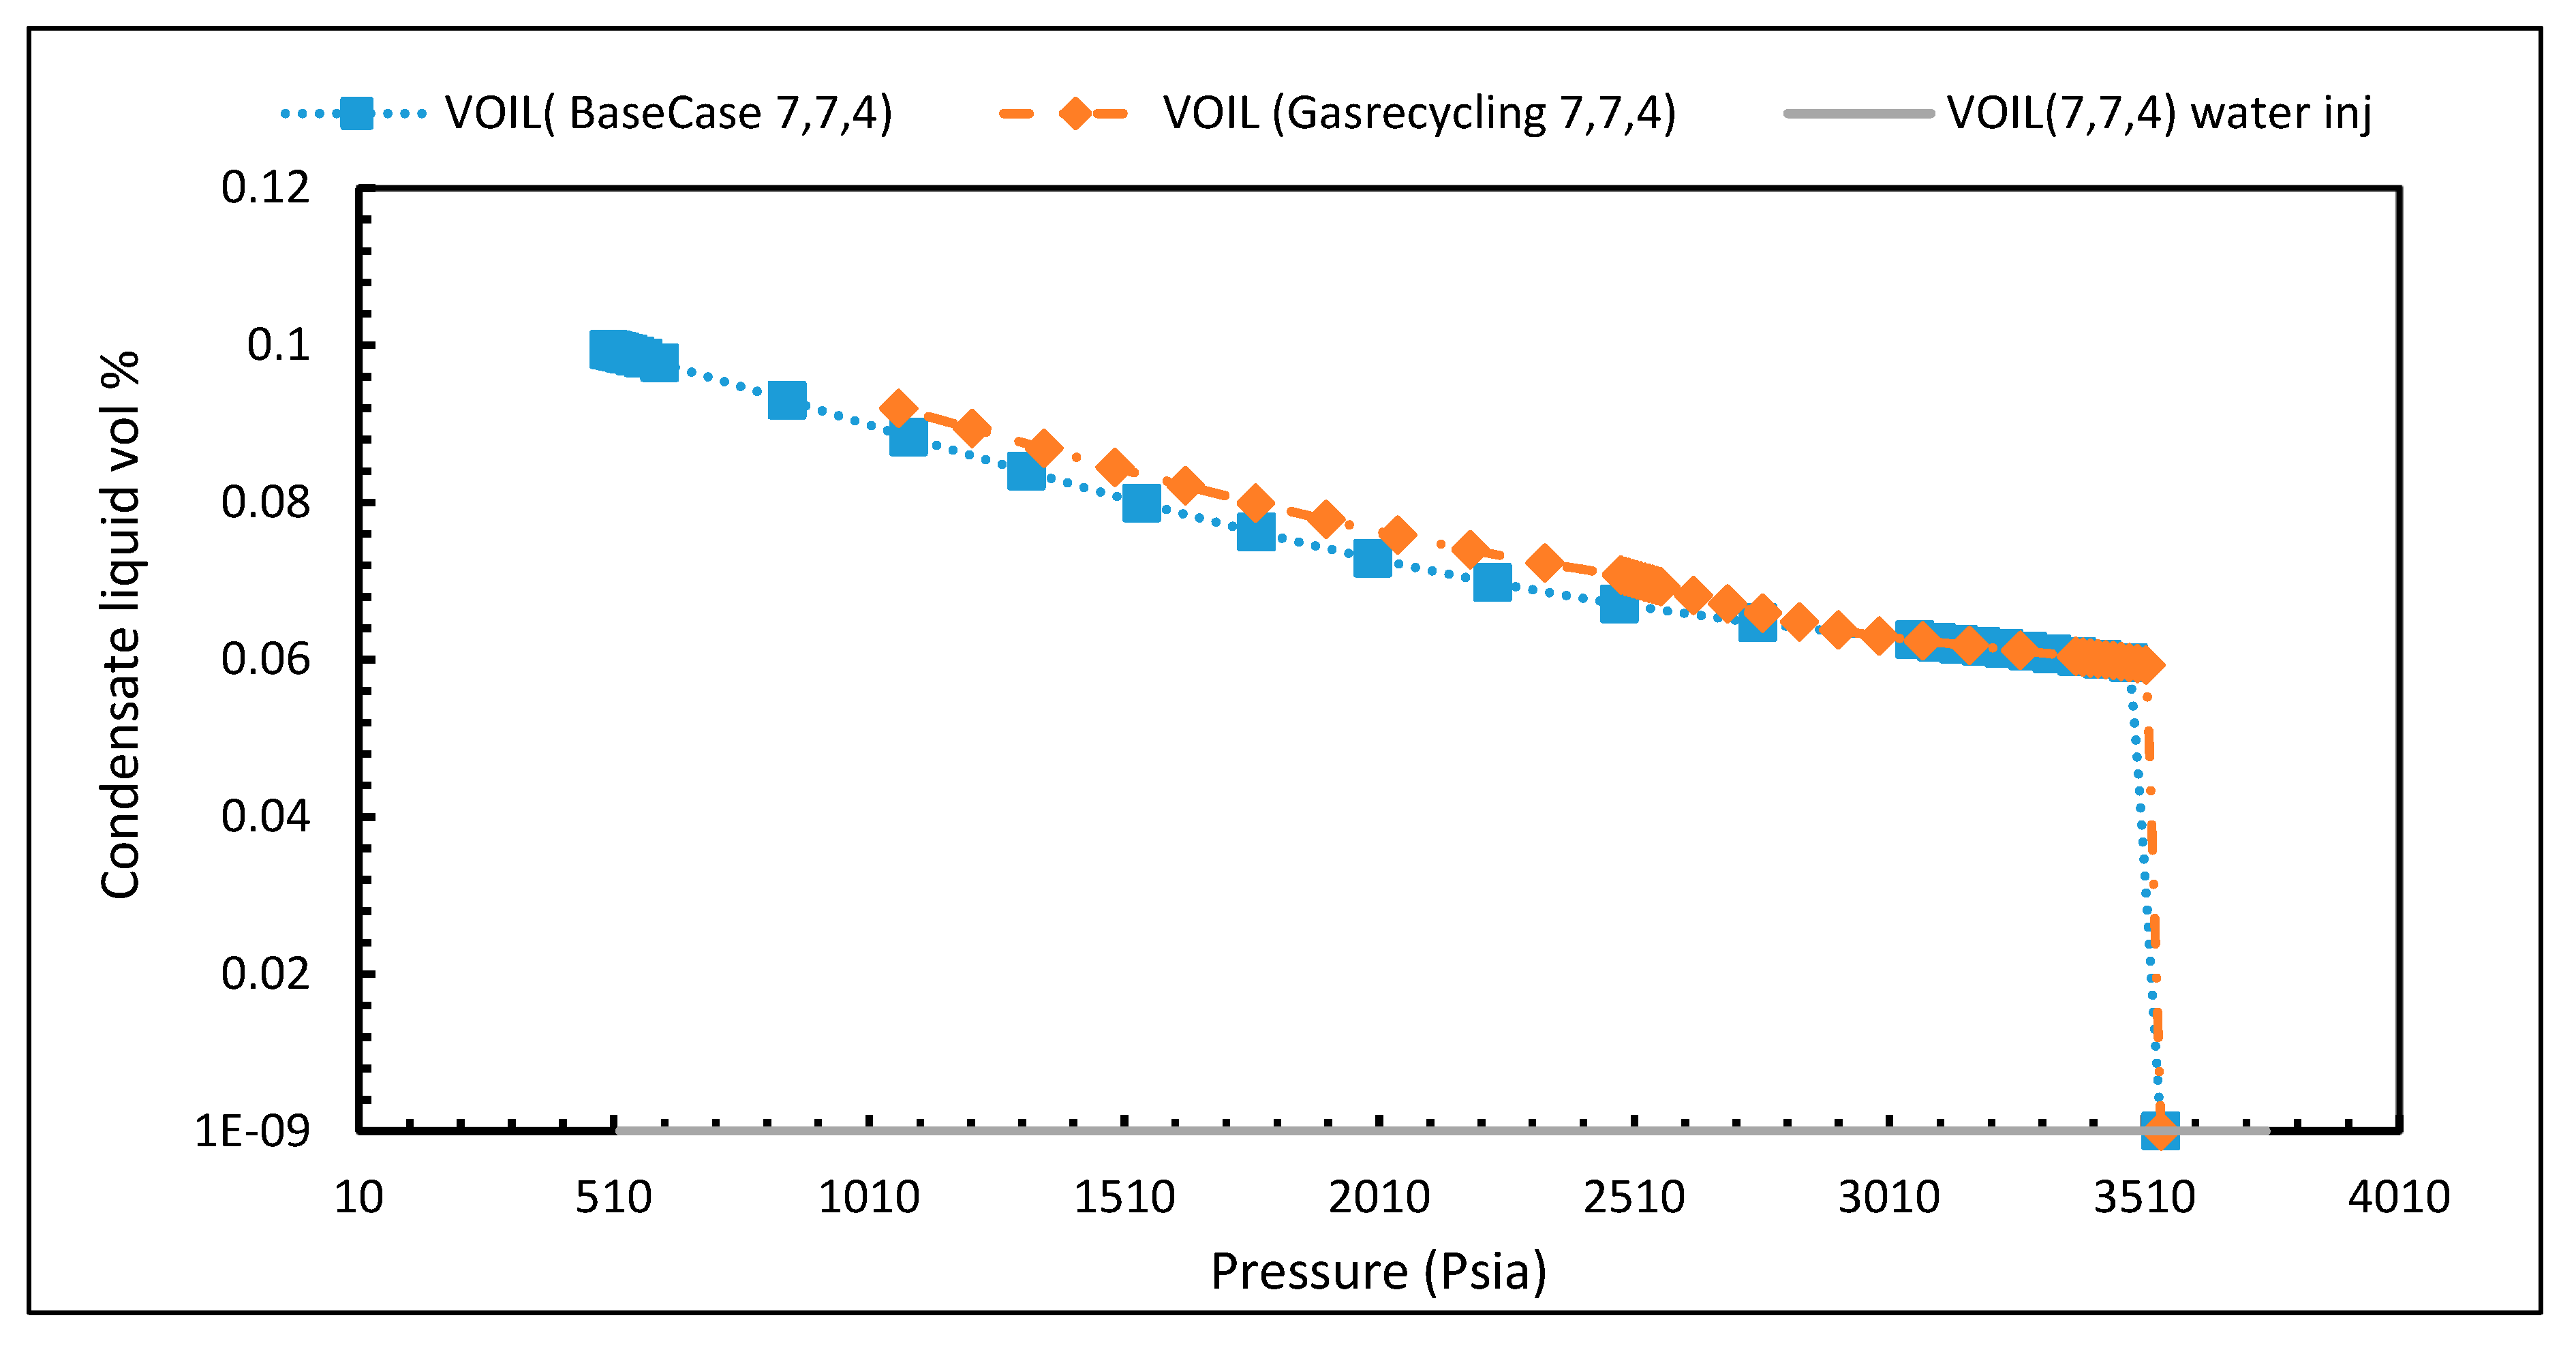
Figure 3 shows the condensate liquid volume at different pressures for three cases at the wellbore located in block (7, 7, 4). Condensate accumulation increases at the wellbore with declining pressure. Pressure increases linearly after the dew point at 6% towards the wellbore at a pressure of 3419 psia for both the base and gas recycling cases. The maximum volumes of condensate achieved for the base, gas recycling, and water injection cases were 10%, 9%, and 0% respectively at a reservoir pressure of 500 psia. Therefore, the water injection case shows no condensate formation during depletion. It is also noted that the condensate liquid volume slightly increased during the gas recycling case as compared to the base case. This can be attributed to the change in phases due to gas injection, which keeps the pressure slightly higher than the dew point pressure.
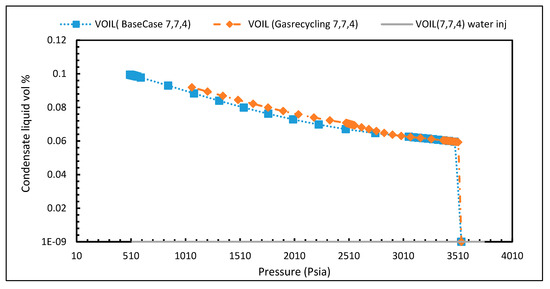
Figure 3.
Condensate liquid volume dropout for block (7, 7, 4) as a function of pressure for the base case, gas recycling and water injection cases during depletion.
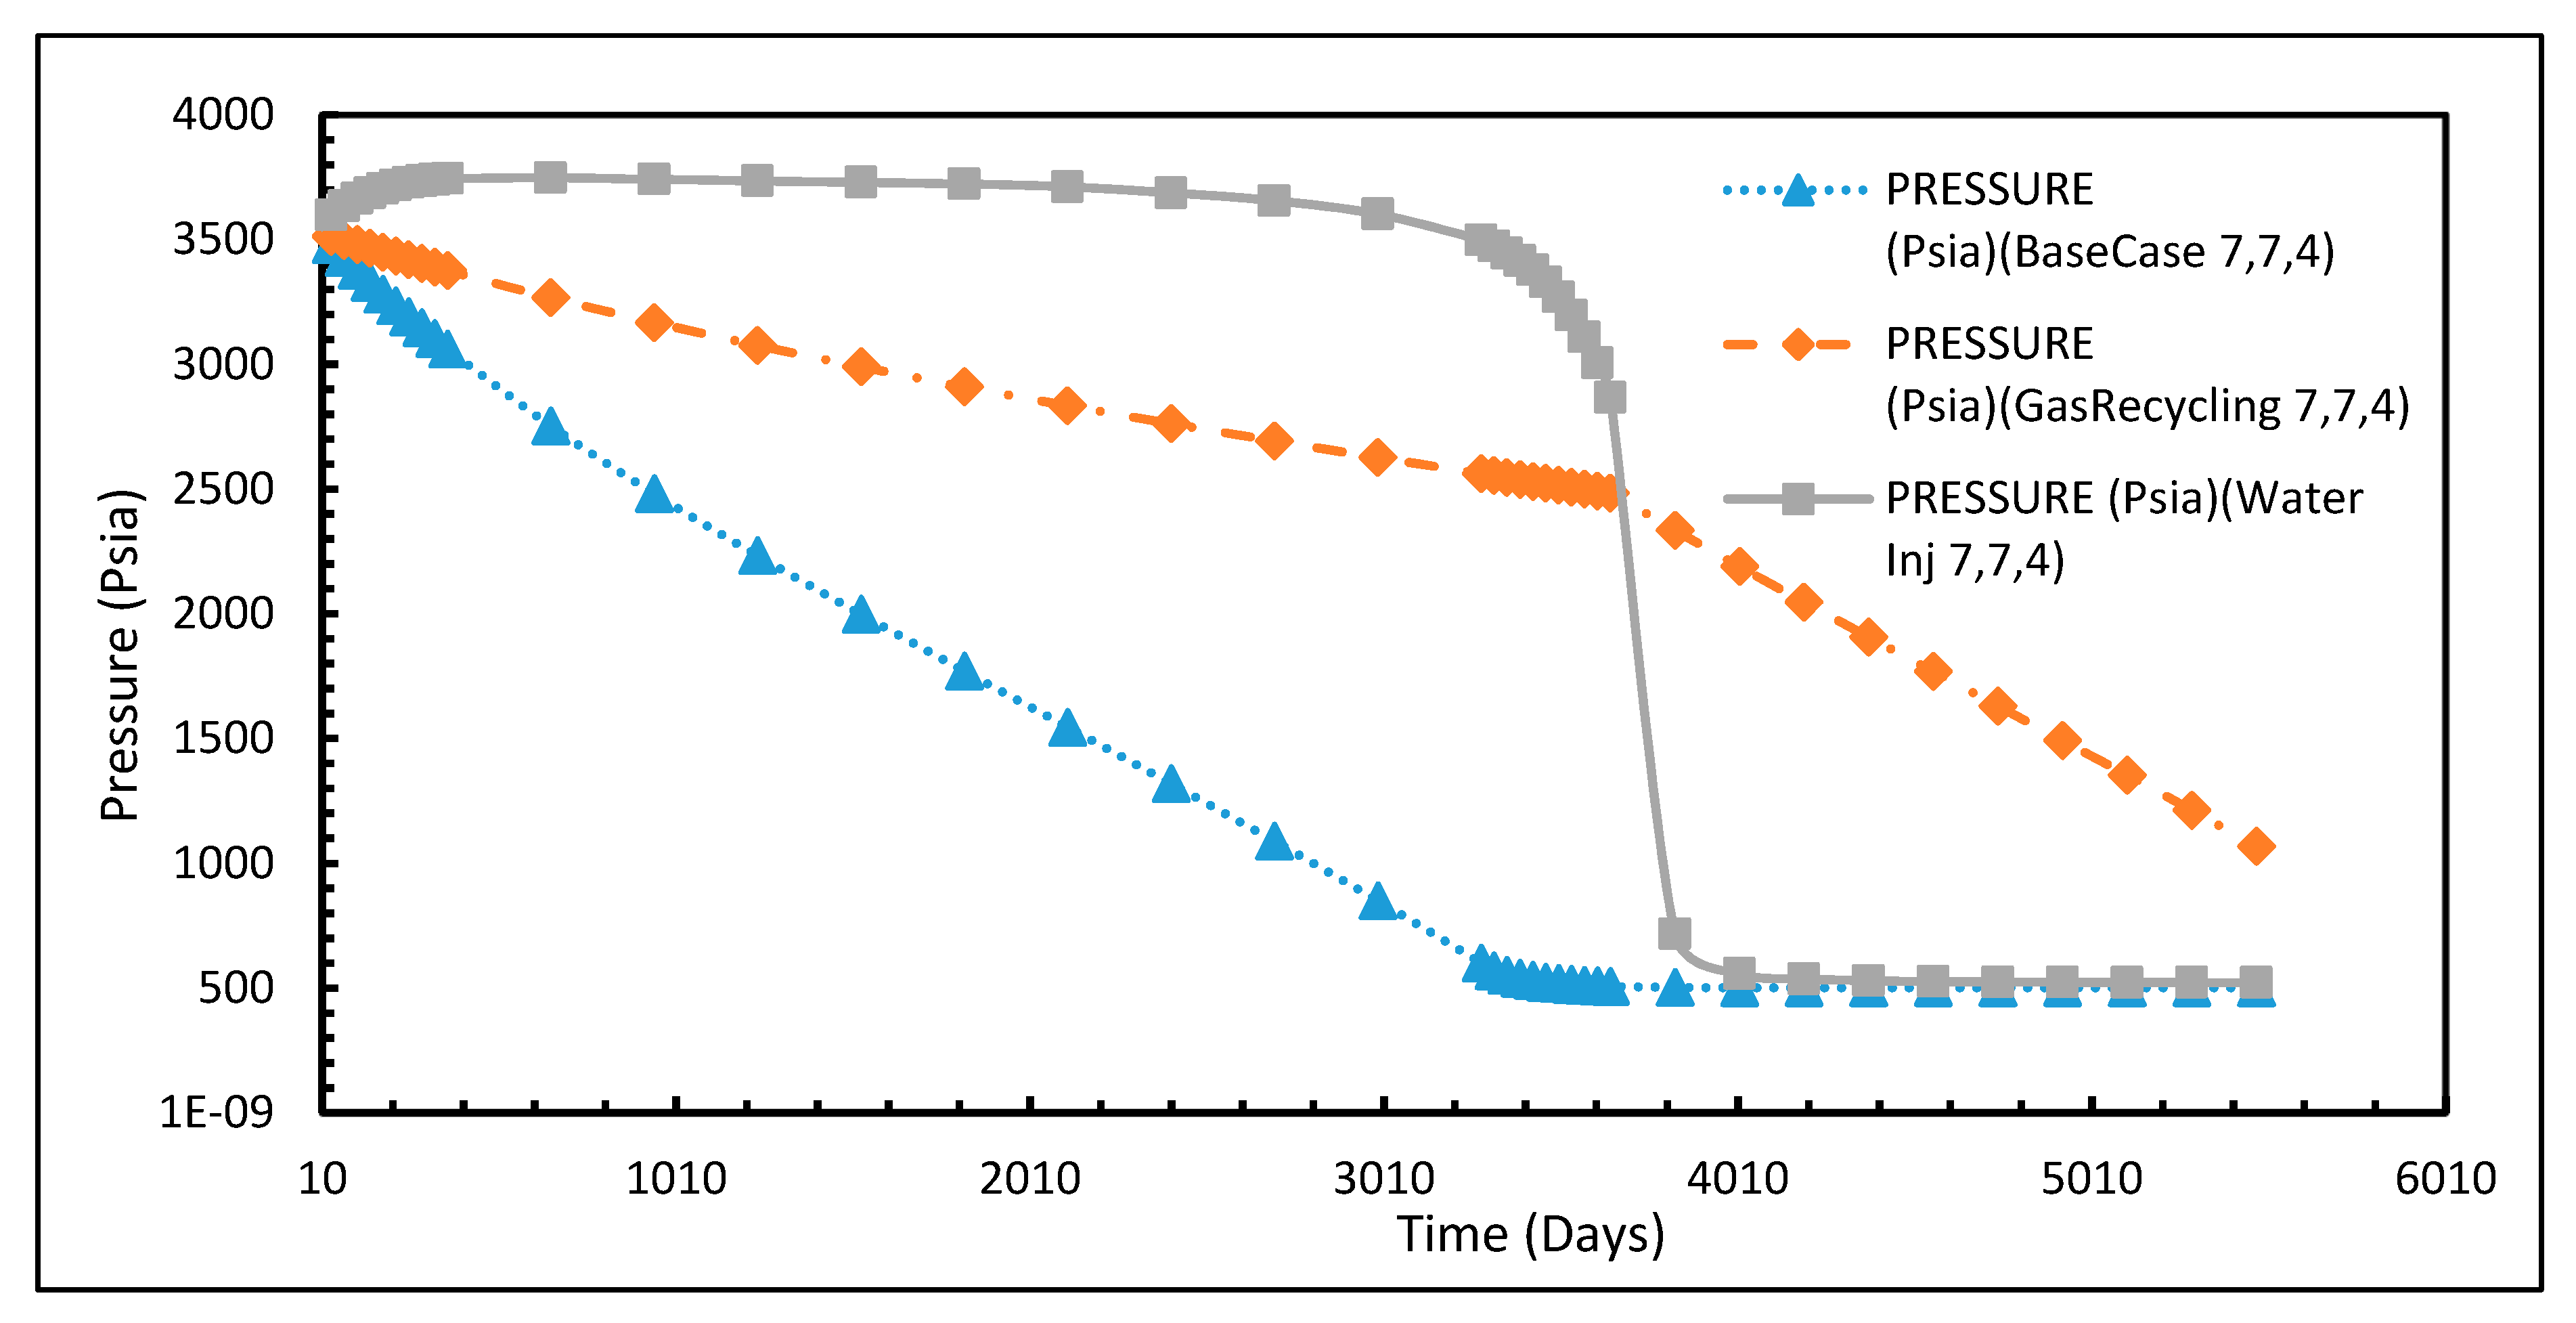
Figure 4 presents the calculated pressure at the wellbore for the cases studied against depletion time. The pressure drop for base case without external support shows a sharp decrease, while a slower trend of pressure reduction is observed for the gas recycling case. In contrast, water injection pressure remained above the dew point for a long period, avoiding any formation of condensate during depletion. It is interesting to note that the pressure drop after the dew point for the water injection case was much faster than the gas recycling and base cases.
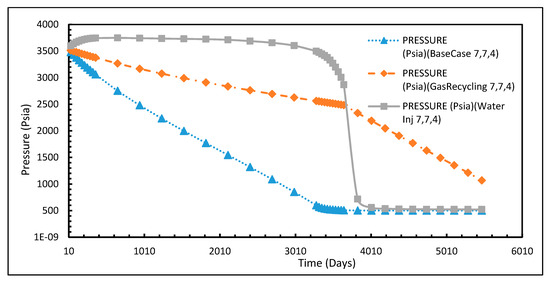
Figure 4.
Reservoir pressure versus time at the wellbore block for the base, gas recycling, and water injection cases.
3.1. Tracking the Changes in Gas Compositions during Reservoir Depletion
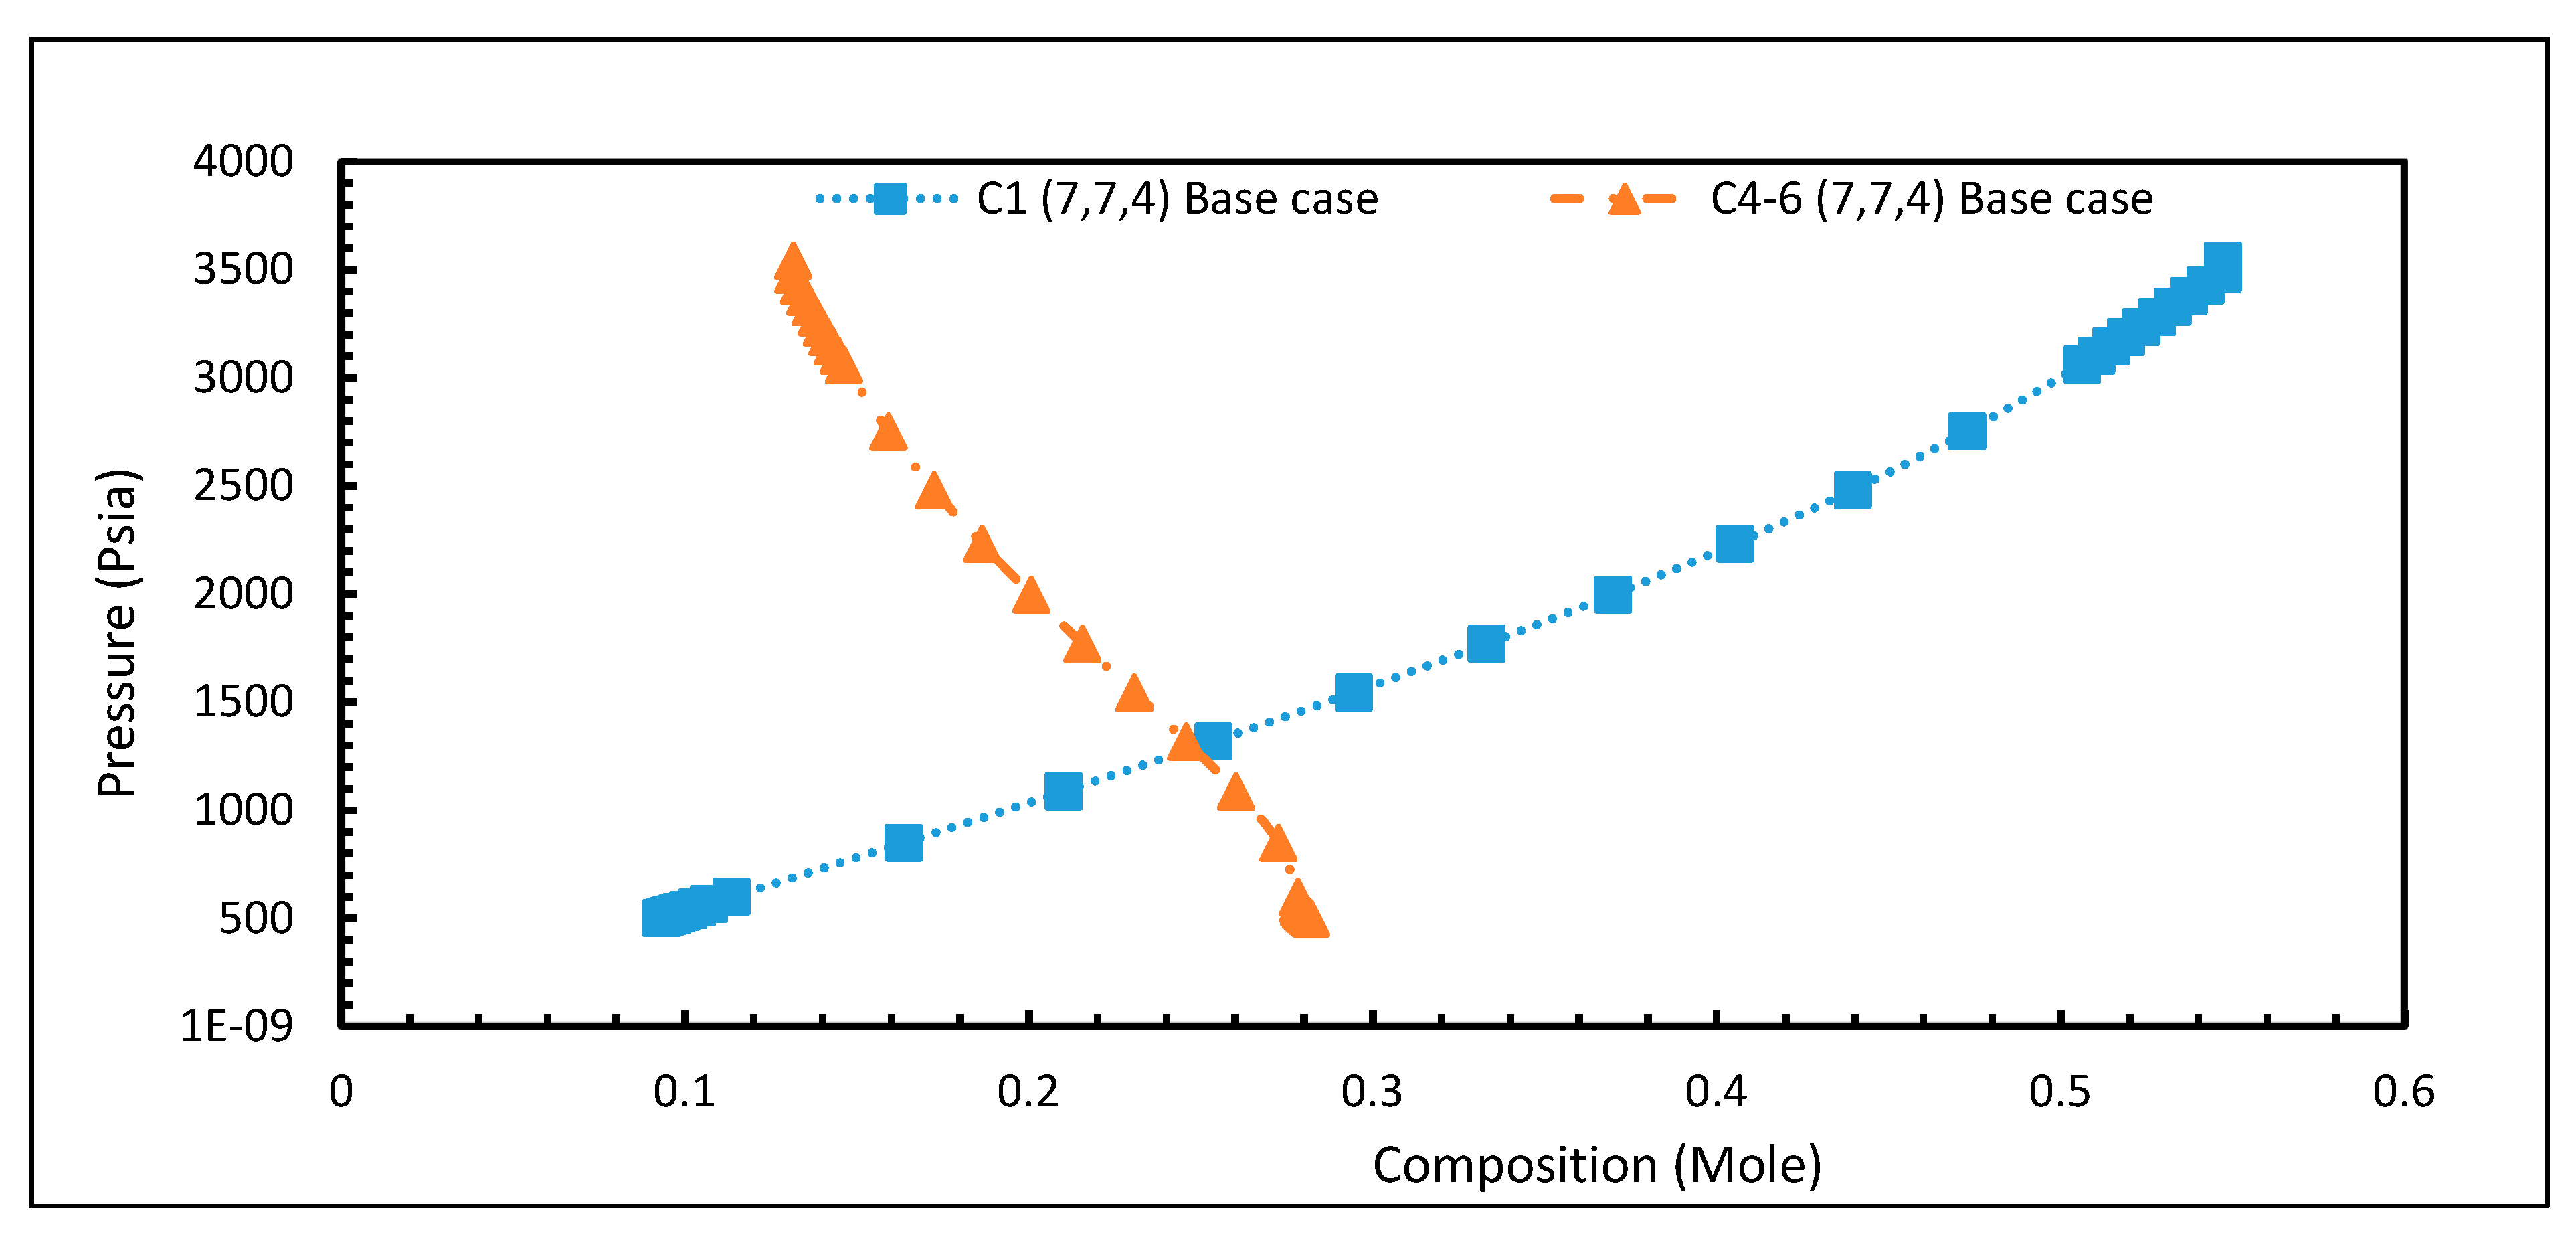
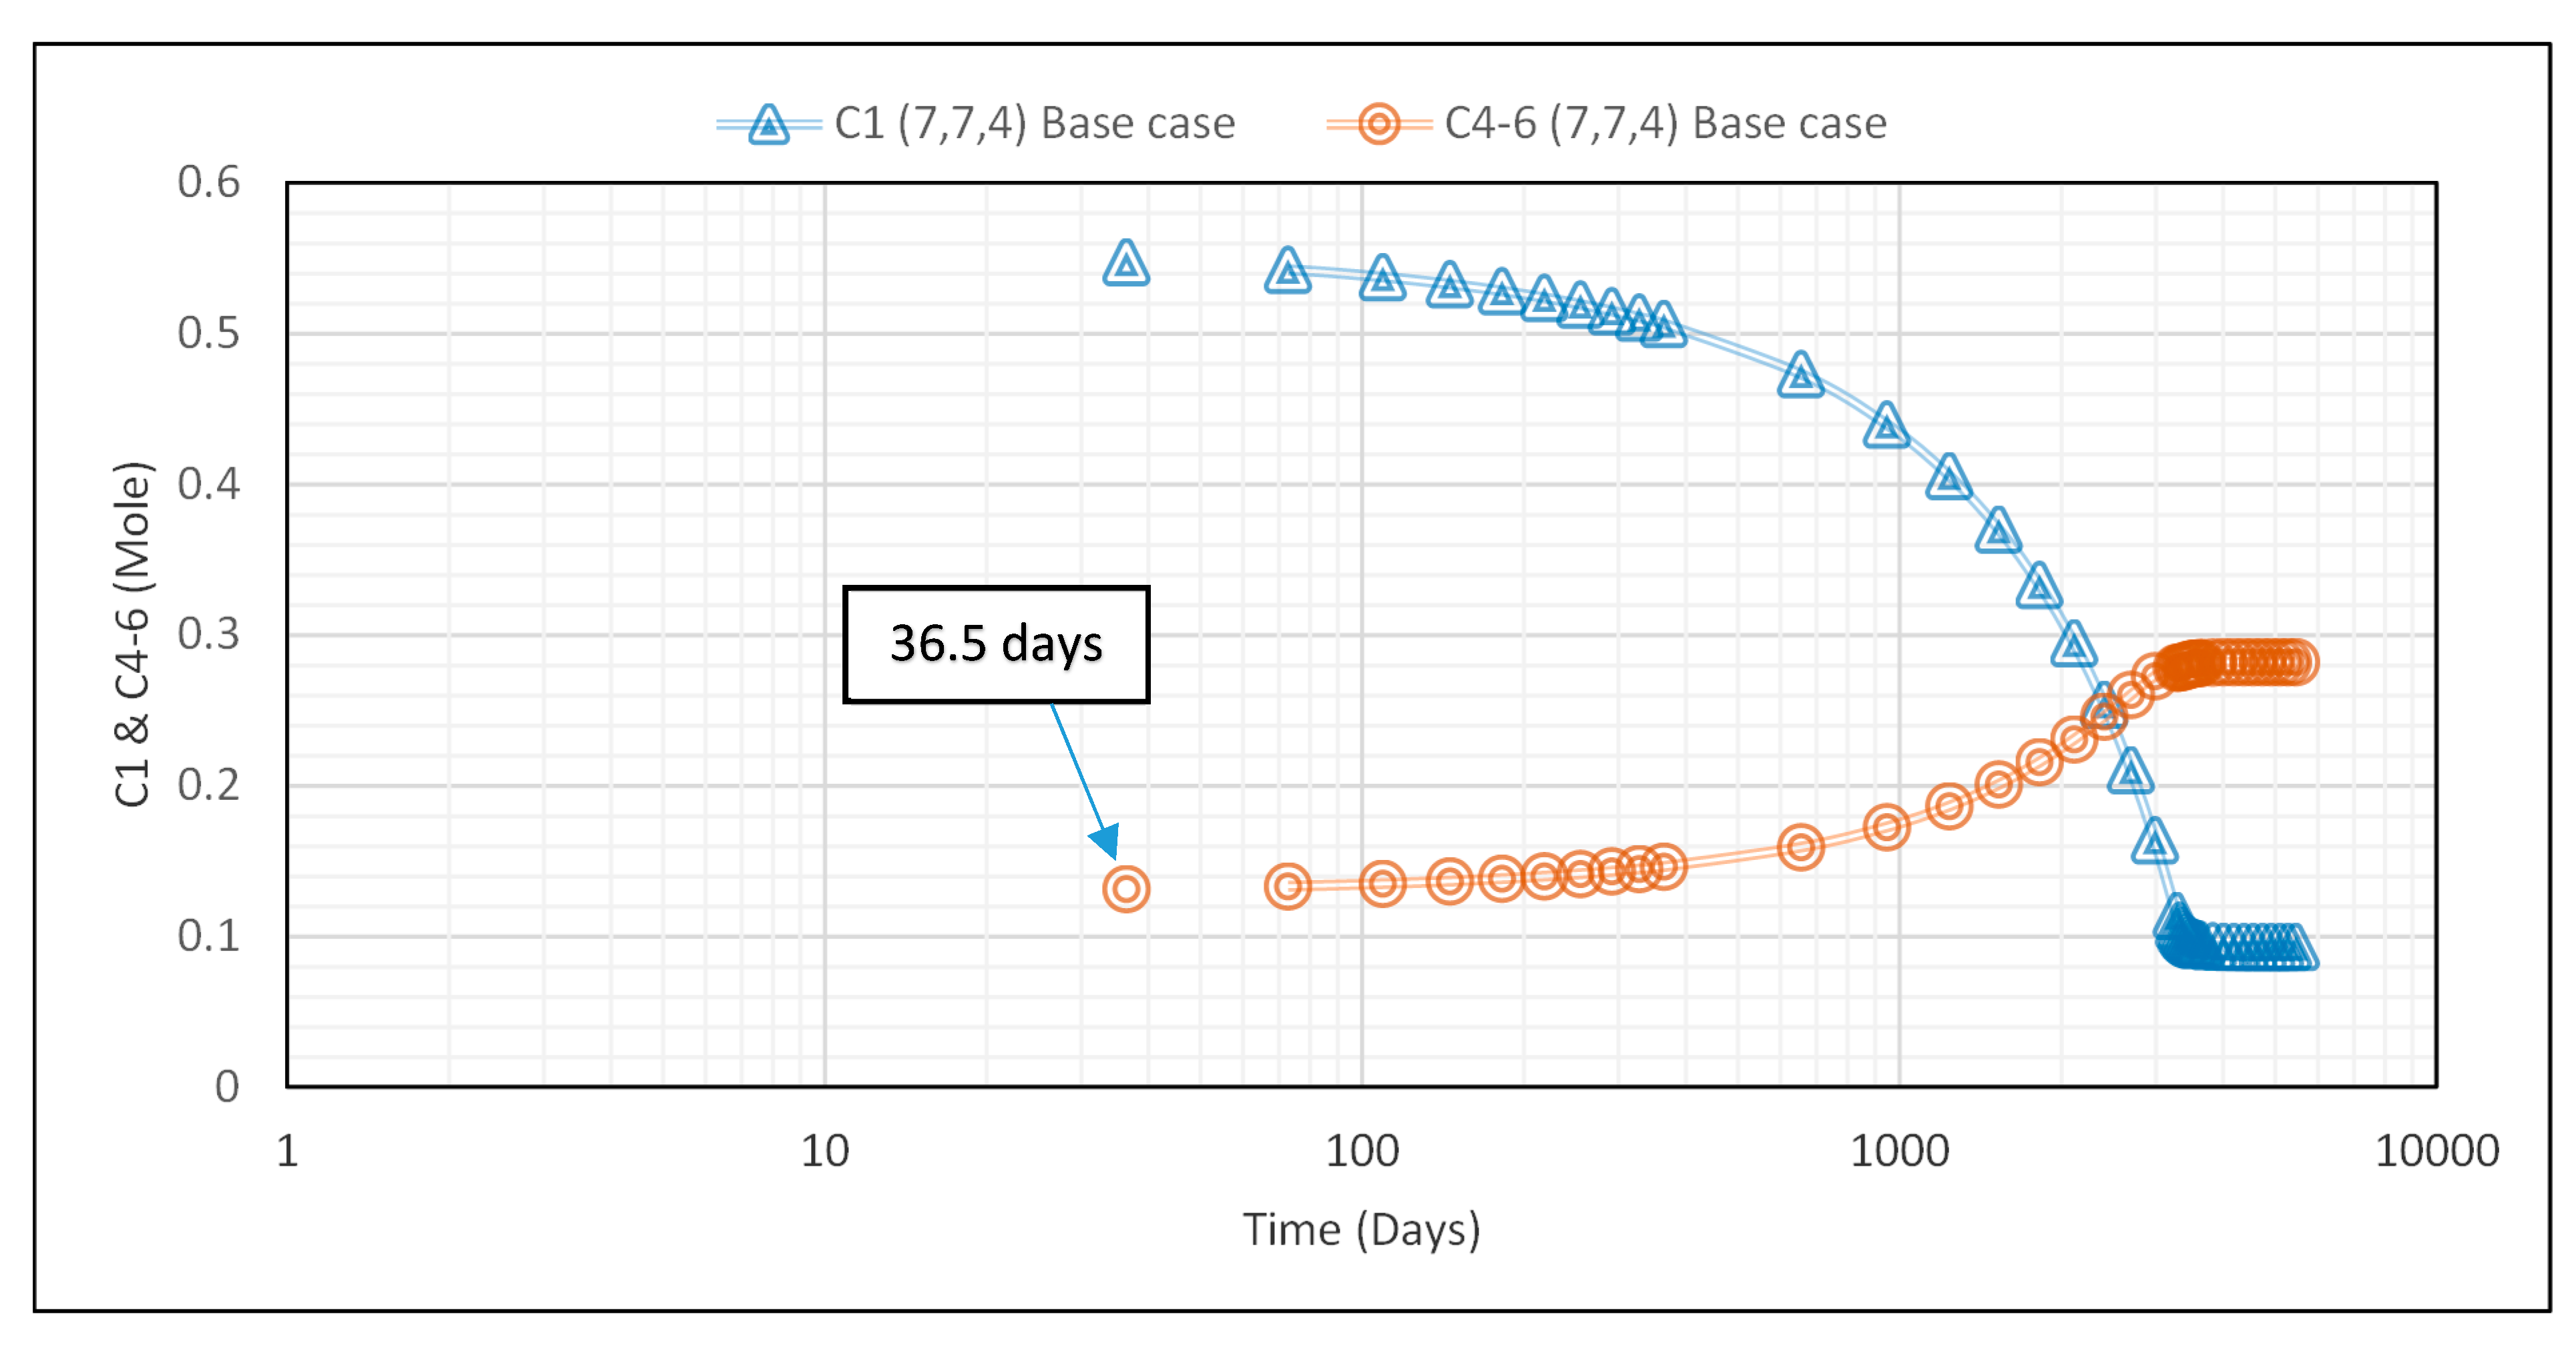
During production from the gas condensate reservoir, heavy components drop out in the condensate with decreasing pressure [9]. The methane (C1) composition at the wellbore decreases while the butane (C4) composition increases (Figure 5). As can be seen in Figure 6, notable changes in composition started after 36.5 days, indicating a rapid dropout of liquid at the wellbore with declining pressure.
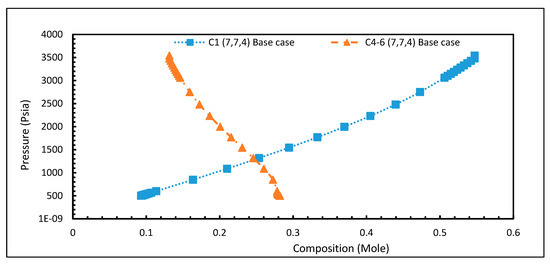
Figure 5.
Pressure versus composition of the fluid components for the base case at the wellbore.
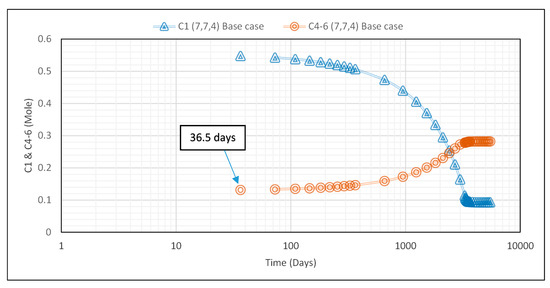
Figure 6.
Composition of fluid components over time for the base case at the wellbore.
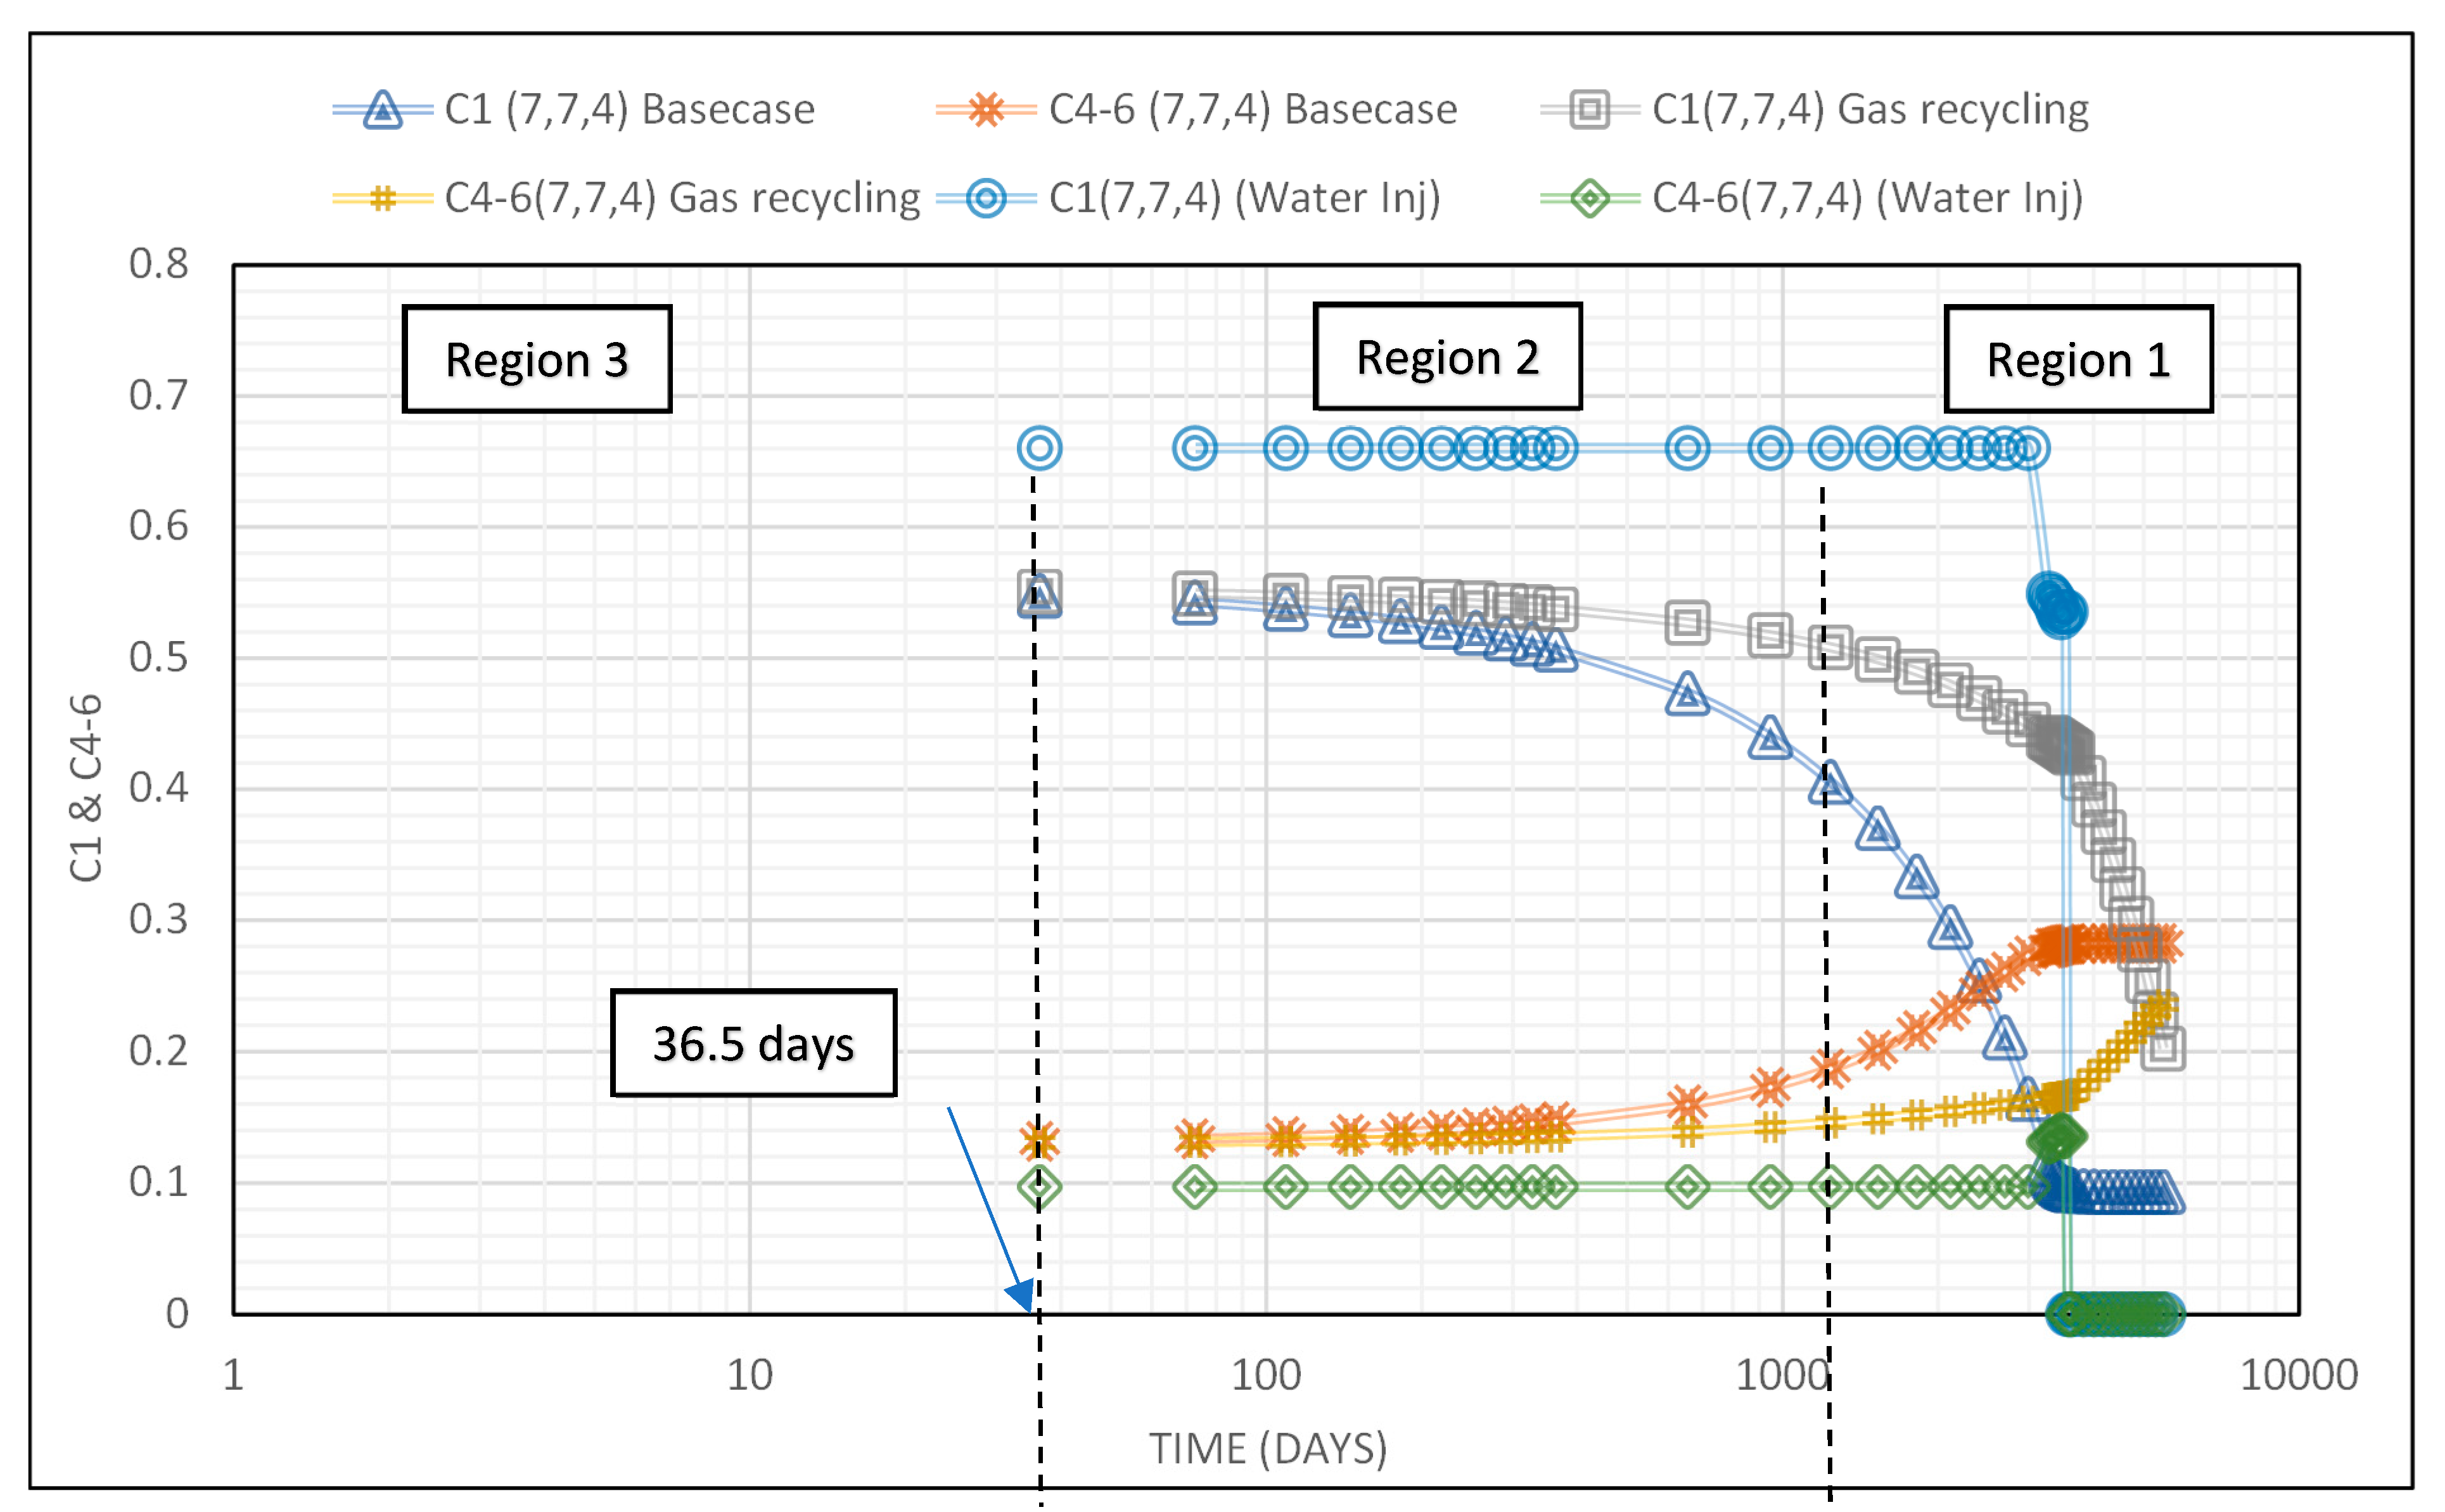
Tracking compositional change can be used to demonstrate the effectiveness of the method applied for recovery enhancement. Figure 7 shows a logarithmic scale of the flow behaviour of C1 and C4-6 around the wellbore. In this figure, three regions can be identified from the plot. The first region is defined from 0 to 36.5 days, where the concentration of the lighter component (C1) was at its original value of 55% and the concentration of the intermediate components (C4-6) was 13% with corresponding pressures of 3350 to 3478 psia. As the hydrocarbon fluid flow reaches the second region, the lighter component (C1) experiences a reduction in concentration. The second region starts from 36.5 days and ends at 1241 days. As can be seen from the figure, this change in composition for the base case is faster than in the recycling case. It should also be noted that no change in composition was observed for the water injection case. We may conclude from this figure that better support of the well prevents a change in gas composition. With further depletion of the gas condensate reservoir, a third region is attained. This region lasts from 1241 days to 5475 days with a lighter component concentration of 9% and 20% and with an intermediate component concentration of 28% and 24% for the base case and gas recycling cases respectively at a pressure of 500 psia. In contrast to base and gas recycling cases, the highest change in composition was experienced in region three with water injection. This could relate to the faster reduction in pressure which occurs at this time (see Figure 3).
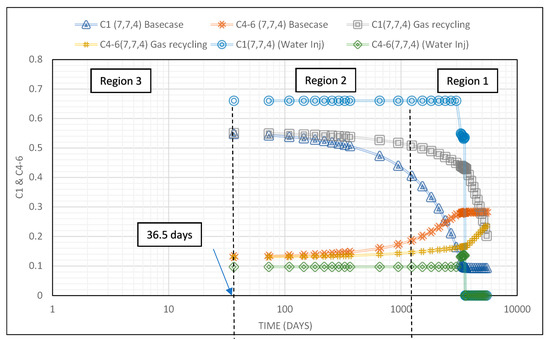
Figure 7.
Fluid composition of C1 & C4-6 components over time for base, gas recycling, and water injection cases.
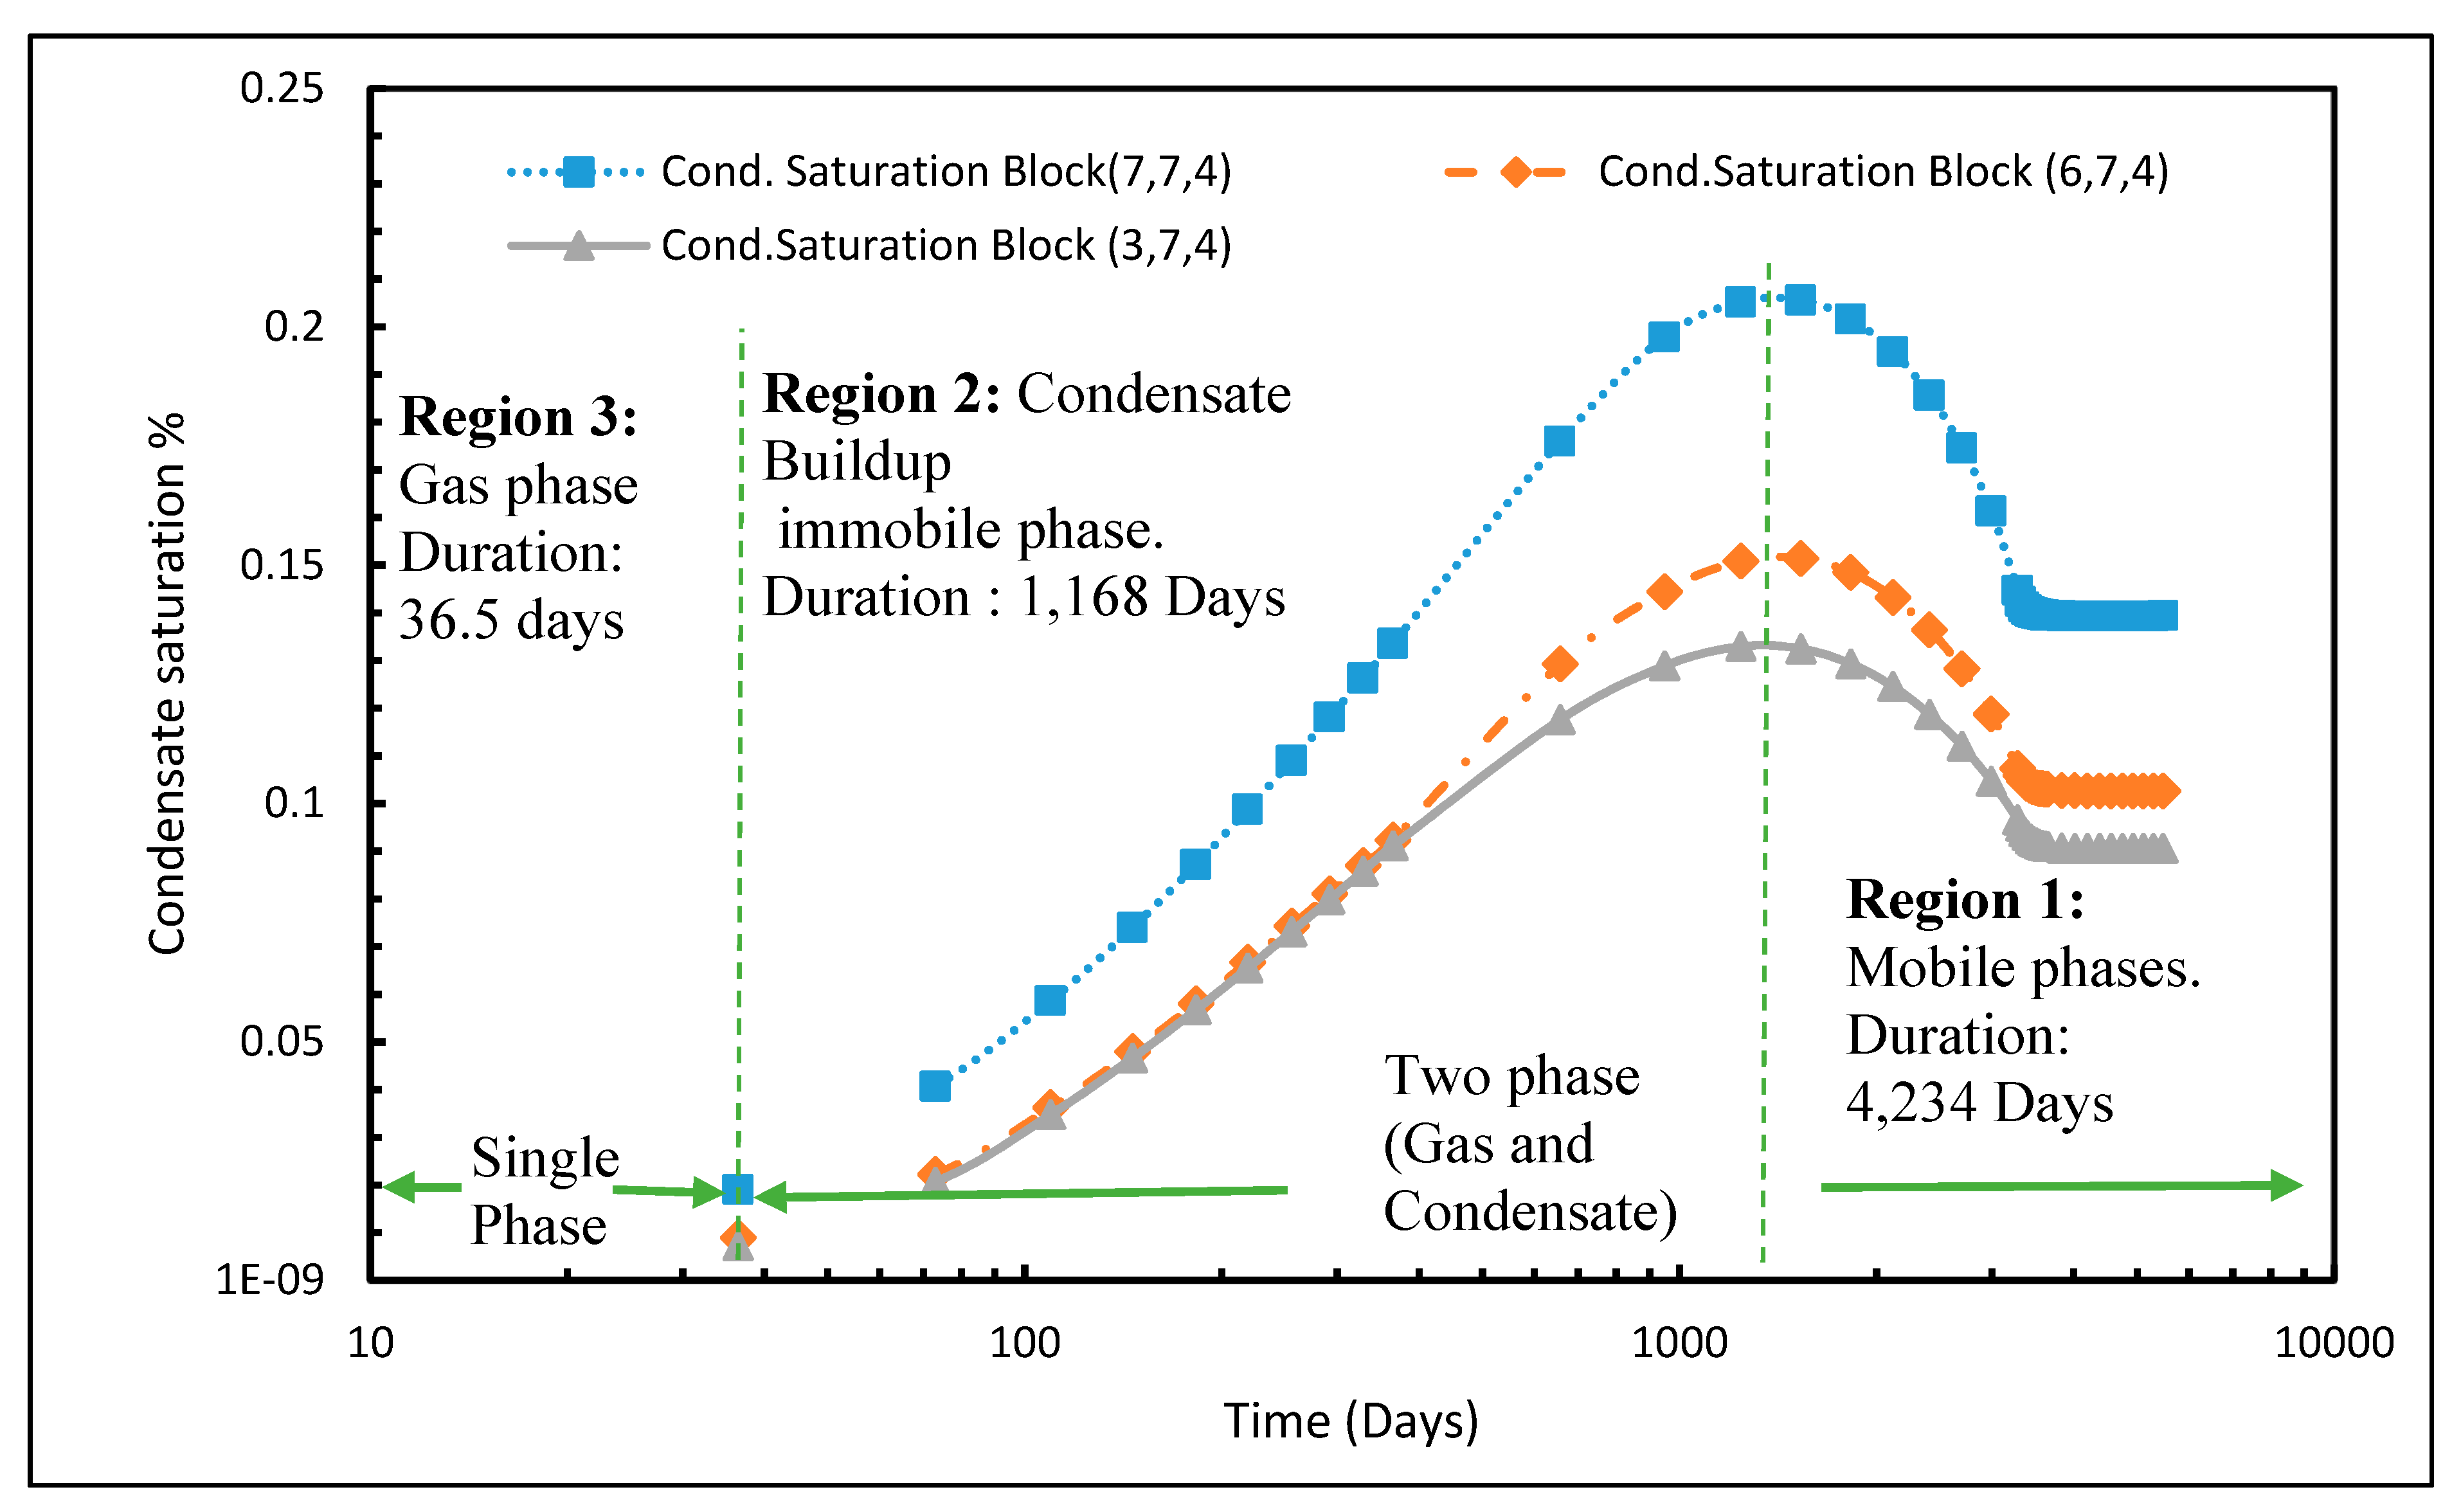
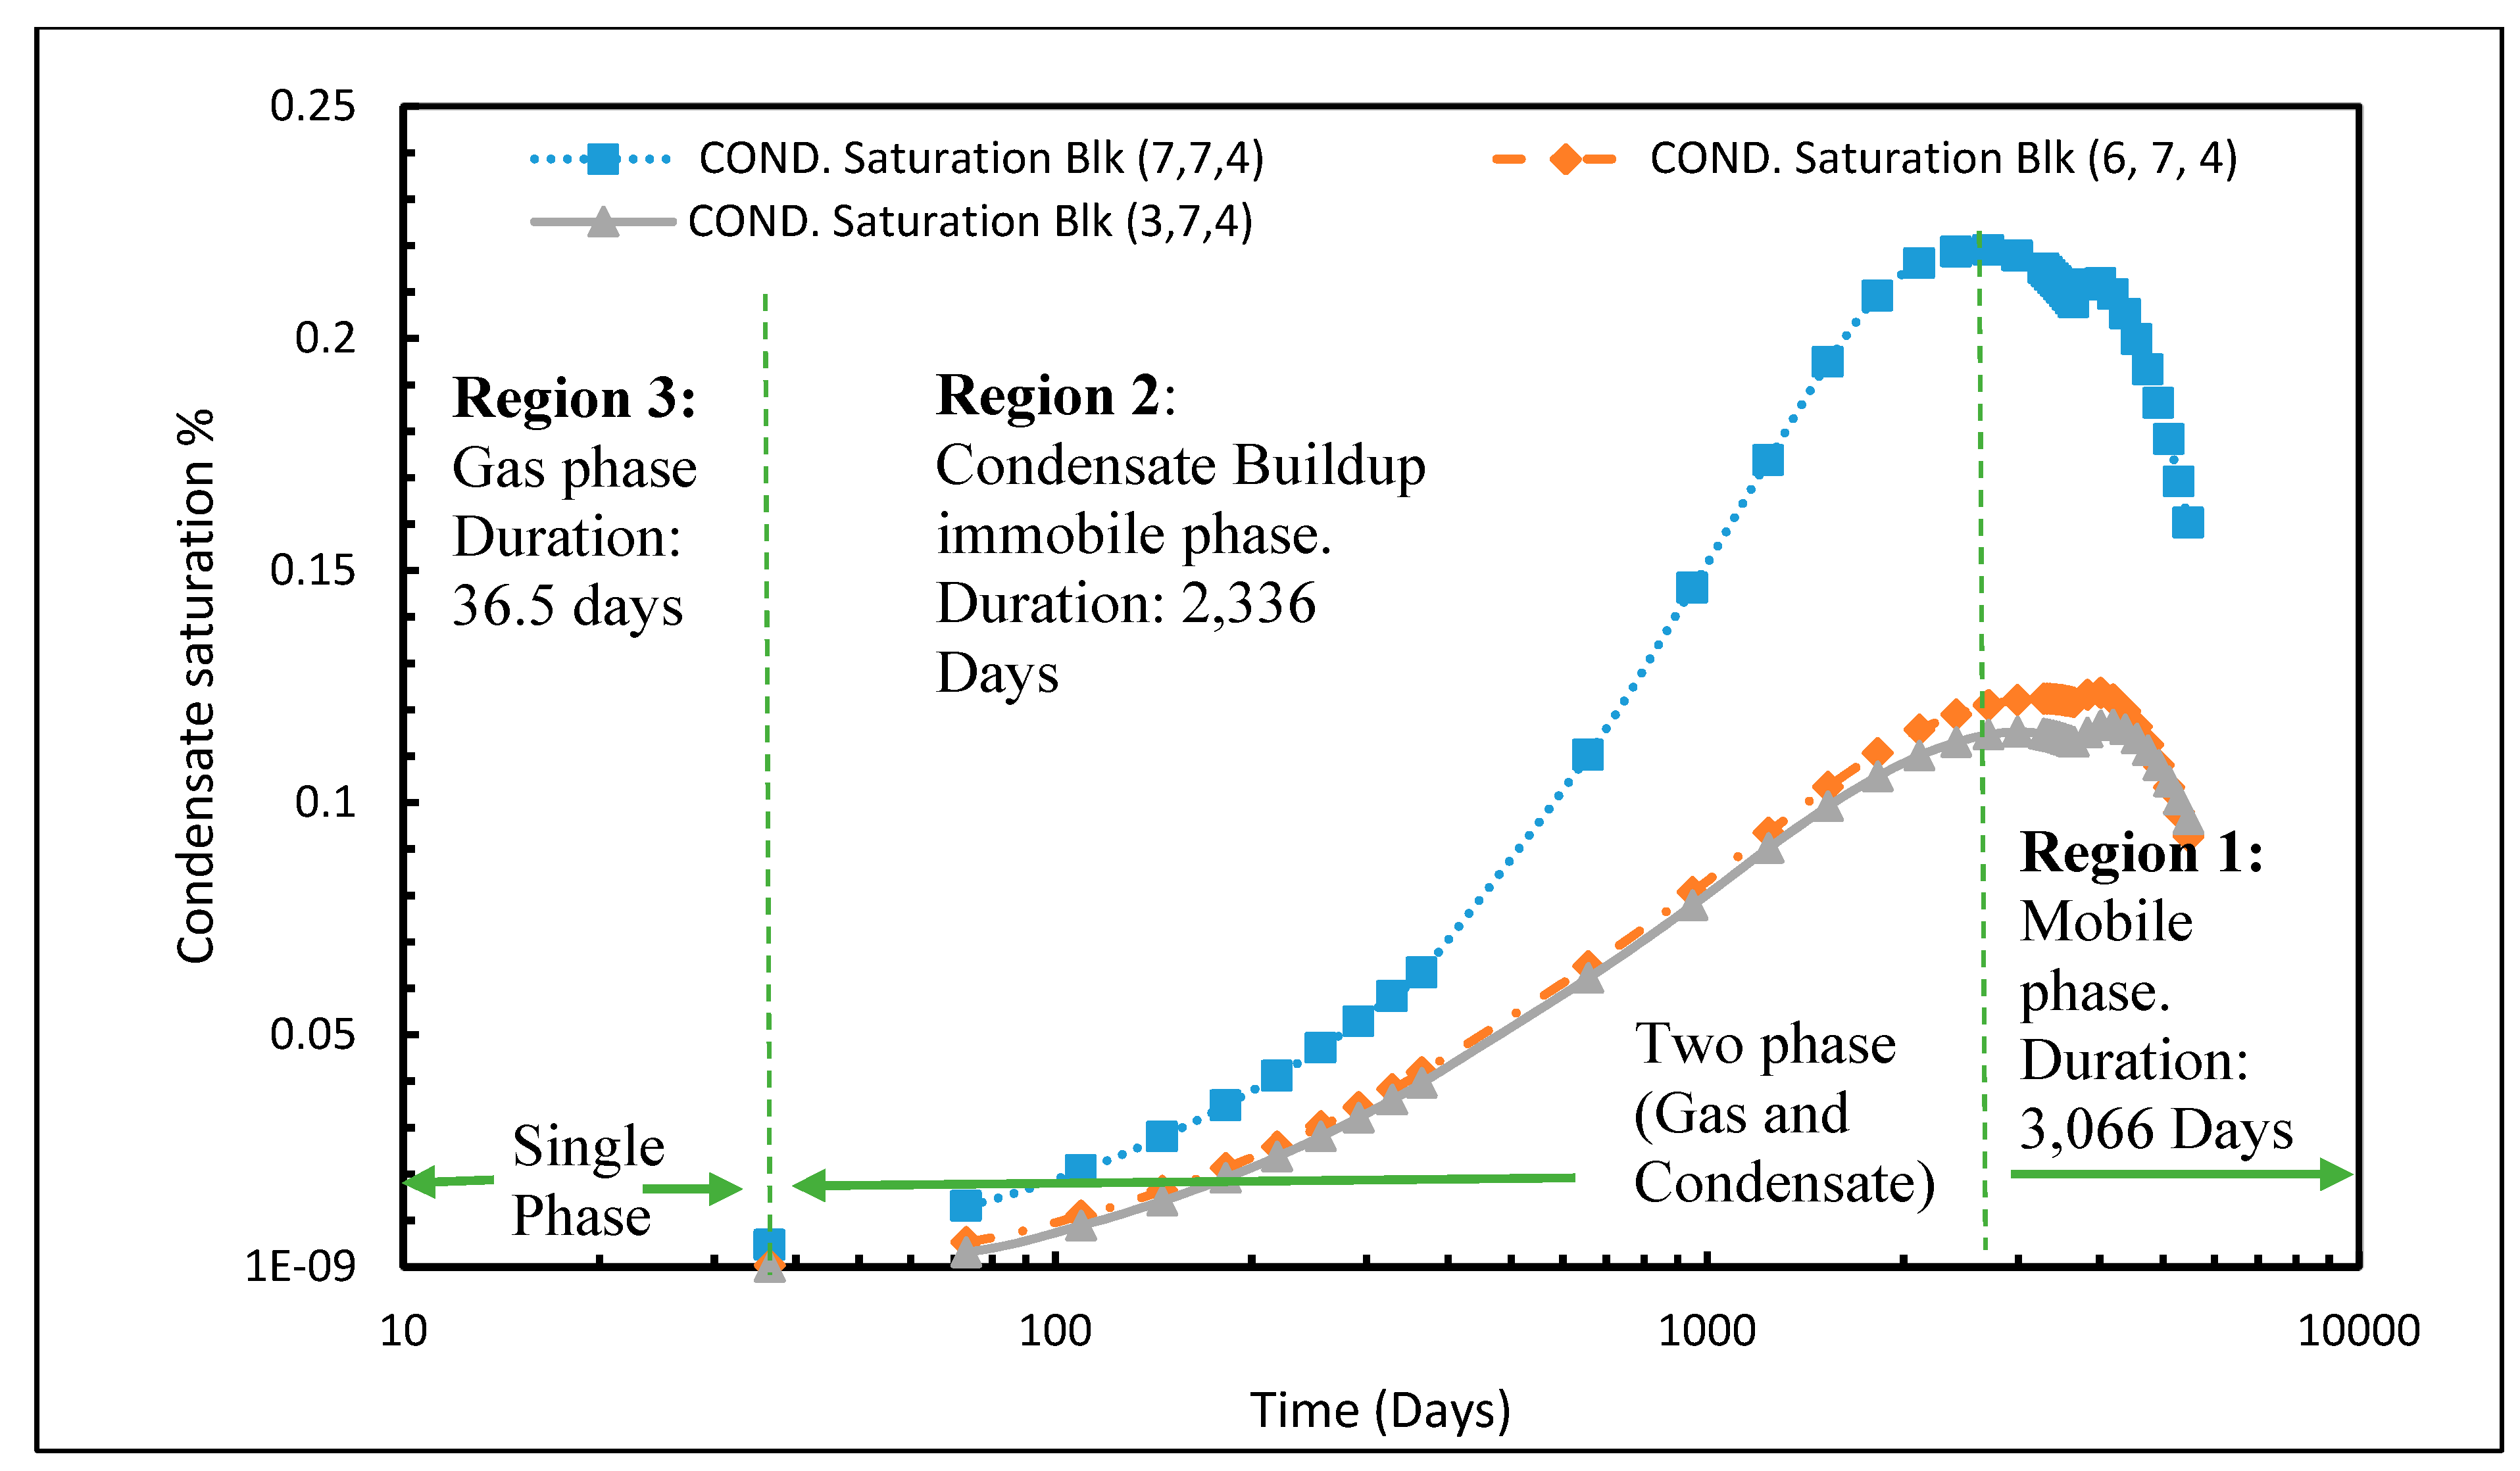
3.2. Tracking Saturation Phase Change and Its Distance from the Wellbore
Figure 8 and Figure 9 show the saturation phase changes as time progresses for three blocks at different distances from the wellbore for the base and gas recycling cases respectively. As can be seen from these figures, wellbore block (7, 7, 4) experiences the highest condensate saturation, while blocks further away from the well (3, 7, 4) experience the lowest. For example, results for the study block (6, 7, 4) and (3, 7, 4) for the base case show that condensate was reduced by 5.4% and 7.29% respectively. Similarly, the reductions for the gas recycling case were 9.79% and 10.43%.
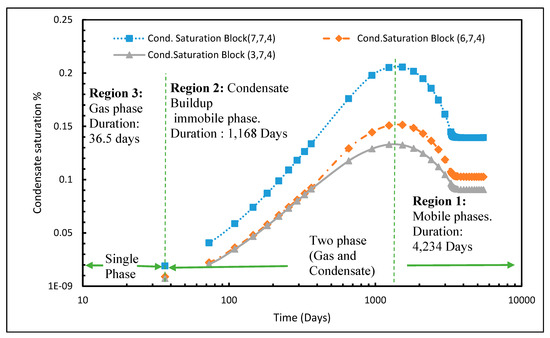
Figure 8.
Condensate saturation against time and cell block location (three locations) for base case showing the different phases for three distinct regions and locations during production.
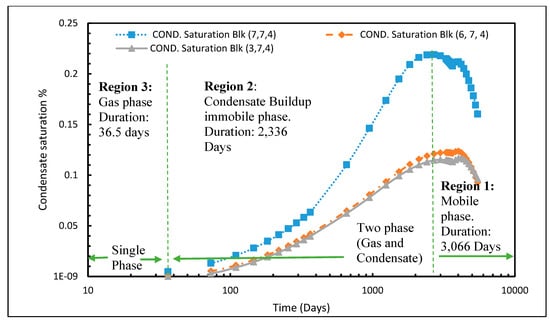
Figure 9.
Condensate saturation against time and cell block location three locations) for gas recycling showing the different phases for three distinct regions and locations during production.
Moreover, these figures show the duration of the gas phase (region 3), immobile phase (region 2) and mobile phase (region 1). The time required to attain maximum gas condensate formation for the base and gas recycling cases increases to 1533 and 2701 days respectively. In the water injection case, regions 1 and 2 diminish while region 3 is extended over the production lifetime, indicating that no condensate was observed in the reservoir.
The reduction in distance for the base and gas recycling cases also changes. Hence, no significant change in condensate saturation occurs away from the wellbore, which indicates that the phase change process occurs close to, or at, the wellbore. It is noted that a shorter time was taken to get to region 2 and a longer time to get to region 1 in the base case, as compared to gas recycling which takes longer to reach region 2 and less time to get to region 1.
3.3. Three-Dimensional (3D) Representation of Phase Change During Condensate Production
Figure 10 shows the condensate formation in the reservoir as a function of time and distance from the wellbore for the base case. The evaluated values of condensate formation from the wellbore region down to the dry gas region (single phase) from blocks (7, 7, 4) to (1, 7, 4) of the reservoirs are 0.02247, 0.00073, 0.00071, and 0.00025 at 109.5 days (equivalent to 3-time steps). At 1241 days (equivalent to 13-time steps), condensate saturation was observed to have increased to about 20%. Hence, a decline in condensate formation away from the wellbore and an increase towards the wellbore occurs as distance and time increase.
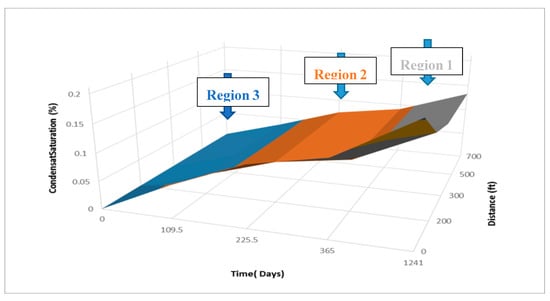
Figure 10.
3D evaluation of condensate formation against production time and distance from the wellbore.
The 3D plot also verifies the three regions as described by Fevang & Whitson 1996 [1]. In addition, it clearly shows the behaviour of the trends in saturation from one region to another.
4. Conclusions
- This study gives a better understanding of hydrocarbon phase change and behaviour in the reservoirs by tracking the timing of change and distance from the wellbore. This enables the production engineer to gain a better understanding of the situation for reservoir management and plan a suitable optimization technique for future production.
- The phase tracking approach that was used for the investigation of the gas condensate reservoir performance has not been used to evaluate gas condensate recovery in any previous study.
- A compositional study of gas condensate fluid flow was conducted to track the change in the composition of hydrocarbons, specifically C1 and C2-6 representing light and intermediate gas components during the production life of gas condensate reservoirs.
- Several scenarios were considered to validate the proposed technique and to determine the time of condensate banking as well as its distance from a well. This was also used as a guide to optimize condensate production. Typical scenarios such as water injection and gas recycling were also considered in studying condensate banking in this study.
- The results indicate that the further the distance away from the vicinity of the wellbore, the lower the effect of pressure drop on the cell grid. Cells closer to the wellbore experience the effect of pressure drop earlier as compared with the other cells. The liquid dropout is immobile until the critical saturation point is reached.
- To optimize the production from gas condensate reservoirs, the length and timing of region 3 need to be enhanced. In other words, the single-phase system in the reservoir needs to be extended. The application of water injection in regions 1 and 2 resulted in the highest condensate production amongst all other scenarios.
Author Contributions
Software, B.B.O., and B.U.; Supervision, S.R.G., P.R. and J.U.; Writing—original draft, B.B.O.; Writing—review & editing, S.R.G., P.R. and J.U.
Funding
This research received no external funding.
Acknowledgments
The authors wish to thank Teesside University for providing IT facilities to perform the reservoir modelling. They would also like to express their appreciation to the Petroleum Technology Development Fund (PTDF) in Nigeria for funding of the project.
Conflicts of Interest
The authors declare no conflict of interest regarding the publication of this paper.
References
- Fevang, O.; Whitson, C. Modeling gas-condensate well deliverability. SPE Reserv. Eng. 1996, 11, 221–230. [Google Scholar] [CrossRef]
- Mott, R. Calculating well deliverability in a gas condensate reservoir. In Proceedings of the EAGE—10th European Symposium on Improved Oil Recovery, Brighton, UK, 18–20 August 1999. [Google Scholar]
- Mott, R. Engineering calculation of gas condensate well productivity. Presented at the SPE Annual Technical Conference and Exhibition, San Antonio, TX, USA, 29 September–2 October 2002. [Google Scholar]
- Gringarten, A.; Al-lamki, A.; Daungkaew, S.; Mott, R.; Whittle, T. Well test analysis in gas-condensate reservoirs. Presented at the SPE Annual Technical Conference and Exhibition, Dallas, TX, USA, 1–4 October 2000. [Google Scholar] [CrossRef]
- Whitson, C.H.; Fevang, O.; Sævareid, A. Gas condensate relative permeability for well calculations. Presented at the SPE Annual Technical Conference and Exhibition, Houston, TX, USA, 3–6 October 2003. [Google Scholar] [CrossRef]
- Xiao, J.J.; Al-Muraikhi, A.J. A new method for the determination gas condensate well production performance. Presented at the SPE Annual Technical Conference and Exhibition, Houston, TX, USA, 26–29 September 2004. [Google Scholar]
- Shi, C.; Horne, R.N.; Li, K. Optimizing the productivity of gas condensate wells. Presented at the 2006 SPE Annual Technical Conference and Exhibition, San Antonio, TX, USA, 24–27 September 2006. [Google Scholar]
- Shi, C.; Horne, R.N. Improved recovery in gas-condensate reservoirs considering compositional variations. Presented at the SPE Annual Technical Conference and Exhibition, Denver, CO, USA, 21–24 September 2008. [Google Scholar] [CrossRef]
- Shi, C. Flow Behaviour of Gas-Condensate Wells. Ph.D. Thesis, Stanford University, Stanford, CA, USA, 2009. [Google Scholar]
- Seah, Y.H.; Gringarten, A.C.; Giddins, M.A.; Burtons, K. Optimizing recovery in gas condensate reservoirs. Presented at the SPE Asia Pacific Oil and Gas Conference, Adelaide, Australia, 14–16 October 2014. [Google Scholar]
- Ahmadi, M.; Sharifi, M.; Hashemi, A. Comparison of simulation method in gas condensate reservoirs. Pet. Sci. Technol. 2014, 32, 761–771. [Google Scholar] [CrossRef]
- Shi, J.; Huang, L.; Li, X.; Sepehrnoori, K. Production forecasting of a gas condensate well considering fluid phase behaviour in the reservoir and wellbore. J. Nat. Gas Sci. Eng. 2015, 24, 279–290. [Google Scholar] [CrossRef]
- Muskat, M. Condensate Reservoirs in Physical Principles of Oil Production, 1st ed.; McGraw-Hill Book: New York, NY, USA, 1949; pp. 738–809. [Google Scholar]
- O’Dell, H. Successfully cycling a low-permeability, high-yield gas condensate reservoir. J. Pet. Technol. 1967, 19, 41–47. [Google Scholar]
- Roebuck, I.F.; Henderson, G.E.; Doughlas, J. The composition reservoir simulator: Case IV—The Two-Dimensional model. Presented at the SPE Annual Fall Meeting, Houston, TX, USA, 29 September–2 October 1968. [Google Scholar]
- Fussell, D. Single-well performance predictions for gas condensate reservoirs. J. Pet. Technol. 1973, 25, 860–870. [Google Scholar] [CrossRef]
- Bourbiaux, B.J.; Limborg, S.G. An integrated experimental methodology for a better prediction of gas condensate flow behaviour. Presented at the SPE Annual Technical Conference and Exhibition, New Orleans, LA, USA, 25–28 September 1994. [Google Scholar]
- Kalaydjian, J.M.; Bourbiaux, B.J.; Lombard, J.M. Predicting gas-condensate reservoir performance: How flow parameters are altered when approaching production wells. Presented at the SPE Annual Technical Conference and Exhibition, Denver, CO, USA, 6–9 October 1996. [Google Scholar]
- Fevang, O. Gas Condensate Flow Behaviour and Sampling. Ph.D. Thesis, Norwegian Institute of Technology, Trondheim, Norway, 1995. [Google Scholar]
- Penuela, G.; Civan, F. Gas-condensate well test analysis with and without relative permeability curves. Presented at the SPE Annual Technical Conference and Exhibition, Dallas, TX, USA, 1–4 October 2000. [Google Scholar] [CrossRef]
- Roussennac, B. Gas Condensate Well Test Analysis. Master’s Thesis, Stanford University, Stanford, CA, USA, 2001. [Google Scholar]
- Wheaton, R.J.; Zhang, H.R. Condensate banking dynamics in gas condensate fields: Compositional changes and condensate accumulation around production wells. Presented at the SPE Annual Technical Conference and Exhibition, Dallas, TX, USA, 1–4 October 2000. [Google Scholar]
- Ayala, L.F.; Ertekin, T. Analysis of Gas Cycling Performance in Gas/Condensate Reservoirs Using Neuro-Simulation. Presented at the SPE Annual Technical Conference and Exhibition, Dallas, TX, USA, 9–12 October 2005. [Google Scholar]
- Shams, B.; Yao, J.; Zhang, K.; Zhang, L. Sensitivity analysis and economic optimization studies of inverted five-spot gas cycling in gas condensate reservoir. IOP Conf. Ser. Earth Environ. Sci. 2017, 15, 525–535. [Google Scholar] [CrossRef]
- Wang, M.; Chen, S.; Lin, M. Enhancing recovery and sensitivity studies in an unconventional tight gas condensate reservoir. Pet. Sci. 2018, 15, 305–318. [Google Scholar] [CrossRef]
- Su, Z.; Tang, Y.; Ruan, H.; Wang, Y.; Wei, X. Experimental and modeling study of CO2-Improved gas recovery in gas condensate reservoir. Petroleum 2017, 3, 87–95. [Google Scholar] [CrossRef]
- Qiu, X.; Tan, S.P.; Dejam, M.; Adidharma, H. Simple and accurate isochoric differential scanning calorimetry measurements: Phase transitions for pure fluids and mixtures in nanopores. Phys. Chem. Chem. Phys. 2019, 21, 224–231. [Google Scholar] [CrossRef] [PubMed]
- Qiu, X.; Tan, S.P.; Dejam, M.; Adidharma, H. Novel isochoric measurement of the onset of vapor-liquid phase transition using differential scanning calorimetry. Phys. Chem. Chem. Phys. 2018, 20, 26241–26248. [Google Scholar] [CrossRef] [PubMed]
- Kenyon, D. Third SPE comparative solution project: Gas cycling of retrograde condensate reservoirs. J. Pet. Technol. 1987, 39, 981–997. [Google Scholar] [CrossRef]

© 2019 by the authors. Licensee MDPI, Basel, Switzerland. This article is an open access article distributed under the terms and conditions of the Creative Commons Attribution (CC BY) license (http://creativecommons.org/licenses/by/4.0/).