Article

Numerical Investigation of Cylindrical Water Droplets Subjected to Air Shock Loading at a High Weber Number

by
F. Edoardo Taglialatela
and
Giuliano De Stefano
*
Engineering Department, University of Campania Luigi Vanvitelli, Via Roma 29, 81031 Aversa, Italy
*
Author to whom correspondence should be addressed.
Fluids 2025, 10(4), 81; https://doi.org/10.3390/fluids10040081
Submission received: 19 January 2025 / Revised: 12 March 2025 / Accepted: 23 March 2025 / Published: 25 March 2025
(This article belongs to the Special Issue 10th Anniversary of Fluids—Recent Advances in Fluid Mechanics)

Abstract

:
This work is devoted to the computational investigation of the deformation and breakup of cylindrical water bodies in the high-speed airflow behind incident shock waves. Both single-column and tandem-column configurations in various arrangements were simulated by reproducing the shock/droplet interaction process in a shock-tube device. The calculations were conducted by using a third-party solver recently developed for compressible two-phase flows in the framework of the open source finite volume toolbox OpenFOAM. The numerical approach is based on the use of the volume-of-fluid method to resolve the phase interface, where a particular discretization technique allows us to prevent unphysical instabilities. The numerical scheme makes use of more precise information of the local propagation speeds to maintain a high resolution and a small numerical viscosity. Qualitative and quantitative comparisons of the results with reference experimental and numerical data demonstrated good agreement for the main characteristics of the interaction process in terms of the morphology, dynamics, and breakup of the deforming water bodies.

1. Introduction

Upon sudden exposure to post-shock high-speed airflow, liquid droplets undergo deformation and fragmentation, which defines a physical phenomenon commonly referred to as aerobreakup. This phenomenon has various important applications in fluid science and technology, including the combustion and detonation of multiphase mixtures, rain erosion damage, powder atomization, and many others, e.g., [1,2]. For instance, erosion due to the impact of water droplet fragments poses a significant challenge to supersonic aircraft and missiles flying in adverse weather conditions [3]. Despite the occurrence in many practical fluid engineering processes, theoretical and applied research in the aerobreakup of liquid droplets is still ongoing.
The cataloging of physical mechanisms involved in aerobreakup primarily relies on two non-dimensional parameters, namely the Ohnesorge number ( Oh )
Oh = μ ρ σ d 0 ,
which compares liquid viscosity and surface tension effects, and the Weber number ( We )
We = ρ g u g 2 d 0 σ .
which compares the disruptive aerodynamic force impacting acceleration and the restorative surface tension force. In the above definitions, μ and ρ are the dynamic viscosity and density of the liquid phase, with d 0 representing the undeformed droplet diameter; σ stands for the surface tension coefficient; ρ g and u g are the post-shock gas density and speed [4]. However, at low Ohnesorge numbers ( Oh < 0.1 ), the influence of viscosity can be neglected, and the process is essentially governed by the Weber number [5]. The classification of aerobreakup regimes, as defined by the latter parameter, holds considerable importance, not only due to its representation of fundamental physical principles, but also because it determines the quantitative features of the cloud of sub-droplets originating from the parent droplet fragmentation. The various regimes are indeed identified by a specific range of We , with transitions occurring at particular critical values. Classically, the breakup process is divided into five distinct regimes based on the droplet morphology, denoted as follows: vibrational breakup, bag breakup, multimode breakup, sheet thinning breakup, and catastrophic breakup, being defined together with their associated transition criteria. More recently, Theofanous and Li [6] argued that the classical catastrophic breakup actually represents an artifact of the poor quality of shadowgraph visualizations. Therefore, also based on this fact, a simpler new classification was proposed, depending on hydrodynamic instabilities responsible for incipient droplet breakup [7,8,9]. The reclassification consists of only two regimes, which are Rayleigh–Taylor piercing (RTP), corresponding to the range 10 < We < 10 2 , and shear-induced entrainment (SIE), for We > 10 3 . Practically, at low Weber numbers, Rayleigh–Taylor instability has to be considered the driving mechanism for aerobreakup, whereas, at high values of We , the phenomenon is caused by significant shear-induced motions that cause the stripping of liquid filaments from a droplet’s surface.
Since the interaction between the air shock front and a liquid droplet’s surface represents the fundamental initial stage of the breakup process, several studies have been conducted to correctly understand this particular phase through both experiments and numerical simulations. As far as experiments are concerned, a very common setup is represented by a shock-tube device where a traveling planar shock wave is produced. The shock front impacts the water surface, causing the observed drift, deformation, and consequent breakup of droplets [10]. In these experiments, the involvement of cylindrical liquid bodies facilitates the enhanced visualization of complex wave structures [11,12,13]. In addition, during the early stages of interaction, generally, the deformation patterns observed in cylindrical droplets closely resemble those of three-dimensional spherical ones [14,15].
Moreover, a significant number of computational works have focused on simulations of shock-tube experiments, e.g., Refs. [16,17], demonstrating a widespread interest in the wave systems emerging from the shock–droplet interaction. Particularly, various computational fluid dynamics (CFD) studies have dealt with two-dimensional configurations, e.g., Refs. [18,19], where the process of sheet thinning has been simulated and the resulting deformation of cylindrical droplets quantified. Apart from the most common single-column configuration, some investigations have involved two identical water columns in tandem. The tandem disposition that has been typically explored corresponds to the streamwise arrangement, for which experimental data are also available [20], while the cross-stream tandem configuration has been numerically investigated [21]. Usually, these studies have concentrated on the initial stages of droplet aerobreakup while overlooking the influences of surface tension and molecular viscosity, e.g., Refs. [4,13].
Remarkably, the accurate simulation of the droplet aerobreakup induced by shock wave loading involves a numerical approximation of complex mathematical models, including compressible subsonic and supersonic viscous flows, coupled with non-ideal gas equations of state. In particular, the presence of spurious oscillations at the air–water interface, as a result of discontinuous fluid properties, represents a common issue for interface capturing methods used in numerical investigations [22].
In the above, very challenging context, the primary objective of this study was to computationally assess the initial stages of droplets’ aerobreakup, induced by a traveling air shock wave, by employing a novel CFD solver recently developed in the framework of the open-source library OpenFOAM. The proposed pressure-based solver for compressible two-phase viscous flows utilizes the algebraic volume-of-fluid (VOF) method to resolve the gas–liquid interface, along with a sophisticated numerical technique, to calculate the flow properties in the space region where both phases are present simultaneously [23]. The VOF approach is used owing to its proven robustness in handling large density ratios without requiring explicit interface reconstruction. This is particularly advantageous when dealing with complex deformation dynamics. Unlike other techniques such as the level set method, the VOF technique does not require reinitialization, thus improving computational efficiency, e.g., [24]. In fact, the particular numerical scheme adopted allows for an accurate simulation of interfacial flows regardless of the local flow regime, either subsonic or supersonic, while effectively controlling unwanted unphysical oscillations in the interface region [25].
In the present research, the overall numerical approach was evaluated in two spatial dimensions, focusing on the aerobreakup of cylindrical water columns [11]. The shock–droplets interaction was simulated within a virtual shock-tube device with controlled thermo-fluid dynamic conditions. The various computations were carried out under a shear-stripping regime that is characterized by high Weber and low Ohnesorge numbers. Notably, viscous and surface tension effects were not neglected in the current simulations. The two-phase flow diagnostics include both qualitative and quantitative analyses concerning the incipient breakup phase. Specifically, the drift and deformation of the water bodies induced by the shock wave passage were analyzed for both single-column and tandem-column configurations, making detailed comparisons against reference data provided by both experimental and numerical studies.
The rest of the paper is organized as follows. In Section 2, the proposed approach for two-phase compressible flow simulation is introduced, including governing equations, the computational model, and the case study’s description. The particular OpenFOAM-based CFD solver is briefly presented in Section 3, where the main numerical settings are provided. The various results of the different simulations are made known and discussed in Section 4. Finally, some concluding remarks are made in Section 5.

2. Two-Phase Flow Simulation

In this section, after briefly reviewing the compressible two-phase flow governing equations, the proposed computational model and the particular case study are introduced.

2.1. Governing Equations

The motion of the evolving fluid, which is treated as a pure mixture, is described by the reduced mathematical model proposed by Kapila et al. [26]. The method actually stems from the density-based Baer–Nunziato model for two-phase detonation-to-deflagration transition [27], while reducing the number of governing variables by means of an asymptotic reduction. This procedure leads to the existence of single velocity and pressure fields for both phases, allowing for the suppression of undesired pressure oscillations at the interface region. The resulting system of hyperbolic equations is particularly suitable for describing the evolution of multi-component mixtures of immiscible fluids [28], where the temperature disequilibrium is described by means of proper thermal equations of state. Specifically, for a liquid–gas mixture, the compressible flow governing equations may be written as follows:
ρ t + · ( ρ u ) = 0 ,
( ρ u ) t + · ( ρ u u ) = p + · τ ,
( ρ E ) t + · [ ( ρ E + p ) u ] = · ( τ · u ) ,
( α ρ ) t + · ( α ρ u ) = 0 ,
α t + · ( α u ) = α · u + K · u ,
where α and α g represent the volume fraction of liquid and gas phases, respectively, with α + α g = 1 . In these equations, u stands for the mixture velocity vector; ρ and p are the mixture density and pressure; τ represents the viscous stress tensor; E stands for the mixture’s total energy, which is the sum of internal and kinetic energies. Moreover, the interface compression (positive) coefficient K is expressed as follows:
K = α α g ( Z Z g ) α Z + α g Z g ,
where Z = ρ a 2 and Z g = ρ g a g 2 are the acoustic impedances, with a and a g standing for the associated sound speeds [25]. The physical model is coupled with the Fourier law for heat flux and the Newton–Stokes assumption for the viscous stress tensor. As far as the thermodynamic closure is concerned, the above system of governing equations is solved for the mixture’s pressure and temperature, while the mixture’s density is determined as follows:
ρ = α ρ + α g ρ g ,
where the two different density fields are evaluated through the following definitions:
ρ = ρ 0 + p M R T , ρ g = p M g R T ,
with M and M g representing the associated molar masses. Both relations in (10) originate from the stiffened gas equation of state [29]. However, while the liquid phase retains the constant reference term ρ 0 , the gas phase is treated as perfect.

2.2. Computational Model

The present two-dimensional computational model emulates the experimental works involving cylindrical water droplets in shock-tube devices. Using the initial column diameter d 0 as a natural reference length, the rectangular physical domain Ω is defined by 24 < x / d 0 < 96 and 30 < y / d 0 < 30 , with the origin being placed at the center of the front column. The large size of the domain is prescribed so as to allow for a sufficiently long simulation, practically preventing secondary waves originating from the reflection at the boundaries from altering the flow conditions both within the space region and during the time period of interest.
Initially, a virtual diaphragm placed upstream of the water bodies divides the computational domain into two different regions, which are denoted here by the subscripts 1 and 4. The corresponding flow geometry is schematically illustrated in Figure 1, for example, for the tandem flow configuration.
The two different sections contain still air ( u 1 = u 4 = 0 ) at the same temperature ( T 4 / T 1 = 1 ) and at very different pressures and densities ( ρ 4 / ρ 1 = p 4 / p 1 1 ). Starting from these initial conditions, a planar shock front develops and travels at velocity V S toward the driven section of the tube, while a set of expansion waves propagate in the opposite direction toward the driver section. Very importantly, the initial conditions can be prescribed to produce a well-defined post-shock airflow that interacts with the water bodies. Specifically, given and knowing the shock compression ratio β = p 2 / p 1 to be reproduced (with subscripts 1 and 2 denoting pre-shock and post-shock states), one can exploit the following analytical expression for the initial pressure ratio:
p 4 p 1 = β 1 ( γ 1 ) ( β 1 ) 4 γ 2 + 2 γ ( γ + 1 ) ( β 1 ) 2 γ γ 1 ,
where γ stands for the specific heat ratio, e.g., [30].
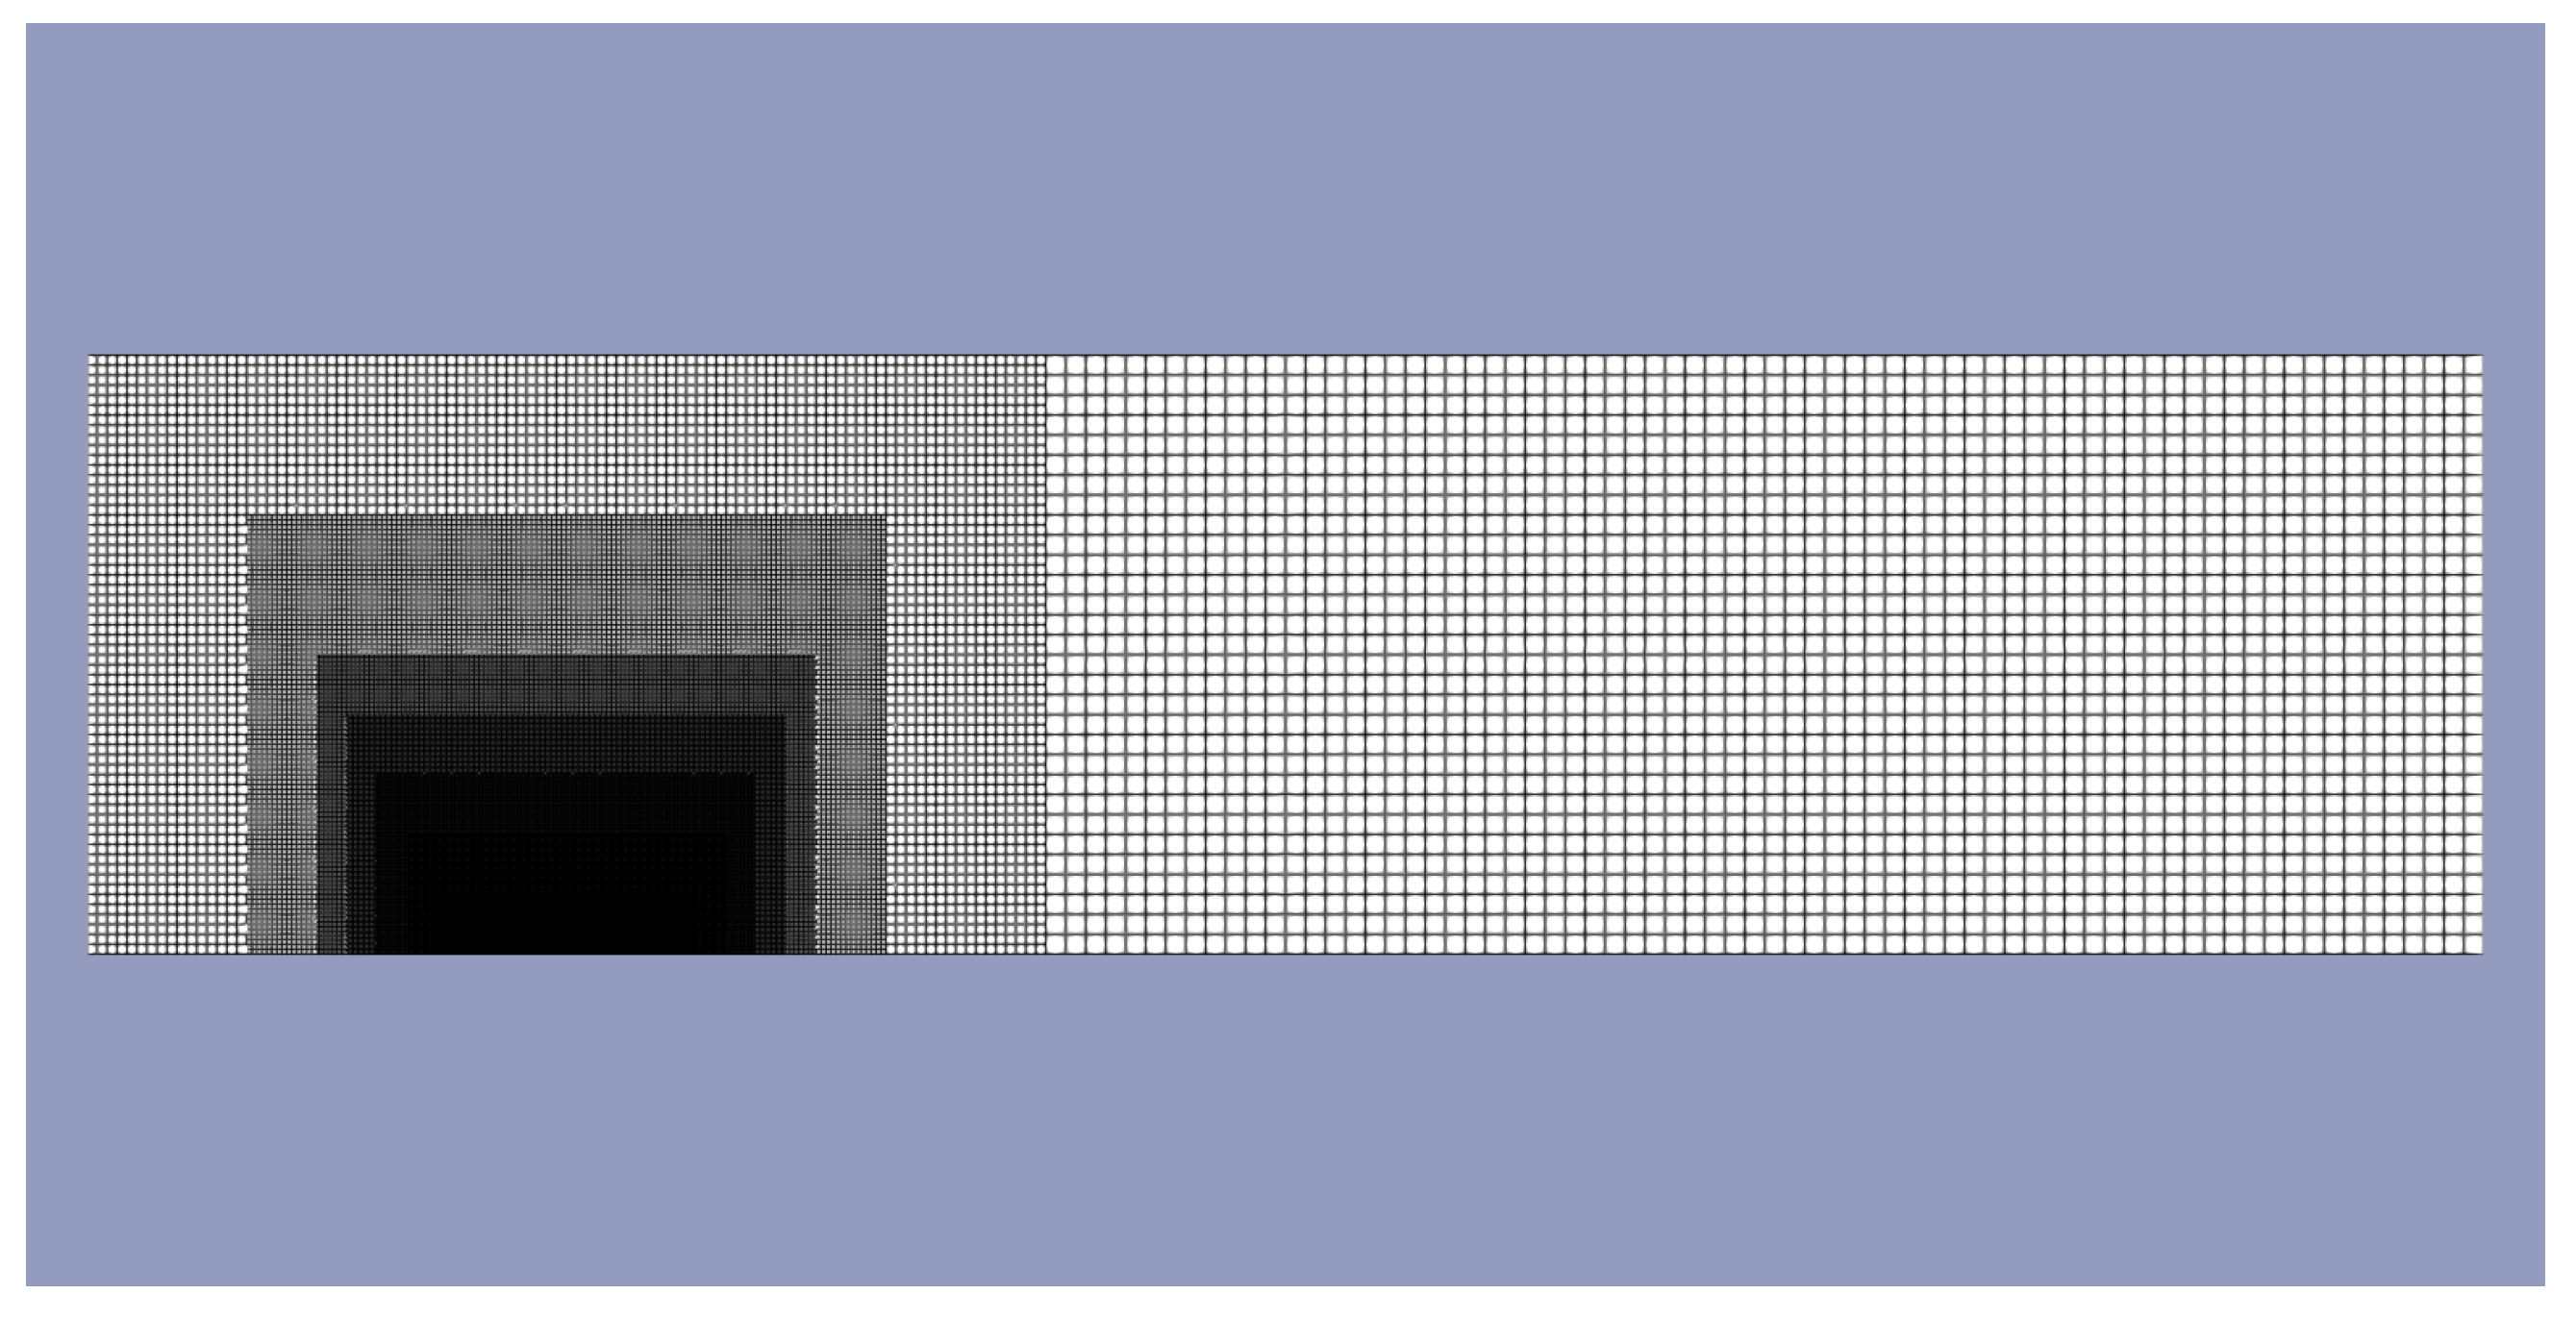
As far as the meshing procedure is concerned, the computational domain is initially discretized by using a structured uniform mesh made of square elements. Then, multiple nested refinement regions are defined in the interaction zone, where the local spatial resolution is gradually increased by constantly halving the cell size in both directions, up to the required degree of resolution. The achieved non-uniform grid resolution is maintained during the various simulations. Figure 2 shows a sketch of the overall numerical grid, where half the computational domain is illustrated, for simplicity. It is worth noting that, unlike in similar numerical studies [4,13,16,30], where the flow symmetry condition was imposed at the centerline ( y = 0 ), the present calculations were conducted in the entire computational domain Ω . With such an extension, the complex non-symmetric flow structures developing after the shock passage can be fully reproduced. The finest spatial resolution that was adopted corresponds to 128 cells-per-diameter (CPD), while the associated total number of cells resulted in being around 2.2 million. Finally, in terms of the boundary conditions adopted for the different flow variables, they are summarized in Table 1 using the OpenFOAM naming convention.

2.3. Case Study

As previously discussed, a virtual diaphragm initially divides the computational domain into driver and driven sections. The particular initial conditions used in the present simulations, which are summarized in Table 2, lead to a planar shock front traveling at a velocity V S = 505   m / s , with a shock Mach number M s = 1.47 , representing one of the most commonly adopted configurations in aerobreakup studies, e.g., [31]. The associated compression ratio is β = 2.35 . Note that, since the post-shock pressure exceeds the water saturation pressure at the post-shock temperature, the water body does not undergo a phase change. However, localized reductions in the pressure field may require the implementation of a cavitation model [32], which is outside the scope of the current study.
Following previous experimental and numerical works, the initial diameter of the water columns was set to d 0 = 4.8 mm. Moreover, given the reference density ρ 0 = 998   kg / m 3 and viscosity μ 0 = 1.0 × 10 3   Pa · s for the liquid phase, together with the surface tension coefficient σ = 0.072   N / m , the non-dimensional parameters (1) and (2) took the following values: Oh = 1.70 × 10 3 and We = 7.41 × 10 3 , while the Reynolds number is Re = 1.07 × 10 5 . These particular conditions are consistent with the SIE regime, as confirmed by experimental findings, e.g., Ref. [6].

3. Numerical Method

The present simulations were conducted utilizing the open source CFD library OpenFOAM, based on the finite volume (FV) approach [33]. Specifically, the third-party solver vofTwoPhaseCentralFoam recently developed by Kraposhin and co-workers [34] was employed. The two-phase compressible flow governing equations are directly resolved without supplying the solution with any turbulence closure model, following analogous numerical studies [4,13,16]. The present pressure-based solver is specially designed for compressible two-phase viscous flows using the hybrid Kurganov–Noelle–Petrova (KNP)/PIMPLE method for convective fluxes [25]. The basic idea actually comes from the original work by Kurganov and Tadmor [35], who developed a new family of central schemes that can be implemented as black-box solvers for general hyperbolic conservation laws. These schemes lead to high-resolution computations, showing a much smaller numerical viscosity, when compared to classical central schemes. In the hybrid formulation, the fluxes are evaluated combining two different approaches by means of a suitable blending function. Basically, the standard PIMPLE scheme is applied in zones where the flow is within the subsonic range, and the acoustic Courant number can be far exceeding unity. On the other hand, the KNP scheme is utilized wherever the local flow regime is supersonic to avoid inconvenient numerical oscillations. The two-phase flow governing equations presented in Section 2.1 are discretized in the conservative form and solved for velocity and pressure variables, with the density being evaluated by means of Equations (9) and (10).
Importantly, the acoustically conservative interface discretization (ACID) technique is used for mass, momentum, and energy balances near the interface, where the method helps to prevent unphysical instabilities. Practically, the discretization scheme results in the continuous behavior of primitive variables on the contact discontinuities [23], thus representing the solution to a common issue for interfacial flows [22]. In fact, the ACID method allows for the correct propagation, reflection, and transmission of acoustic waves at the interface, with the accurate capturing and prediction of shocks and rarefaction fans, including shock–interface interactions. In addition, this technique provides a consistent definition of fluid properties at the interface, including a unique determination of speed-of-sound and Rankine–Hugoniot relations. Note that the method is independent of the technique adopted to advect the interface surface, such as the currently used VOF, other than the level set method, e.g., Ref. [36]. Also, the transport equation for the liquid phase volume fraction (7) is solved using the multidimensional universal limiter with the explicit solution approach, which grants boundedness and monotonicity of the solution. As far as the time integration is concerned, the implicit first-order Euler scheme is used for the present computations, where the adaptive time step is determined by setting to 0.15 the maximum Courant–Friedrich–Lewy number. Using monotonicity-preserving numerical schemes (KNP and ACID) for the solution near discontinuities, the proposed hybrid algorithm provides several advantages over other computational techniques, like pure implicit pressure–based or explicit Godunov schemes [25].
Notably, the present method can be effectively used in conjunction with possible models for surface tension and turbulence effects that are usually employed in second-order FV codes. Moreover, employing the pressure equation for the mixture mass balance positively impacts the overall robustness of the numerical integration scheme. In particular, various validation cases are considered in Ref. [25], where mesh independence studies are presented, and criteria for the stability of computations are discussed, also making the comparison against a standard OpenFOAM solver. The interested reader is referred to the cited works for further details concerning the proposed hybrid scheme and its practical implementation.

4. Results

4.1. Shock-Tube Flow

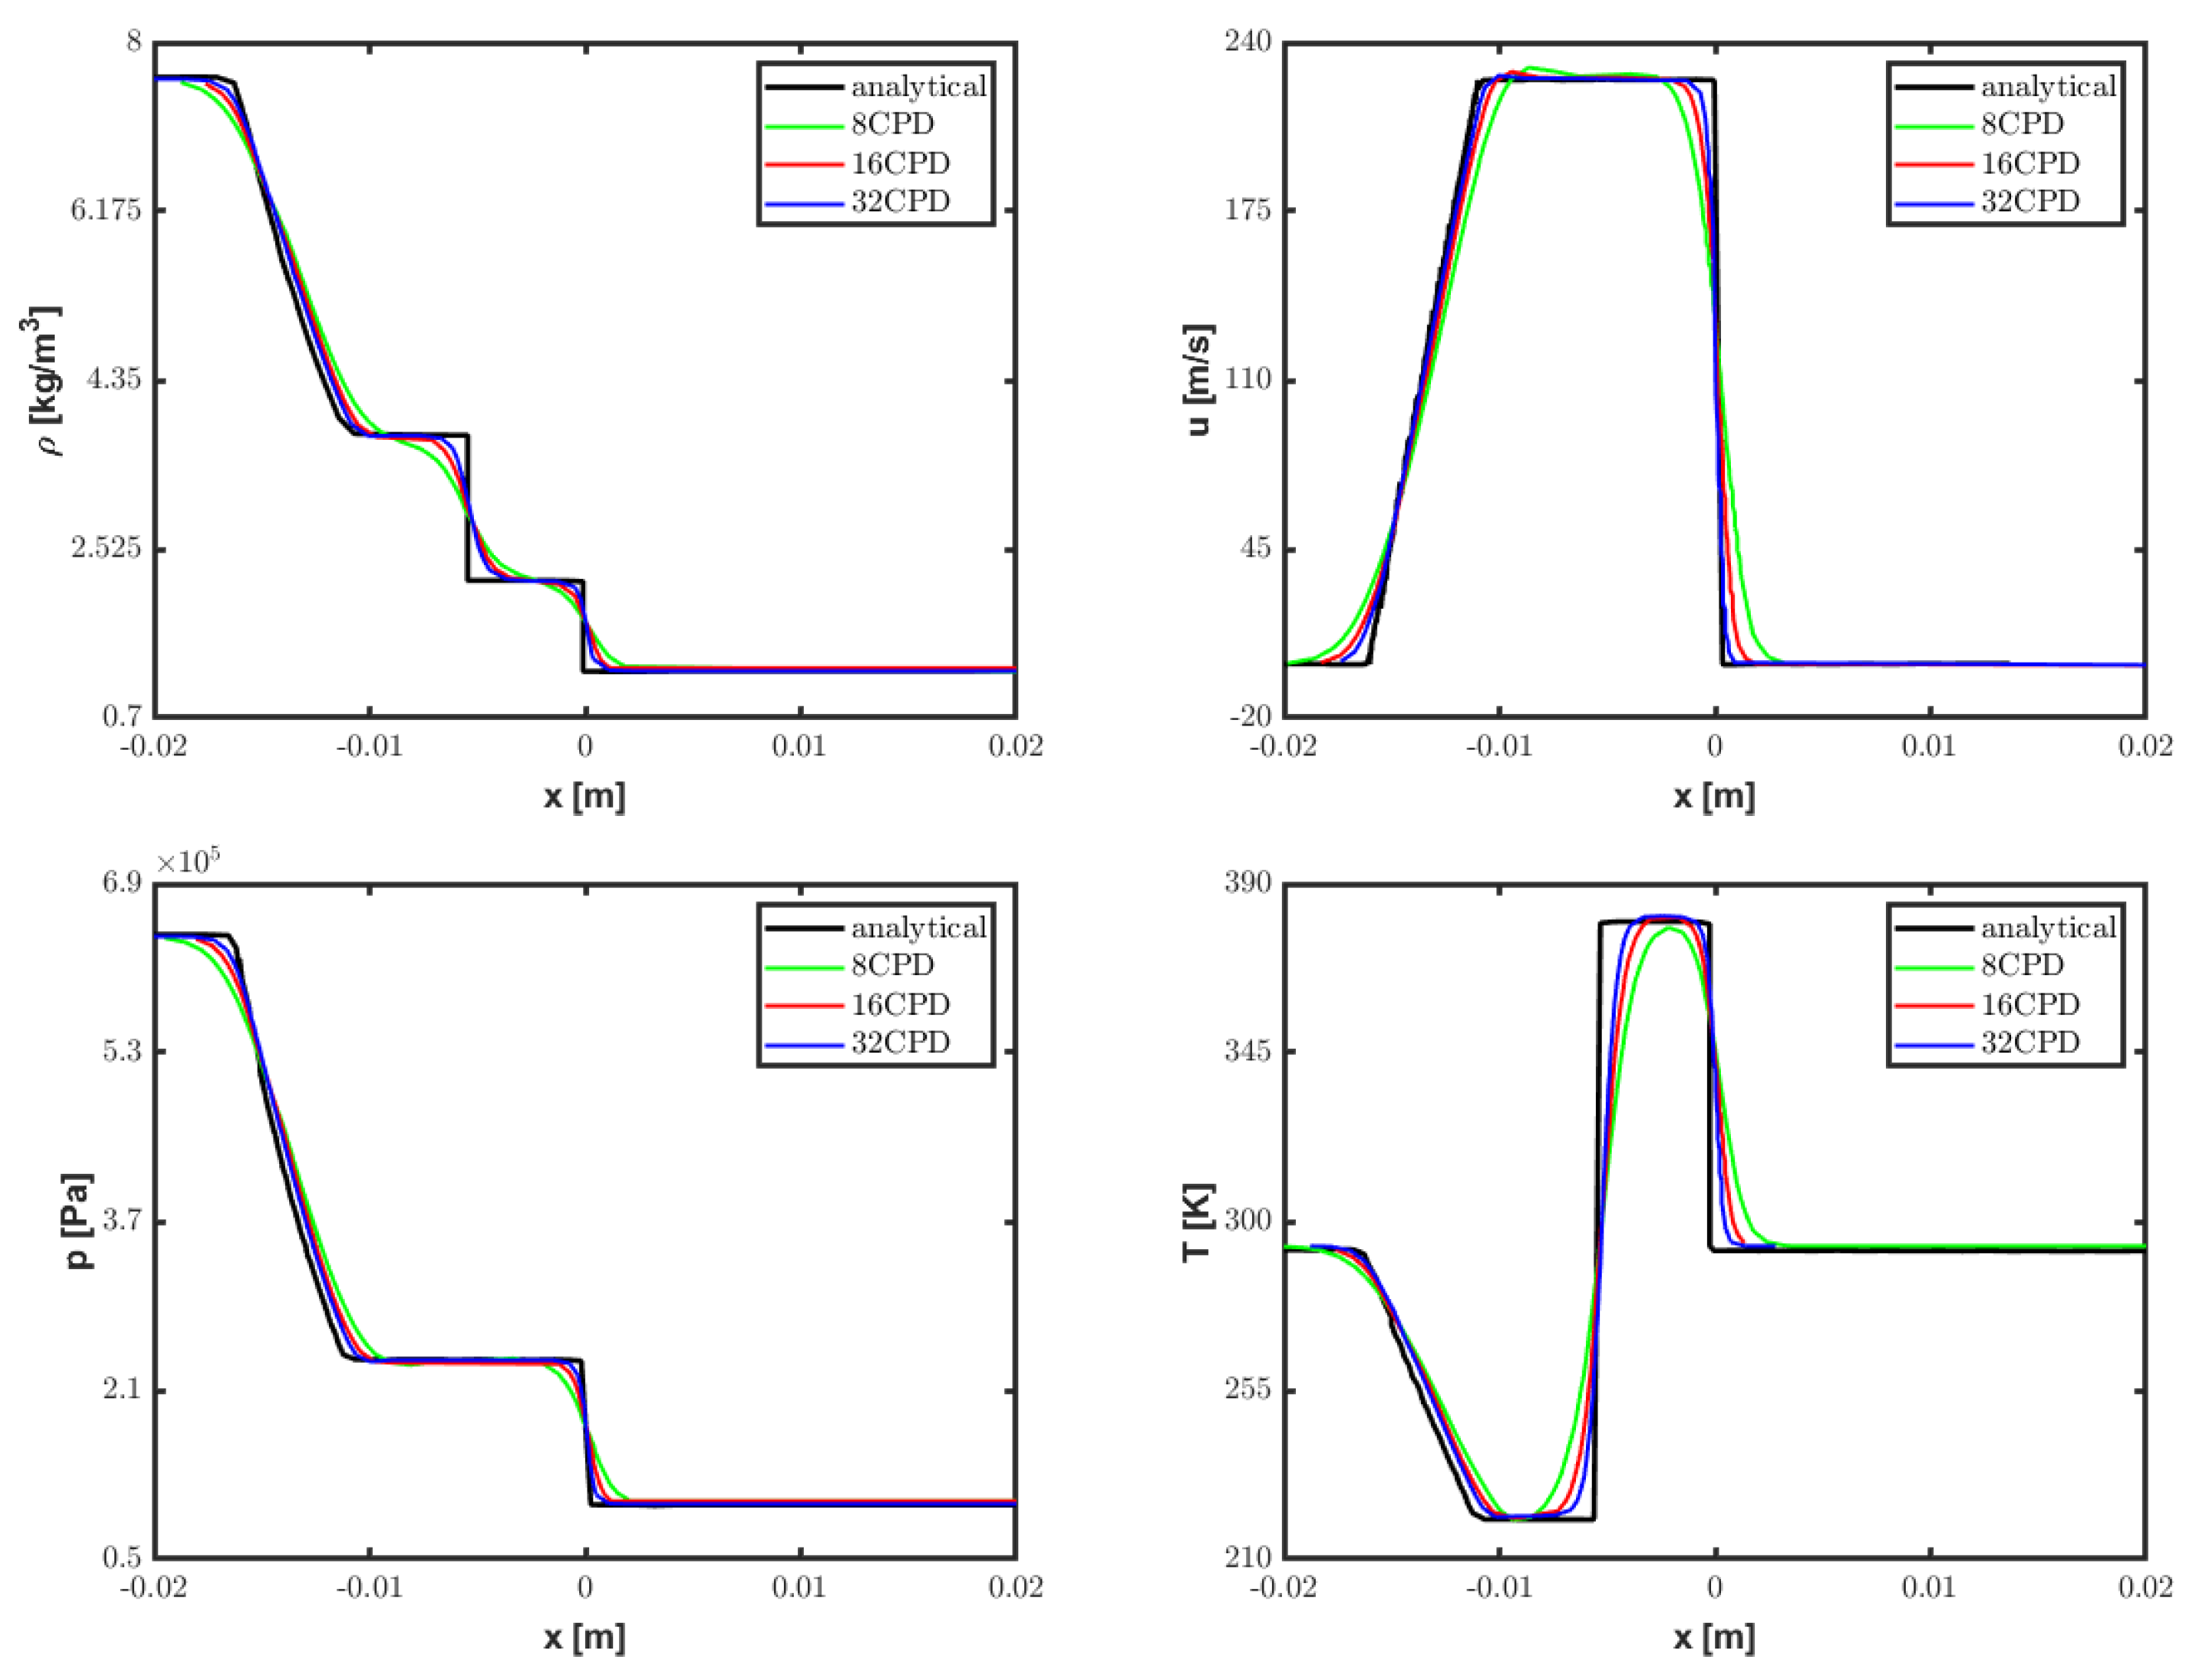
For the case study introduced in Section 2.3, the post-shock airflow conditions experienced by the water bodies were initially verified by simulating the classical Sod problem for a shock-tube flow [37]. Specifically, a preliminary computation was performed in the absence of liquid droplets in order to reproduce the particular airstream conditions summarized in Table 3. The results of the grid convergence analysis, conducted for varying spatial resolutions, are shown in Figure 3 in terms of density, velocity, pressure, and temperature profiles along the tube axis. Note that, at the time instant considered, the shock front is located at x = 0 while traveling in the positive x-axis direction. Also, the continuous variation of thermo-fluid dynamic conditions for 0.02 < x < 0.01 corresponds to the train of expansion waves traveling in the opposite direction. The ideal non-viscous theoretical solution is correctly approached by increasing the resolution from 8 to 32 CPD, with the latter parameter representing the number of grid cells across the initial droplet diameter that will be used for the aerobreakup simulations.

4.2. Single-Column Configuration

When simulating the shock–droplets interaction process, the initial distance between the positions of the virtual diaphragm and front water body was empirically demonstrated to represent a crucial parameter. To correctly replicate the experimental conditions, as demonstrated by the following quantitative analysis, the optimal value corresponding to 40 d 0 was eventually selected. In the following discussions, as is common practice for aerobreakup studies, the temporal variable is non-dimensionalized using the inertial time scale, namely
t * = u 2 d 0 ( t t 0 ) .
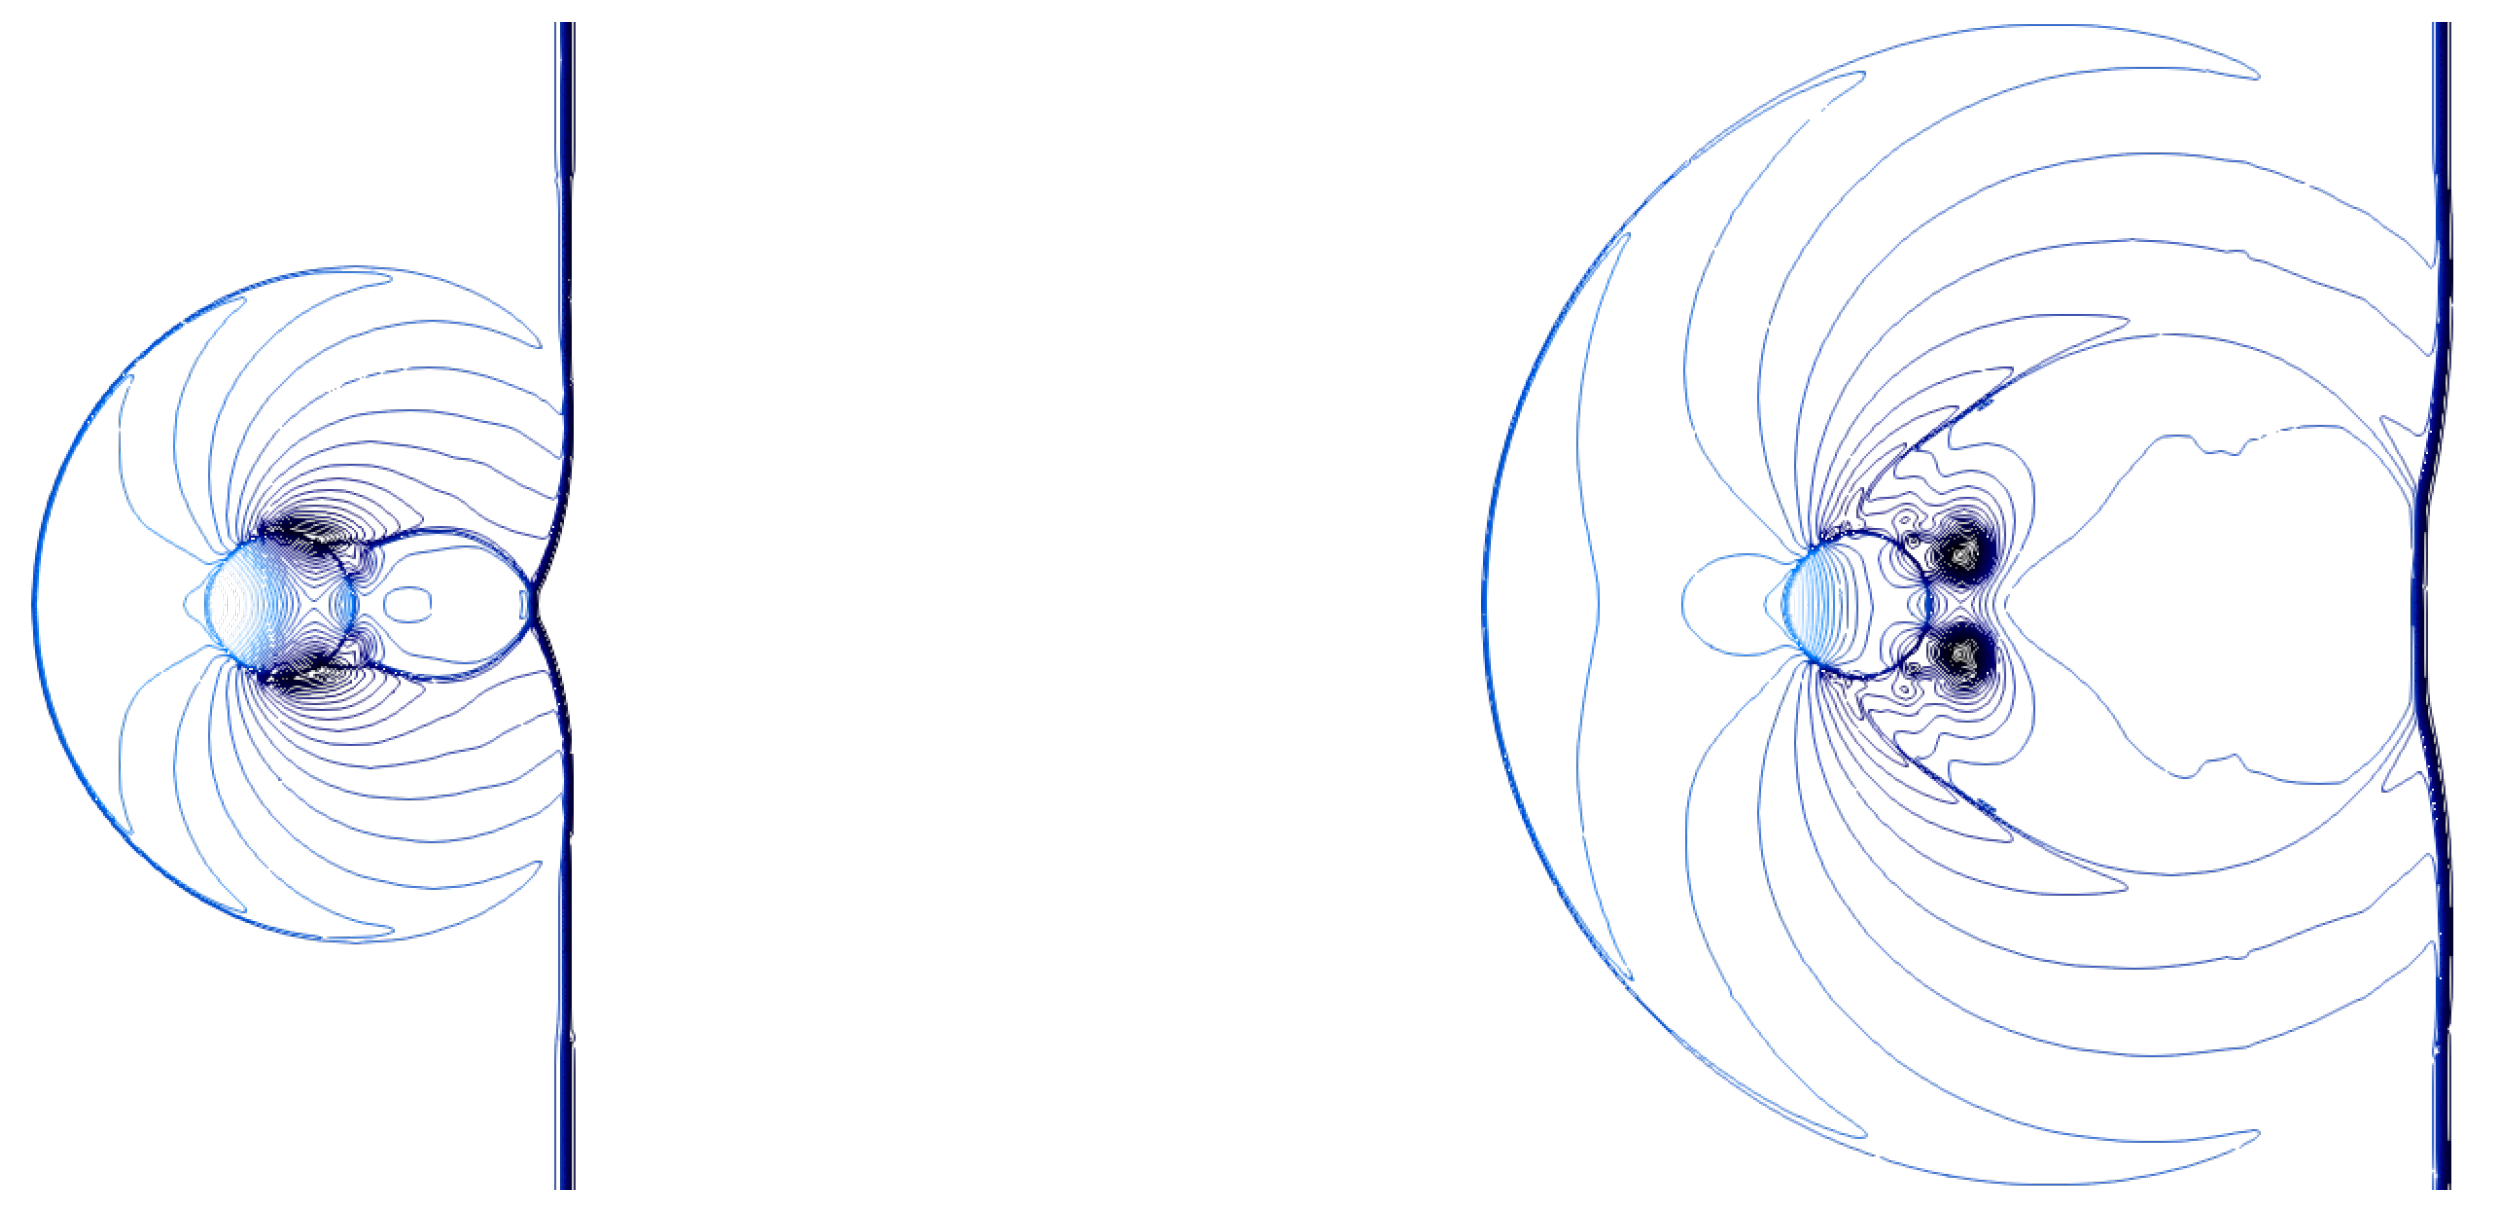
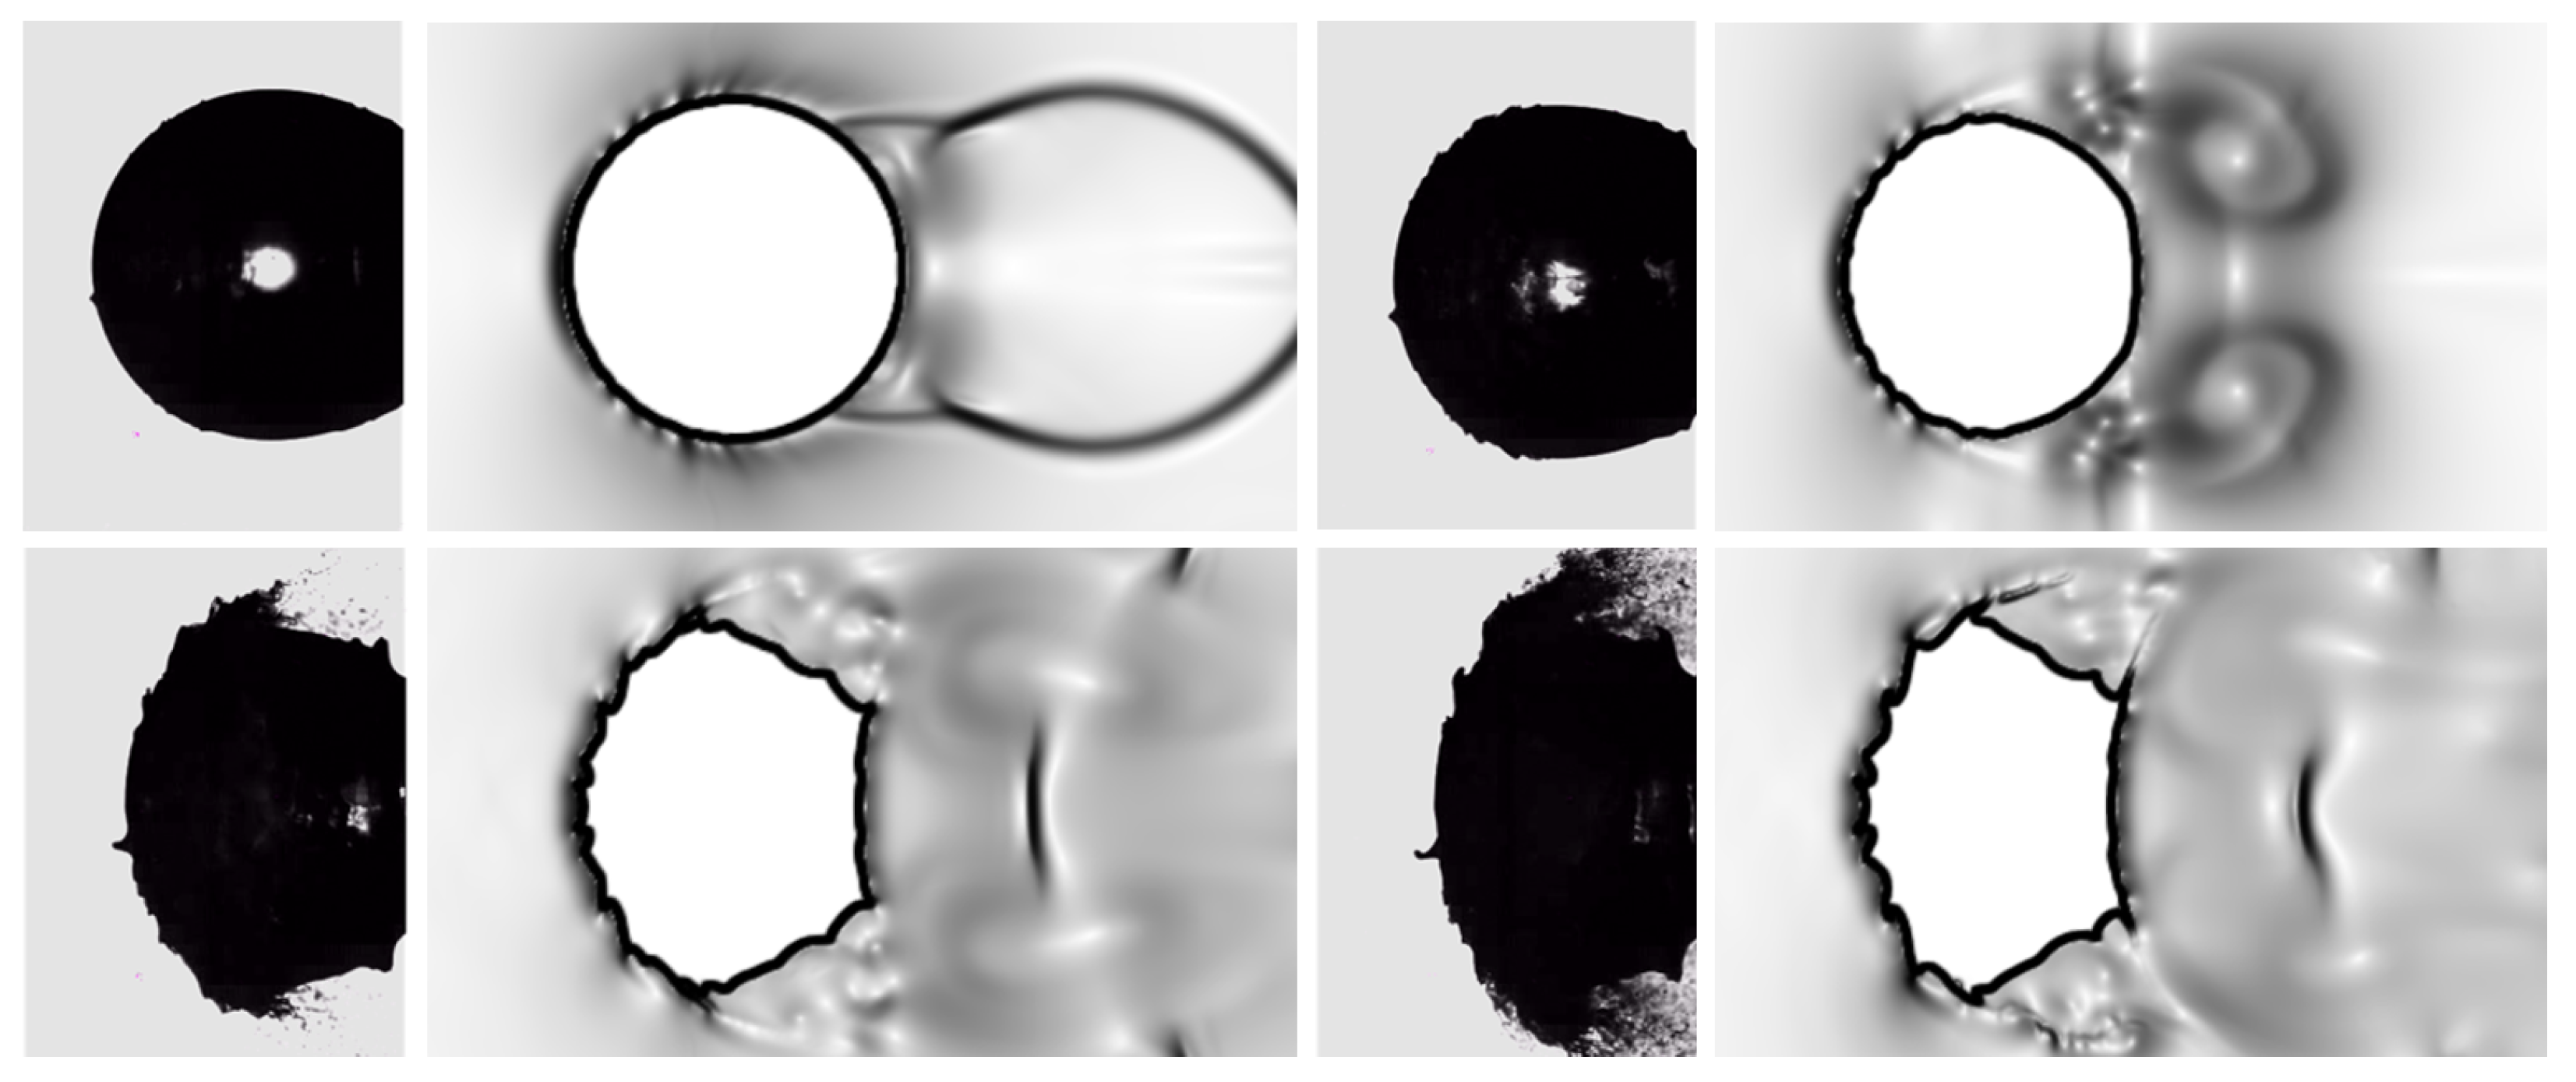
and measured starting from the time instant of the impact t 0 . The present numerical solution is able to accurately predict the complex compressible flow structures observed in the experiments [11]. For instance, in Figure 4, the interaction process is visualized by depicting the gas phase isopycnic lines, which can be compared to [11] (pages 225 and 226), whereas Figure 5 shows numerical Schlieren contours at various time instants. Herein, the numerical Schlieren variable measuring the density gradient magnitude is defined by
Φ = exp k ρ max { ρ } ,
where k is a user-defined scaling parameter [38]. Remarkably, all these pictures match quite well with the corresponding experimental images reported in Ref. [39].
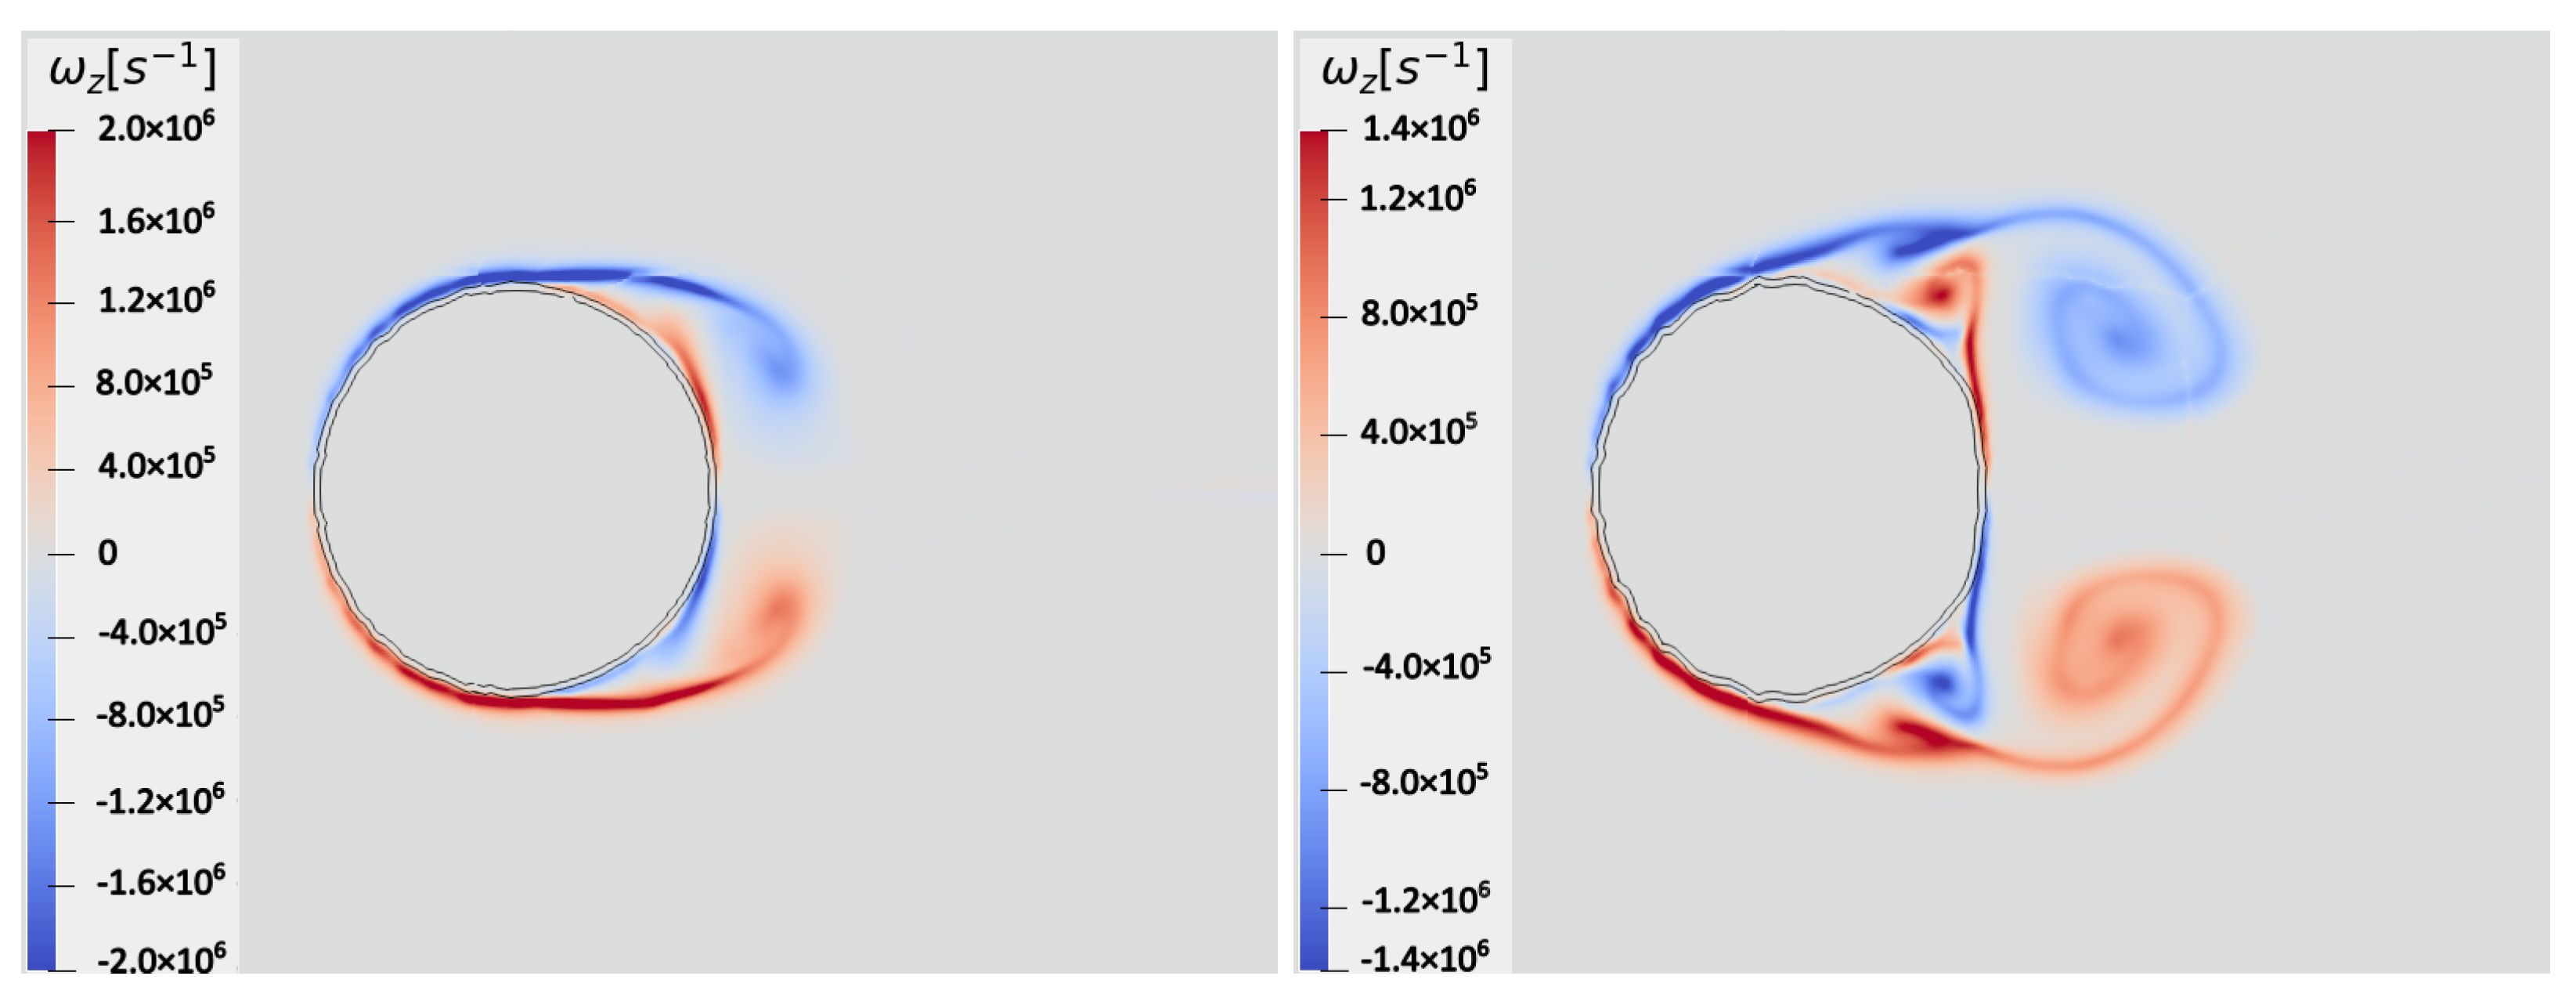
Since pressure waves travel faster in water than air, owing to differences in impedance, the transmitted waves through the droplet reach the leeward side of the column earlier, transmitting as expansion waves at the water/air interface. When these expansion waves merge with the original shock wave, Mach stems are created. A triple point is then formed at the intersection of the incident wave, reflected wave, and Mach stem on each side of the cylindrical droplet. Confirming what was found in recent analogous works [39,40], two distinct recirculation zones were observed at the early stages of the interaction. The first zone was found near the cylinder’s equator, where two counteracting streams from the front and rear stagnation points interact, while the second one was observed in the wake region, resembling the Kármán vortex street. Indeed, the corresponding streams with opposite vorticity lead to the mechanism initiating the stripping breakup regime, with the combined effects of recirculation and high pressure causing the droplet deformation into the classical cupcake shape. The genesis and evolution of the baroclinic vortex pair is visible in Figure 6, where the vorticity contours are depicted at two different time instants. By inspection of this picture, the current solution practically resembles the numerical solution in Ref. [4]. Herein, the two lines at a constant liquid volume fraction corresponding to α = 0.5 and 0.99 diversely identify the interface between the two immiscible fluids. According to Ref. [6], the smoothness of the interface can be attributed to the stability of the predicted stagnation region, as the only surface instabilities are represented by the stretched sheets on the periphery of the droplet.
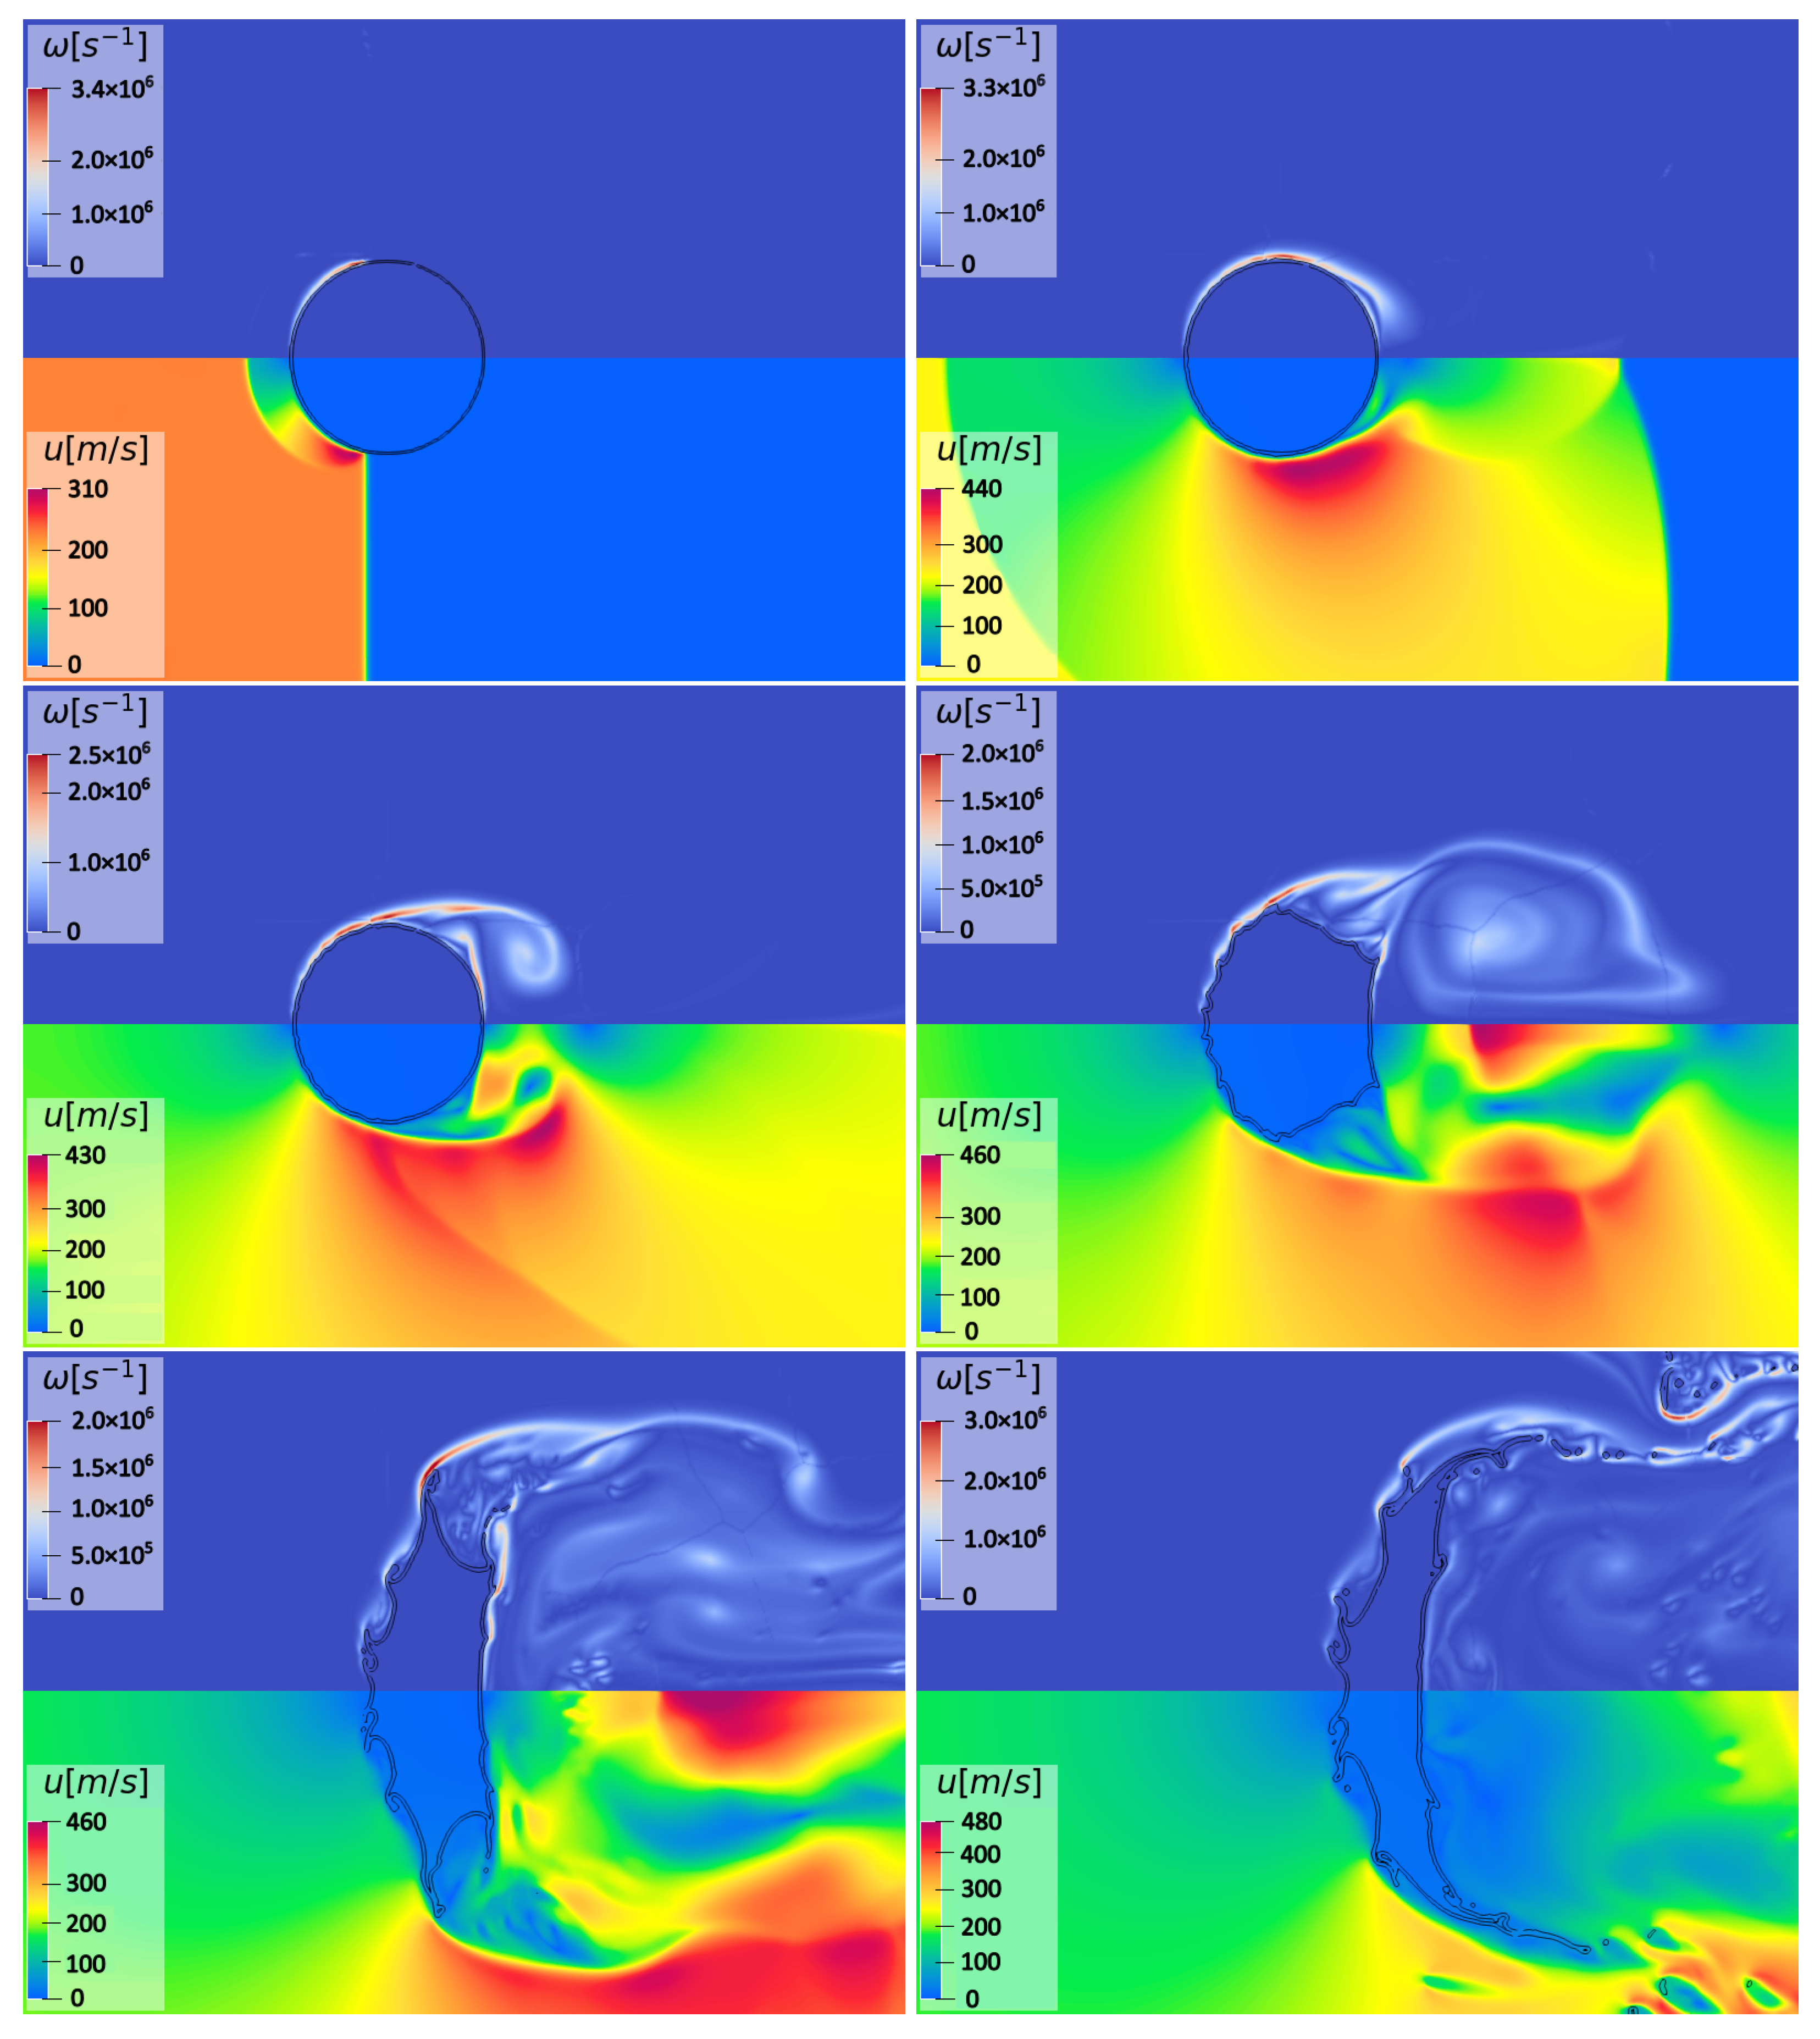
During the early stages of interaction, due to the pressure gradient between the front and rear sides, the column is flattened in the streamwise direction. The droplet deformation is illustrated in Figure 7, where the vorticity and velocity contours are depicted for six different time instants in the range 0.23 < t * < 20 . The snapshots also include the two curves at a constant liquid volume fraction. To better visualize the droplet drift and deformation, these various pictures correspond to the same subdomain, approximately corresponding to | x | / d 0 < 4.5 , and | y | / d 0 < 3.25 . The peripheral part of the water column is continuously eroded, with sub-droplets being stripped from the original coherent phase, and widely distributed in the wake region. When the droplet is deformed enough, a third upstream equatorial recirculation region appears due to local surface ripples. Such aspect can be seen in the last snapshot of the figure, specifically at the flow region between the front stagnation point and the cylinder equator. Also, the characteristic lip formation observable in Figure 7 bears resemblance to what was observed in Ref. [19] using a different numerical method. These results confirm the qualitative features of the so-called shear-stripping breakup mechanism, which typically occurs at high We numbers, under the SIE regime, where the proposed numerical scheme is proven to be effective in predicting the complex interfacial flow.
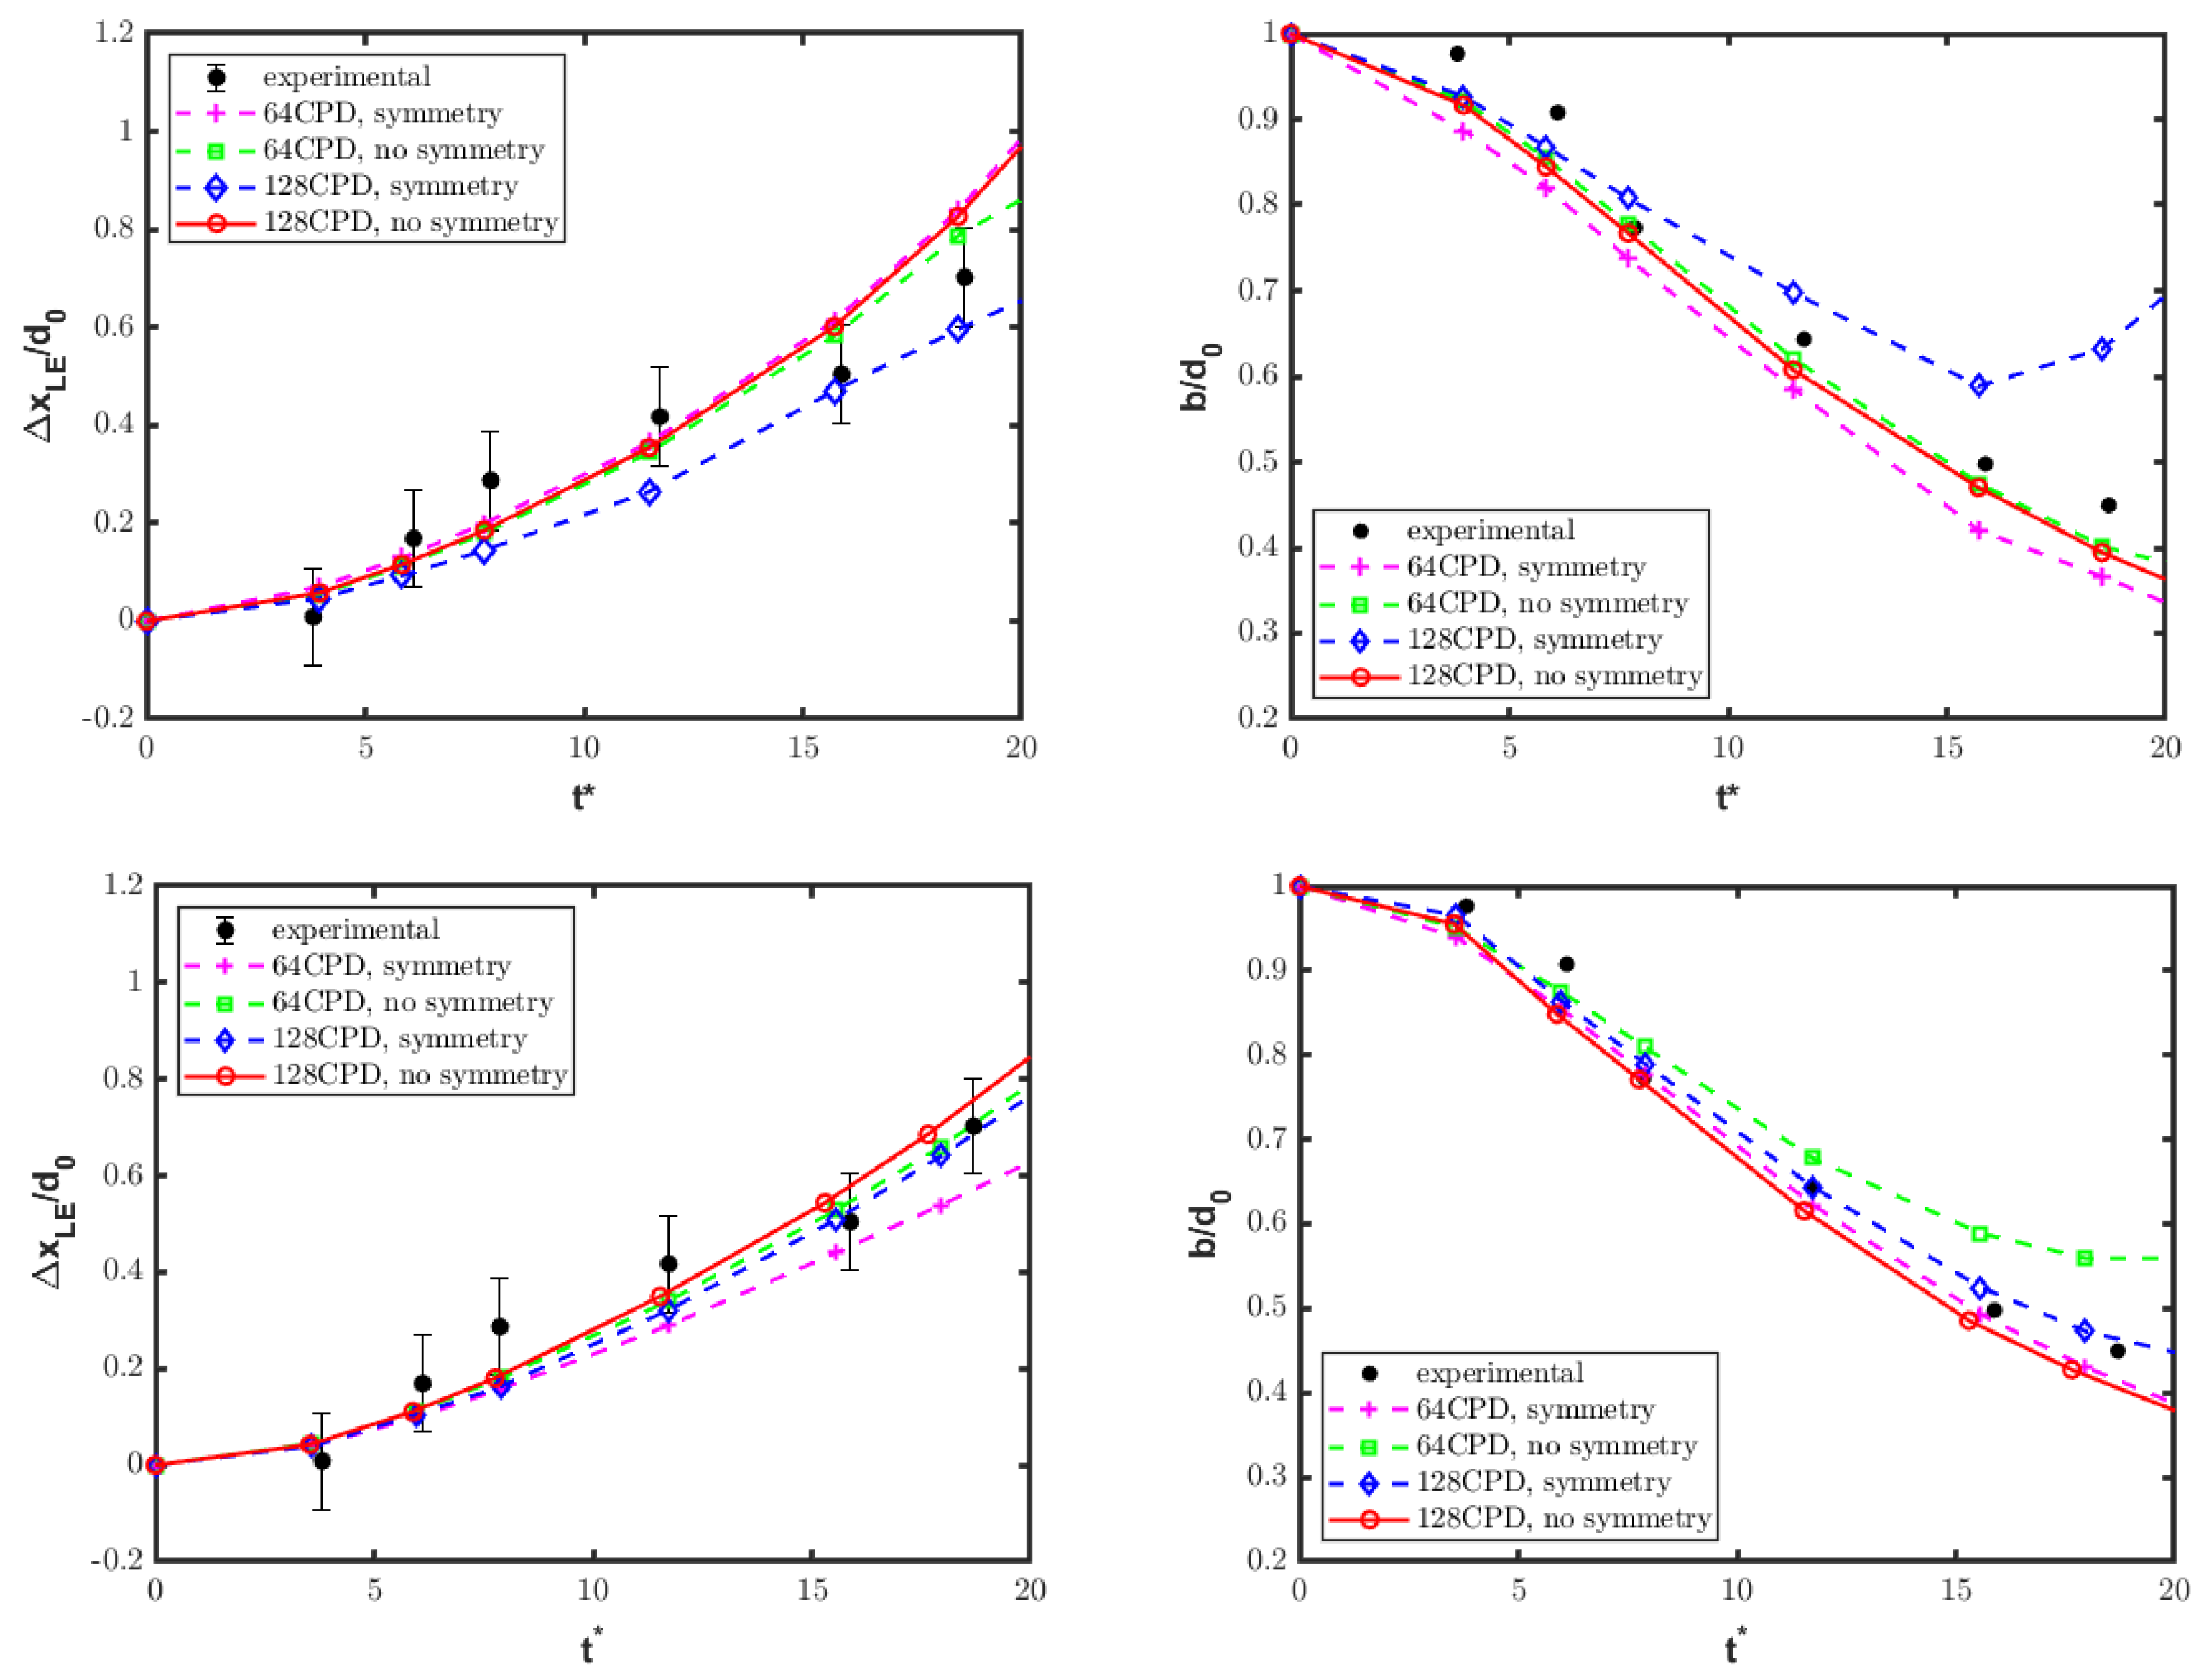
The numerical solution for the single-column configuration is further analyzed from a quantitative viewpoint. The drift and deformation of the water column are determined in terms of a time-dependent leading edge displacement Δ x LE and streamwise extent b, normalized by the initial column diameter d 0 . As the interface is slightly diffused due to numerics, the evolution of these two parameters is determined by an inspection of the isolines at α = 0.5 and 0.99 . Figure 8 shows the corresponding time histories for various numerical solutions compared against experimental findings [11]. By inspection of these pictures, one can see the influence of varying the spatial resolution (from 64 CPD to 128 CPD), as well as the initial diaphragm–droplet separation (from 20 d 0 to 40 d 0 ). In addition, the solutions corresponding to both approaches, with and without imposing the commonly used symmetry condition at the centerline ( y = 0 ), are reported. In general, the resolution corresponding to 128 CPD is sufficient to match the reference experimental data, while using 256 CPD was found not to substantially increase the accuracy of the numerical results. The removal of the symmetry condition allows us to better match the experiment for a longer time period, since physically meaningful non-symmetric flow structures can be reproduced.
Furthermore, the droplet kinematics are examined by evaluating the displacement and velocity of the center-of-mass (CM), which are defined as
x cm = Ω α ρ x d Ω Ω α ρ d Ω ,
u cm = Ω α ρ u d Ω Ω α ρ d Ω .
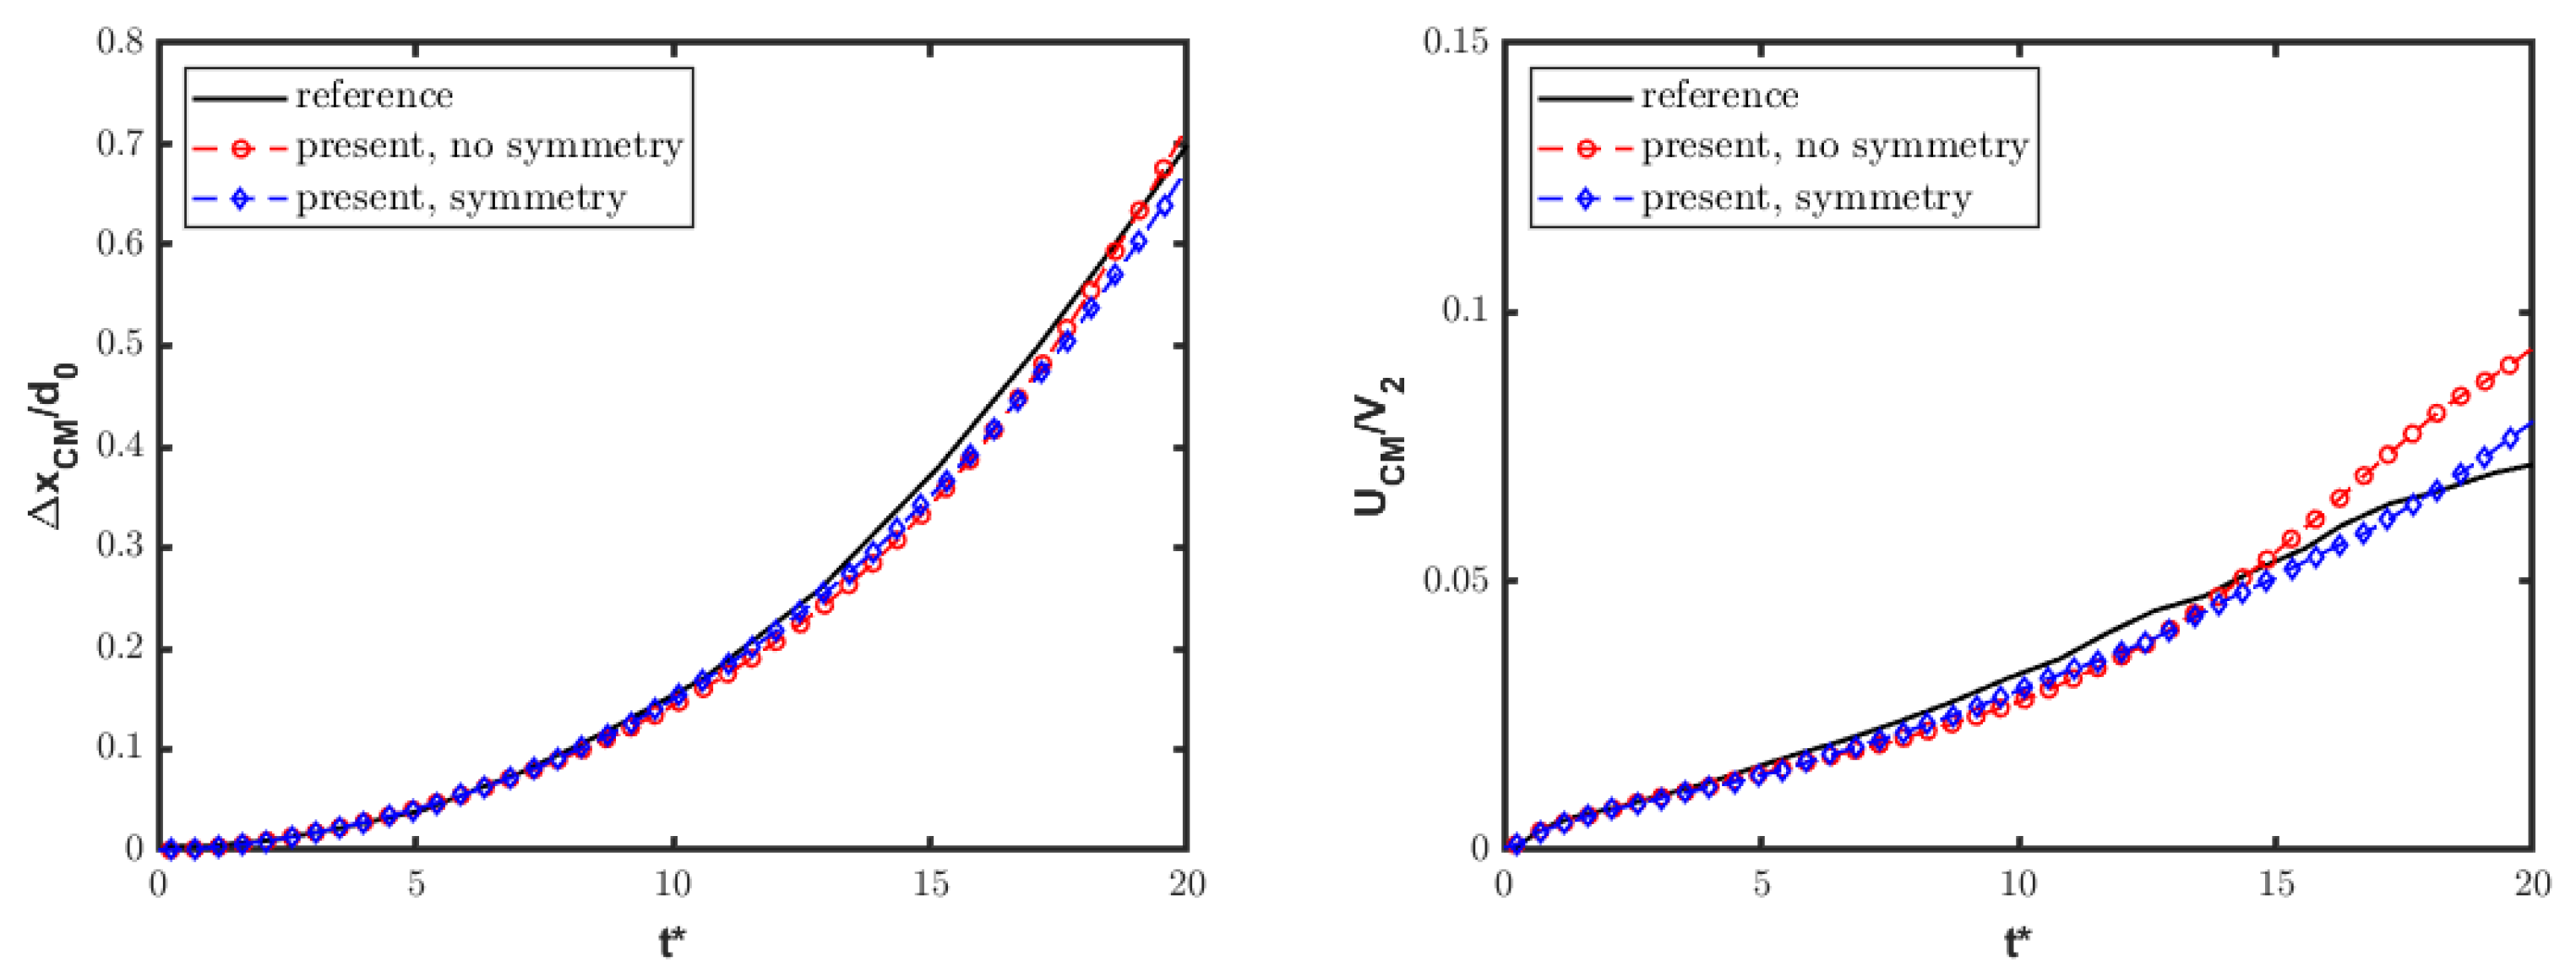
and calculated in the OpenFOAM framework by utilizing ad hoc coded functions that are evaluated at each time step during the simulation. Figure 9 shows the corresponding time histories for the computations with 128 CPD and the initial separation of 40 d 0 . The present solution well matches the numerical data in Ref. [4], where the symmetry condition was imposed. However, the proposed scheme provides a thinner interface between the two immiscible fluids. Also, the current results confirm the numerical analysis presented in Ref. [19] in terms of the droplet leading edge and CM displacements. In the present work, however, a coarser grid is employed, implying a smaller computational effort.

4.3. Tandem-Column Configurations

In this study, two different tandem-column configurations were investigated, where the droplets were disposed in either a streamwise or a spanwise direction. Specifically, two water cylinders with identical initial diameters d 0 = 4.8   mm were placed inside the virtual shock-tube test section while being loaded by a traveling shock wave at a Mach number M s = 1.47 . Practically, the airflow conditions are those reported in Table 3. The computations were performed with the initial diaphragm–droplets separation of 40 d 0 using the maximum spatial resolution of 128 CPD in the flow region of interest.

4.3.1. Streamwise Disposition

Regarding the streamwise arrangement, the columns were initially placed at a center-to-center distance of 30 mm , following the experimental configuration in Ref. [20]. From a qualitative perspective, the complex shock–columns interaction is illustrated in Figure 10, where the comparison between numerical Schlieren pictures and double-exposure holographic interferometry images provided by the reference experiment is made at two different time instants.
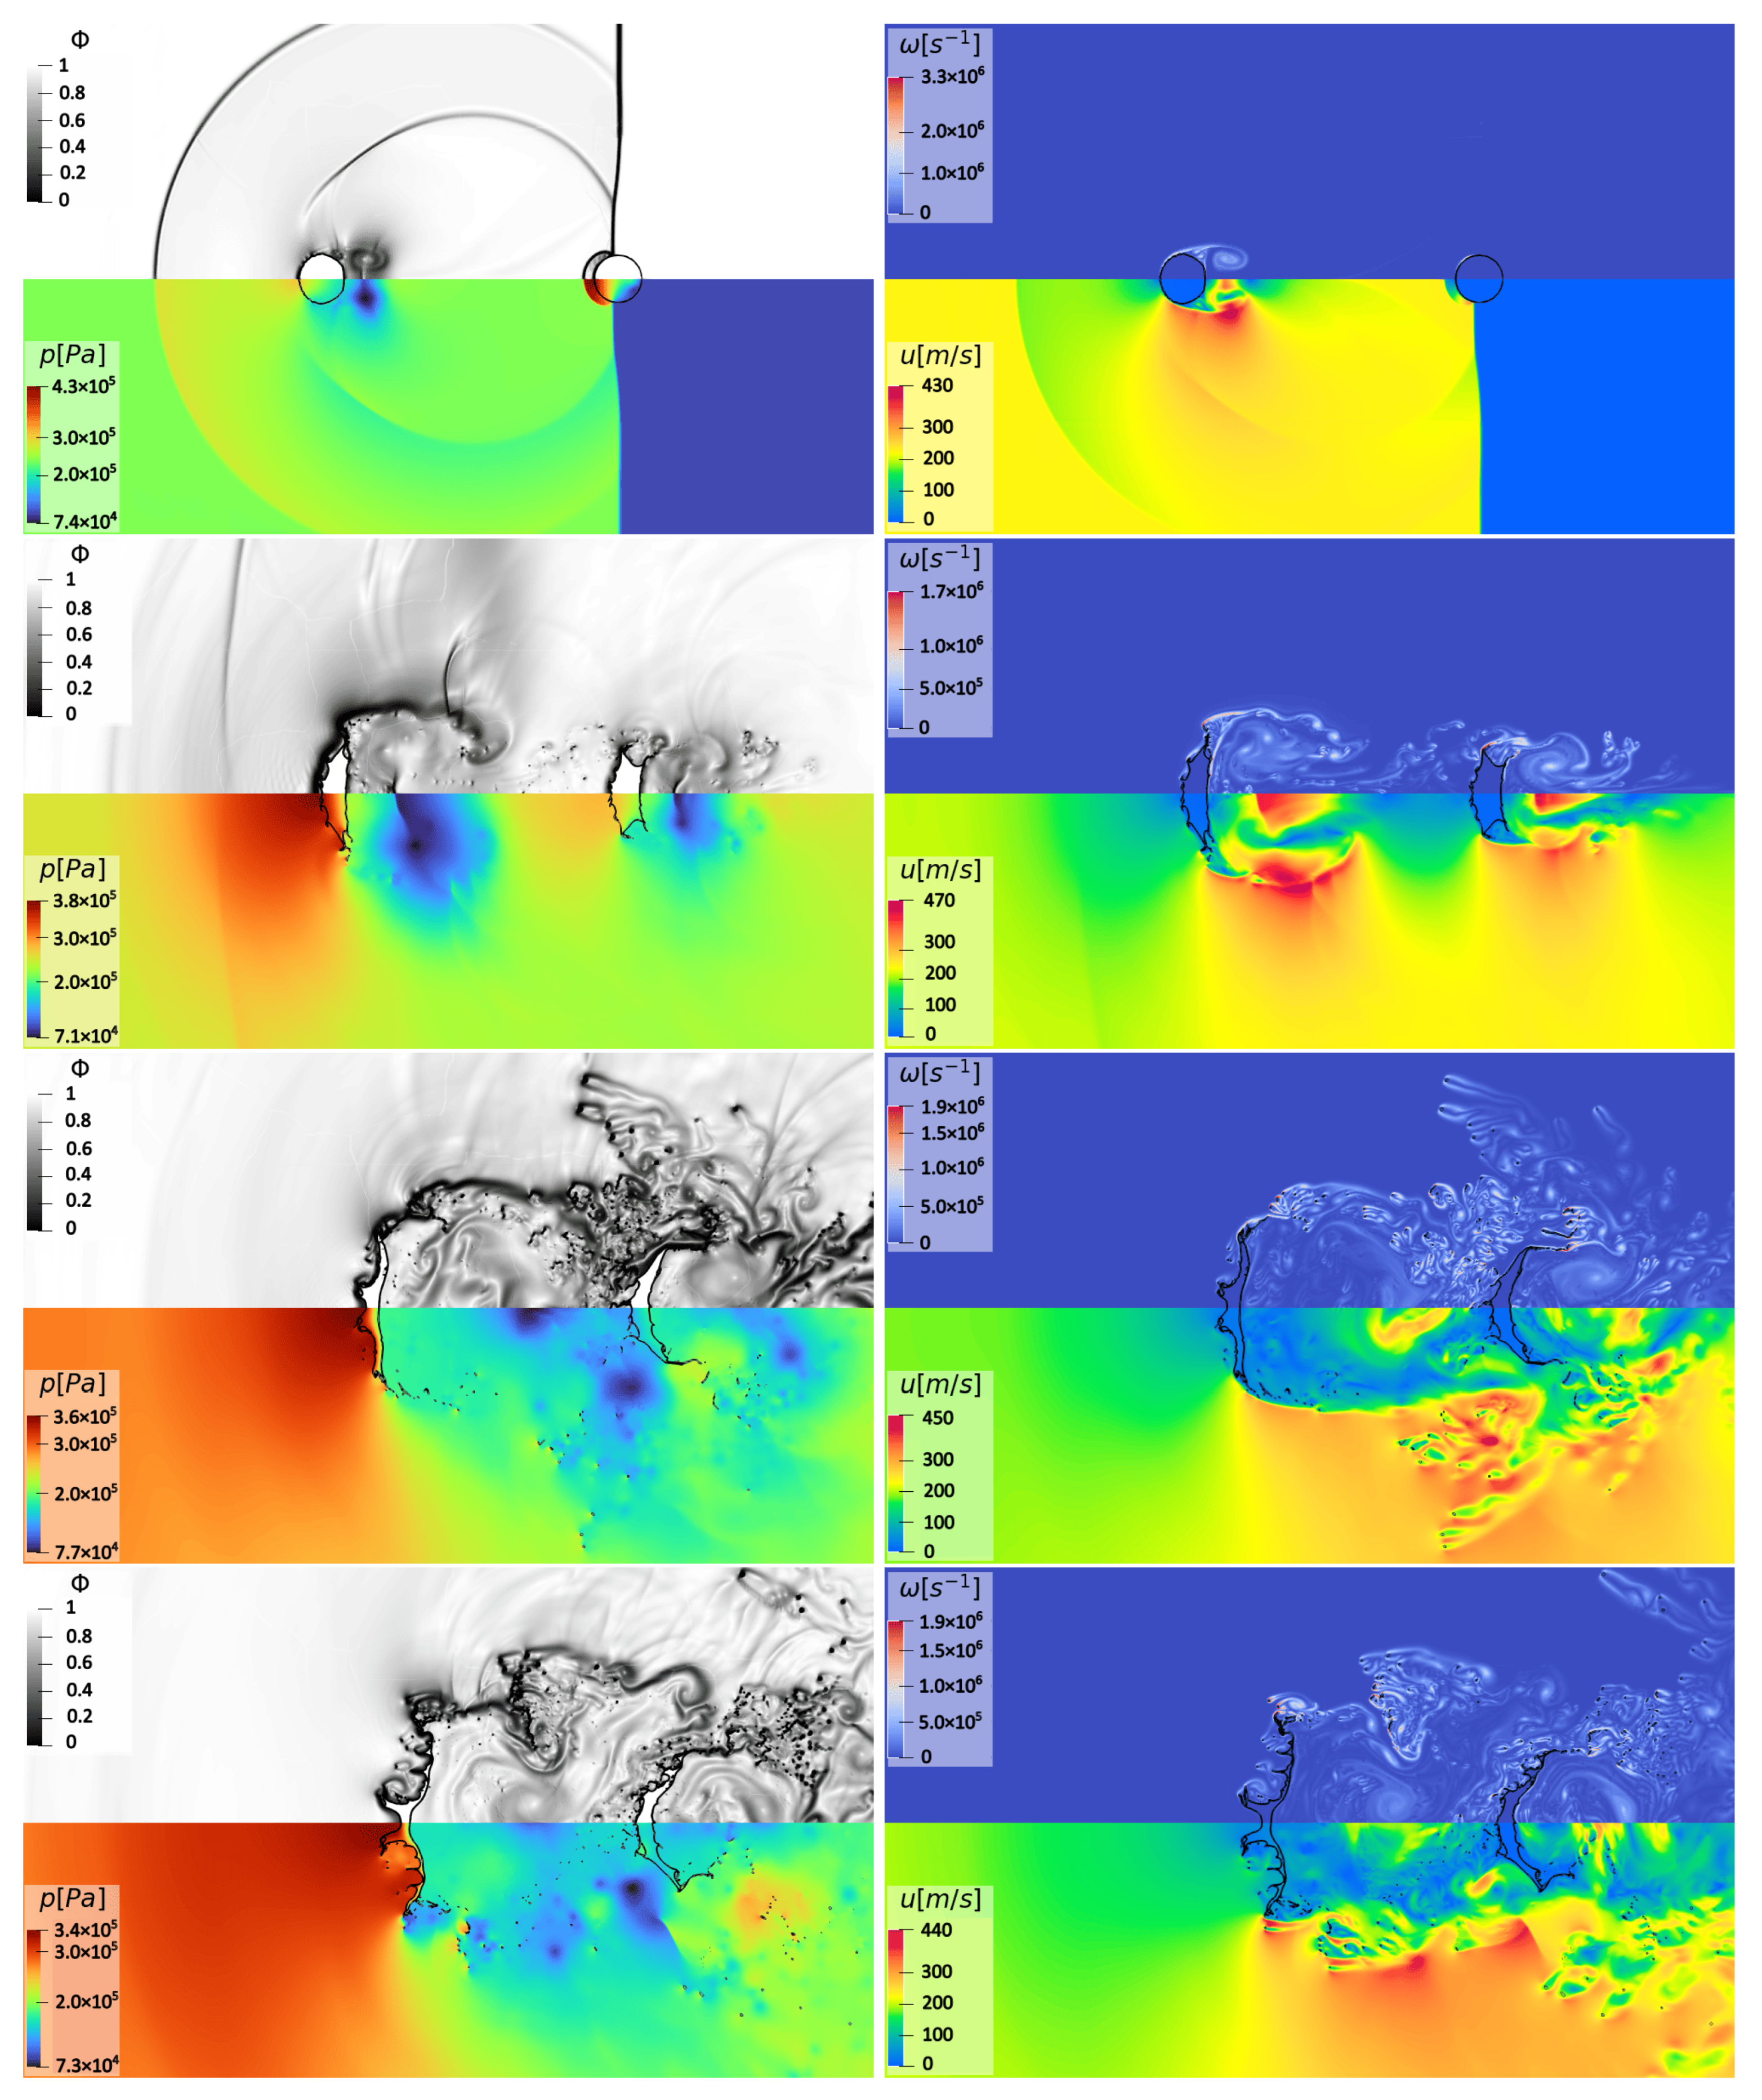
The current numerical method is able to reproduce the liquid body deformation against time, which is also consistent with recent results obtained through an alternative numerical approach [41]. In Figure 11, the present solution is analyzed by reporting the contour maps for the numerical Schlieren function (13), pressure, velocity, and vorticity fields. The process of the droplets’ displacement and deformation was observed by also looking at the isolines of the liquid volume fraction at α = 0.001 , 0.5 , and 0.99 , which are included in the pictures.
The different behaviors of the two columns under shock loading are evident. At the initial stages of the shock–droplets interaction, the front column does not undergo breakup, while being flattened substantially by the pressure difference between the upwind and downwind sides. The liquid surface is deformed, creating a curved front boundary and a flatter rear boundary, which is very similar to the single-column configuration. The rear column, instead, is initially elongated due to pressure and shear forces, and as a result, it exhibits curvature on both sides directed towards the center. The two wake regions are evidently different, with the extension of the front column wake being limited by the presence of the second water body. Also, the time evolution of the volume fraction contours shows the effect of the different drag forces acting on the two droplets, where the front one experiences a more intense acceleration when compared to the rear column. As a result, the displacement of the first droplet is higher, and the distance between the two water bodies decreases during the simulation.
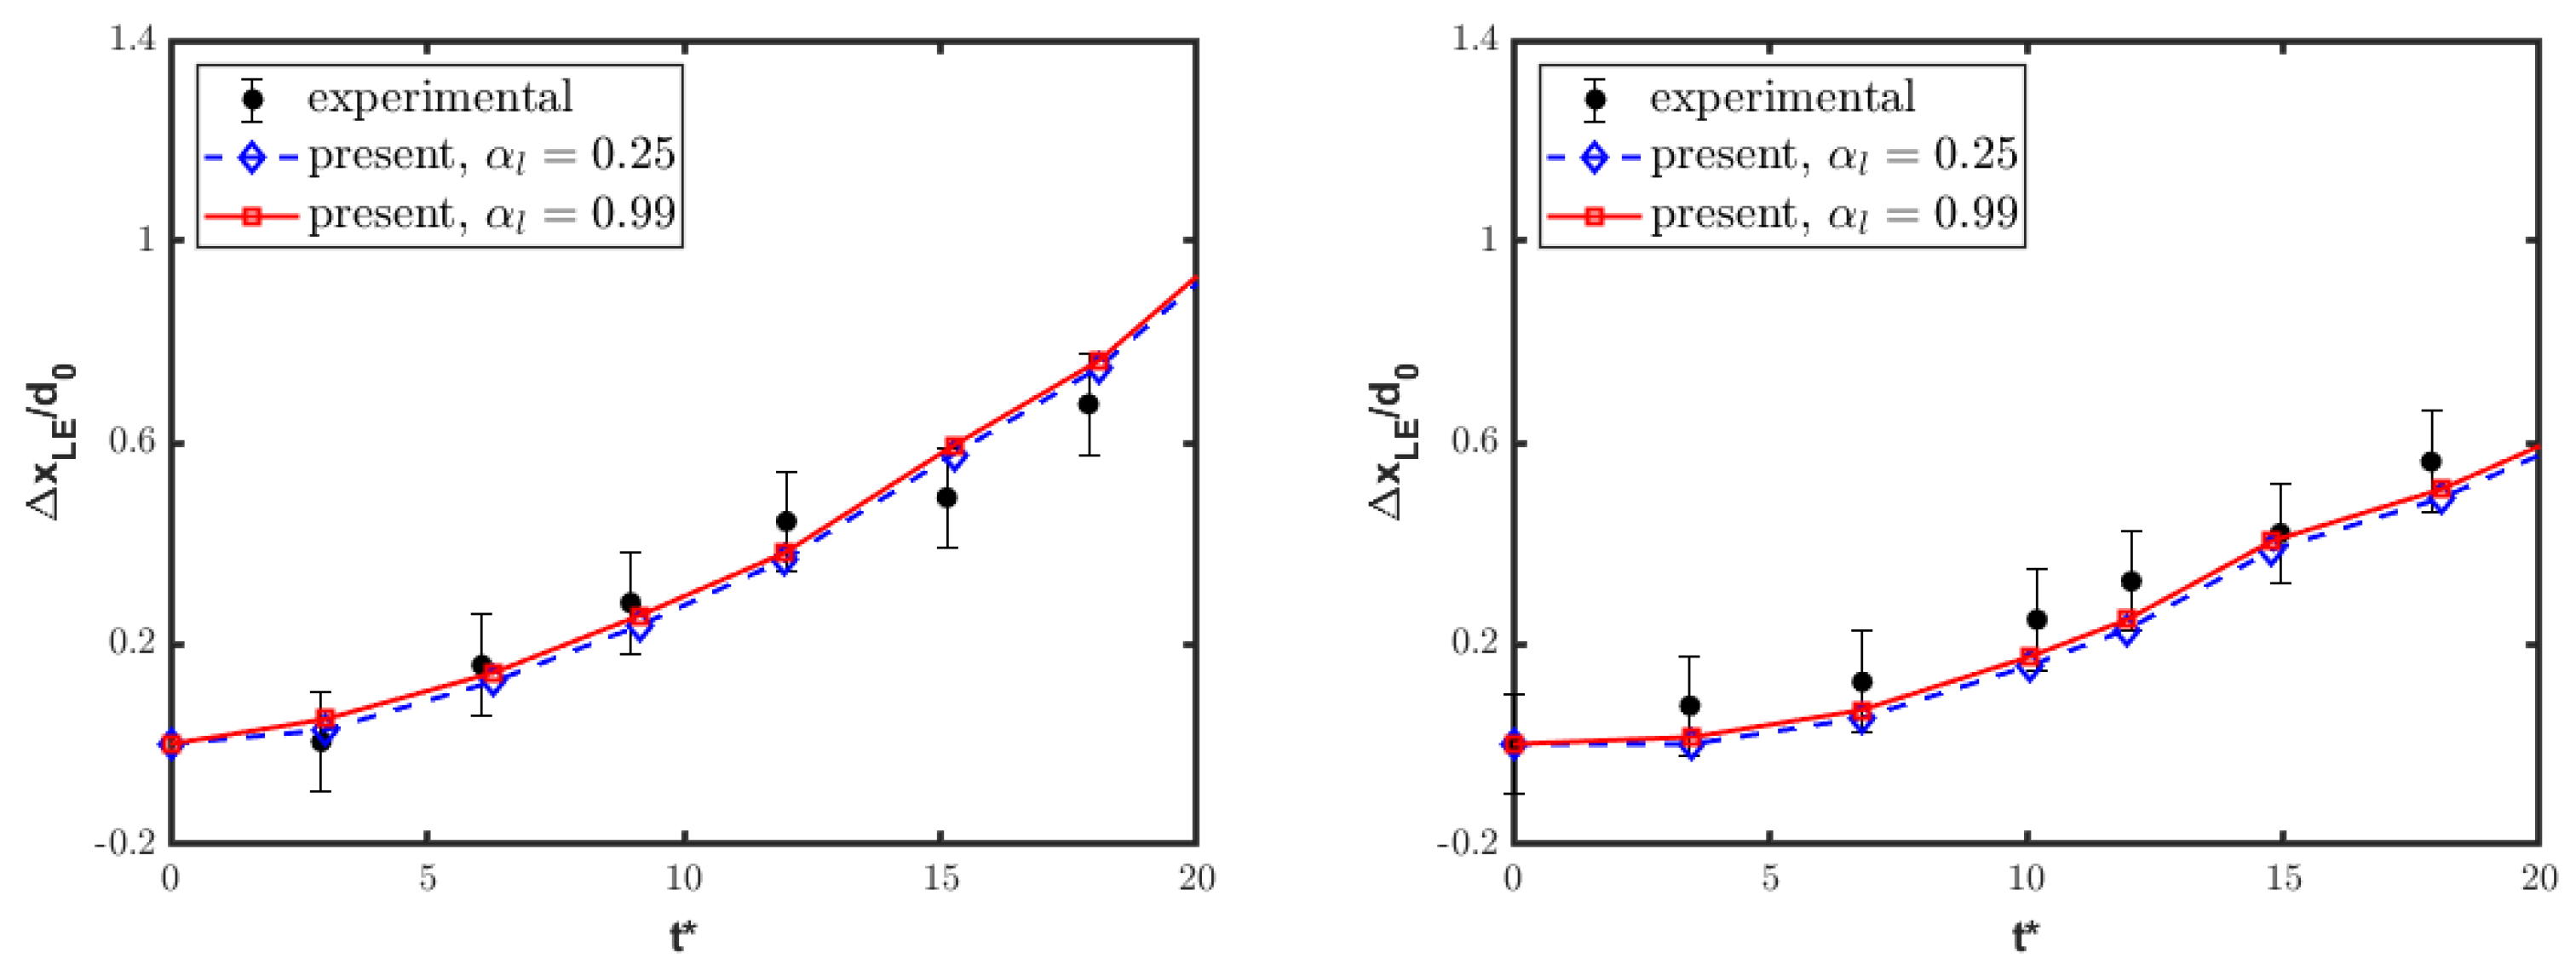
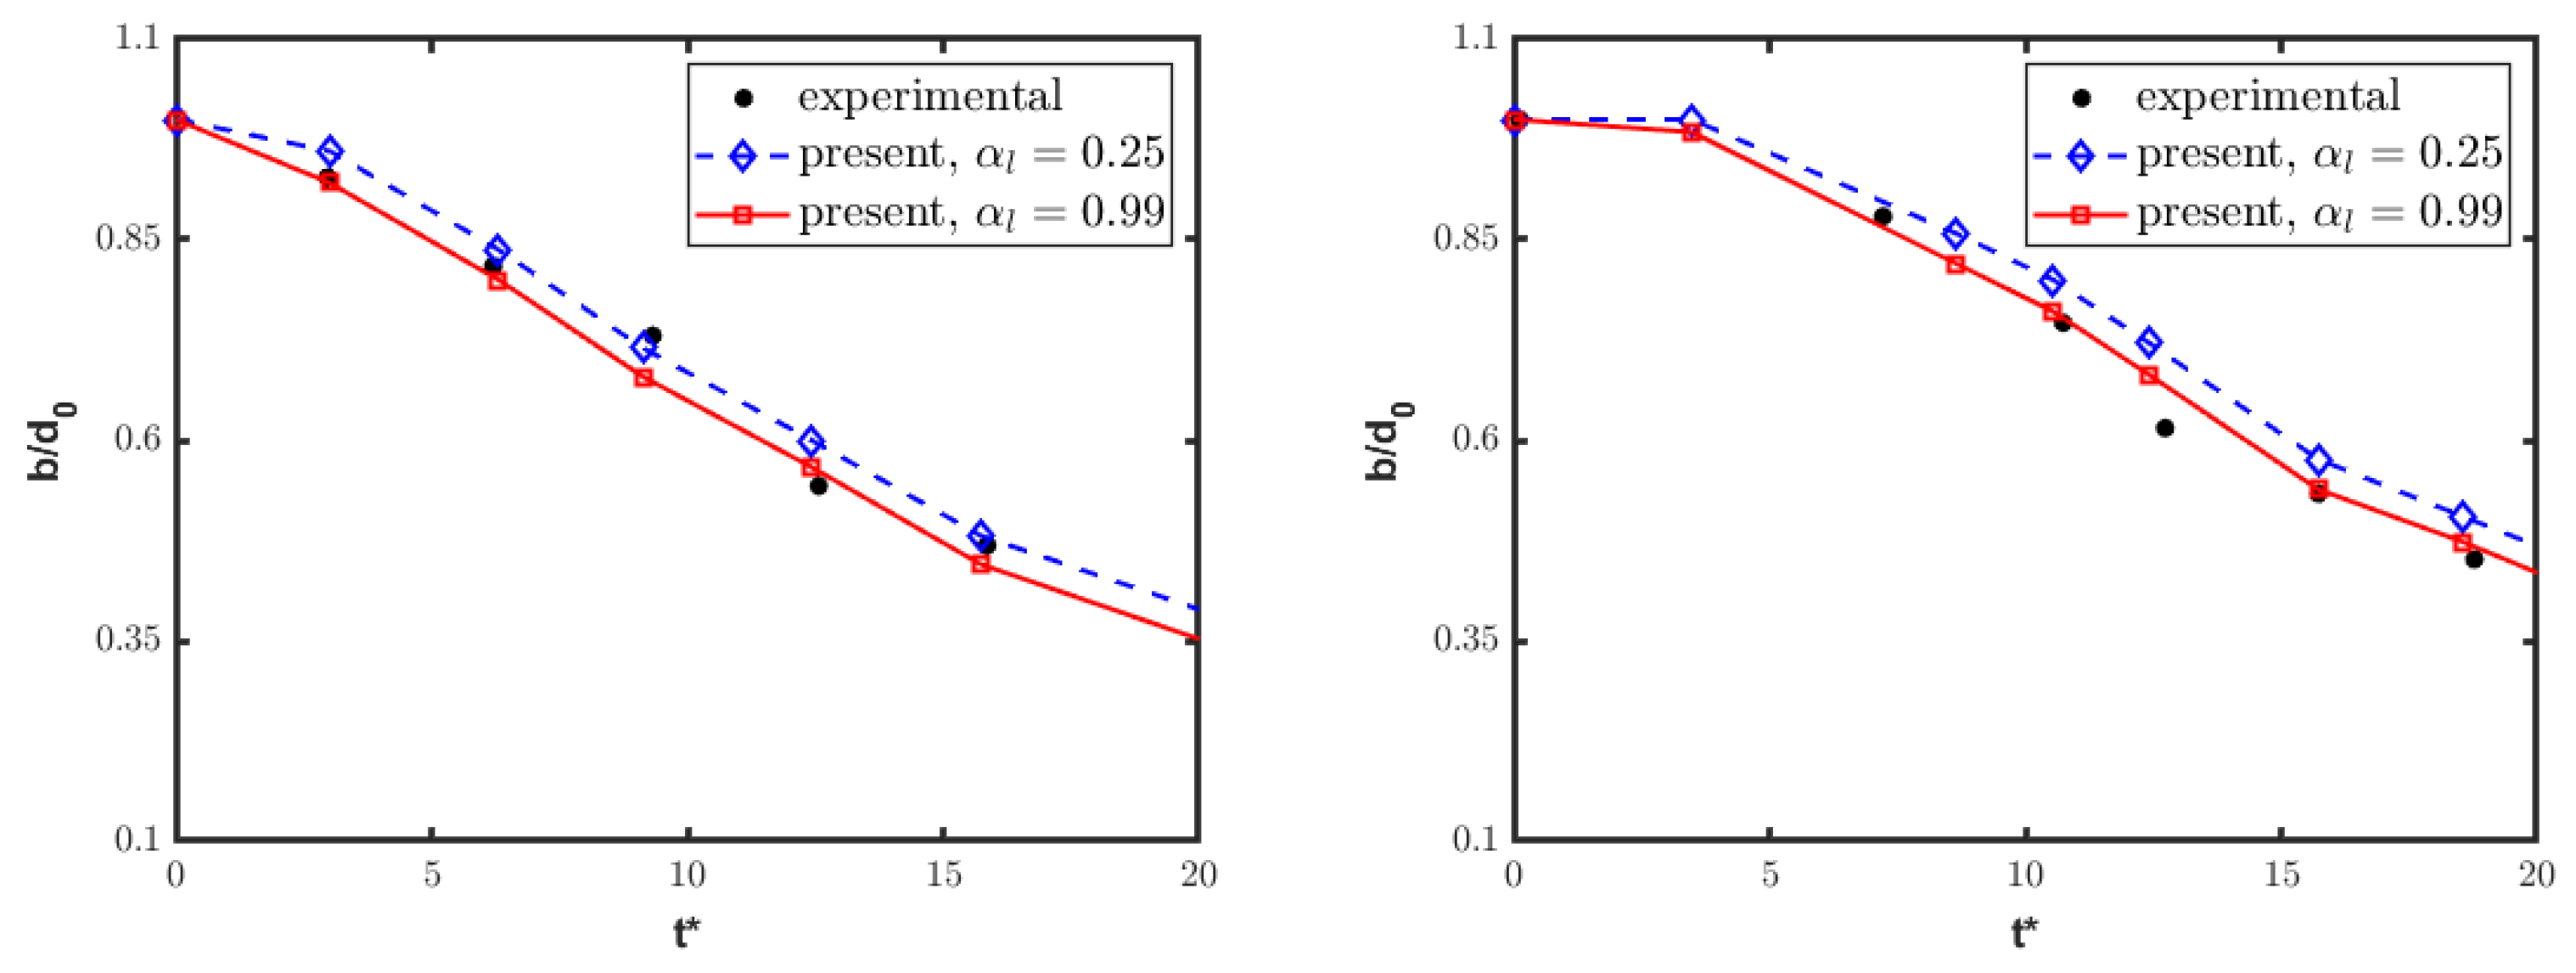
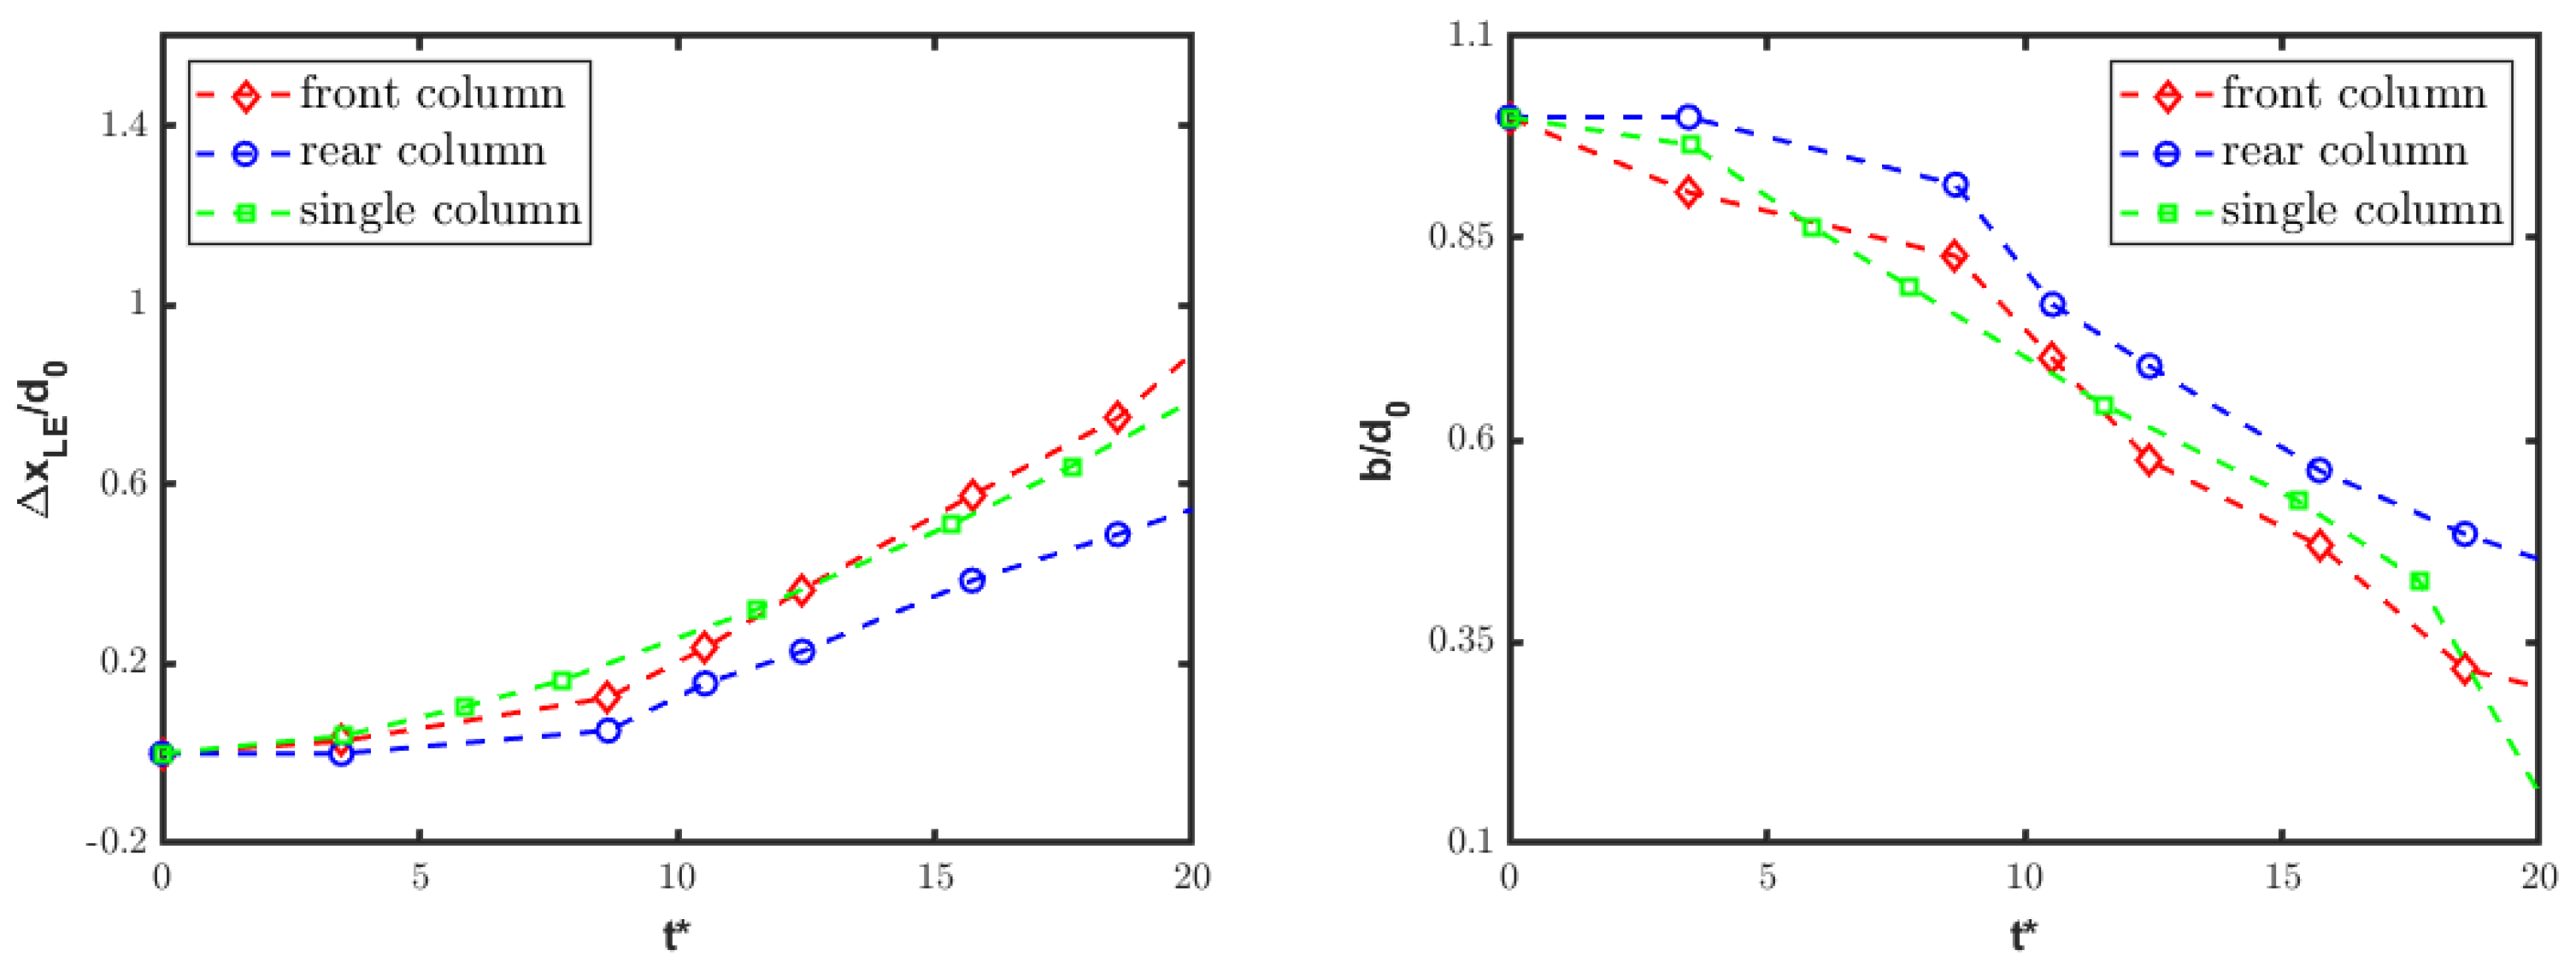
Furthermore, the streamwise tandem disposition is quantitatively examined by looking at the leading edge displacement and varying streamwise extent of deforming droplets. Figure 12 and Figure 13 show the time histories of these two parameters separately for the front and rear columns. The present numerical results are perfectly consistent with the reference experimental data [20], substantiating the previous qualitative discussion. Notably, the experimental analysis was affected by an inherent ambiguity in the criterion used for determining the water droplet boundary. Moreover, the discussion of experimental findings did not provide error quantification for the deformation measurements. Here, to mitigate the issue related to uncertainty in the measured boundary of the deforming columns, the water bodies are identified by the isolines at either α = 0.25 or α = 0.99 . From a quantitative viewpoint, the time-dependent displacement and deformation of the front column align closely with the single-column case, as reported in Figure 14, again confirming experimental findings [20]. By inspection of these results, the rear water column undergoes a reduced drag force from the interaction process, being immersed into the wake region created by the front column. This effect manifests as the diminished displacement and deformation of the rear droplet, supporting the conclusion that the first column plays a critical role in substantially modifying the airflow impacting the second one.

4.3.2. Spanwise Disposition

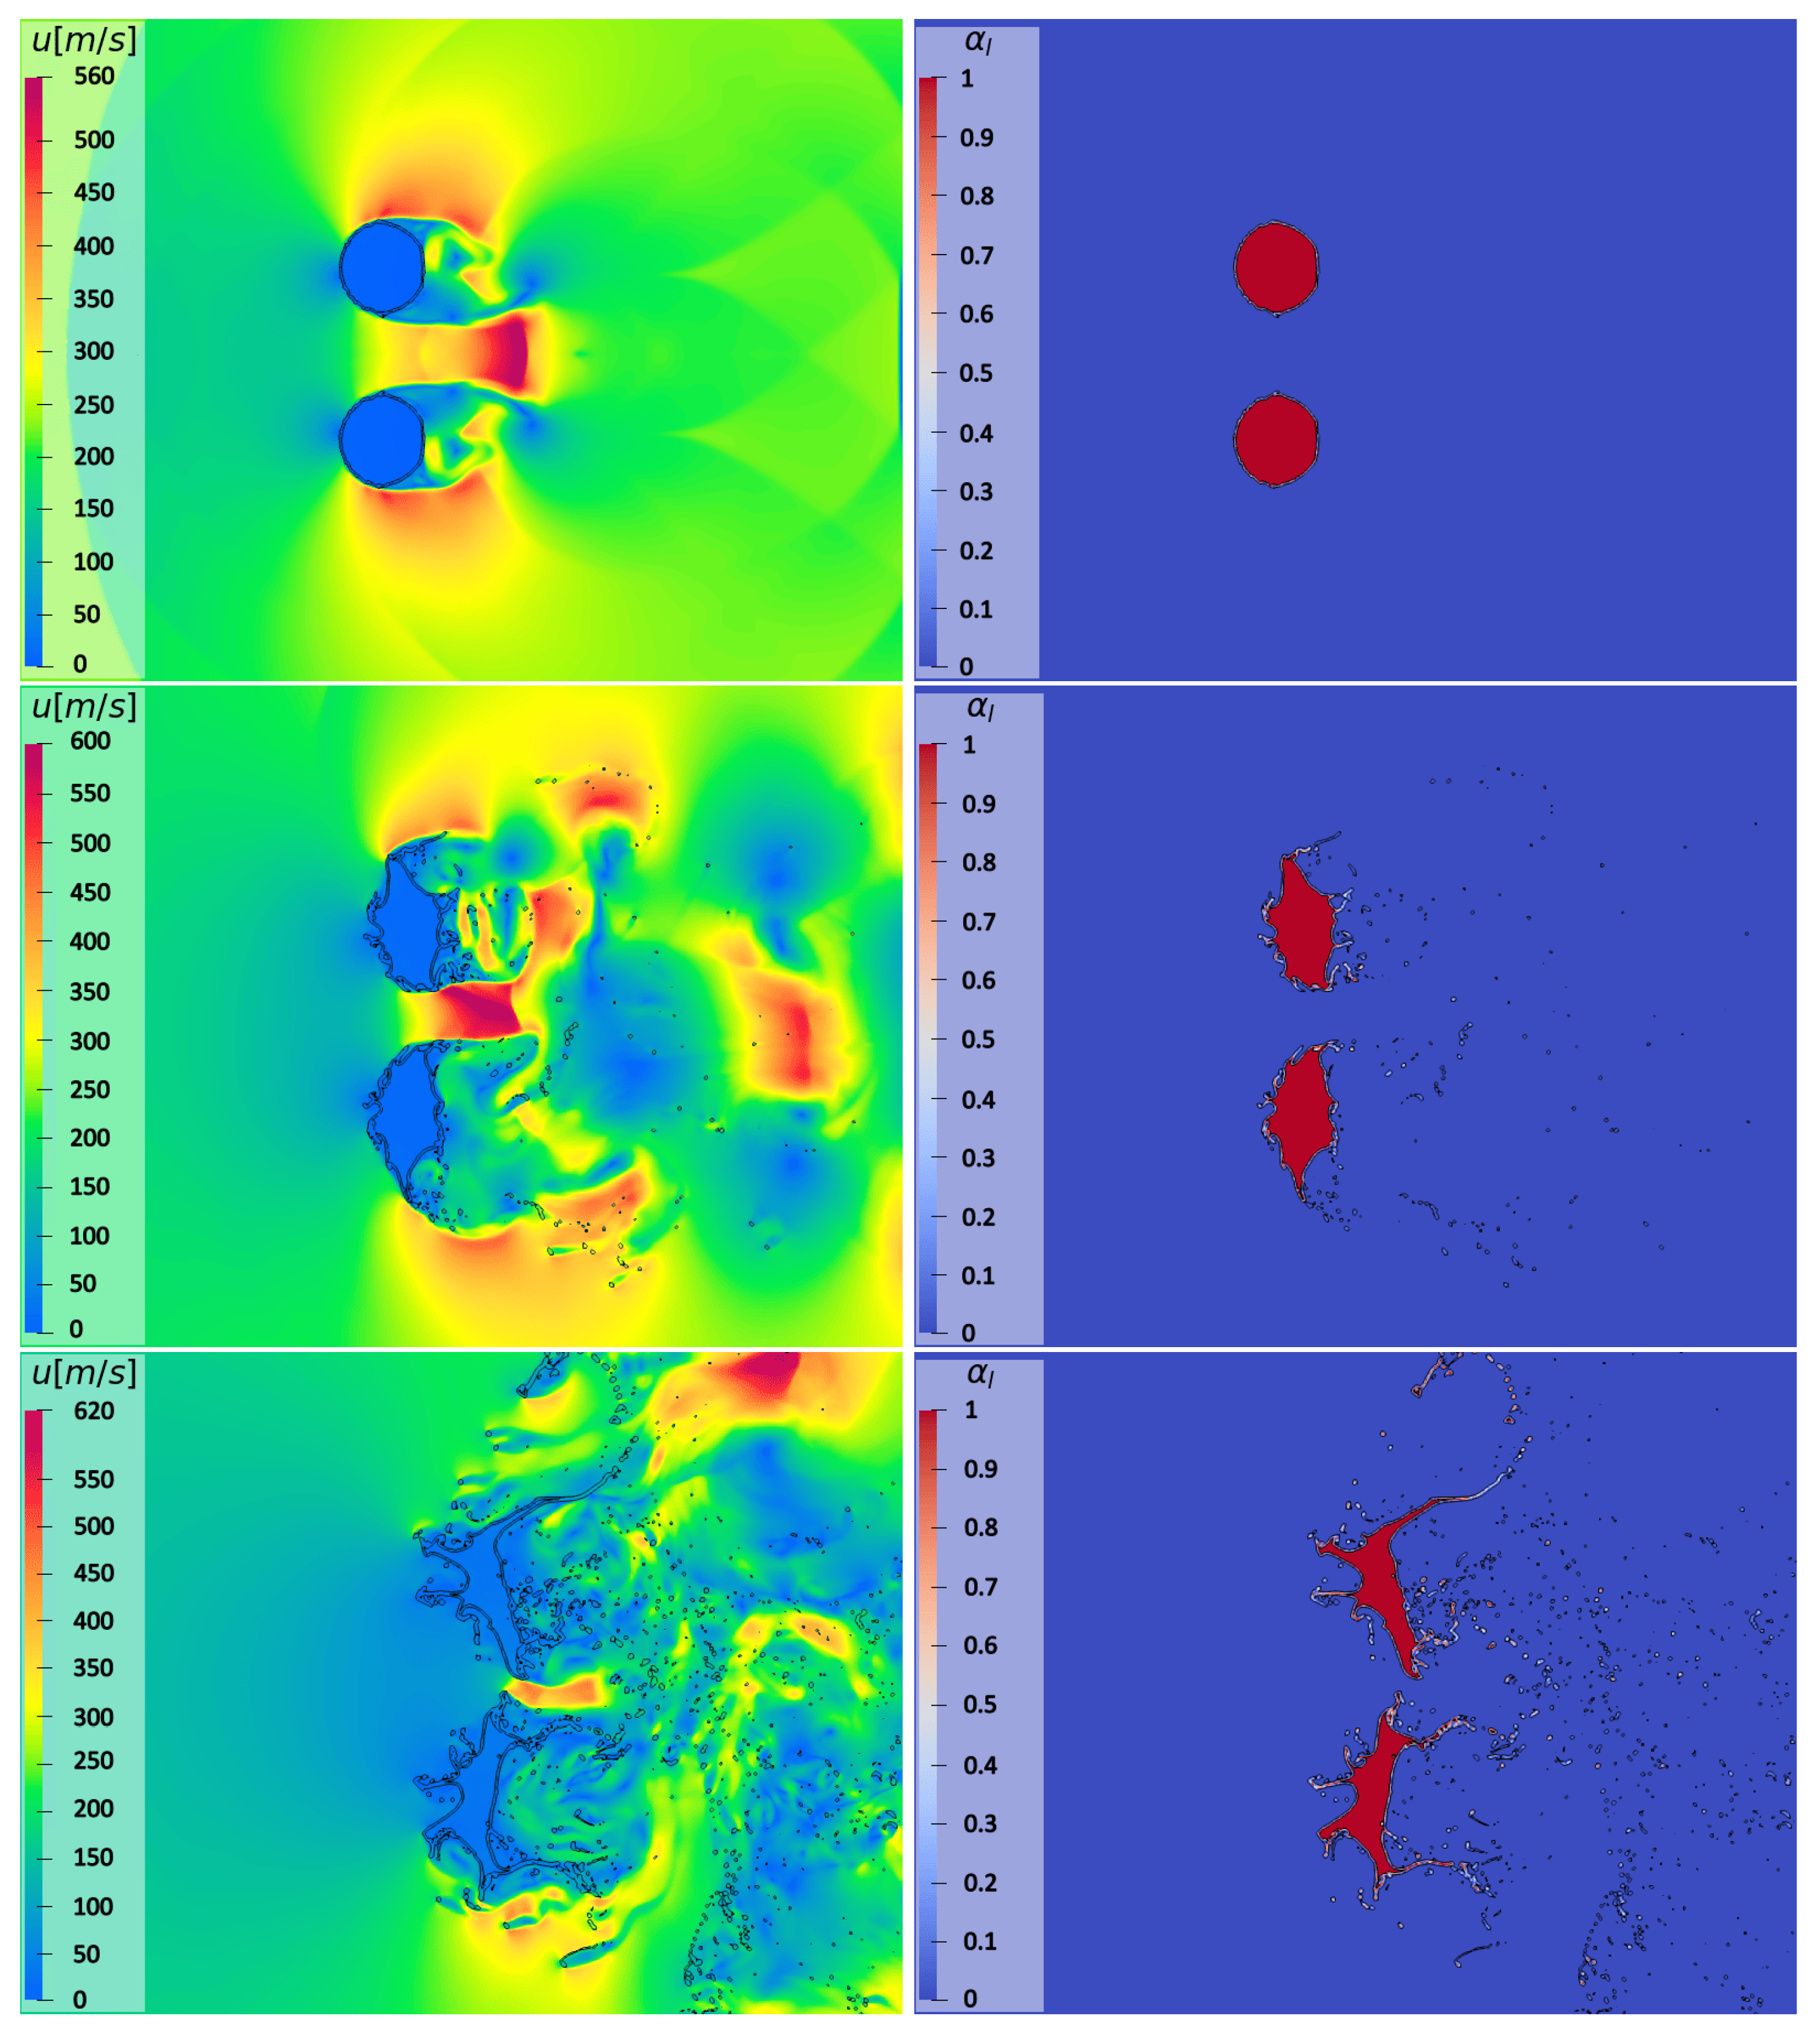
In the spanwise arrangement, the two columns are initially located at a distance of 2 d 0 between their centers. A similar disposition was investigated in the reference numerical work by Chen and Liang [21] for slightly larger water bodies with d 0 = 6.4   mm . In the present study, the size of the columns was kept constant among the two different tandem dispositions to facilitate the comparison. Given the larger relative center-to-center distance, the present solution showed a lower level of acceleration for the airflow in between the droplets, as demonstrated by inspection of Figure 15, where the velocity magnitude contours are depicted.
Moreover, Figure 16 shows the varied flow structures arising from the shock–droplets interaction, as visualized by the numerical Schlieren contours. A successful comparison against the numerical solution in Ref. [21] (in particular, see page 319) can be made. By inspection of these snapshots, corresponding to three different time instants, the very complex system of waves is apparent.
After the impact, the first couple of reflected waves (denoted by RW1) and transmitted waves are created in air and water, respectively. Then, the first set of reflected waves interact with the columns, forming another couple of reflected waves (RW2). The influence of the different relative distance is evident in this complex scenario, as it results in the second set of reflected waves taking a longer time to impact the opposing water column.
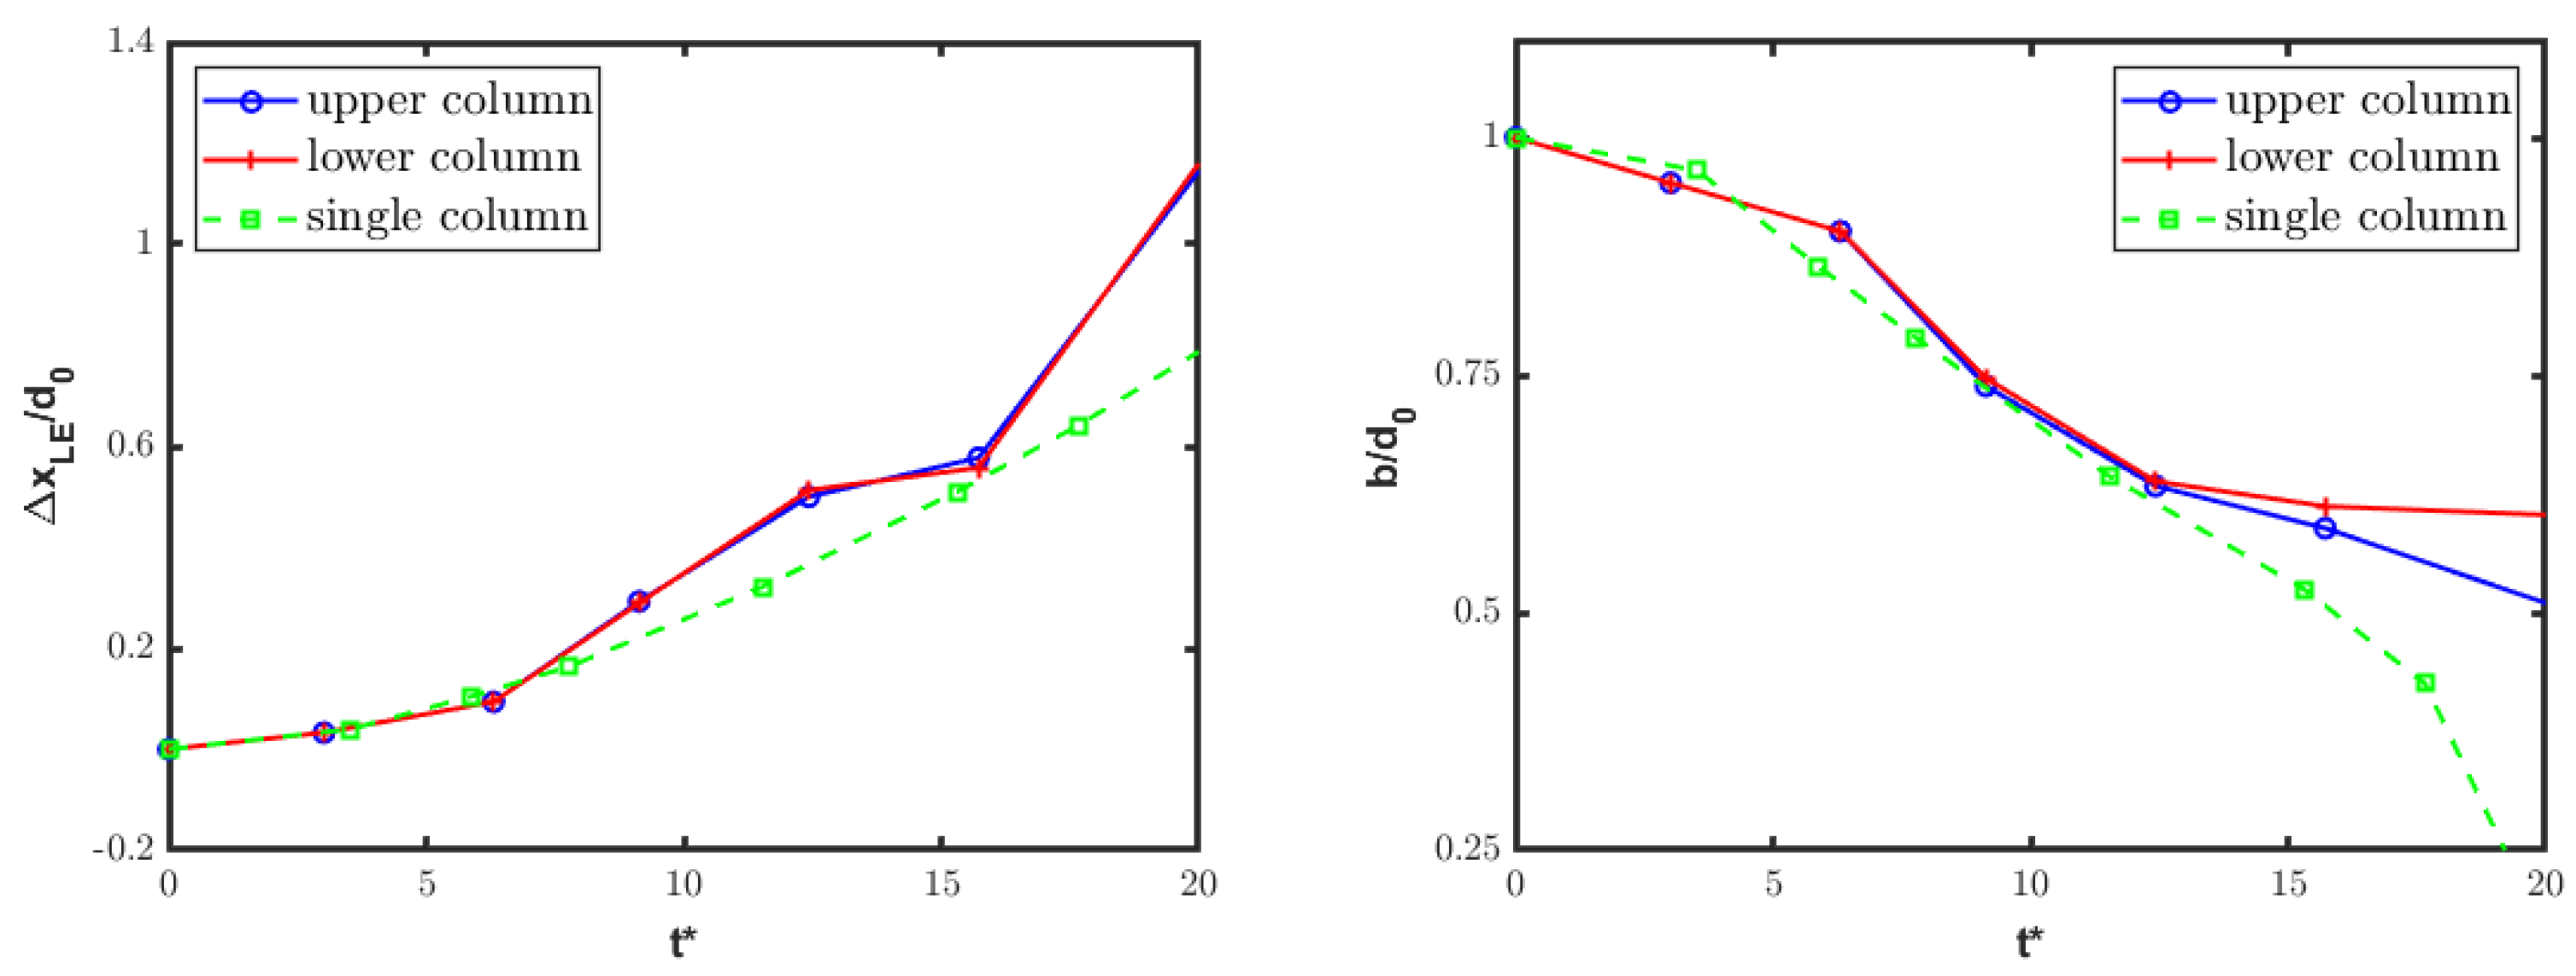
Note that the couple RW1 bends the upstream flow, altering its relative direction with respect to the droplets, which results in a different behavior for the airflow in between the two columns and the external current. Also, the diffracted waves (DWs) interact, forming a bow shock propagating downstream. As it also happens for the single-column configuration, triple points (TPs) are observed for this particular tandem disposition. However, in this more intricate configuration, triple points occur not only in the wake region, where TP1 and TP3 can be recognized, but also between the water bodies. Specifically, the last triple point travels upstream, becoming what is marked as TP2 in Figure 16. This process also happens with the second set of reflected waves (RW2), leading to the formation of TP4. Moreover, the high-speed zone (HSZ) existing between the two columns, where the airflow is accelerated through the narrow passage, induces the asymmetry of the vortical structures. Indeed, the sides of the droplets that are closer to HSZ show a more intense vorticity field. Yet, by looking at Figure 16, the third set of reflected waves interacts with the vortices, resulting in a very intricate flow pattern, with a marked deformation of the various shock fronts. Due to the interaction effect, it can also be observed that the bigger vortex stretches and propagates further downstream [21]. At the late stages of the process, the low static pressure region associated with the HSZ between the cylinders produces a suction force that moves the two water bodies closer. This effect can also be seen in Figure 17, where the time-evolution of the velocity’s magnitude and volume fraction contours is demonstrated. The non-symmetric deformation of the water bodies (with respect to the centerline) gradually obstructs the passage, leading to a decrease in the velocity’s magnitude over time. Figure 17 also shows how the HSZ that is formed between the columns amplifies the existing RT instabilities. The complex flow scenario also corresponds to a slightly increased acceleration of droplets with respect to the single-column case. This is demonstrated in Figure 18, where the time histories of the leading edge displacement and streamwise extent are shown for the two columns, separately. The difference between the two configurations increases over time, as very different airflow conditions are experienced by the deforming droplets. Notably, the last two figures show that the initial symmetry is maintained for a while, but after a certain time, the two droplets clearly behave differently.

5. Conclusions

The complex interaction between a traveling air shock front and cylindrical water droplets was investigated by computationally reproducing shock-tube flow conditions. Both single-column and double-column configurations were considered, in particular studying the deformation and mutual influence of two identical columns in tandem under different dispositions subjected to shock wave loading. The two-phase flow governing equations were numerically solved using a recently developed OpenFOAM-based CFD solver, namely, vofTwoPhaseCentralFoam [25]. To the authors’ knowledge, this work represents the first validation of the present solver for this kind of compressible fluid dynamics application. Unlike similar earlier works employing commercial CFD codes, e.g., Refs. [42,43], the current non-proprietary option permits complete source code access, allowing for the customization of the governing equations and boundary conditions, which are tailored to the specific case under investigation. Moreover, OpenFOAM codes excel in parallel processing capabilities, enhancing large-scale simulation efficiency.
The use of monotonicity-preserving discretization schemes for the numerical solution near discontinuities allowed for the correct propagation, reflection, and transmission of acoustic waves at the gas–liquid interface. This approach led to effectively predicting the very complex two-phase compressible flow conditions, as demonstrated by means of both qualitative and quantitative analyses. In fact, the accuracy and validity of the present simulations were verified through comparisons with available experimental visualizations and reference numerical data. For the single-column configuration, particularly in contrast to earlier research using standard interface treatment, e.g., Ref. [30], the proposed approach resulted in a closer match between computed solutions and experiments, for instance, in terms of droplet kinematics and deformation. Basically, the current simulations showcased the capability of the proposed open source CFD code to adequately predict the aerobreakup of water columns, where the suitable grid refinement enabled the accurate tracking of the interface, demonstrating the precision and control achievable in this application. Also, note that the functionality of the numerical scheme for single-phase flow was recovered in flow regions that were placed sufficiently far from the air–water interface.
The current two-dimensional approach allowed us to first validate the proposed computational model while testing it for a very fine numerical resolution. The good results achieved in this study encourage a future extension of the OpenFOAM-based methodology to three-dimensional configurations, where the aerobreakup of spherical water bodies will be investigated [44]. In this very challenging context, the high computational complexity will be controlled by utilizing an adaptive mesh refinement, while the size of the computational domain will be reduced owing to the implementation of non-reflecting boundary conditions. As far as turbulence modeling is concerned, the possible use of more sophisticated scale-resolving simulation approaches will also be considered, e.g., [45,46].

Author Contributions

Conceptualization, G.D.S.; methodology, F.E.T. and G.D.S.; validation, F.E.T. and G.D.S.; investigation, F.E.T.; resources, G.D.S.; data curation, F.E.T.; writing—original draft preparation, F.E.T. and G.D.S.; writing—review and editing, G.D.S.; visualization, F.E.T.; supervision, G.D.S. All authors have read and agreed to the published version of the manuscript.

Funding

The authors acknowledge financial support under the National Recovery and Resilience Plan (NRRP), Mission 4, Component 2, Investment 1.1, Call for tender No.104, published on 2.2.2022 by the Italian Ministry of University and Research (MUR), funded by the European Union—NextGenerationEU—Project 2022B2X937 Title “Next Generation Space Propulsion Design Techniques”–CUP E53D23003080006—Grant Assignment Decree No.961 adopted on 30.6.2023 by MUR.

Institutional Review Board Statement

Not applicable.

Informed Consent Statement

Not applicable.

Data Availability Statement

The original contributions presented in the study are included in the article; further inquiries can be directed to the corresponding author.

Acknowledgments

The authors thank Matvey V. Kraposhin, Ivannikov Institute for System Programming of the Russian Academy of Sciences, for very helpful discussions.

Conflicts of Interest

The authors declare no conflicts of interest.

Abbreviations

The following abbreviations are used in this manuscript:
ACIDacoustically conservative interface discretization
CFDcomputational fluid dynamics
CMcenter-of-mass
CPDcells-per-diameter
DWdiffracted wave
FVfinite volume (method)
HSZhigh-speed zone
KNPKurganov–Noelle–Petrova (scheme)
PIMPLEpressure implicit method (for) pressure-linked equations
RTRayleigh–Taylor (instability)
RTPRayleigh–Taylor piercing
RWreflected wave
SIEshear-induced entrainment
TPtriple point
VOFvolume-of-fluid (method)
Nomenclature
bcolumn streamwise extent
d 0 initial column diameter
Etotal energy (per unit mass)
k numerical Schlieren constant
Kinterface compression coefficient
M molar mass
M S shock Mach number
O h                     Ohnesorge number
pmixture pressure
Rgas constant
t * non-dimensional time
t 0 instant of the shock impact
Tmixture temperature
u mixture velocity vector
V S shock front velocity
W e Weber number
x LE cylinder leading edge position
Zacoustic impedance
α volume fraction of liquid phase
β compression ratio
γ specific heat ratio
μ dynamic viscosity
ρ mixture density
σ surface tension
τ viscous stress tensor
Φ numerical Schlieren function
Ω computational domain

References

  1. Villermaux, E. Fragmentation. Annu. Rev. Fluid Mech. 2007, 39, 419–446. [Google Scholar]
  2. Rajamanickam, K.; Basu, S. On the dynamics of vortex–droplet interactions, dispersion and breakup in a coaxial swirling flow. J. Fluid Mech. 2017, 827, 572–613. [Google Scholar]
  3. Liu, N.; Wang, Z.; Mingbo, S.; Wang, H.; Wang, B. Numerical simulation of liquid droplet breakup in supersonic flows. Acta Astronaut. 2018, 145, 116–130. [Google Scholar]
  4. Meng, J.C.; Colonius, T. Numerical simulations of the early stages of high-speed droplet breakup. Shock Waves 2015, 25, 399–414. [Google Scholar]
  5. Guildenbecher, D.R.; López-Rivera, C.; Sojka, P.E. Secondary atomization. Exp. Fluids 2009, 45, 371–402. [Google Scholar]
  6. Theofanous, T.G.; Li, G.J. On the physics of aerobreakup. Phys. Fluids 2008, 20, 052103. [Google Scholar]
  7. Theofanous, T.G. Aerobreakup of Newtonian and Viscoelastic Liquids. Annu. Rev. Fluid Mech. 2011, 43, 661–690. [Google Scholar]
  8. Theofanous, T.G.; Mitkin, V.V.; Ng, C.L.; Chang, C.-H.; Deng, X.; Sushchikh, S. The physics of aerobreakup. II. Viscous liquids. Phys. Fluids 2012, 24, 022104. [Google Scholar]
  9. Gelfand, B.E. Droplet breakup phenomena in flows with velocity lag. Progr. Energy Combust. Sci. 1996, 22, 201–265. [Google Scholar]
  10. Igra, D.; Takayama, K. Investigation of aerodynamic breakup of a cylindrical water droplet. At. Sprays 2001, 11, 167–185. [Google Scholar]
  11. Igra, D.; Takayama, K. Numerical simulation of shock wave interaction with a water column. Shock Waves 2001, 11, 219–228. [Google Scholar]
  12. Sembian, S.; Liverts, M.; Tillmark, N.; Apazidis, N. Plane shock wave interaction with a cylindrical water column. Phys. Fluids 2016, 28, 056102. [Google Scholar]
  13. Biasiori-Poulanges, L.; Schmidmayer, K. A phenomenological analysis of droplet shock-induced cavitation using a multiphase modeling approach. Phys. Fluids 2023, 35, 013312. [Google Scholar]
  14. Igra, D.; Ogawa, T.; Takayama, K. A parametric study of water column deformation resulting from shock wave loading. At. Sprays 2002, 12, 577–591. [Google Scholar]
  15. Igra, D.; Sun, M. Shock-Water Column Interaction, from Initial Impact to Fragmentation Onset. AIAA J. 2010, 48, 2763–2771. [Google Scholar]
  16. Xiong, T.; Shao, C.; Luo, K. Exploration of shock—Droplet interaction based on high-fidelity simulation and improved theoretical model. J. Fluid Mech. 2024, 988, A46. [Google Scholar]
  17. Xu, S.; Fan, W.; Wu, W.; Wen, H.; Wang, B. Analysis of wave converging phenomena inside the shocked two-dimensional cylindrical water column. J. Fluid Mech. 2023, 964, A12. [Google Scholar]
  18. Xiang, G.; Wang, B. Numerical study of a planar shock interacting with a cylindrical water column embedded with an air cavity. J. Fluid Mech. 2017, 825, 825–852. [Google Scholar]
  19. Kaiser, J.W.J.; Winter, J.M.; Adami, S.; Adams, N.A. Investigation of interface deformation dynamics during high-Weber number cylindrical droplet breakup. Int. J. Multiph. Flow 2020, 132, 103409. [Google Scholar]
  20. Igra, D.; Takayama, K. Experimental investigation of two cylindrical water columns subjected to planar shock wave loading. J. Fluids Eng. 2003, 125, 325–331. [Google Scholar]
  21. Chen, H.; Liang, S.M. Flow visualization of shock/water column interactions. Shock Waves 2008, 17, 309–321. [Google Scholar]
  22. Coralic, V.; Colonius, T. Finite-volume WENO scheme for viscous compressible multicomponent flows. J. Comput. Phys. 2014, 274, 95–121. [Google Scholar] [PubMed]
  23. Denner, F.; Xiao, C.-N.; van Wachem, B.G.M. Pressure-based algorithm for compressible interfacial flows with acoustically-conservative interface discretisation. J. Comput. Phys. 2018, 367, 192–234. [Google Scholar]
  24. Zhang, X.; Pirker, S.; Saeedipour, M. Numerical investigation of particle motion at the steel–slag interface in continuous casting using VOF method and dynamic overset grids. Exp. Comput. Multiph. Flow 2023, 5, 178–192. [Google Scholar]
  25. Kraposhin, M.V.; Kukharskii, A.V.; Korchagova, V.N.; Shevelev, A.A. An extension of the all-Mach number pressure-based solution framework for numerical modelling of two-phase flows with interface. Ind. Process. Technol. 2022, 166, 6–27. [Google Scholar]
  26. Kapila, A.K.; Menikoff, R.; Bdzil, J.B.; Son, S.F.; Stewart, D.S. Two-phase modeling of deflagration-to-detonation transition in granular materials: Reduced equations. Phys. Fluids 2001, 13, 3002–3024. [Google Scholar]
  27. Baer, M.R.; Nunziato, J.W. A two-phase mixture theory for the deflagration-to-detonation transition in reactive granular materials. Int. J. Multiph. Flow 1986, 12, 861–889. [Google Scholar]
  28. Saurel, R.; Pantano, C. Diffuse-Interface Capturing Methods for Compressible Two-Phase Flows. Annu. Rev. Fluid Mech. 2018, 50, 105–130. [Google Scholar]
  29. Zlotnik, A.; Lomonosov, T. On a doubly reduced model for dynamics of heterogeneous mixtures of stiffened gases, its regularizations and their implementations. Chaos 2023, 33, 113128. [Google Scholar]
  30. Rossano, V.; De Stefano, G. Computational evaluation of shock wave interaction with a cylindrical water column. Appl. Sci. 2021, 11, 4934. [Google Scholar] [CrossRef]
  31. Rossano, V.; Cittadini, A.; De Stefano, G. Computational evaluation of shock wave interaction with a liquid droplet. Appl. Sci. 2022, 12, 1349. [Google Scholar] [CrossRef]
  32. Schmidmayer, K.; Biasiori-Poulanges, L. Geometry effects on the droplet shock-induced cavitation. Phys. Fluids 2023, 35, 063315. [Google Scholar]
  33. Denaro, F.M.; De Stefano, G. A new development of the dynamic procedure in large-eddy simulation based on a Finite Volume integral approach. Application to stratified turbulence. Theoret. Comput. Fluid Dyn. 2011, 25, 315–355. [Google Scholar]
  34. Kraposhin, M. Available Solvers with Hybrid Approximation. GitHub Repository. 2022. Available online: https://github.com/mkraposhin/hybridCentralSolvers (accessed on 5 November 2024).
  35. Kurganov, A.; Tadmor, E. New high-resolution central schemes for nonlinear conservation laws and convection-diffusion equations. J. Comput. Phys. 2000, 160, 241–282. [Google Scholar]
  36. Yang, H.; Peng, J. Numerical study of the shear-thinning effect on the interaction between a normal shock wave and a cylindrical liquid column. Phys. Fluids 2019, 31, 043101. [Google Scholar]
  37. Sod, G.A. A survey of several finite difference methods for systems of nonlinear hyperbolic conservation laws. J. Comput. Phys. 1978, 27, 1–31. [Google Scholar]
  38. Johnsen, E. Numerical simulations of non-spherical bubble collapse. Ph.D. Thesis, California Institute of Technology, Pasadena, CA, USA, 2007. [Google Scholar]
  39. Sharma, S.; Singh, A.P.; Rao, S.S.; Kumar, A.; Basu, S. Shock induced aerobreakup of a droplet. J. Fluid Mech. 2021, 929, A27. [Google Scholar]
  40. Fujisawa, K. Onset and evolution of counter-rotating baroclinic vortex pair in shock-induced aerobreakup of droplets. Prog. Nucl. Energy 2022, 152, 104343. [Google Scholar]
  41. Hong, Z.-Y.; Song, Y.; Wang, R.; Ma, Z.-Q.; Ma, D.-J.; Wang, P. Deformation and mutual influence of two cylindrical water columns in tandem subjected to shock wave. Chin. Phys. B 2024, 33, 084702. [Google Scholar]
  42. Rossano, V.; De Stefano, G. Hybrid VOF–Lagrangian CFD modeling of droplet aerobreakup. Appl. Sci. 2022, 12, 8302. [Google Scholar] [CrossRef]
  43. Zhu, W.; Zhao, N.; Jia, X.; Chen, X.; Zheng, H. Effect of airflow pressure on the droplet breakup in the shear breakup regime. Phys. Fluids 2021, 33, 053309. [Google Scholar] [CrossRef]
  44. Meng, J.C.; Colonius, T. Numerical simulation of the aerobreakup of a water droplet. J. Fluid Mech. 2018, 835, 1108–1135. [Google Scholar] [CrossRef]
  45. Rossano, V.; De Stefano, G. Scale-resolving simulation of shock-induced aerobreakup of water droplet. Computation 2024, 12, 71. [Google Scholar] [CrossRef]
  46. Rossano, V.; De Stefano, G. Large-eddy simulation of droplet deformation and fragmentation under shock wave impact. Appl. Sci. 2025, 15, 1233. [Google Scholar] [CrossRef]
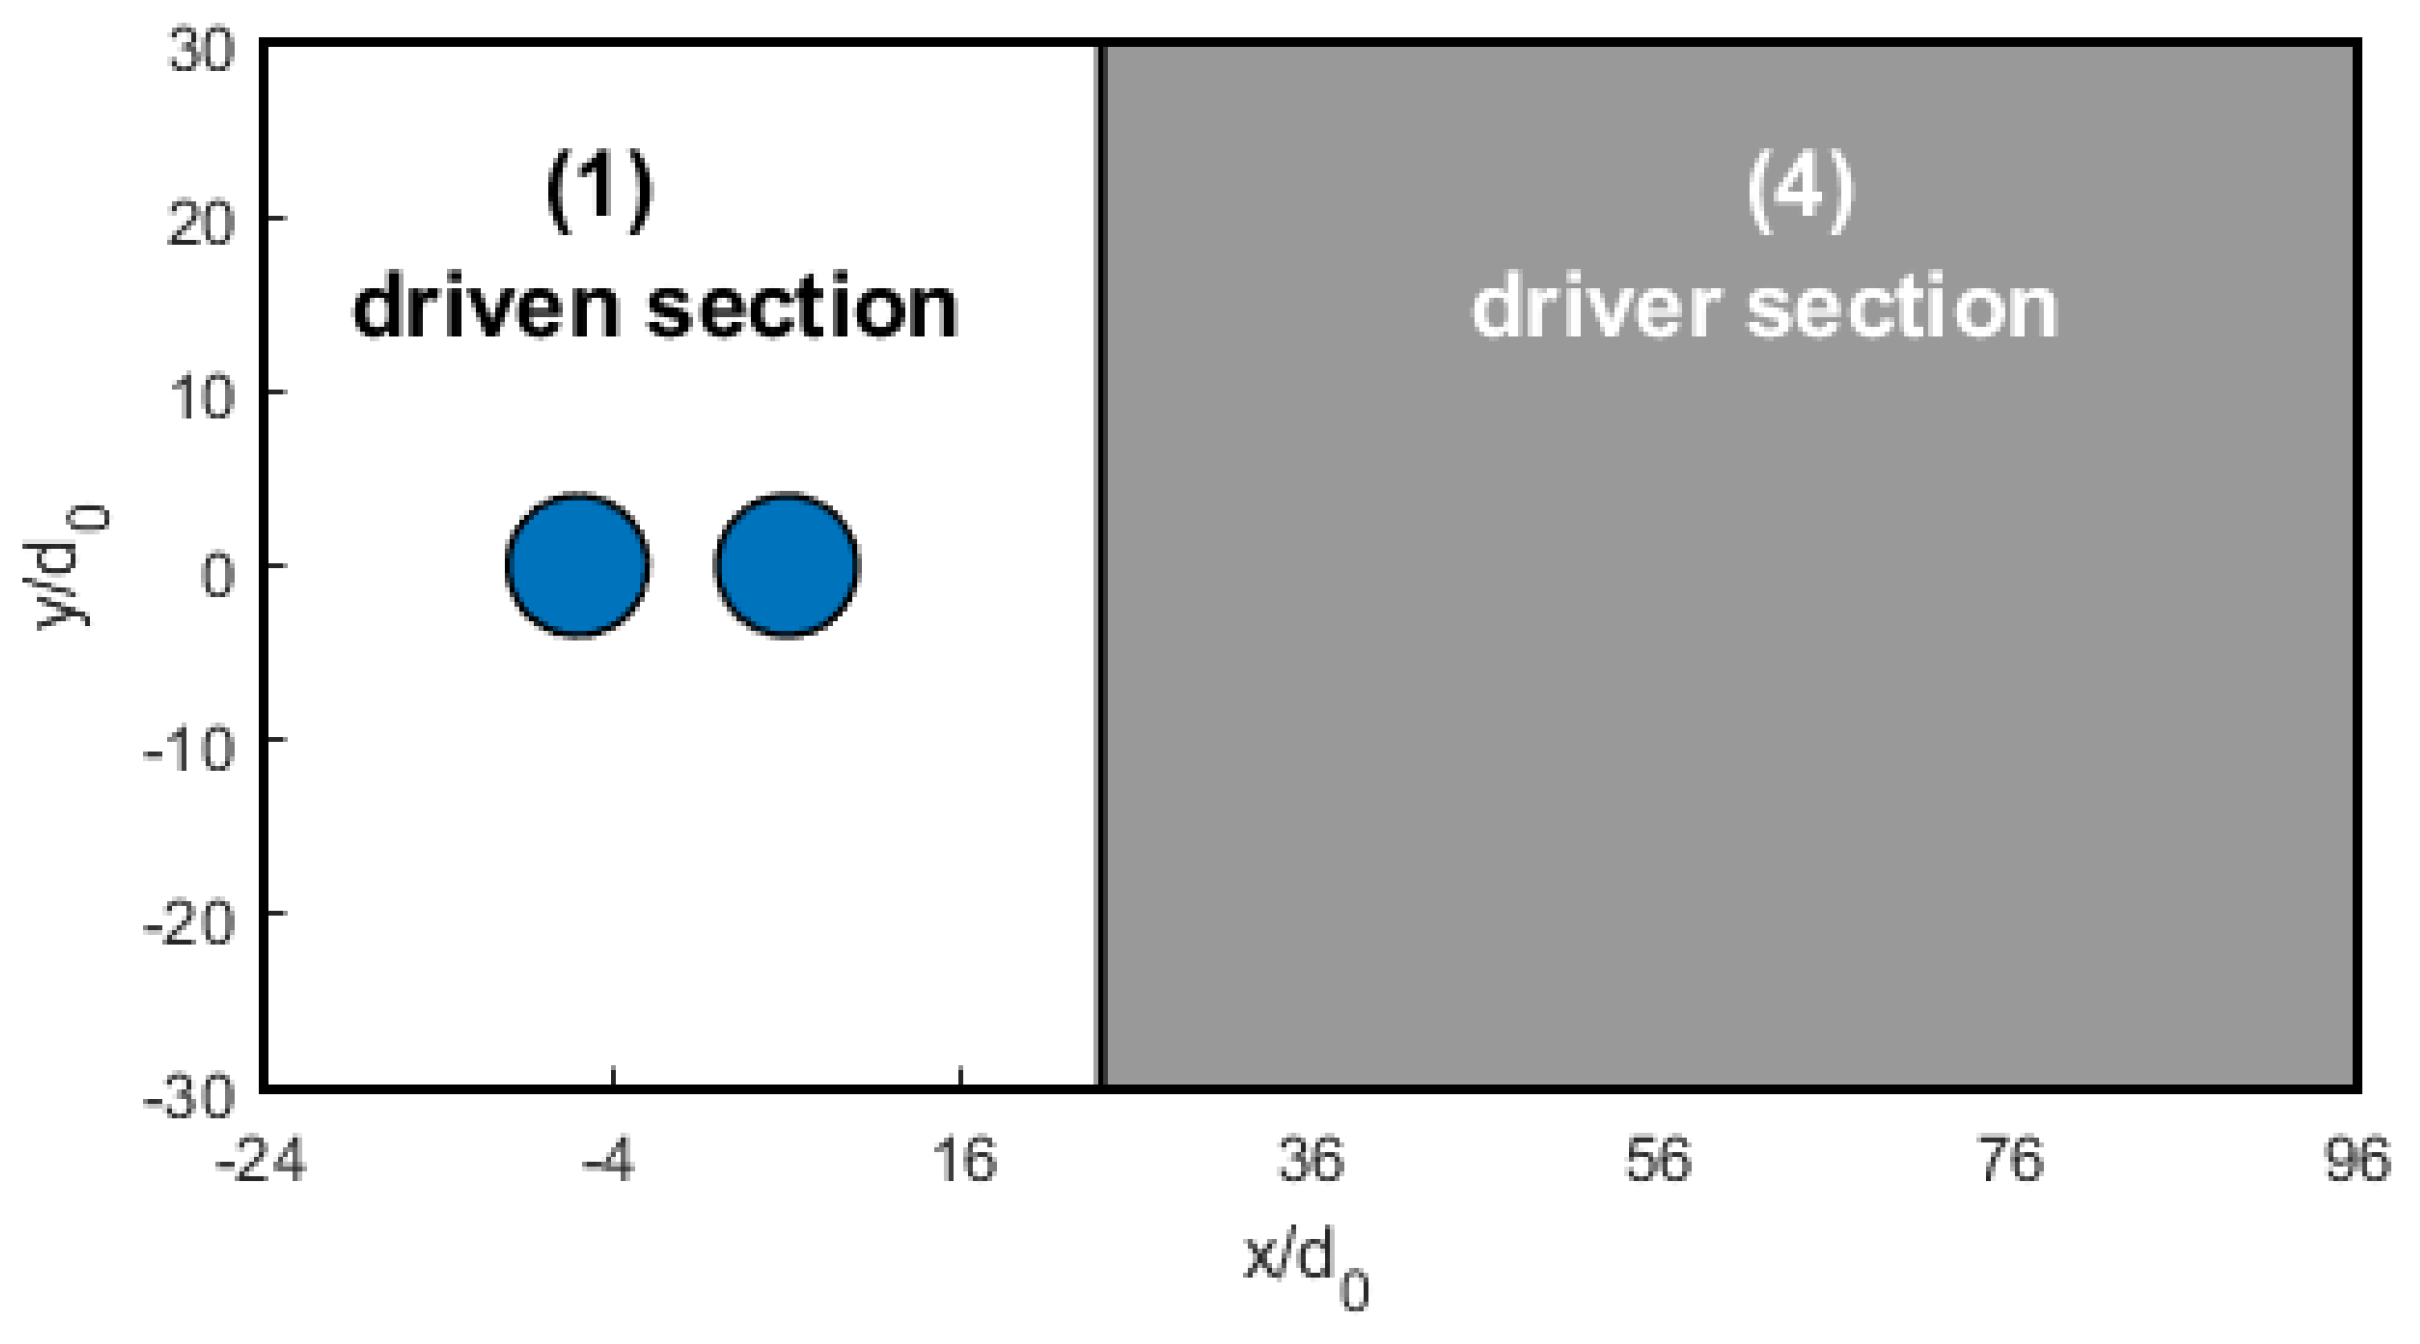
Figure 1. Sketch of the initialized shock-tube flow domain (not in scale) for the streamwise tandem configuration.
Fluids 10 00081 g001
Figure 2. Sketch of half the discretized computational domain, where various nested tessellated regions correspond to an increasing spatial resolution.
Fluids 10 00081 g002
Figure 3. Shock-tube flow: instantaneous profiles of density and velocity (top), as well as pressure and temperature (bottom), for varying spatial resolutions compared against the analytical solution [37].
Fluids 10 00081 g003
Figure 4. Single-column configuration: gas-phase isopycnic lines evaluated at t * 1.18 and 2.12 .
Fluids 10 00081 g004
Figure 5. Single-column configuration: numerical Schlieren contours (right sides) at four different time instants corresponding to t t 0 = 25 μ s , 55 μ s , 115 μ s , and 145 μ s (from top left to bottom right), compared to experimental images [39] (left sides). Images courtesy of Cambridge University Press.
Fluids 10 00081 g005
Figure 6. Single-column configuration: vorticity contours at t * 1.65 (left) and 2.54 (right). The air–water interface is determined by the isolines at α = 0.5 and 0.99 .
Fluids 10 00081 g006
Figure 7. Single-column configuration: vorticity and velocity magnitude contours at six different time instants corresponding to t * 0.23 , 1.18 , 2.12 , 5.88 , 12.9 , and 20 (from upper left to lower right).
Fluids 10 00081 g007
Figure 8. Single-column configuration: normalized leading edge displacement (left) and streamwise extent (right) for various solutions and the initial separation distance of 20 d 0 (top) and 40 d 0 (bottom), compared to experimental results [11].
Fluids 10 00081 g008
Figure 9. Single-column configuration: normalized drift and velocity of droplet CM for the symmetric and non-symmetric configurations compared to reference numerical data [4].
Fluids 10 00081 g009
Figure 10. Streamwise tandem configuration: numerical Schlieren contours sampled at t * 1.2 (a), 3.1 (b), 9.5 (c), and 12.5 (d).
Fluids 10 00081 g010
Figure 11. Streamwise tandem configuration: numerical Schlieren and pressure contours (left), together with vorticity and velocity magnitude contours (right), at different time instants corresponding to t * 3.1 , 14.8 , 25.1 , and 29.8 (from top to bottom).
Fluids 10 00081 g011
Figure 12. Streamwise tandem configuration: leading edge displacement of front (left) and rear (right) columns, compared to experimental results [20].
Fluids 10 00081 g012
Figure 13. Streamwise tandem configuration: streamwise extent of front (left) and rear (right) columns, compared to experimental results [20].
Fluids 10 00081 g013
Figure 14. Streamwise tandem configuration: normalized leading edge displacement (left) and streamwise extent (right) for front and rear columns, compared to the single-column case.
Fluids 10 00081 g014
Figure 15. Spanwise tandem configuration: velocity magnitude contours at t * 1.17 , 1.65 , and 3.06 .
Fluids 10 00081 g015
Figure 16. Spanwise tandem configuration: numerical Schlieren contours at three different time instants: t t 0 = 20 μ s , 30 μ s , and 40 μ s (from left to right).
Fluids 10 00081 g016
Figure 17. Spanwise tandem configuration: contours of velocity magnitude (left) and liquid volume fraction (right) at three different time instants corresponding to t * 3.1 , 12.5 , and 21.9 (from top to bottom).
Fluids 10 00081 g017
Figure 18. Spanwise tandem configuration: normalized leading edge displacement (left) and streamwise extent (right) for both columns, compared to the single-column case.
Fluids 10 00081 g018
Table 1. Summary of boundary conditions.
BoundarypT u α
Driver section sidezeroGradientzeroGradientfixedValuefixedValue
Driven section sidezeroGradientzeroGradientzeroGradientzeroGradient
Lateral sideszeroGradientzeroGradientslipzeroGradient
Table 2. Shock-tube flow: initial conditions.
ParameterSymbolValue
Driven section pressure p 1 101.3 kPa
Driven section density ρ 1 1.204 kg / m 3
Driver section pressure p 4 640 kPa
Driver section density ρ 4 7.61 kg / m 3
Temperature T 1 = T 4 293.15 K
Velocity u 1 = u 4 0 m / s
Table 3. Post-shock airflow parameters.
ParameterSymbolValue
Pressure p 2 238.1 kPa
Density ρ 2 2.18 kg / m 3
Temperature T 2 381.1 K
Velocity u 2 225.8 m / s
Disclaimer/Publisher’s Note: The statements, opinions and data contained in all publications are solely those of the individual author(s) and contributor(s) and not of MDPI and/or the editor(s). MDPI and/or the editor(s) disclaim responsibility for any injury to people or property resulting from any ideas, methods, instructions or products referred to in the content.