Abstract
The Gurney flap (GF) is a simple flat plate frequently mounted at the airfoil rear. Several investigations have been devoted to studying the effect of a rigid or even movable GF on the aerodynamic behavior of several devices such as flapping airfoils and vertical or horizontal axis turbines. The present paper proposes a new concept of a deformable Gurney flap (DGF) to improve the output power of a flapping airfoil in vertical mode. The advantage of this model is the full control of the effect on the GF during the flapping movement. The DGF is expandable and contractible which allows for monitoring and adjusting the pressure distribution at the appropriate time and position. By using a 2D transient simulation with a specific dynamic mesh design, an extended numerical analysis has been provided. It was found that this model is able to increase the output power by 19.5%. Furthermore, the concept of the DGF is applied on flapping turbines in hybrid modes such as swing arm mode and D-shaped mode. These modes are investigated to clarify the studied model’s advantage and to demonstrate the possibility of applying this strategy to control the different flapping movements.
1. Introduction
By taking a look at the behavior of many birds and fish, it becomes clear that they have a wonderful ability to maneuver and move with complete freedom in the air and water with low energy consumption, especially for migratory birds and fish. These organisms use the flapping motion of their wings and tails to control the surrounding flow and improve their maneuverability. The flapping motion is a complex movement that is constructed from the combination of two or more movements depending on the followed trajectory [1,2,3,4]. In the fully described flapping motion, pitching motion and heaving along the vertical and/or horizontal axis are synchronized in a predetermined manner to extract energy or generate propulsion. A bird’s ability to change direction while maintaining its stability using its tail has inspired many researchers to use a Gurney flap (GF) which is a simple flat plate mounted at the airfoil rear to control the flow. It is used in several application such as race cars, helicopter tails, and turbine blades [5,6,7]. This device, despite its simplicity, is capable of changing the vortices’ shedding modes and therefore their interactions. The impact of Gurney flaps on airfoil performance was discussed by Liebeck [8]. It was highlighted that selecting the right Gurney flap height is crucial for optimizing both lift and drag. While a 1.25% chord flap height can be beneficial for a Newman airfoil, a 2% chord height can significantly increase drag. This trend was also observed in NACA4412 airfoils [9]. Increasing lift with a Gurney flap comes at the cost of increased drag, though the impact can vary depending on the desired lift force [5,10,11]. Therefore, choosing the right Gurney flap height is essential for improving overall airfoil performance. Giguere et al. [11] showed that flaps between 0.5% and 5% of the airfoil’s chord length can significantly increase lift with minimal drag increase. The ideal height matches the boundary layer thickness at the airfoil’s trailing edge. Geronatkos and Lee [12,13] showed that Gurney flaps enhance dynamic lift on a pitching NACA0012 airfoil. A large number of studies have been devoted to studying the effect of GFs on vertical axis turbines (VAWTs). For a Darrieus turbine, Bianchini et al. [14] determined the appropriate length of a GF that allows expanding the turbine operating range. A 2%c GF fixed on the suction surface ensured an improvement by 23.1% at a tip speed ratio (TSR) = 3.3. To increase the competitiveness of VAWTs compared to commercial HAWTs, Syawitri et al. [15] computationally investigated the effect of GFs on three-blade VAWTs. It was found that the model with a single blade is not sufficient to decide about the optimum GF configuration, owing to different modes of interaction and diverse GF geometries and their performance in different flow regimes. The researchers showed that, at a low TSR, GFs had a clear effect on the output power where an improvement by about 233.19% was recorded. Further studies [16,17] shared that Gurney flaps can be a valuable tool for enhancing lift in various applications such as variable speed rotors and Wells turbines, but selecting the appropriate height was crucial for optimal performance. To improve the output power of a flapping turbine, Xie et al. [18] used a fixed GF centered at the back of the airfoil, so that it instantaneously affected the upper and lower surfaces of the airfoil. The proposed model targeted changing the airfoil operative camber and the form of the leading-edge vortex. It was found that the GF advantageously changed the adverse pressure on the upper surface which increased the velocity over the lower surface and delayed the flow separation. The pitching GF is another recently used concept [19,20,21]. This model of GF is distinguished by its ability to change its position during the flapping motion of the main airfoil. Its design considers that the flapping motion consists of two phases, upstroke and downstroke, which makes the pressure side change between the upper and lower surfaces and the GF needs to be located regularly at the pressure side. So, this model of GF tracks the airfoil pressure side. It was found that, unlike the fixed type, using this type could extend the length of the GF slightly. Sun et al. [22] studied the behavior of leading-edge vortex LEV for different phase angles between a movable GF and the flapping airfoil. For a specific phase angle, the improvement of energy extraction was assured. Yongcheng Li [23] studied the mechanism used by GFs to affect the turbine’s ability to generate thrust. It was found that the GF had a pronounced effect during the entire flapping cycle. It was also found that, in order to improve propulsion, the GF must be installed at the farthest point from the leading edge. Table 1 provides a summary of recent computational studies that deal with the concept of fixed, movable, and flexible GFs.

Table 1.
Summary of recent computational studies that deal with the concept of GFs for energy extractions using flapping airfoils.
The present paper introduces a novel concept of longitudinally deformable Gurney flaps. Unlike the previously discussed fixed and movable flaps, these flaps deform in coordination with the airfoil’s motion. The advantage of this model is its ability to increase the lift force during both the downstroke and the upstroke phases separately, resulting in more overall lift. The GFs deform successively, such that one of them expands in the first half of the movement and shrinks significantly in the second half, to the point where their effect disappears completely. This behavior prevents any inconsistent effect between these GFs and conventional GFs.
2. Numerical Model and Methods
2.1. Model Description and Motion Modeling
Unlike a simple up-and-down motion, the flapping motion is a mixture between pitching and plunging motions with a phase difference, as shown in Figure 1.

Figure 1.
(a) Prescribed heaving and pitching motions in simple vertical mode; (b) Description of forces’ directions.
The equations of pitching and plunging of the main airfoil are:
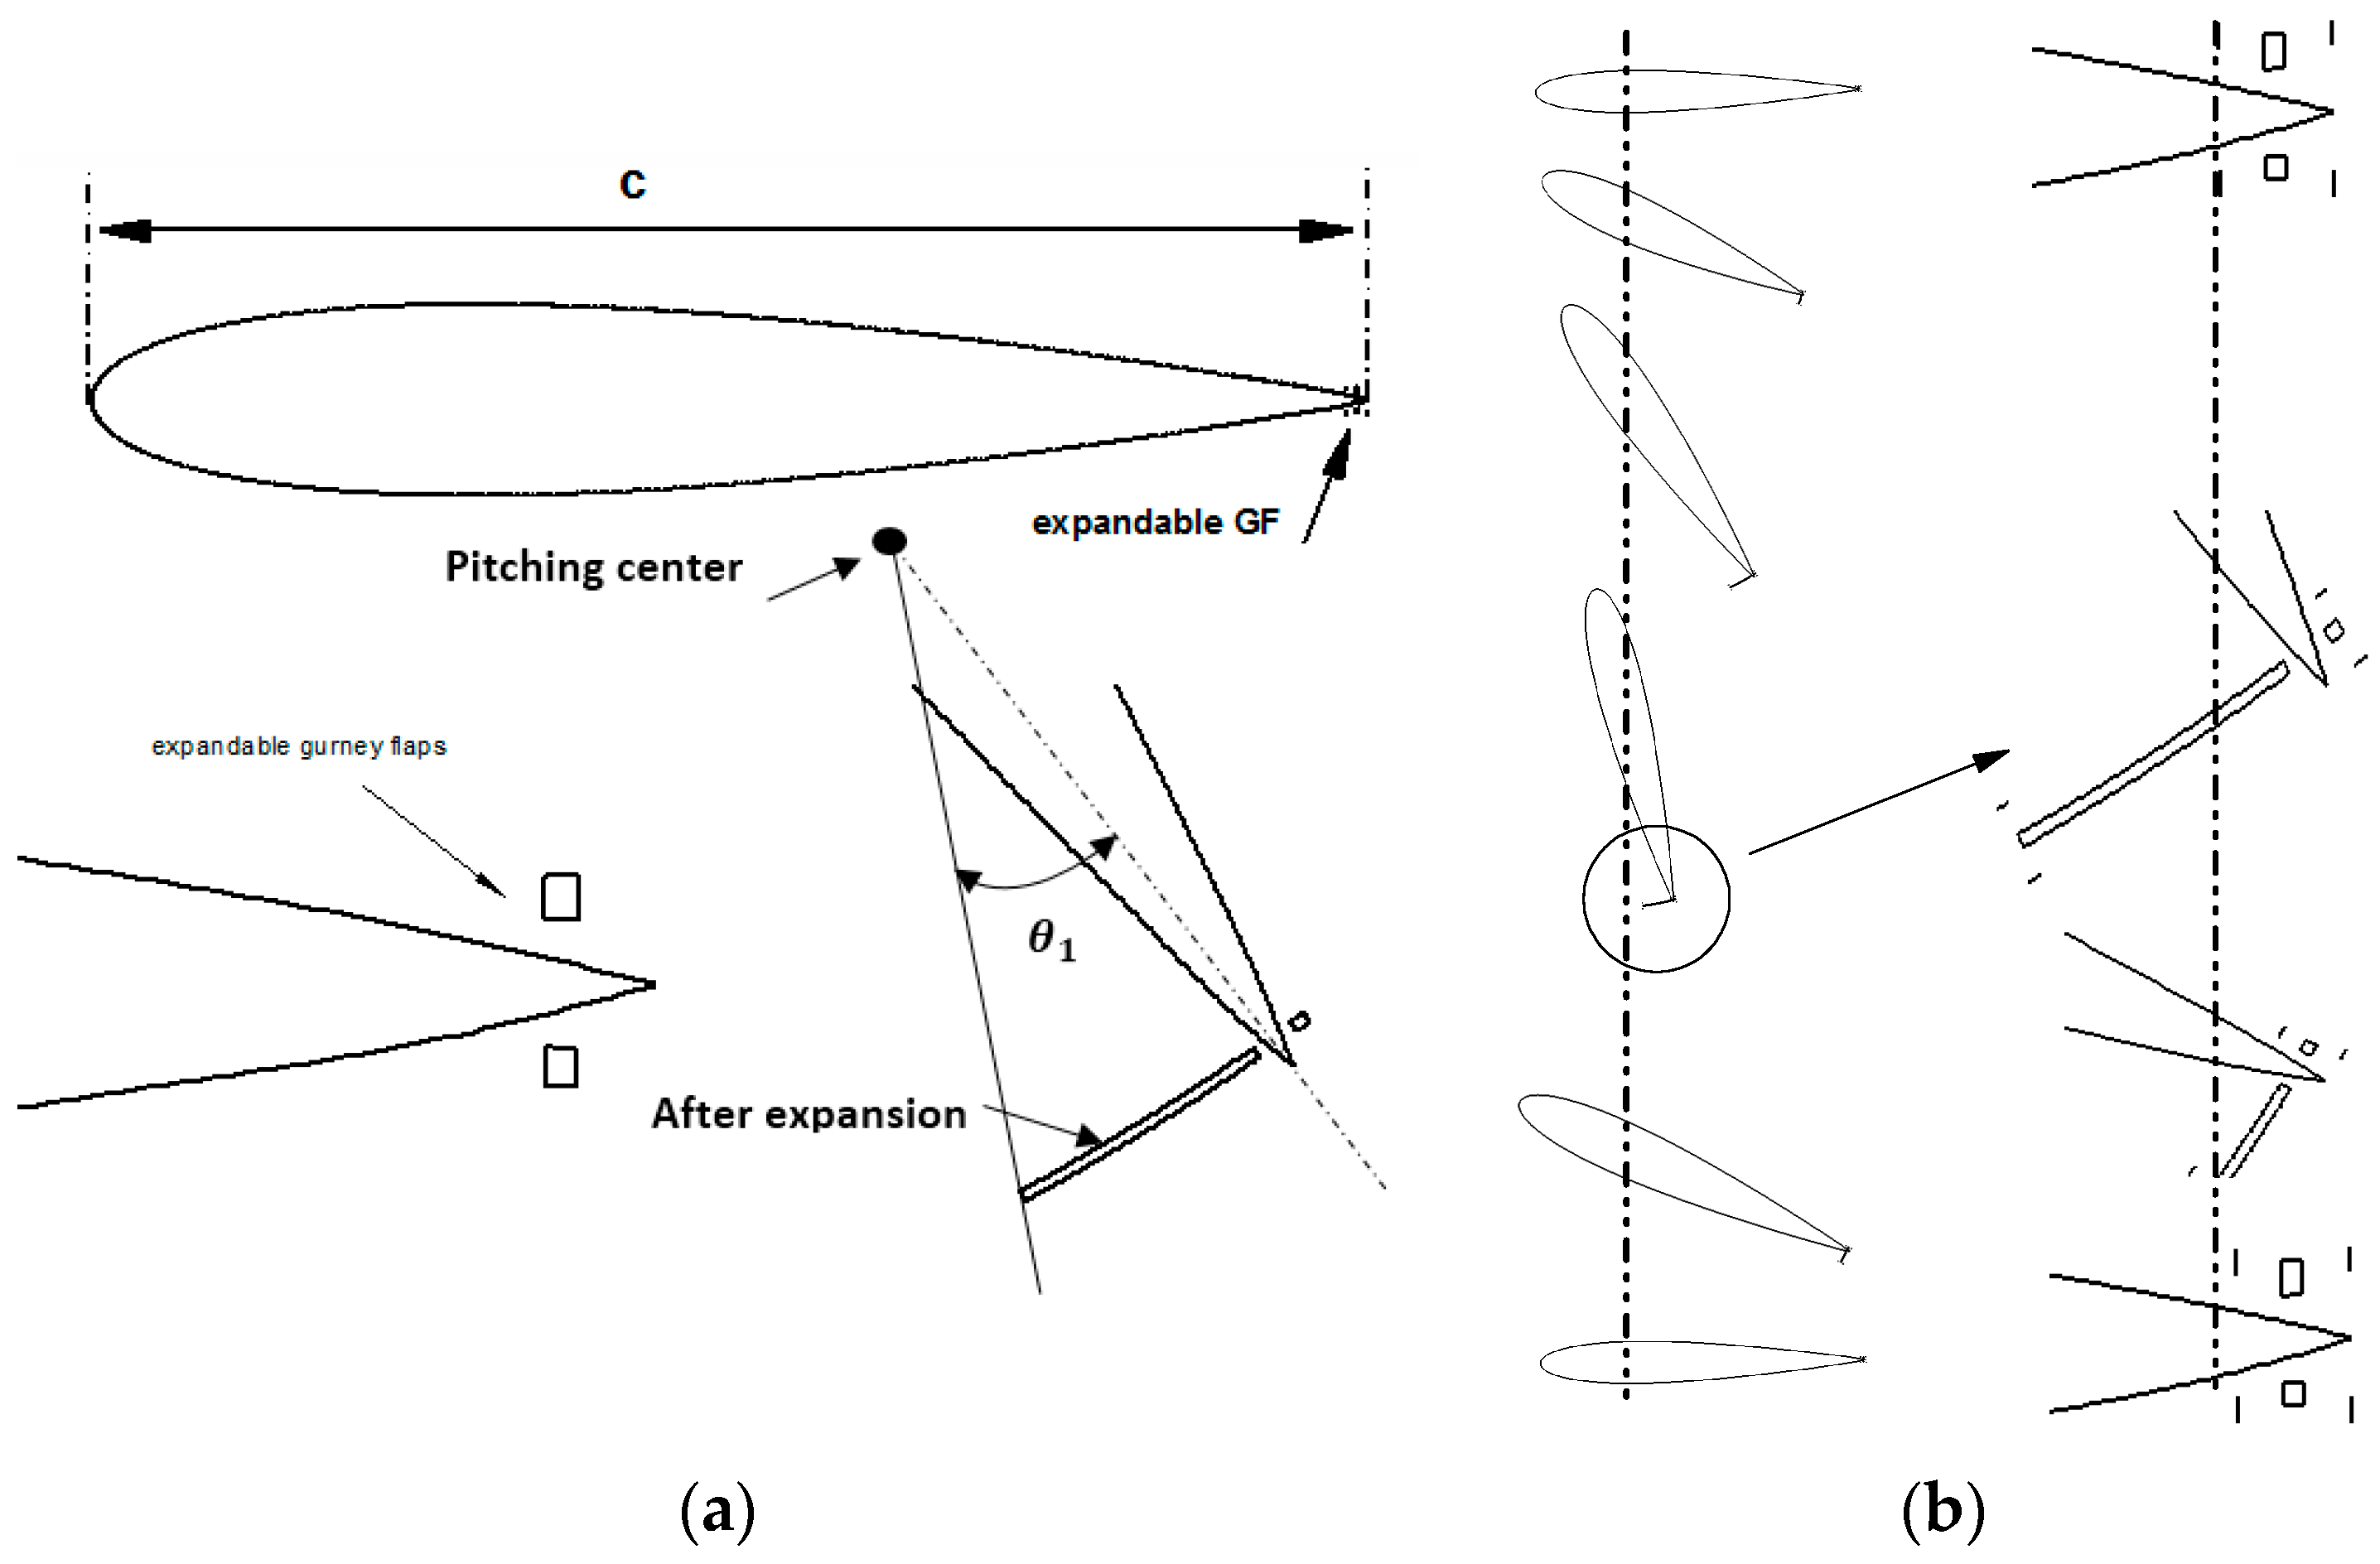
where is a constant amplitude, is the flapping frequency, is the pitching amplitude, and is the phase difference between the pitching and plunging motions. In the present research a NACA0015 airfoil is used as a standard airfoil profile. This comparison of the acquired results with previous work by Kinsey et al. [27,28] justifies it and confirms the present solver accuracy. The deformable GFs are originally very small squares fixed at the trailing edge (Figure 2a). The GFs deform successively, such that one of them expands in the first half of the cycle and returns to the initial shape (a small square) in the second half. The deformation amplitude is figured as an angle from the pitching center noted as .
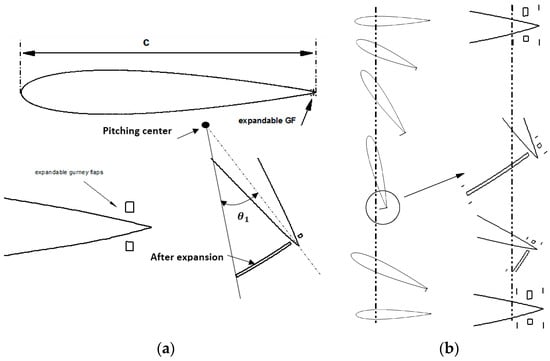
Figure 2.
(a) Schematic illustrating the proposed model and (b) DGF deformation during the upstroke.
At t = 0, the GF on the upper surface of the airfoil begins to expand and achieve the maximum deformation amplitude at t = 0.25 T. Here, T is one flapping cycle time. After that, the GF regularly returns to the initial shape at t = 0.5 T. During this first half, the GF on the lower surface remains motionless. In the next half period and with the same mechanism, the GF of the lower surface deforms instead of the upper surface one. The GF’s motion is governed by:
Table 2 lists the parameters used in the present numerical simulation.

Table 2.
Parameters used in the present numerical simulation.
When the airfoil performs vertical motion, it presents an induced attack angle.
Therefore, the effective incoming velocity, , and the effective angle of attack, , are [5]:
The airfoil dynamic stall and the behavior of generated vortices are strongly affected by the maximum effective angle of attack and the maximum effective upstream velocity [29].
The two quantities appear generally at the end of the first quarter and are given as:
The feathering parameter introduced by [28] helps to identify the power extraction or the propulsion regime, and it can be defined as:
Generally, when , it means that and the airfoil is in a propulsion regime.
To extract energy, the feathering parameter must be and the effective angle [28].
The sum of powers extracted or consumed by each movement is known as the overall extracted power.
Pitching motion’s power extraction can be expressed as follows:
where is the torque about the pitching center .
The equation that controls the flap deformation is given by Equation (2), where is the flap pitching amplitude.
Relative to the pitching center, the power consumed by the deformable flap is given as
The power extracted by vertical motion is specified as
where L(t) is the lift force.
The average extracted power during one flapping cycle is set non-dimensionally as:
where and .
The force coefficients and are given as:
where is the fluid density, C is the airfoil chord, and is the referenced cross-sectional area of the airfoil.
For reversed D and swing arm turbines, the extracted power during one flapping cycle is established as:
where ,
2.2. Dynamic Mesh Techniques and Mobile Grid Design
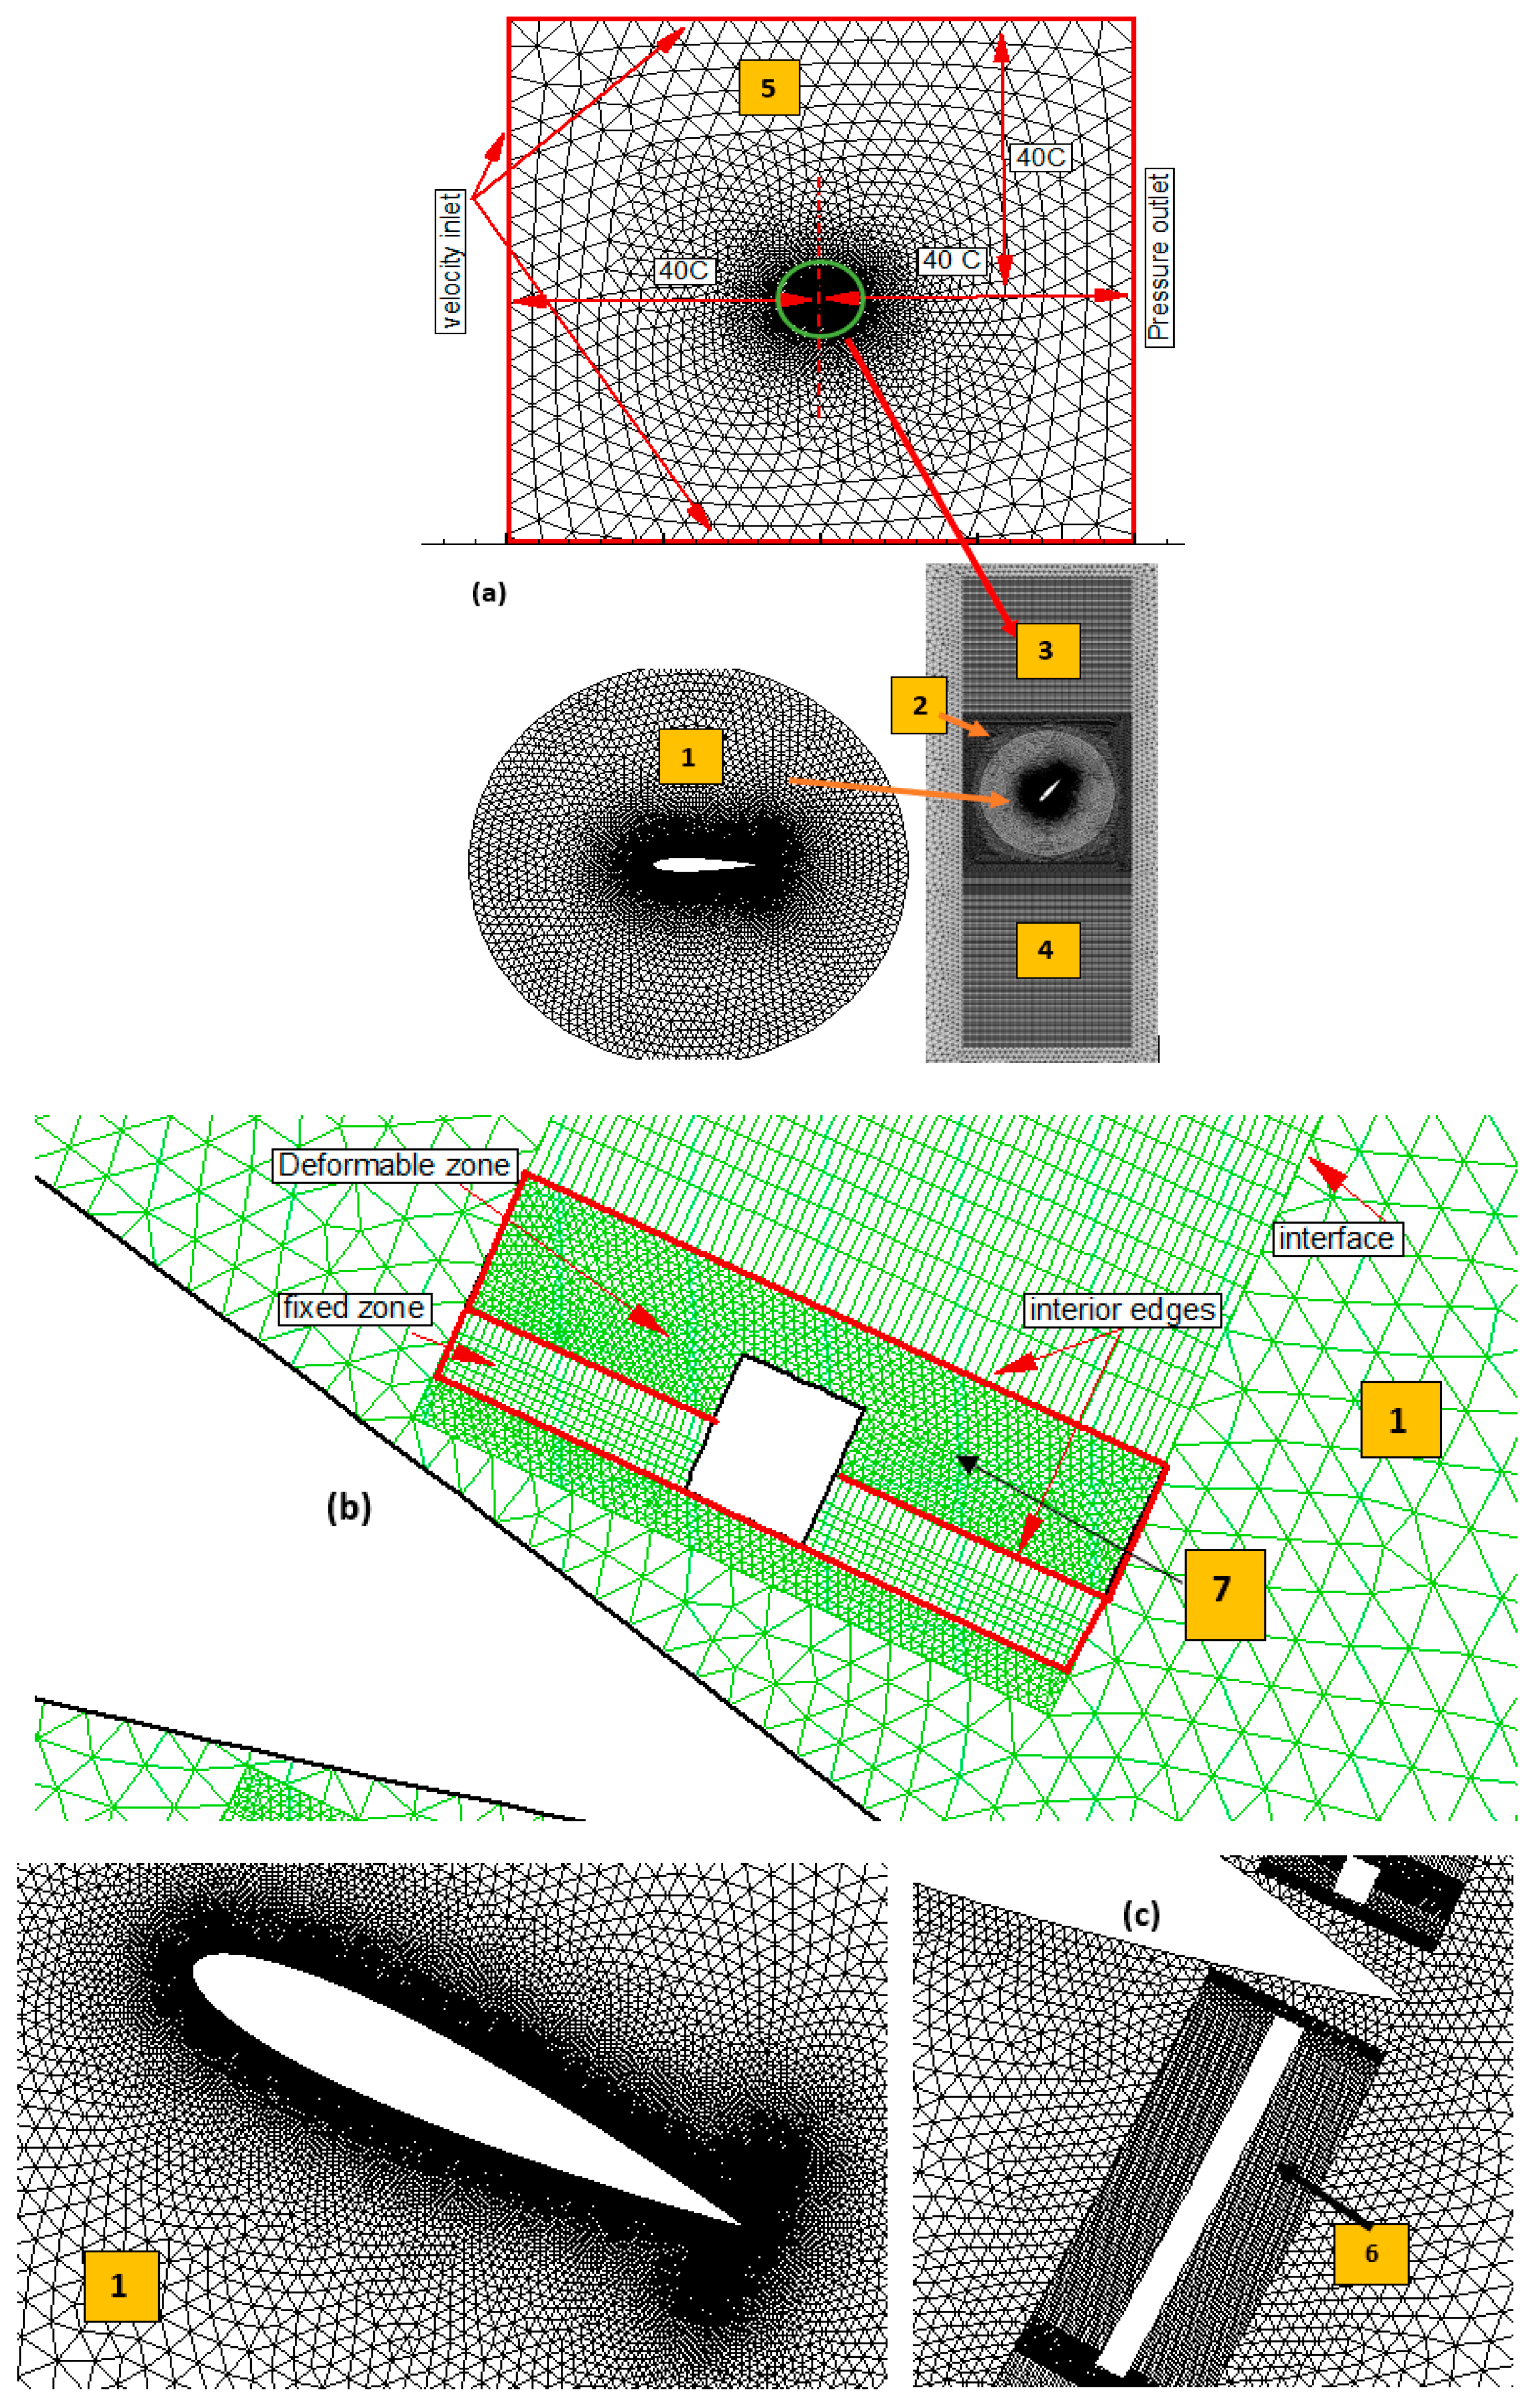
This research involves two Gurney flaps’ installation on the suction and pressure surfaces of the airfoil, located near the trailing edge, while maintaining the airfoil’s initial shape, as depicted in Figure 2a. The DGFs and the main airfoil are regarded as separate entities, each with its own equations of motion. The aerodynamic forces’ evaluation is conducted for each component independently. Following this, the total forces acting on the proposed model are determined using external software. The movement in the Y direction is performed using a layering technique where zone 1 and zone 2 slide in zones 3 and 4. The zone 2 borders are two edges of the interior type that permit cutting or merging the adjacent cells. The pitching is achieved by rotating zone 1 around the pitching center using a sliding technique (Figure 3a). Zone 1 has a radius of 2.5c. The expandable part of the GF is zone 7 that moves rigidly by a sinusoidal motion (see Figure 3b). This technique has been adopted to preserve the grid quality during its deformation. The borders of this zone are also two edges of the interior type. This type of edge allows cutting or merging the adjacent cells.
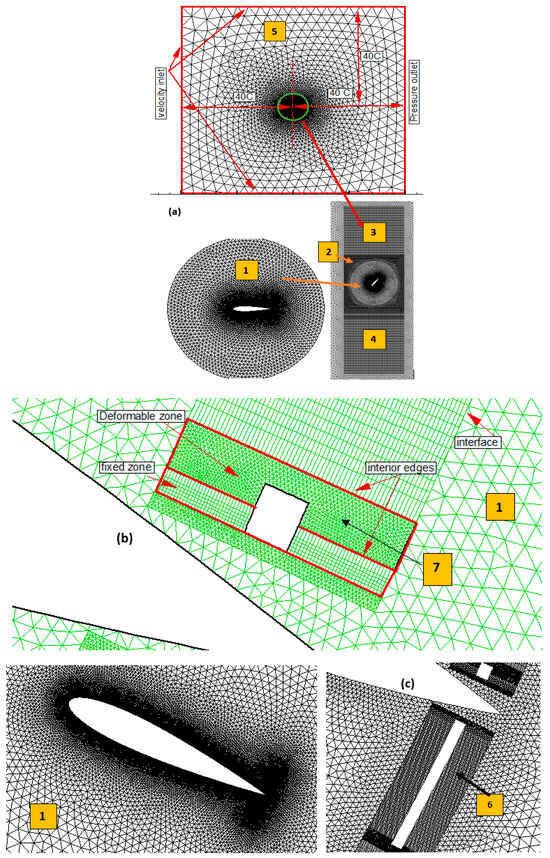
Figure 3.
(a) Dynamic mesh model using a combination between sliding and layering techniques; (b) Moving mesh design for DGF; (c) Mesh updating during GF expansion.
The computational grid extends 35c from the pitching center to the inlet boundary and 60c from the pitching center to the outlet. This extension is sufficient to ignore the external boundaries’ effect on the flow near the airfoil [25]. The cell type in zones 3, 4, and 6 is quadrilateral and this type of cell is required by the layering technique. All zones that move rigidly have triangular cells. The laminar flow is approved for all computational tests where the Reynolds number is defined as Re = = 1100. The coupling of pressure–velocity is accomplished using the SIMPLE algorithm. A second-order scheme is adopted for all transport equations. The mesh density is controlled via size functions and the grid specifics are listed in Table 3. A user-defined function (UDF) that describes the equation of motion and calculates the time-varying forces is compiled in Ansys Fluent 22. The macro DEFINE_EXECUTE_AT_END is hooked in Ansys Fluent 22, which ensures that the forces are saved at each time step in an external file. The last 3 periods of 8 periods are used to calculate the average quantities. All simulations were executed using an HP Z2 Tower G9 Workstation with a 16-core processor. Table 3 listed the grid details. The edge interval size for zones 3 and 4 (edge length of 5c is chosen to be the same as the maximum cell size of zone 2 to ensure an ideal cell updating using the layering technique.

Table 3.
Grid details.
The flow analyzed in this research is inherently three-dimensional; however, the experimental investigations by Wernert et al. [29] and Lee et al. [30] concentrated on achieving a two-dimensional flow within the mid-span plane. Wernert et al. [29] validated the existence of two-dimensional flow through flow visualization experiments, while Lee et al. [30] noted that the two-dimensional non-uniformity of the flow over the airfoil at a Reynolds number of remained within 4% of the free stream value. As a result, the current simulations utilize a two-dimensional geometric configuration. Additionally, at a moderate Reynolds number of Re = 10,000, Kiensy et al. [28] employed a URANS approach based on the Spalart–Allmaras model to preliminarily evaluate the turbulence effects. Their comparison of laminar (Re = 1100) and turbulent (Re = 10,000) models indicated no significant qualitative differences in the power extraction cycles, apart from slightly heightened extrema associated with increased force coefficients. Although an alternative Karman vortex street is expected to develop behind the airfoil, Y.H. Xie et al. [18] investigated the effect of a Gurney flap on the performance of flapping airfoils at using a laminar model. Furthermore, Young et al. [31] and Xiao et al. [32] also support the use of a laminar model at . Considering the existing literature and the fact that all cases are analyzed at a chord Reynolds number of 1100, the current simulations adopt a two-dimensional geometric configuration with the assumption of laminar flow.
3. Results
3.1. Time Step and Grid Independency
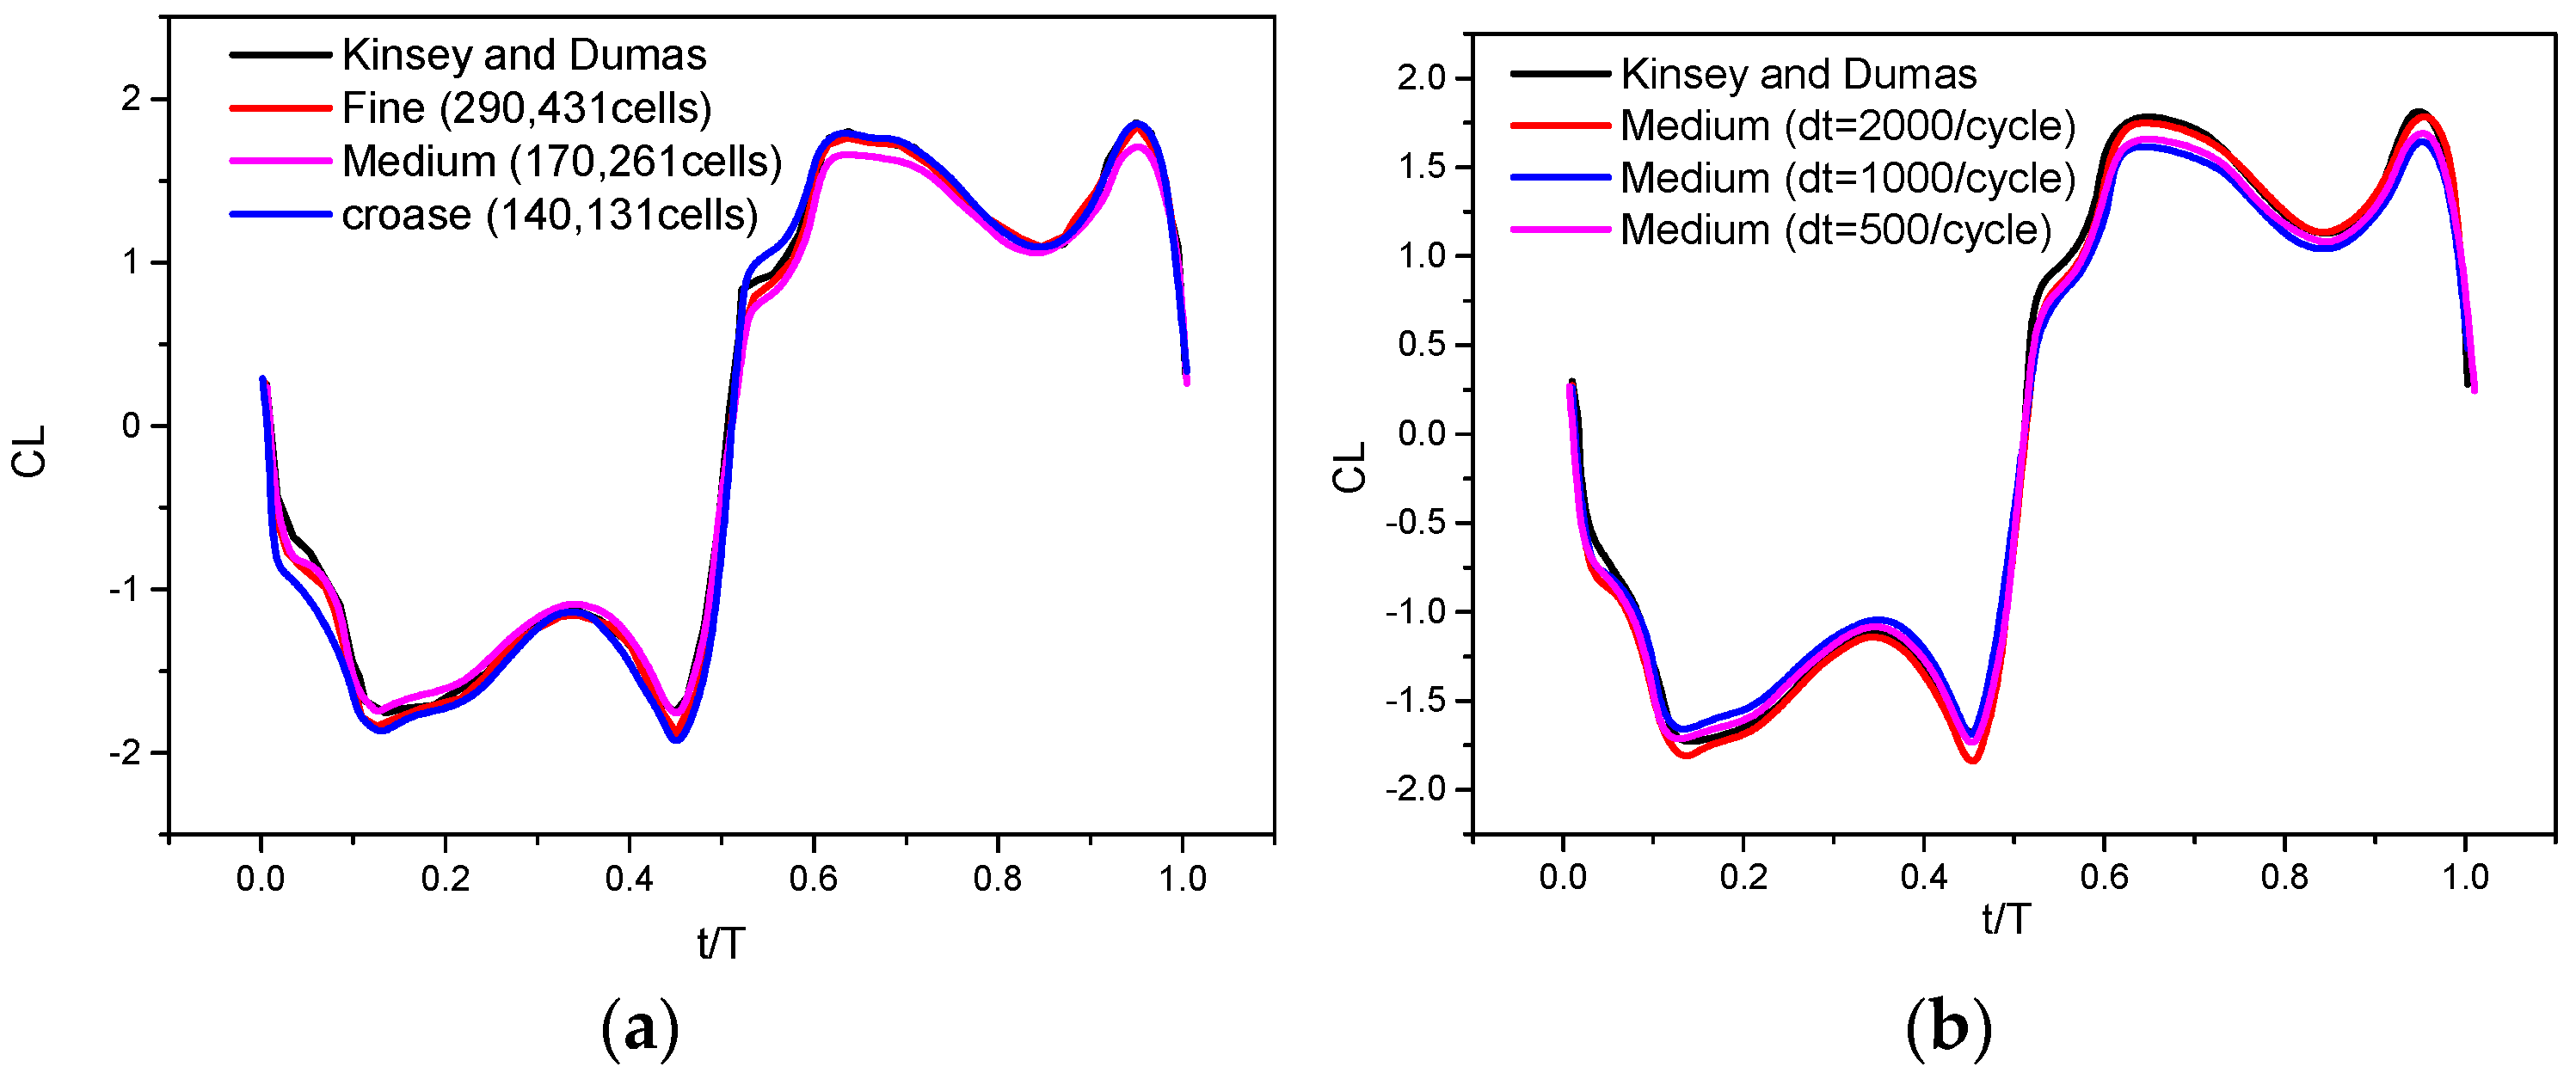
To check the grid independency, both lift coefficient CL(t) and power coefficient Cp (t) are evaluated compared to [28] at 0.14 and = 76.33° for a Reynolds number (Re) = 1100. The study by [28] provides a mapping of power extraction efficiency as a function of and . It was found that the highest efficiency can be achieved for 70 < < 80 and 0.12 < < 0.18. The results are also compared with [33] at = 0.1, = 75°, and . The airfoil in the work carried out by [28] executed a vertical path while [33] performed a reversed D-shaped trajectory. Figure 4a shows that the lift curve by the present solver almost matches the curves provided by [28]. This means that the influence of the grid number and time step can be practically ignored.
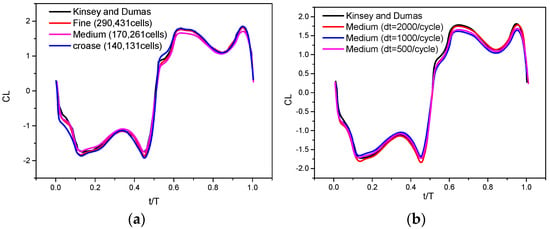
Figure 4.
(a) Effect of grid density on time varying lift CL(t); (b) Time step test.
As shown in Figure 4b, three time steps are tested. It was concluded that a time step ∆t = 1000/cycle preserves the results’ accuracy. For = 0.14, the flapping cycle takes about 4.46 s. Table 4 compares the details of grid and time-step refinement with some works available in the literature to give an idea about the selection method. Rational choice requires taking into account the computing time and the required resources to perform the computational simulation. A medium grid and a time step of 1000 per cycle are selected. The running time required to finish eight flapping cycles by different grids is listed in Table 3.

Table 4.
Details of grid and time-step refinement.
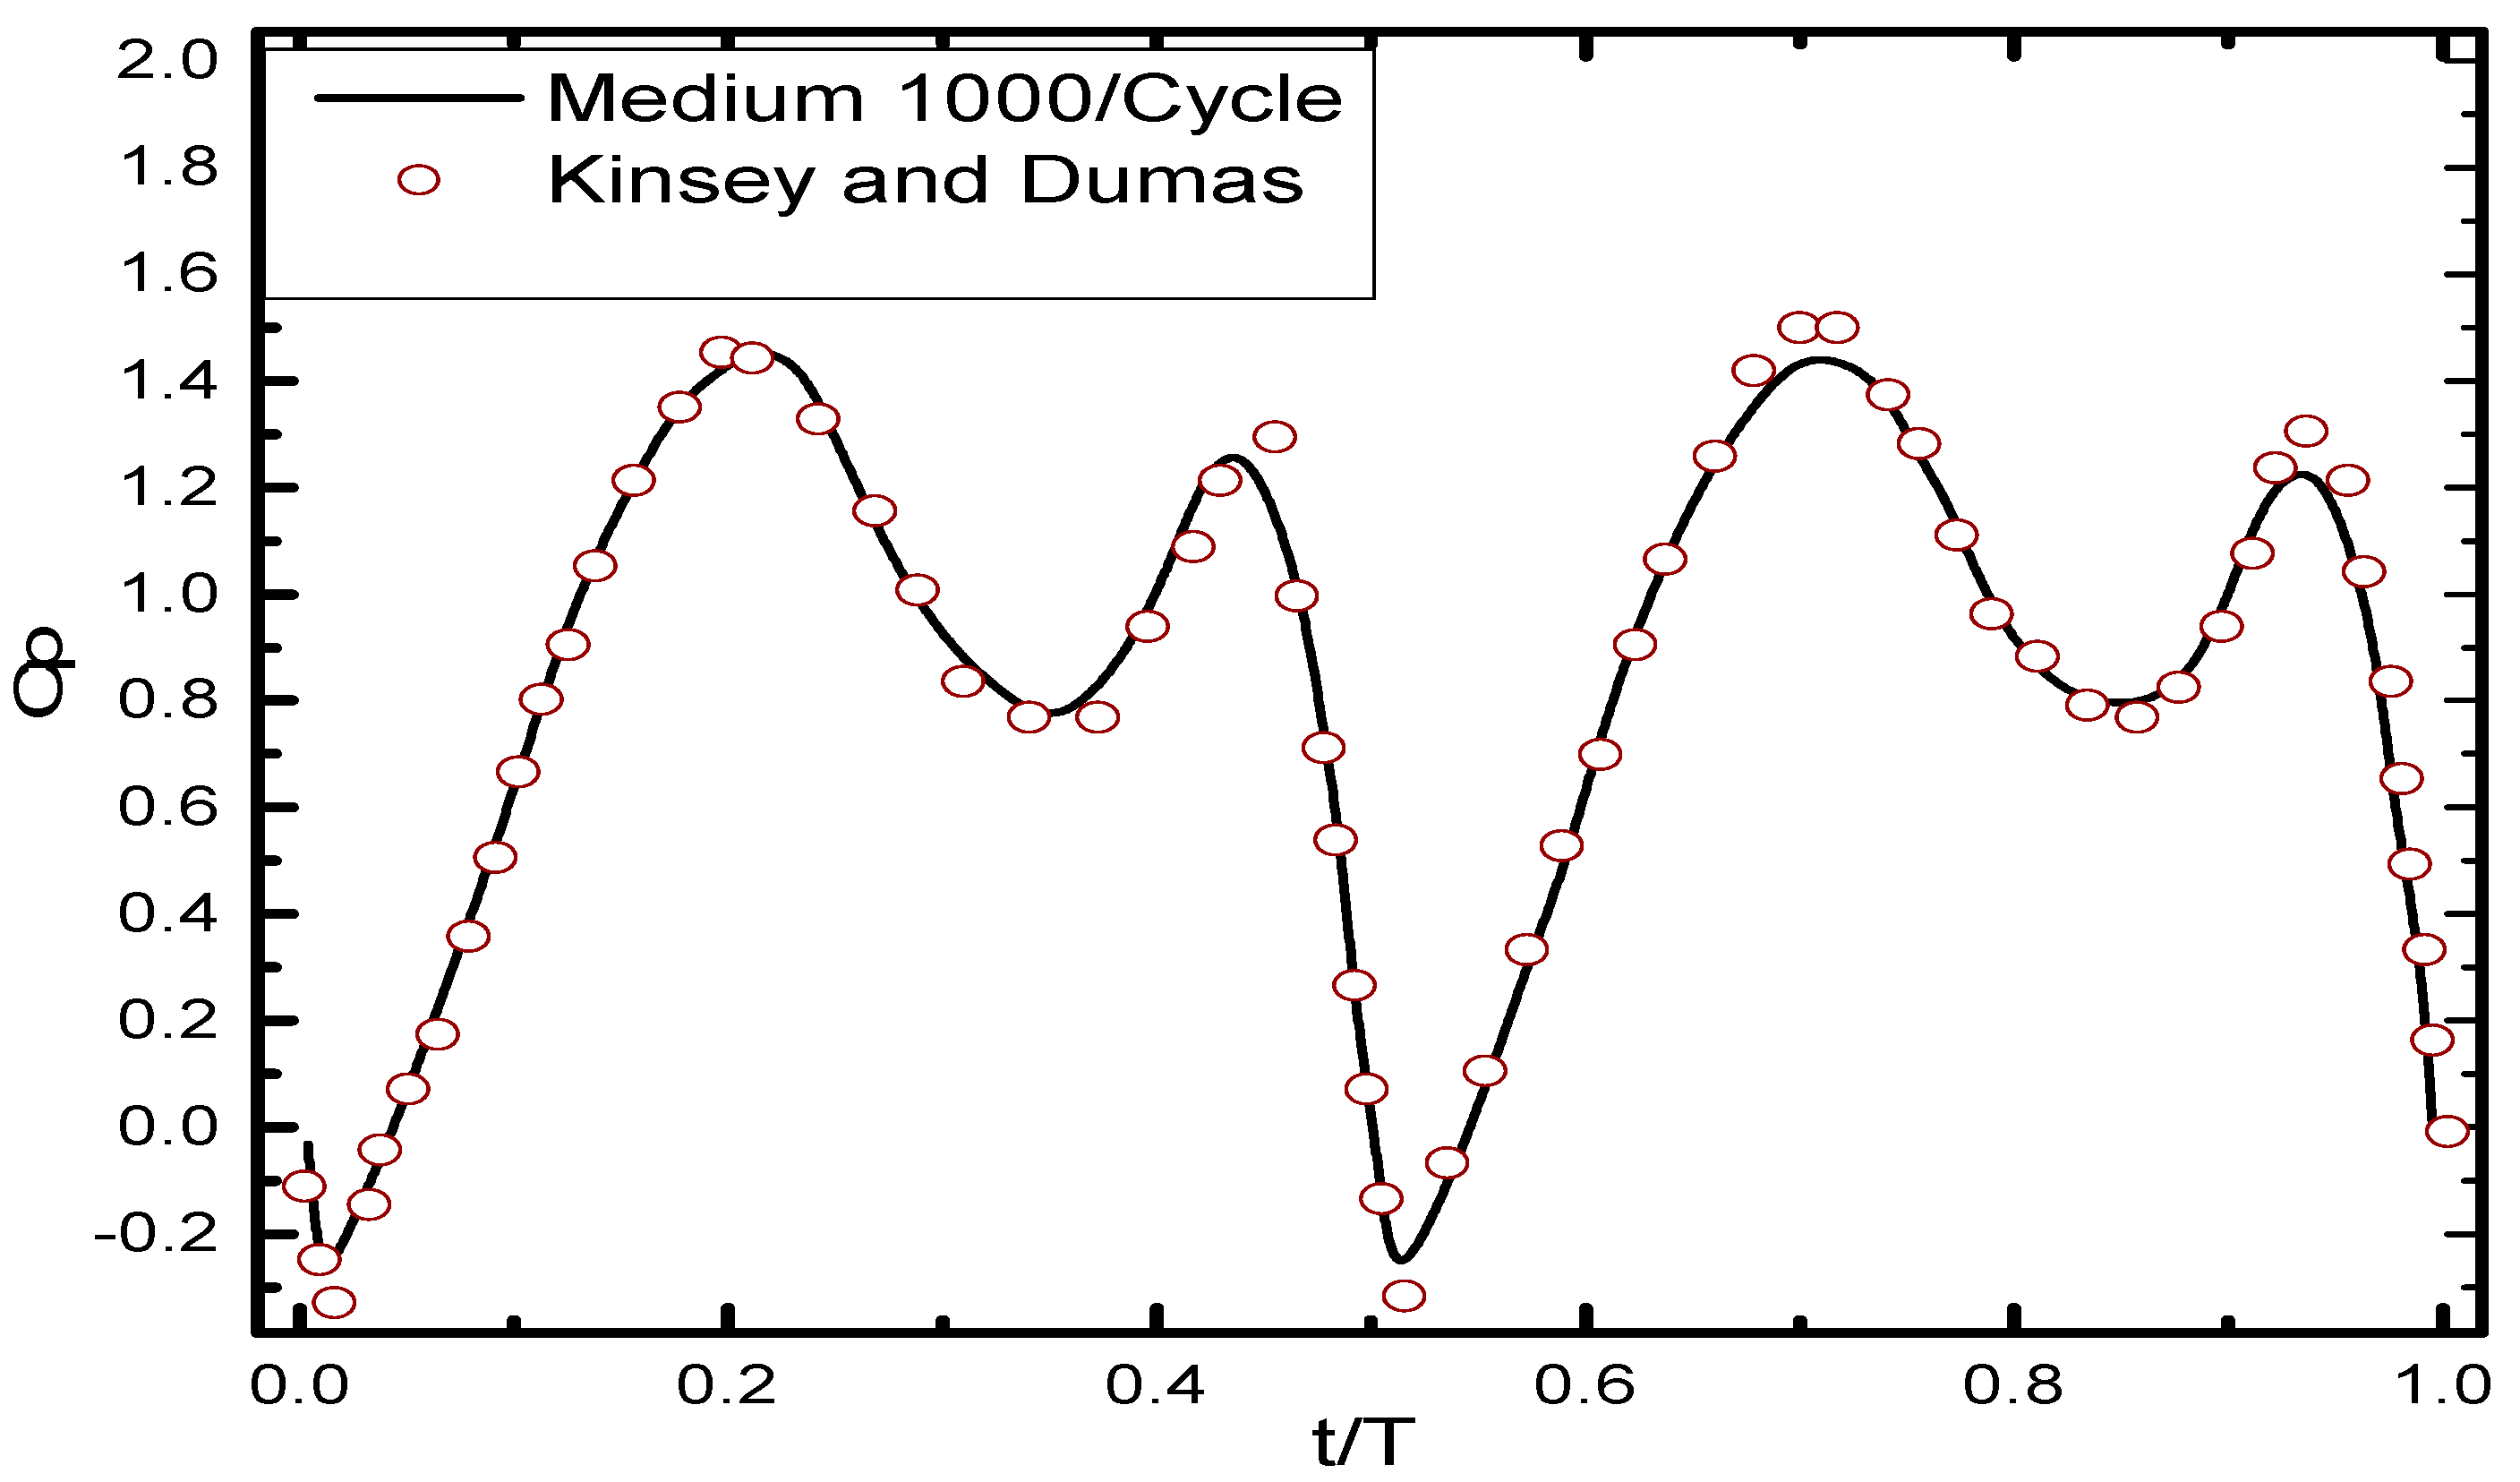
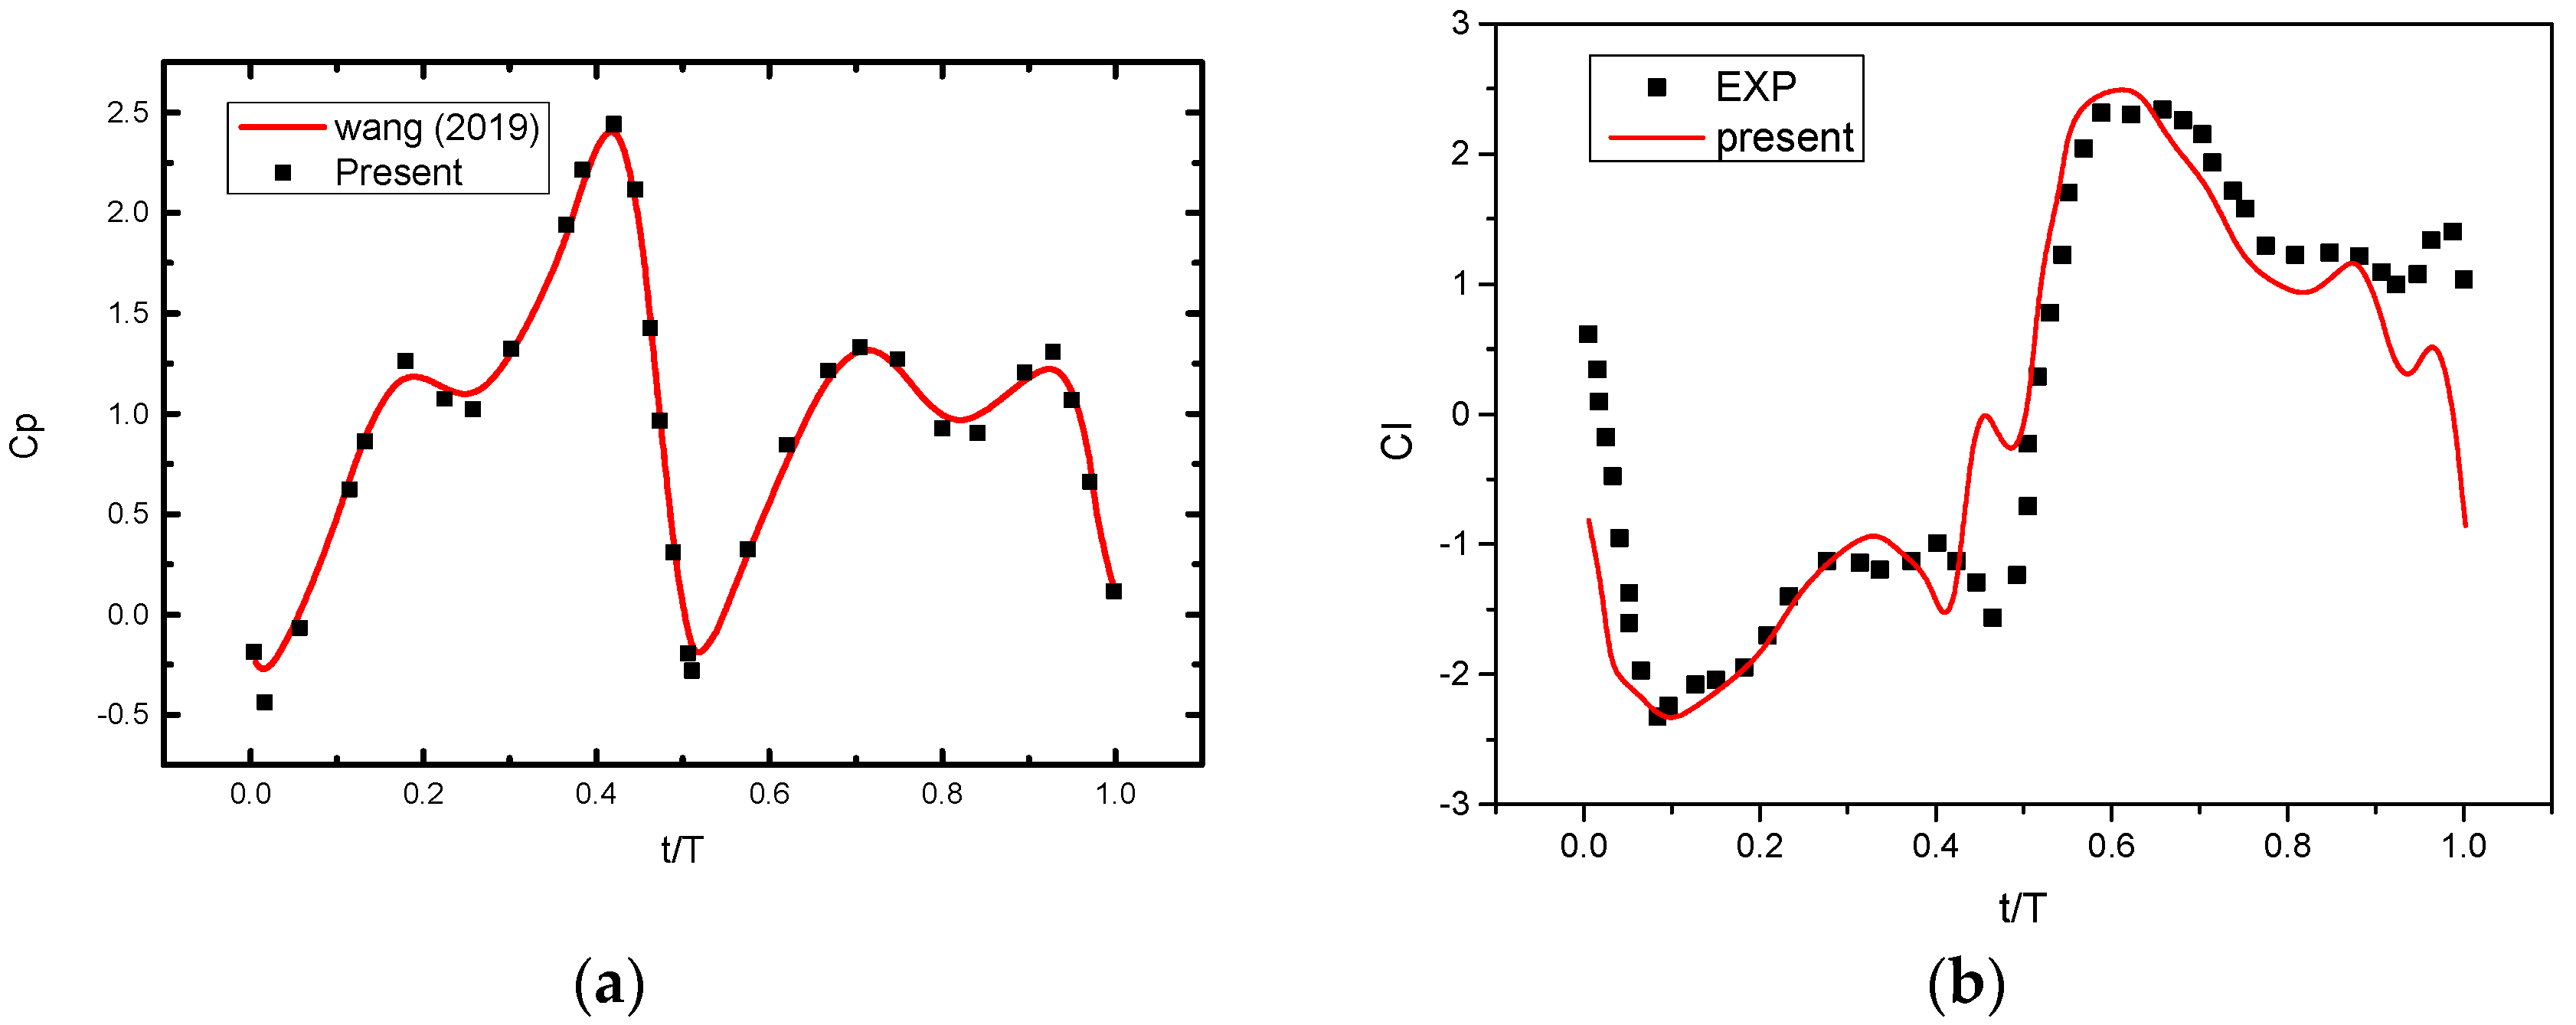
Figure 5 and Figure 6a show an assessment of the total output power coefficient Cp compared to [28,33]. The numerical work by [33] applied an overset dynamic mesh technique while the present work employs a dynamic layering technique. From the figures, the precision of the grid model and the numerical method selected in this study is confirmed.
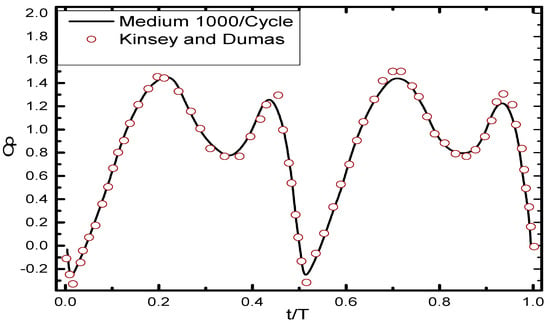
Figure 5.
Comparison of power coefficient Cp(t) with [28].
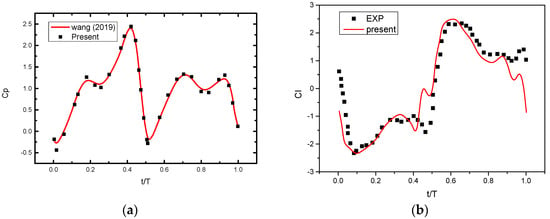
Figure 6.
(a) Comparison of power coefficient Cp(t) with [33] at , , and Re=; (b) Comparison of lift coefficients with the experimental work of [36].
The present work is also validated compared to the experimental work of [36] where the behavior of a flapping hydrofoil is examined. The parameters used in this experimental work are listed in Table 5. It can be detected from Figure 6b that the lift coefficient of the present solver mostly accords with the results from [36].

Table 5.
Parameters used in the experimental work of [36].
3.2. Mechanism of Flow Control Using Expandable Gurney Flap
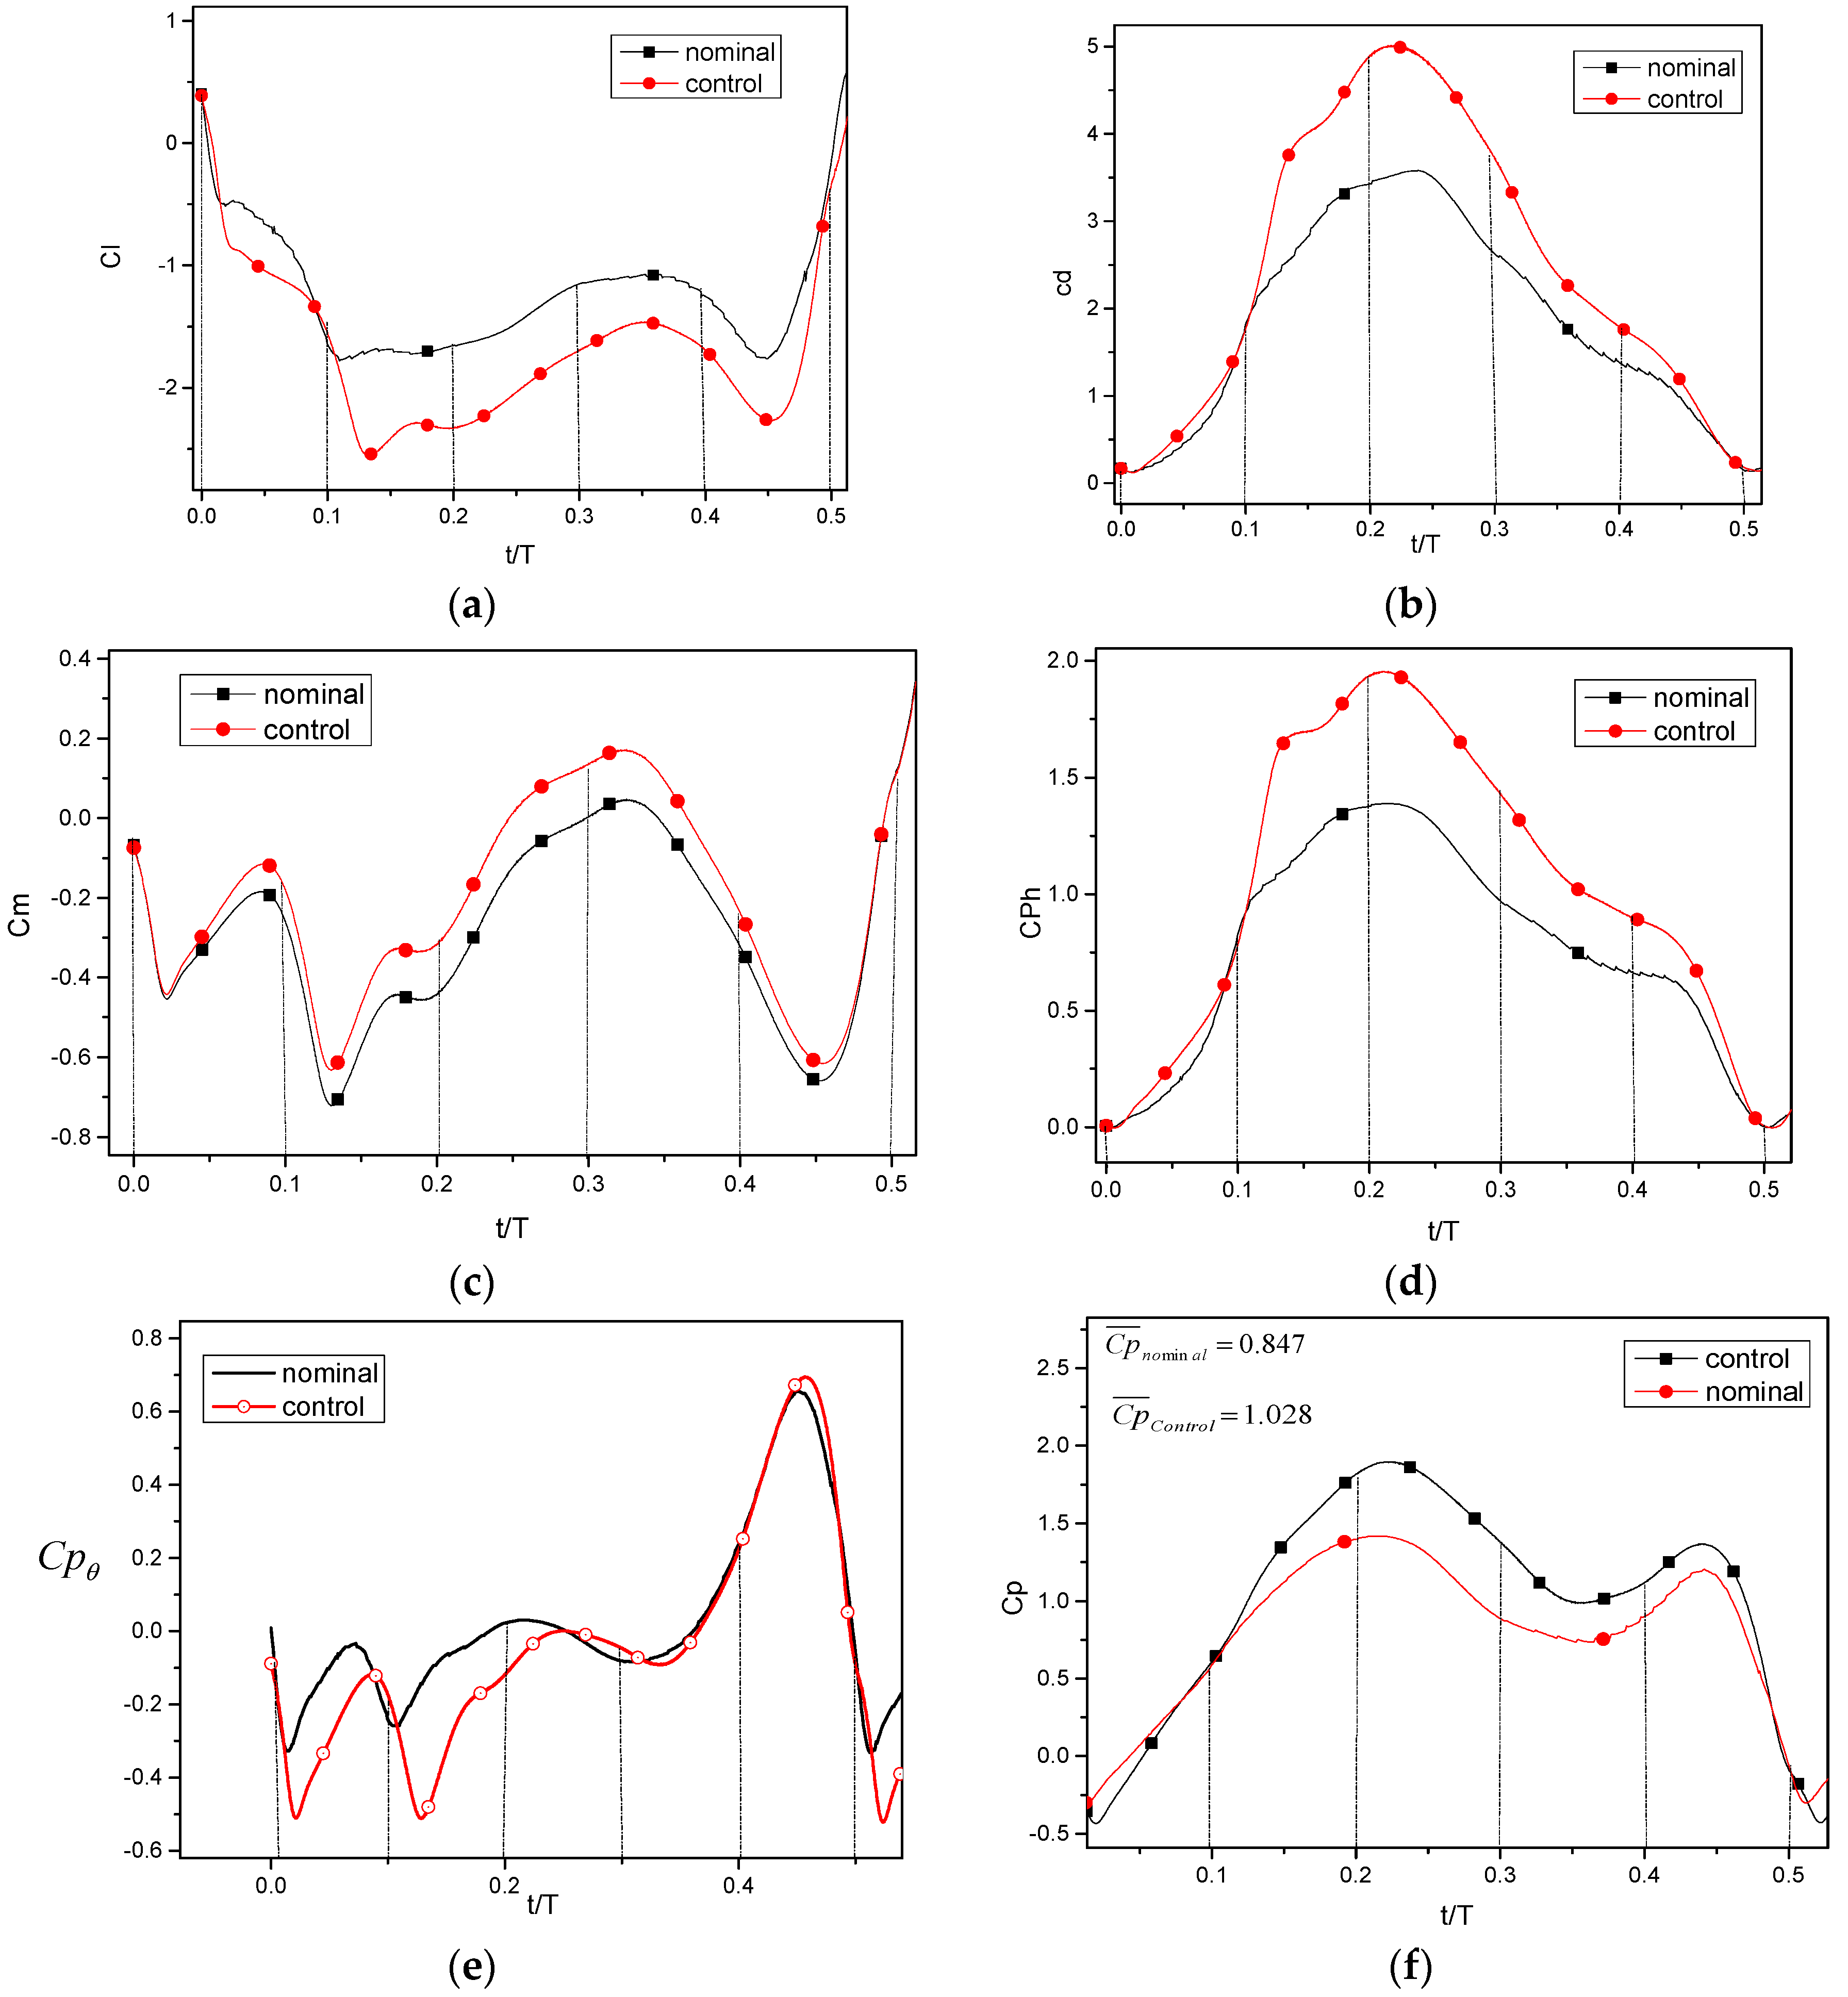
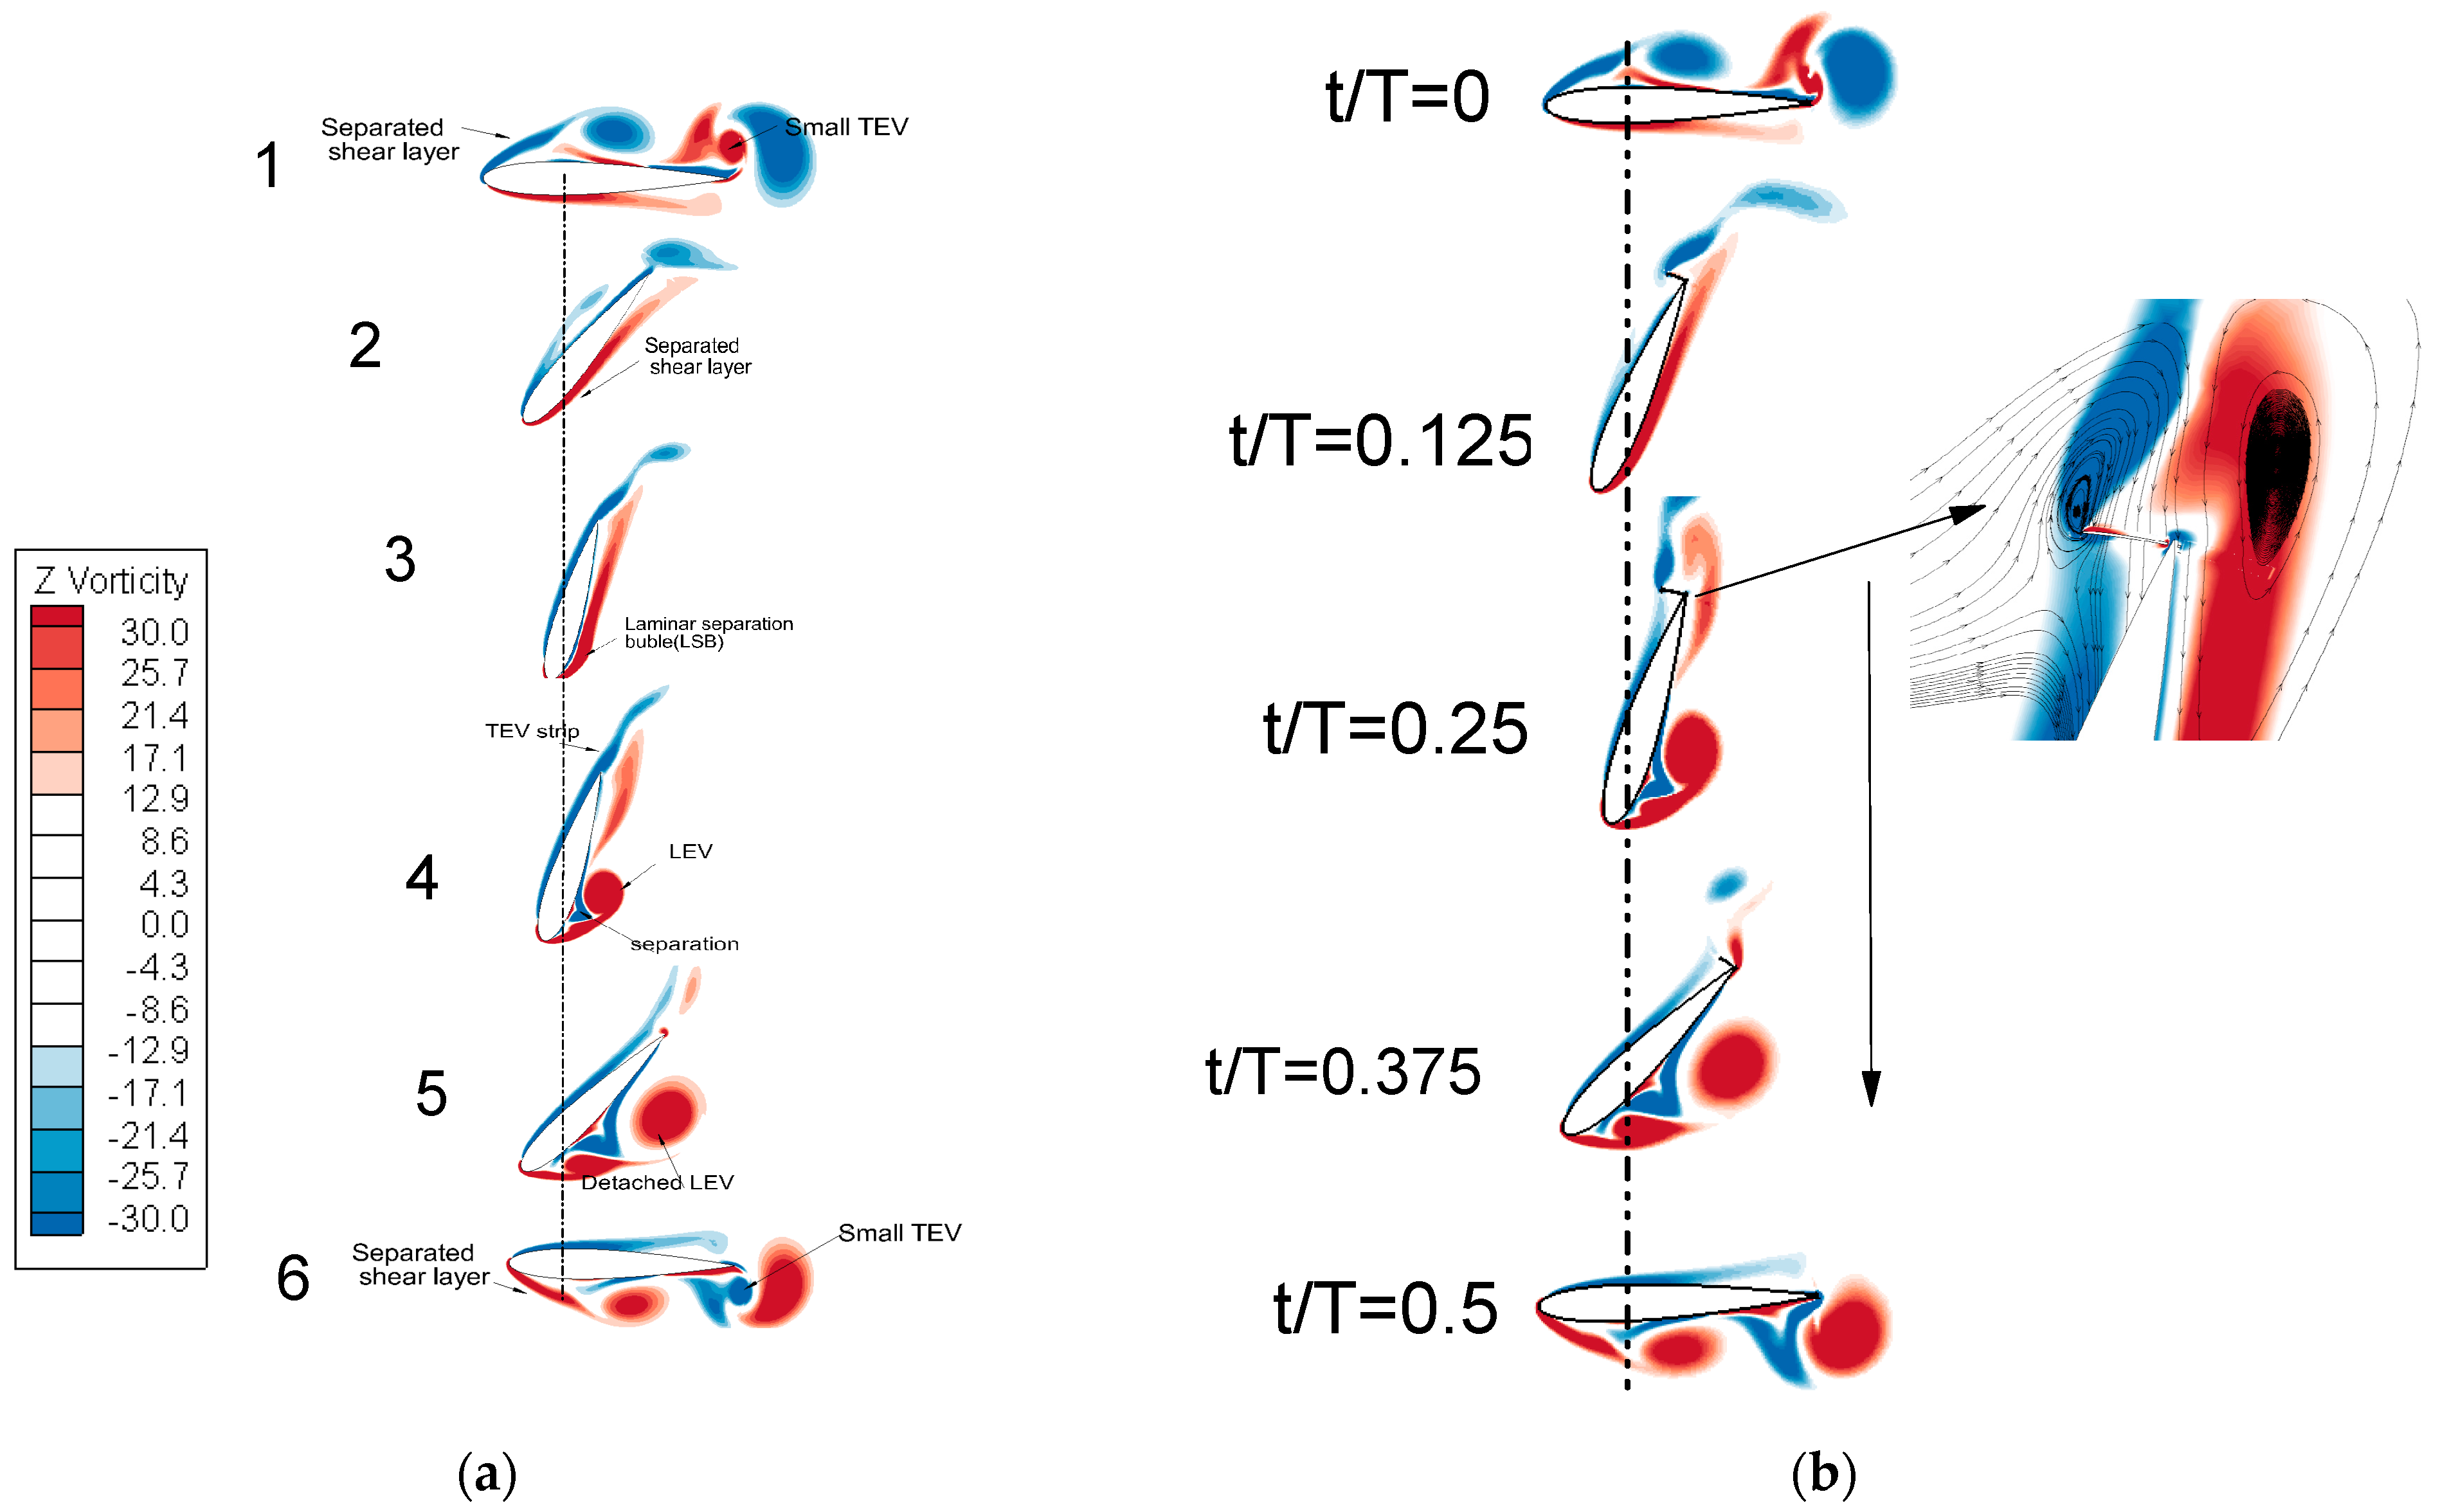
In this segment, the behaviors of clean and DGF flapping turbines are shown in terms of flow structure and time-varying aerodynamic forces to show why the DGF is able to improve the turbine efficiency. The analysis is conducted for = 0.14, = 76.33°, and = 5° and the preliminary analysis is focused only on the downstroke phase because the turbine has the same behavior during the upstroke. To clarify the relation between the vortex formation and the aerodynamic forces, aerodynamics forces and the vorticity contours at different airfoil positions are displayed respectively in Figure 7a–f and Figure 8.
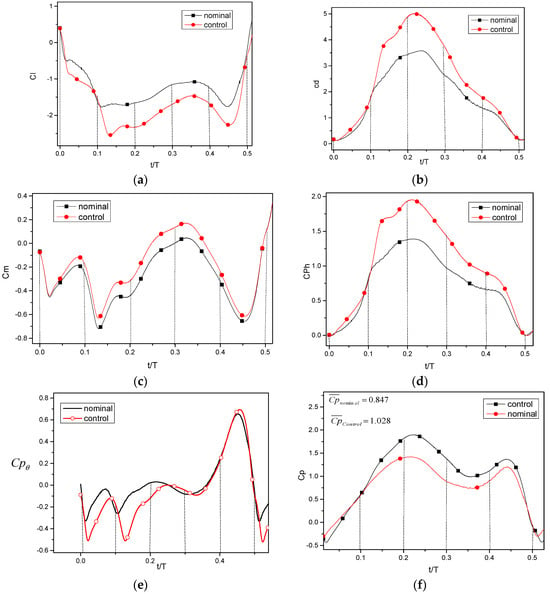
Figure 7.
Instantaneous progress of (a) lift CL, (b) drag CD, (c) torque Cm, (d) vertical power CPh, (e) pitching power CPθ, and (f) total power CP at , , and Re = during the upstroke.
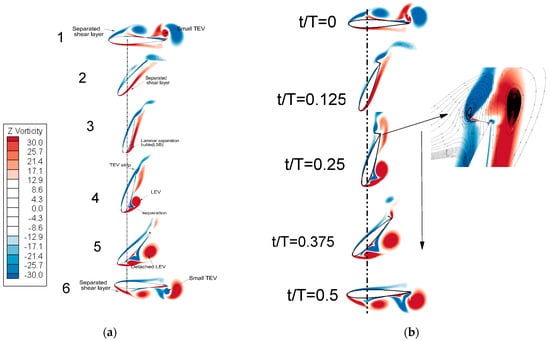
Figure 8.
Z-vorticity contours for (a) nominal (b) with DGF.
At the beginning of the downstroke, all forces and power coefficients reached their minimum value as shown in Figure 7a–f. This is because the airfoil exhibits a zero effective attack angle, as illustrated in Figure 8a. A separated shear layer appears at the leading edge at this point.
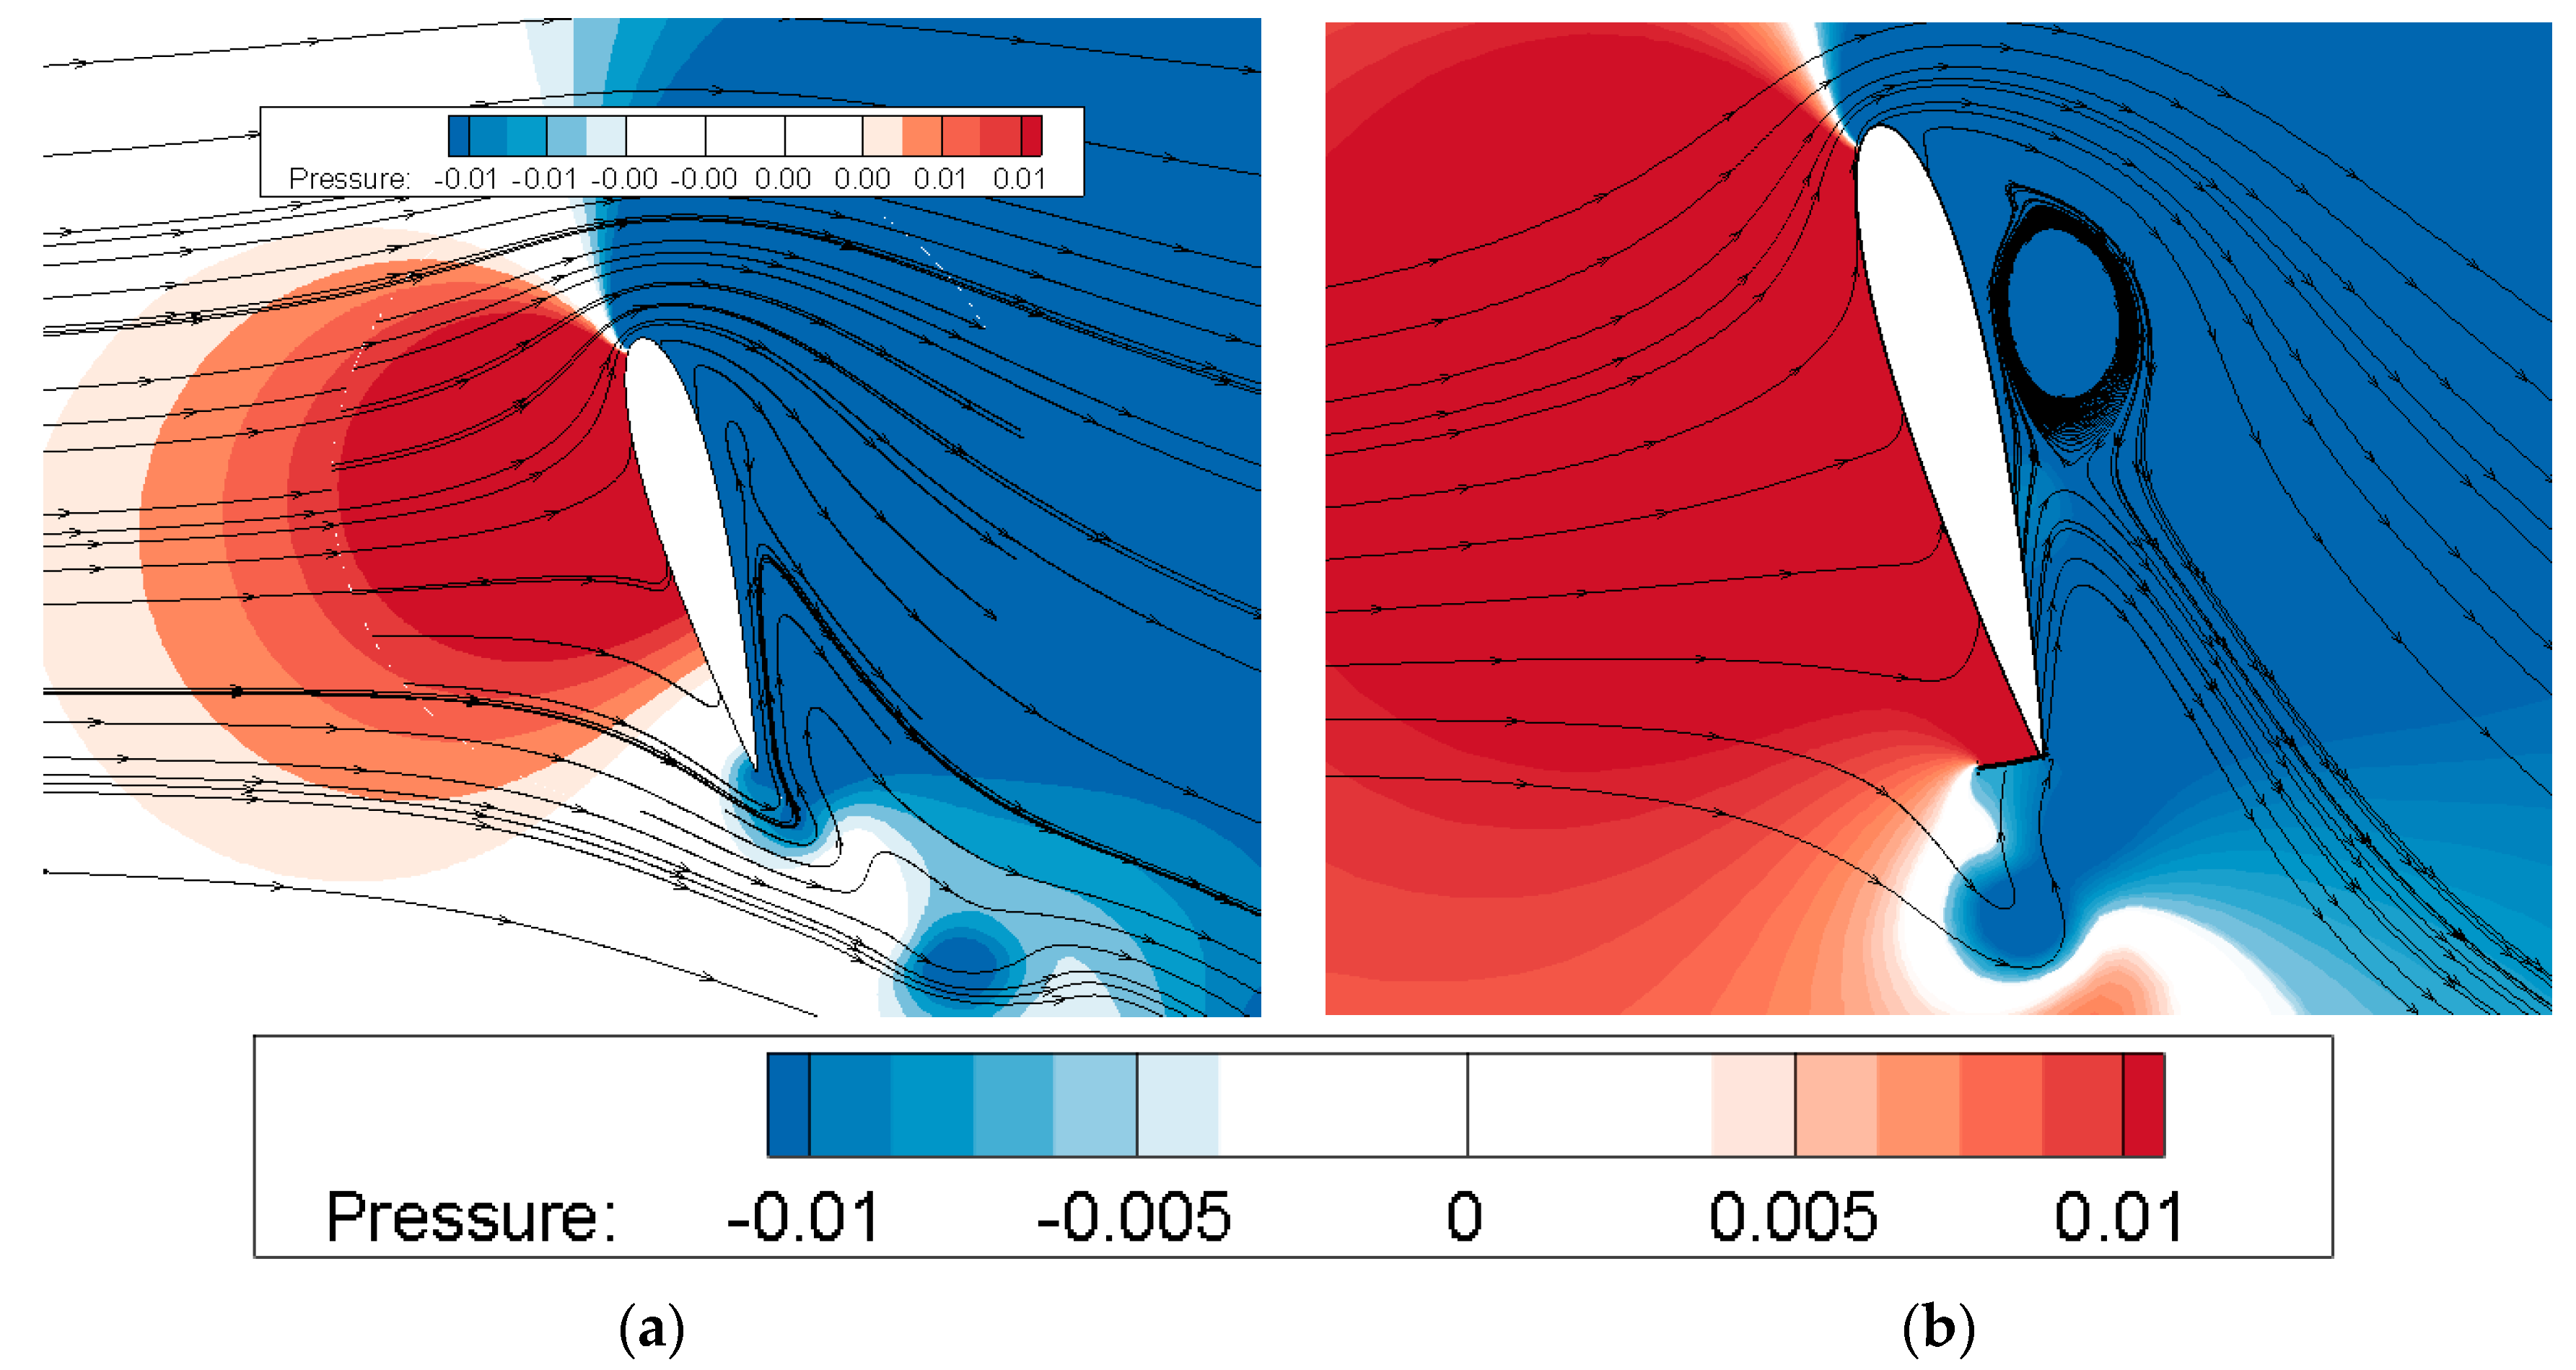
This phenomenon occurs as the effective angle shifts from positive to zero during the end of the upstroke. With the increase in the effective attack angle, an adverse pressure gradient is generated which gives rise to a separated shear layer for both clean and DGF cases as shown in Figure 8. The flow separation near the leading edge is followed by a reattachment along the remaining airfoil surface. This behavior forms the laminar separation bubble (LSB). Figure 7b shows that, for t/T < 0.2, the growth of the LSB sharply increases drag force for the two investigated flapping modes. From Figure 8 and Figure 9, it can be seen that the expansion of the DGF during the downstroke generates a turning vortex downstream of the airfoil, which increases the airfoil operative camber and total circulation. For the case with the DGF, a detached Karman vortex is found behind the airfoil, which reduces the adverse pressure gradient near the trailing edge and increases the velocity on the suction surface. This mechanism of control has an effect in two ways: it makes the LEV expand along the suction surface, delaying the flow separation, and supports the TEV strength and size which amplifies the pressure difference between the suction surface and the pressure surface, ultimately giving rise to a lift improvement. The peak of records a clear increase. Inappropriately, the DGF generates an unhelpful peak of drag force at around t/T = 0.25 as shown in Figure 7 due to the increment in lift-induced drag. A similar trend is recorded in the upstroke—not displayed here—where the expansion of the DGF gives rise to a turning vortex downstream of the airfoil, which increases the airfoil virtual camber and circulation. The detached Karman vortex appears behind the airfoil and reduces the adverse pressure gradient near the trailing edge. The average output power increases from 0.86 to 1.028, which represents an improvement by about 19.5%. The continued drop in the effective attack angle near the end of the downstroke drives the separated shear layer far from the foil’s surface as shown in Figure 8 and all forces reach their lowest value again.
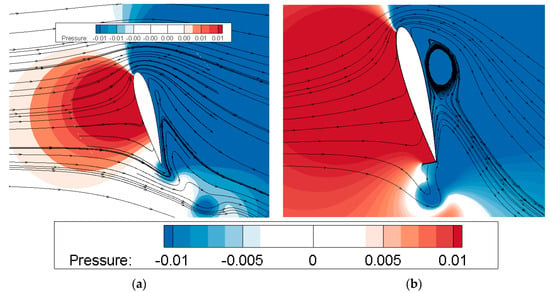
Figure 9.
Pressure contours of (a) nominal (b) with DGF at: t/T = 0.75.
3.3. Effect of Expansion Angle
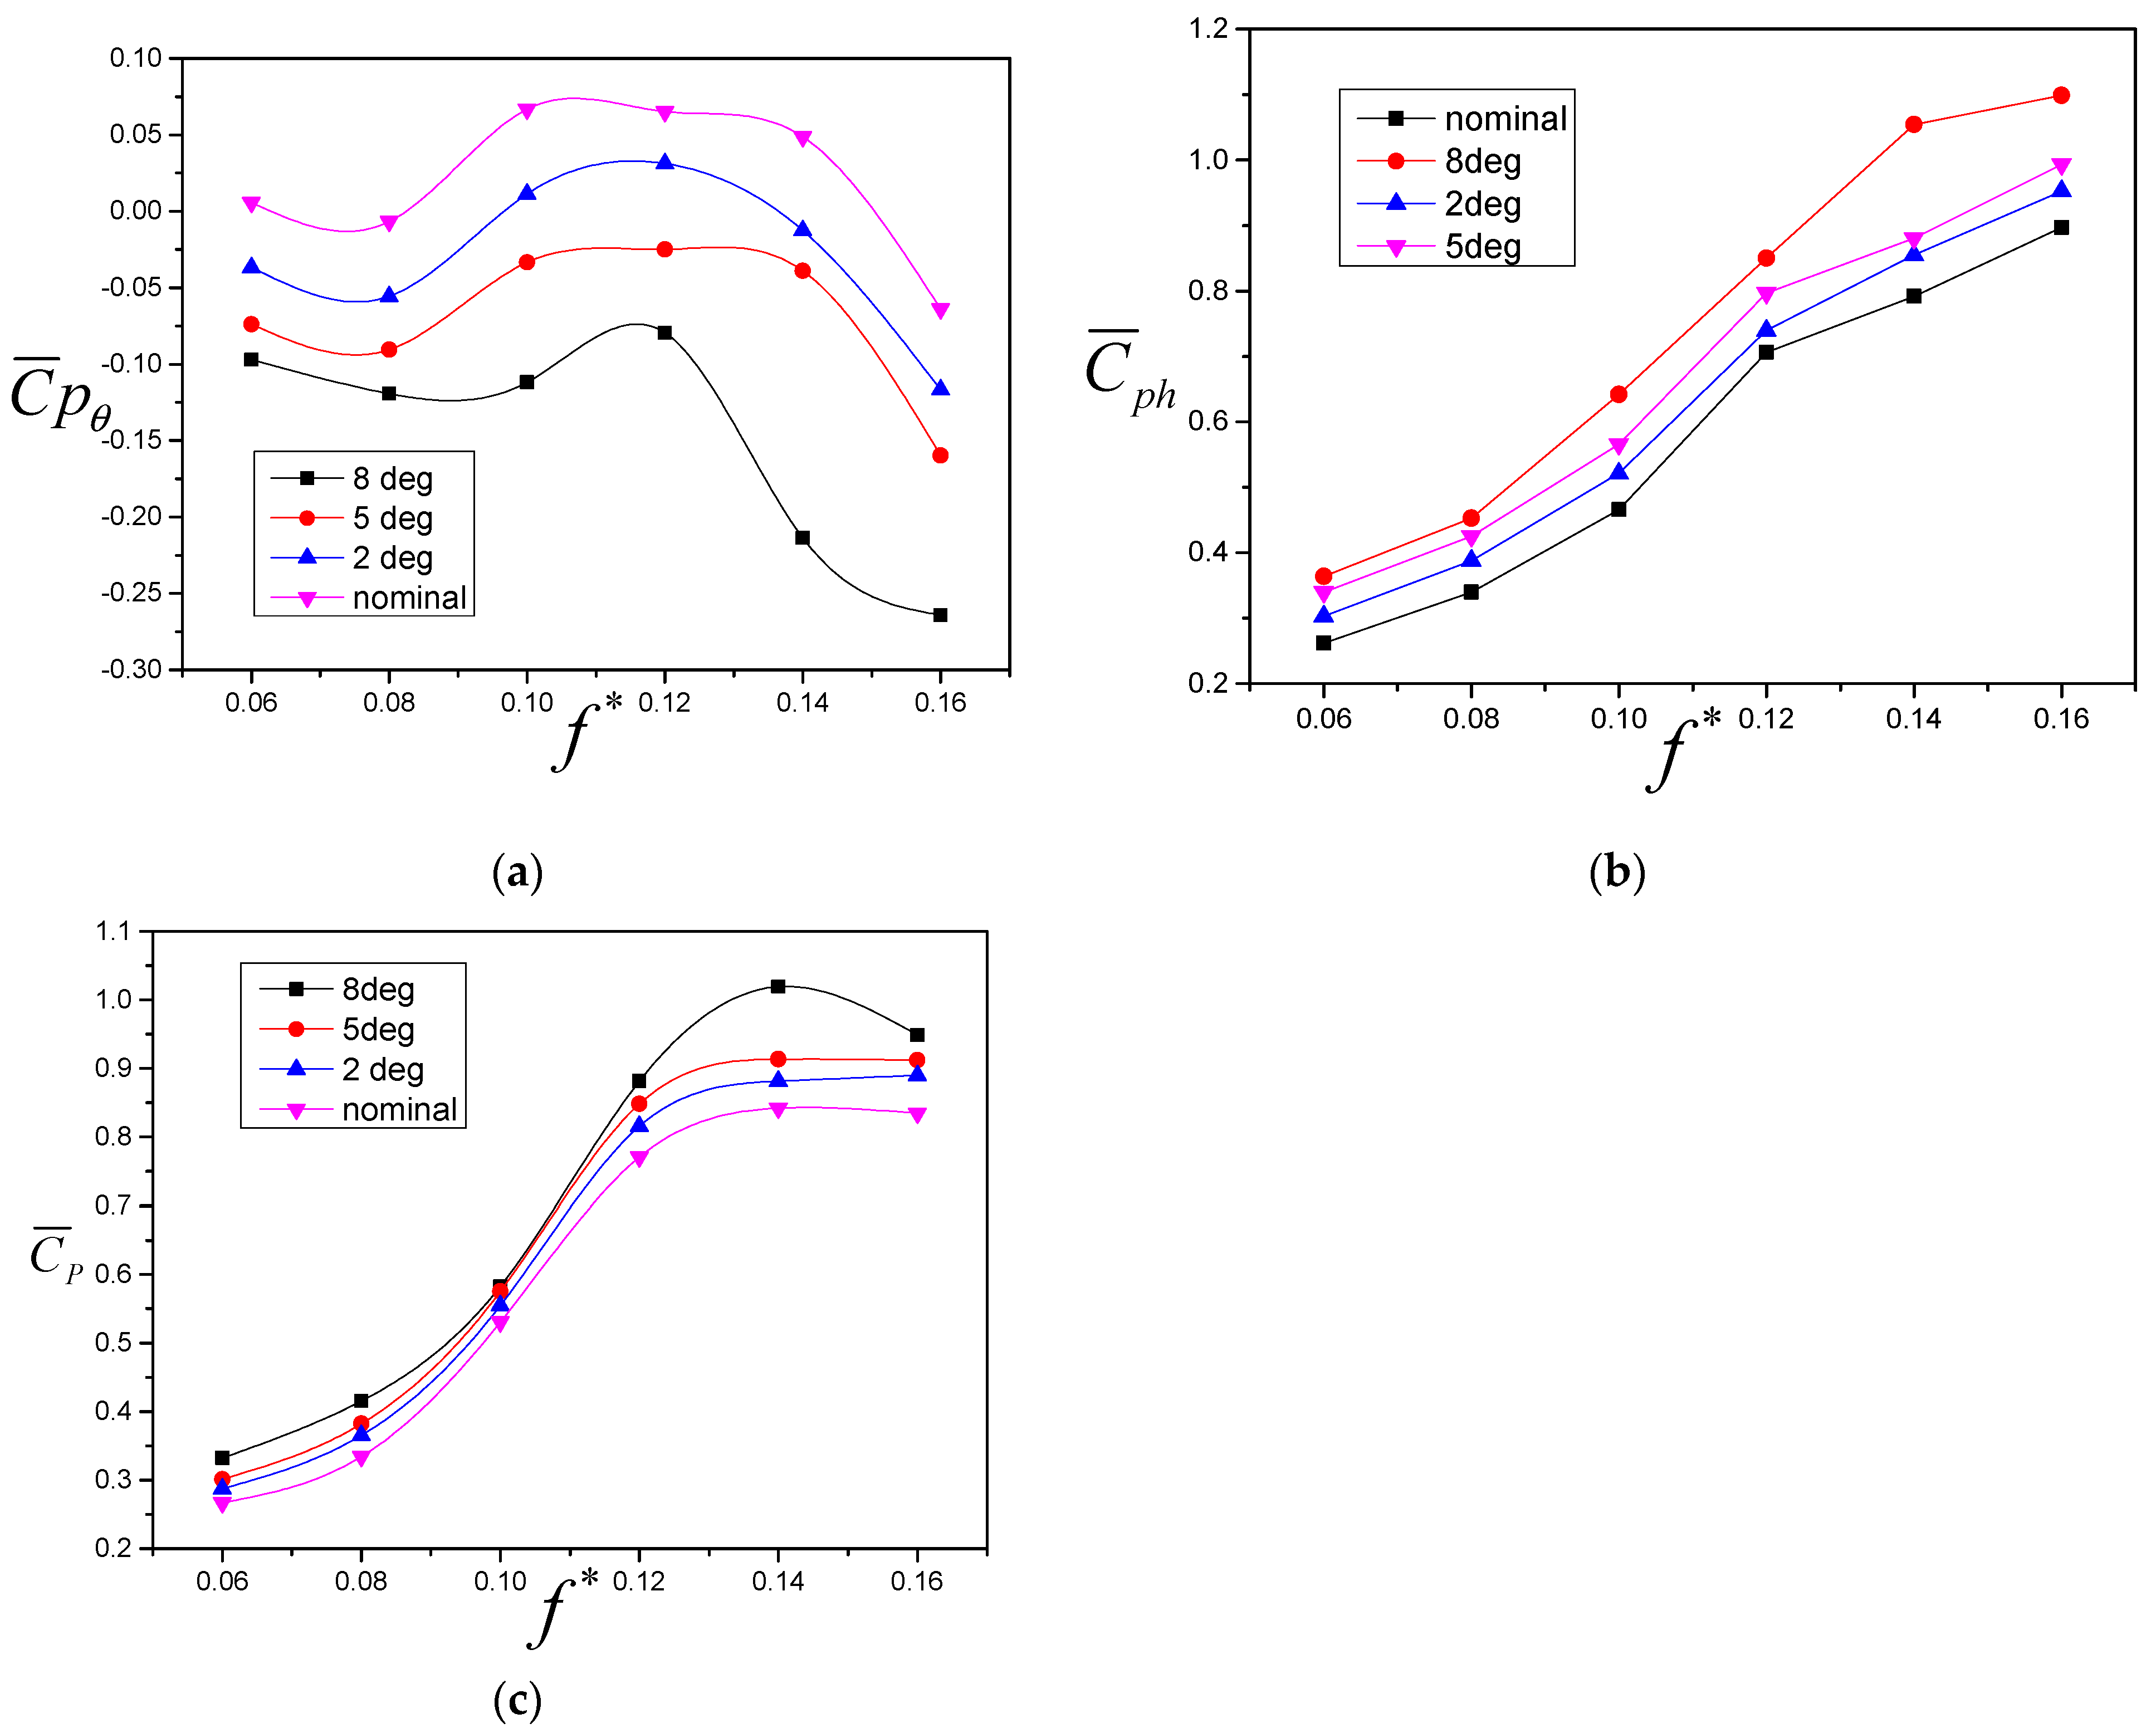
The examinations of the expansion angle’s effect are carried out for different values of at = 76.33° and Re = 1100. Figure 10 shows the effect of expansion angle on the average blade power coefficients , , and . As seen from this figure, increases by increasing the reduce frequency and a quasi-regular difference is observed for various cases studied here. This is attributed to the size of the trailing-edge vortex that gradually increases by increasing the expansion angle. A decreasing trend in is shown for > 0.12. It was noticed that the effect of control becomes more pronounced for > 0.12. For < 0.12, the effect of the DGF is weakened due to the absence of an interaction between LEV and the trailing edge. The use of DGFs is appropriate for a relatively high reduction in frequency at which the turbine remains as the largest power coefficient. The above observations indicate that the expansion angle effect plays a significant role in the turbine performance at a high reduction in frequency where the leading-edge vortex separation and its interaction with the blade trailing edge play a leading role. Increasing this angle generates a pressure difference, which, in turn, substantially increases lift force and improves the turbine efficiency.
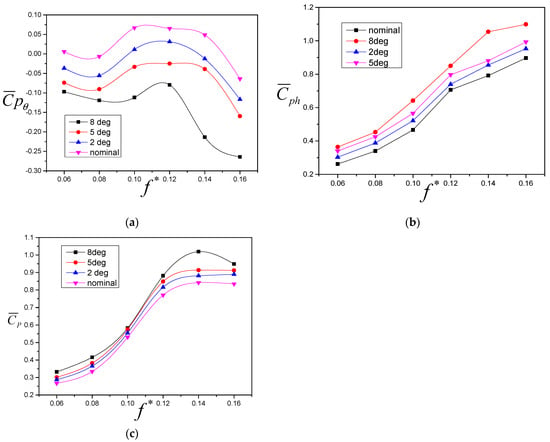
Figure 10.
Effect of expansion angle on the average (a) pitching power (b) vertical power (c) total power against .
3.4. Application of DGF Concept on Flapping Turbine in Reversed D and Arm Modes
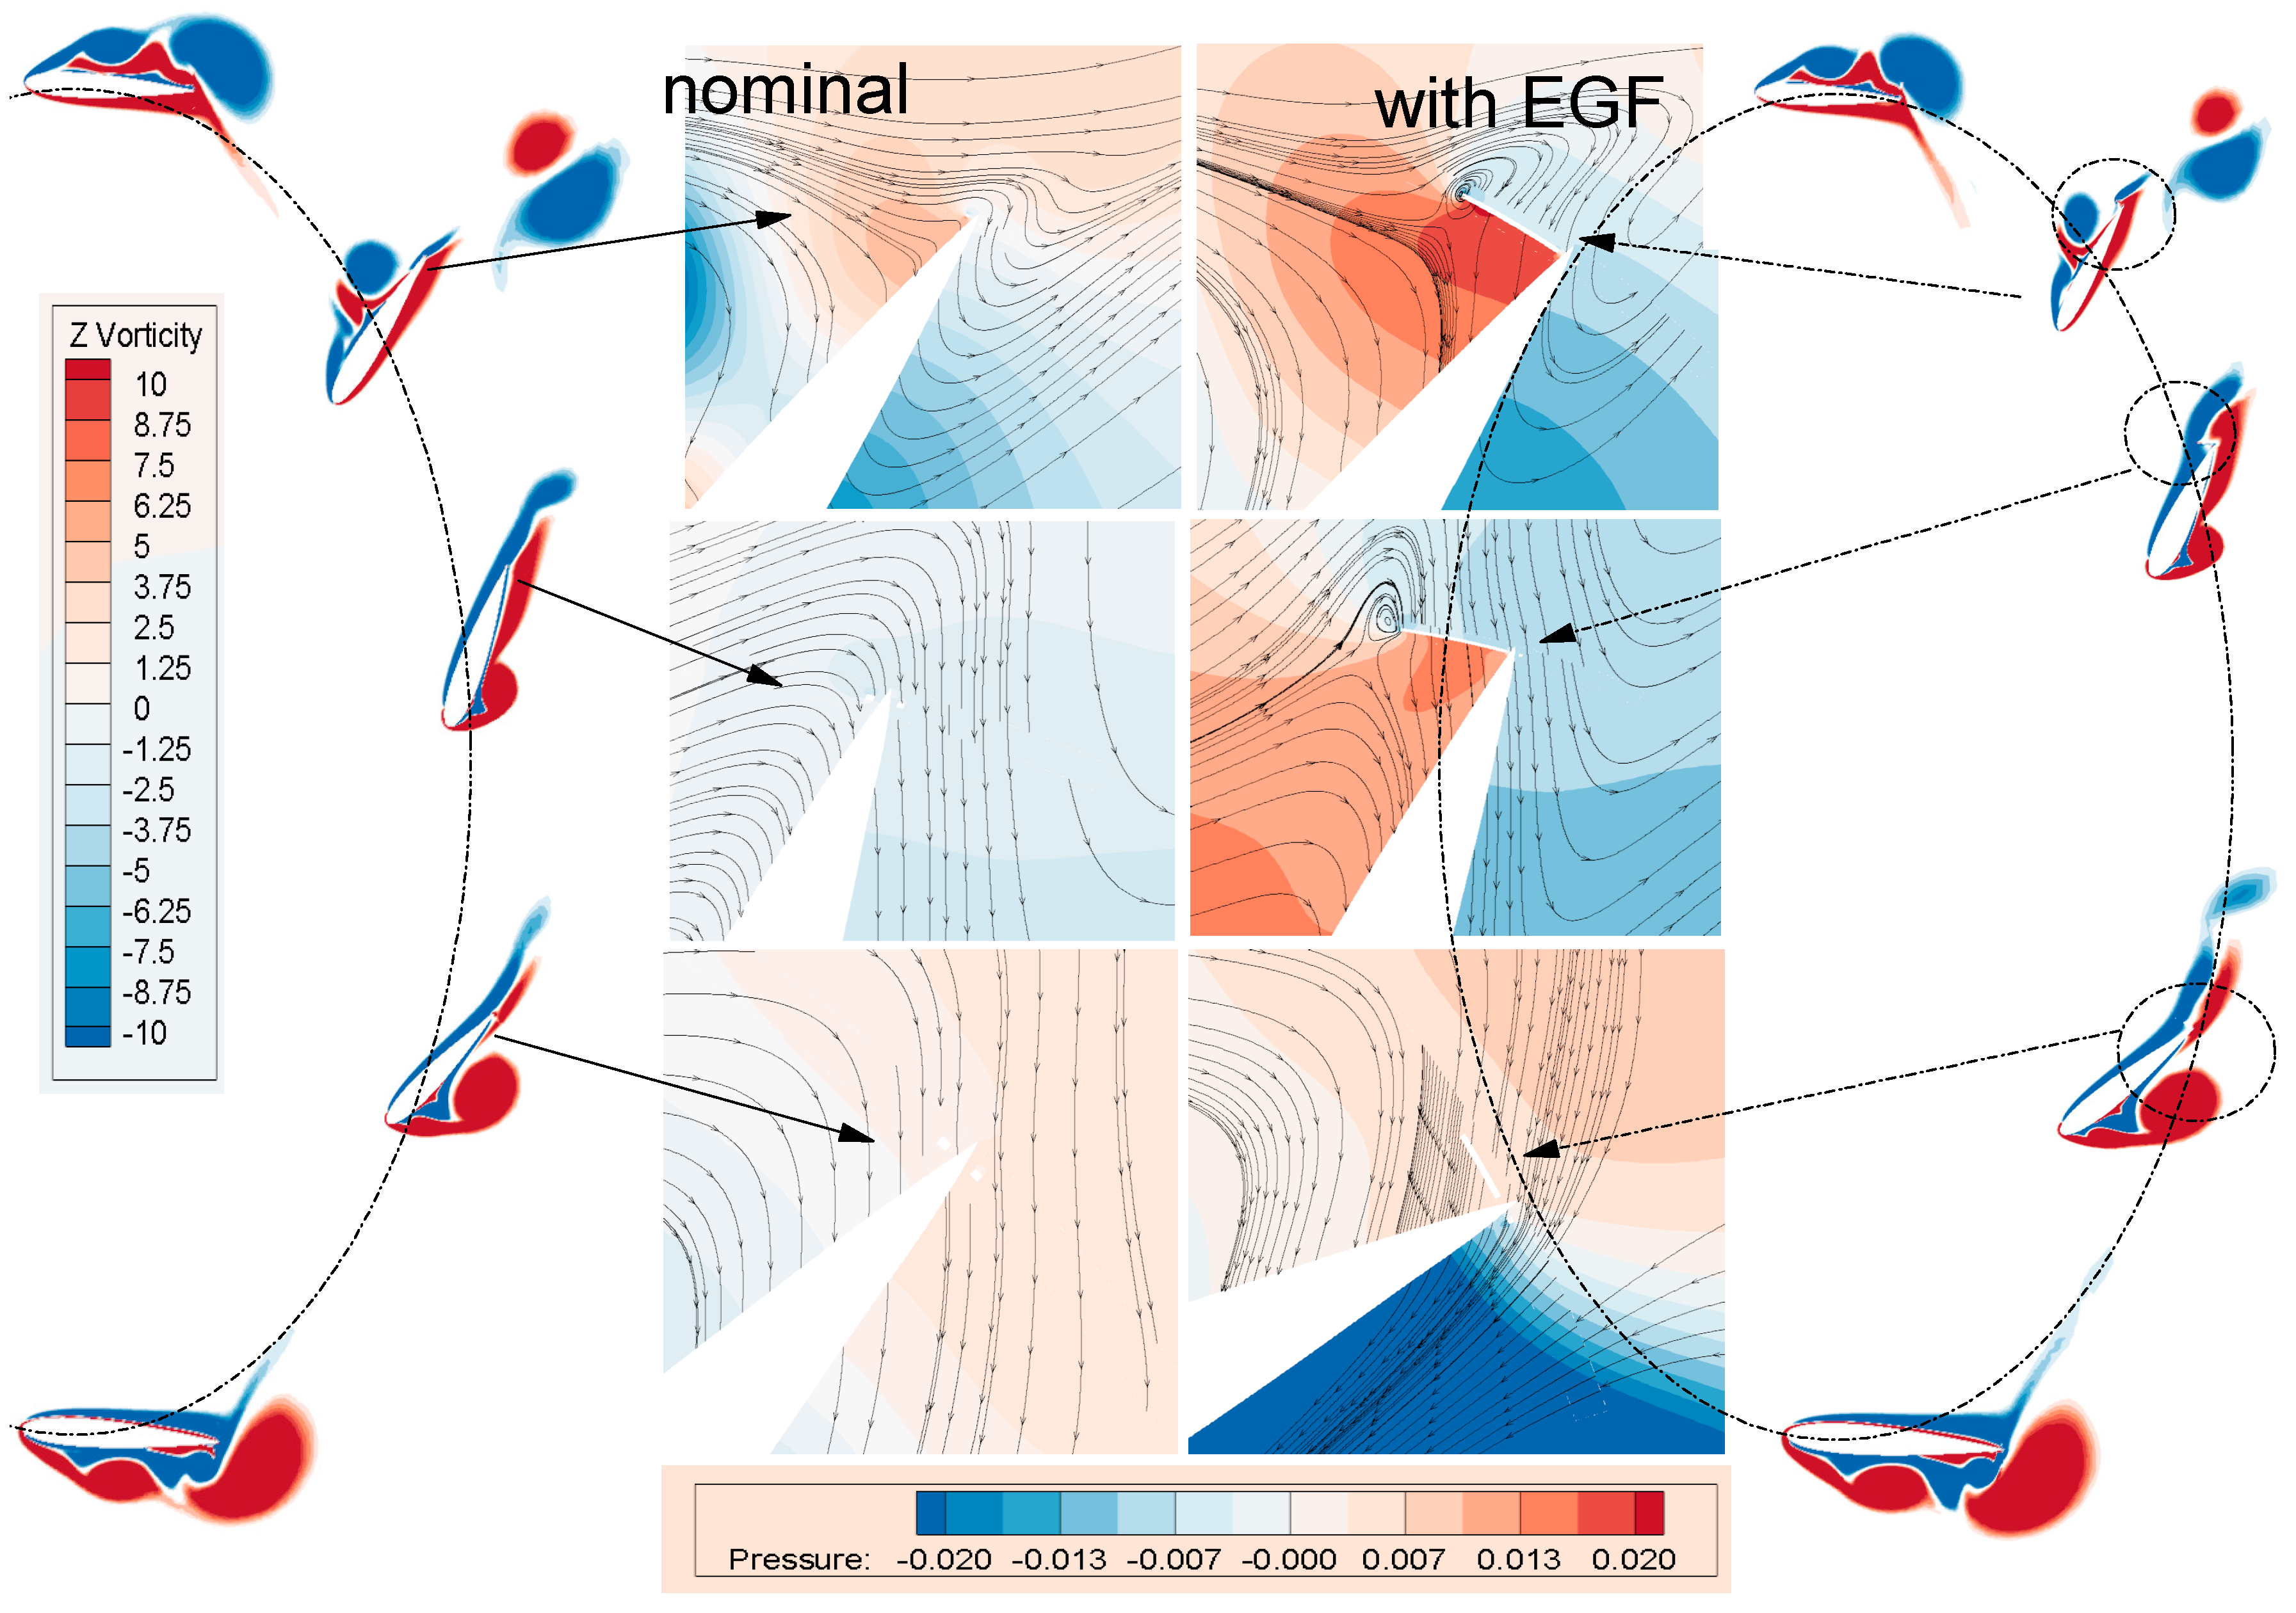
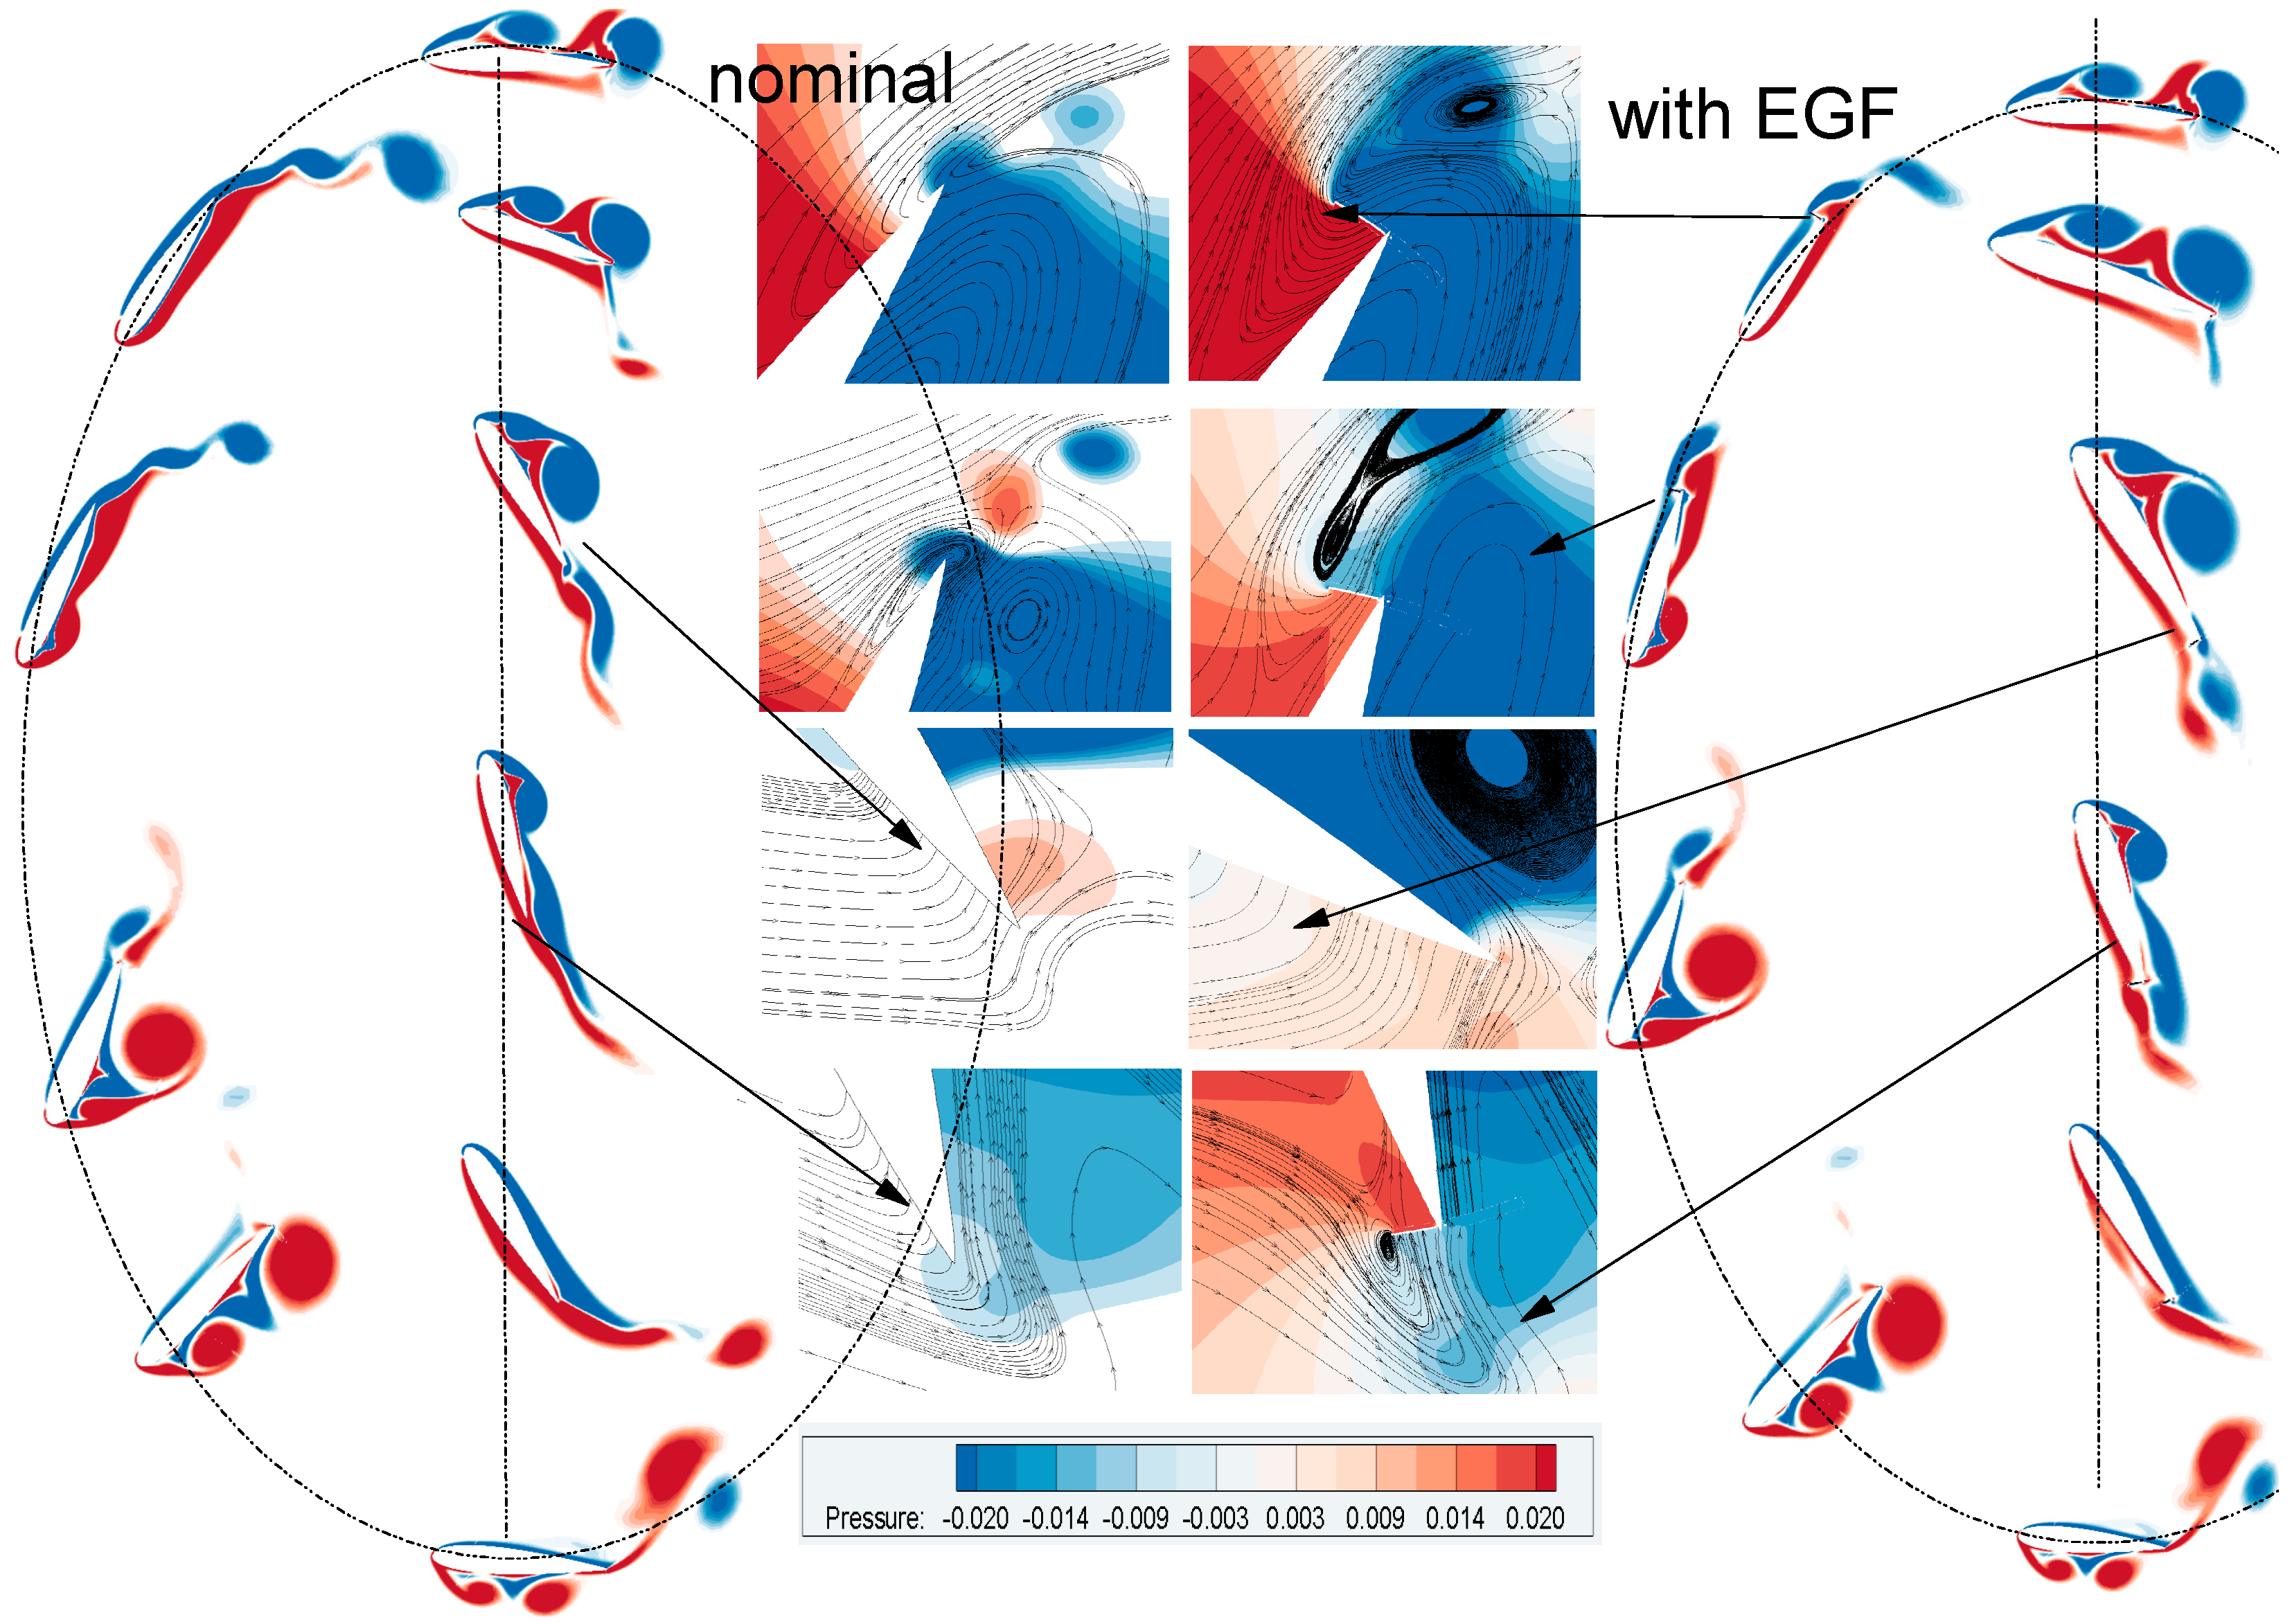
In this section, the concept of the DGF is applied on flapping turbines in hybrid modes such as swing arm mode [21] and D-shaped mode [33]. These modes are investigated to clarify the advantage of this model and to demonstrate the possibility of applying this strategy of control for different flapping movements. In fact, the DGF is expandable and contractible which allows for monitoring and adjusting the pressure distribution at the appropriate time and position. In swing arm mode, an arm controls the heave motion, in which the airfoil performs a semicircle trajectory of both the upstroke and downstroke. as shown in Figure 11. In reversed D-shaped mode, the airfoil follows a curve resembling an inverted D (Figure 12). So, it is a composite of an elliptical trajectory in the first half of the motion cycle and a standard vertical trajectory in the second half. Table 6 lists the parameters used in the simulation of hybrid modes.
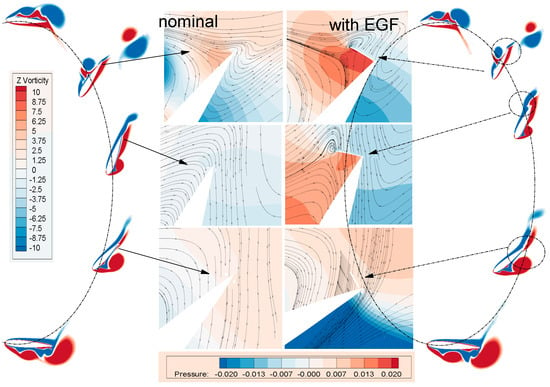
Figure 11.
Airfoil vorticity and pressure contours in arm mode (downstroke).
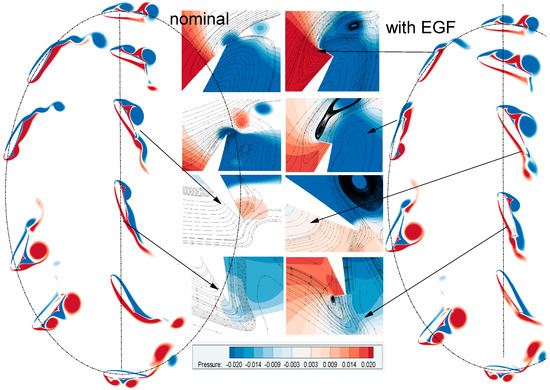
Figure 12.
Airfoil vorticity and pressure contours in reversed D mode.

Table 6.
Parameters used in the simulation of hybrid modes.
From Figure 11 and Figure 12, it can be seen that the expansion of the DGF during the downstroke generates a turning vortex downstream of the airfoil, which increases the airfoil operative camber and total circulation. For the case with the DGF, the presence of the DGF reduces the adverse pressure gradient near the trailing edge and increases the velocity on the suction surface. This mechanism of control has an effect in two ways: it makes the LEV expand along the suction surface, delaying the flow separation, and supports the TEV strength and size which amplifies the pressure difference between the suction surface and the pressure surface, ultimately giving rise to a lift improvement.
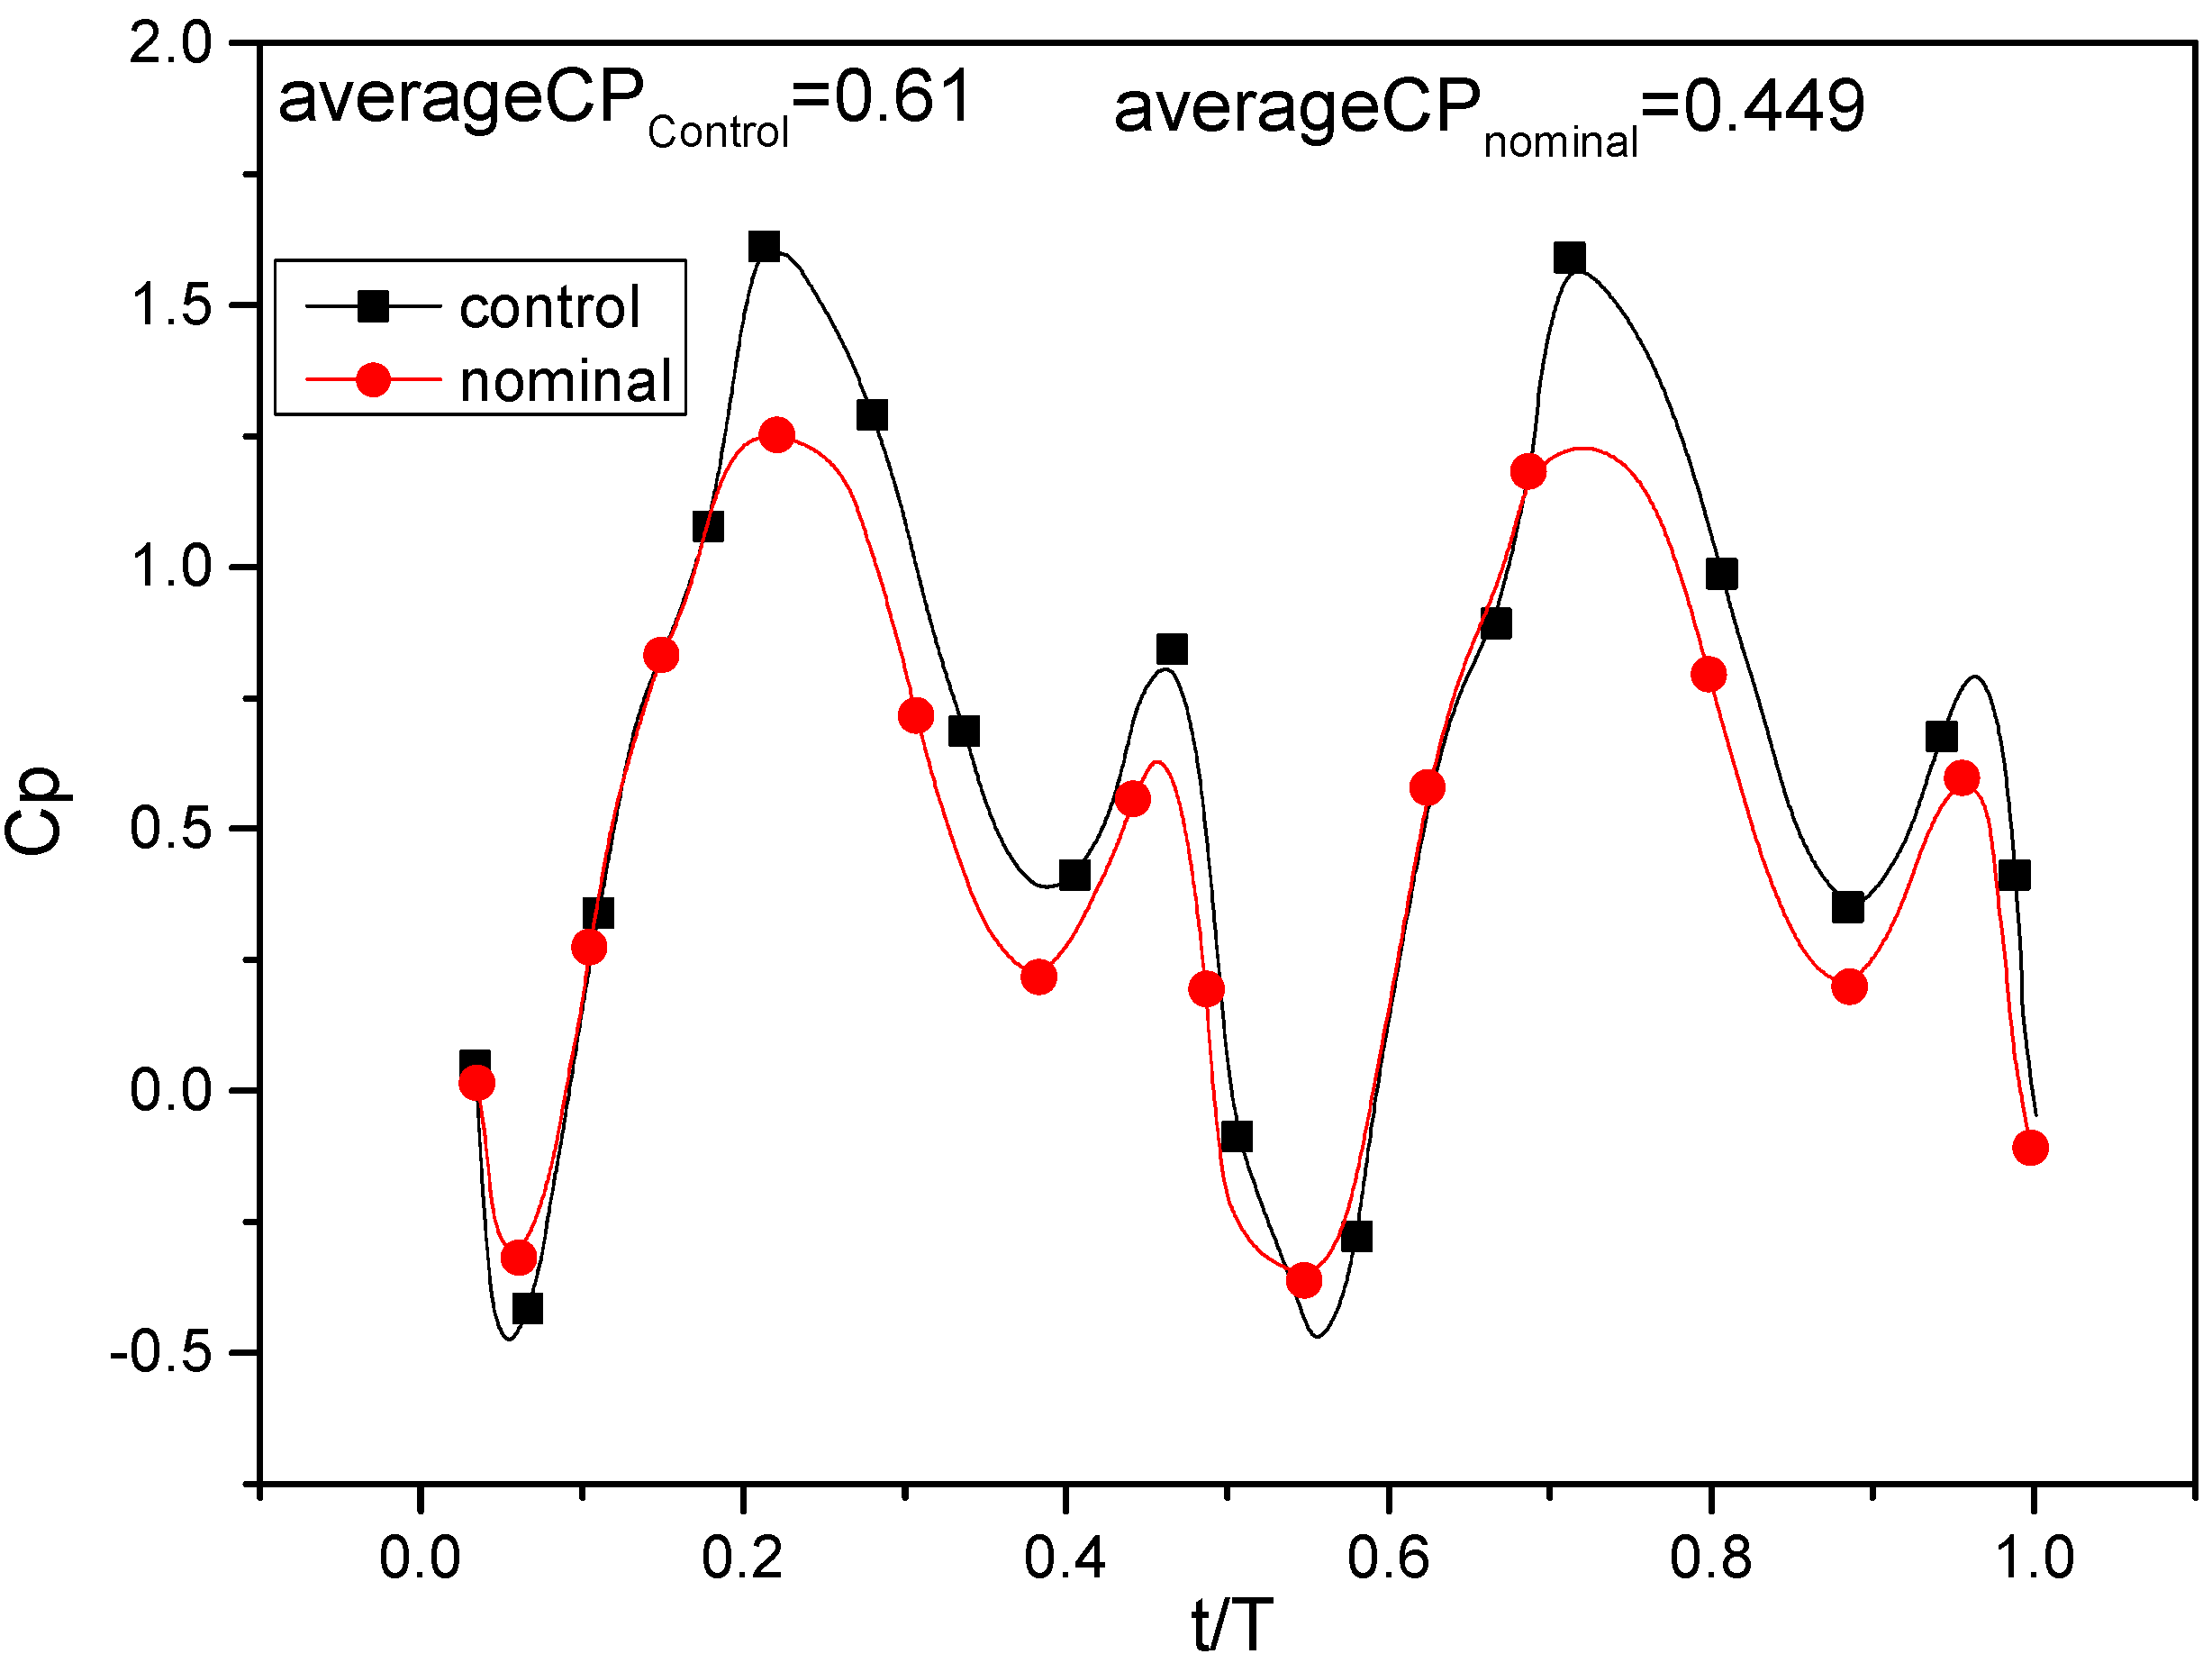
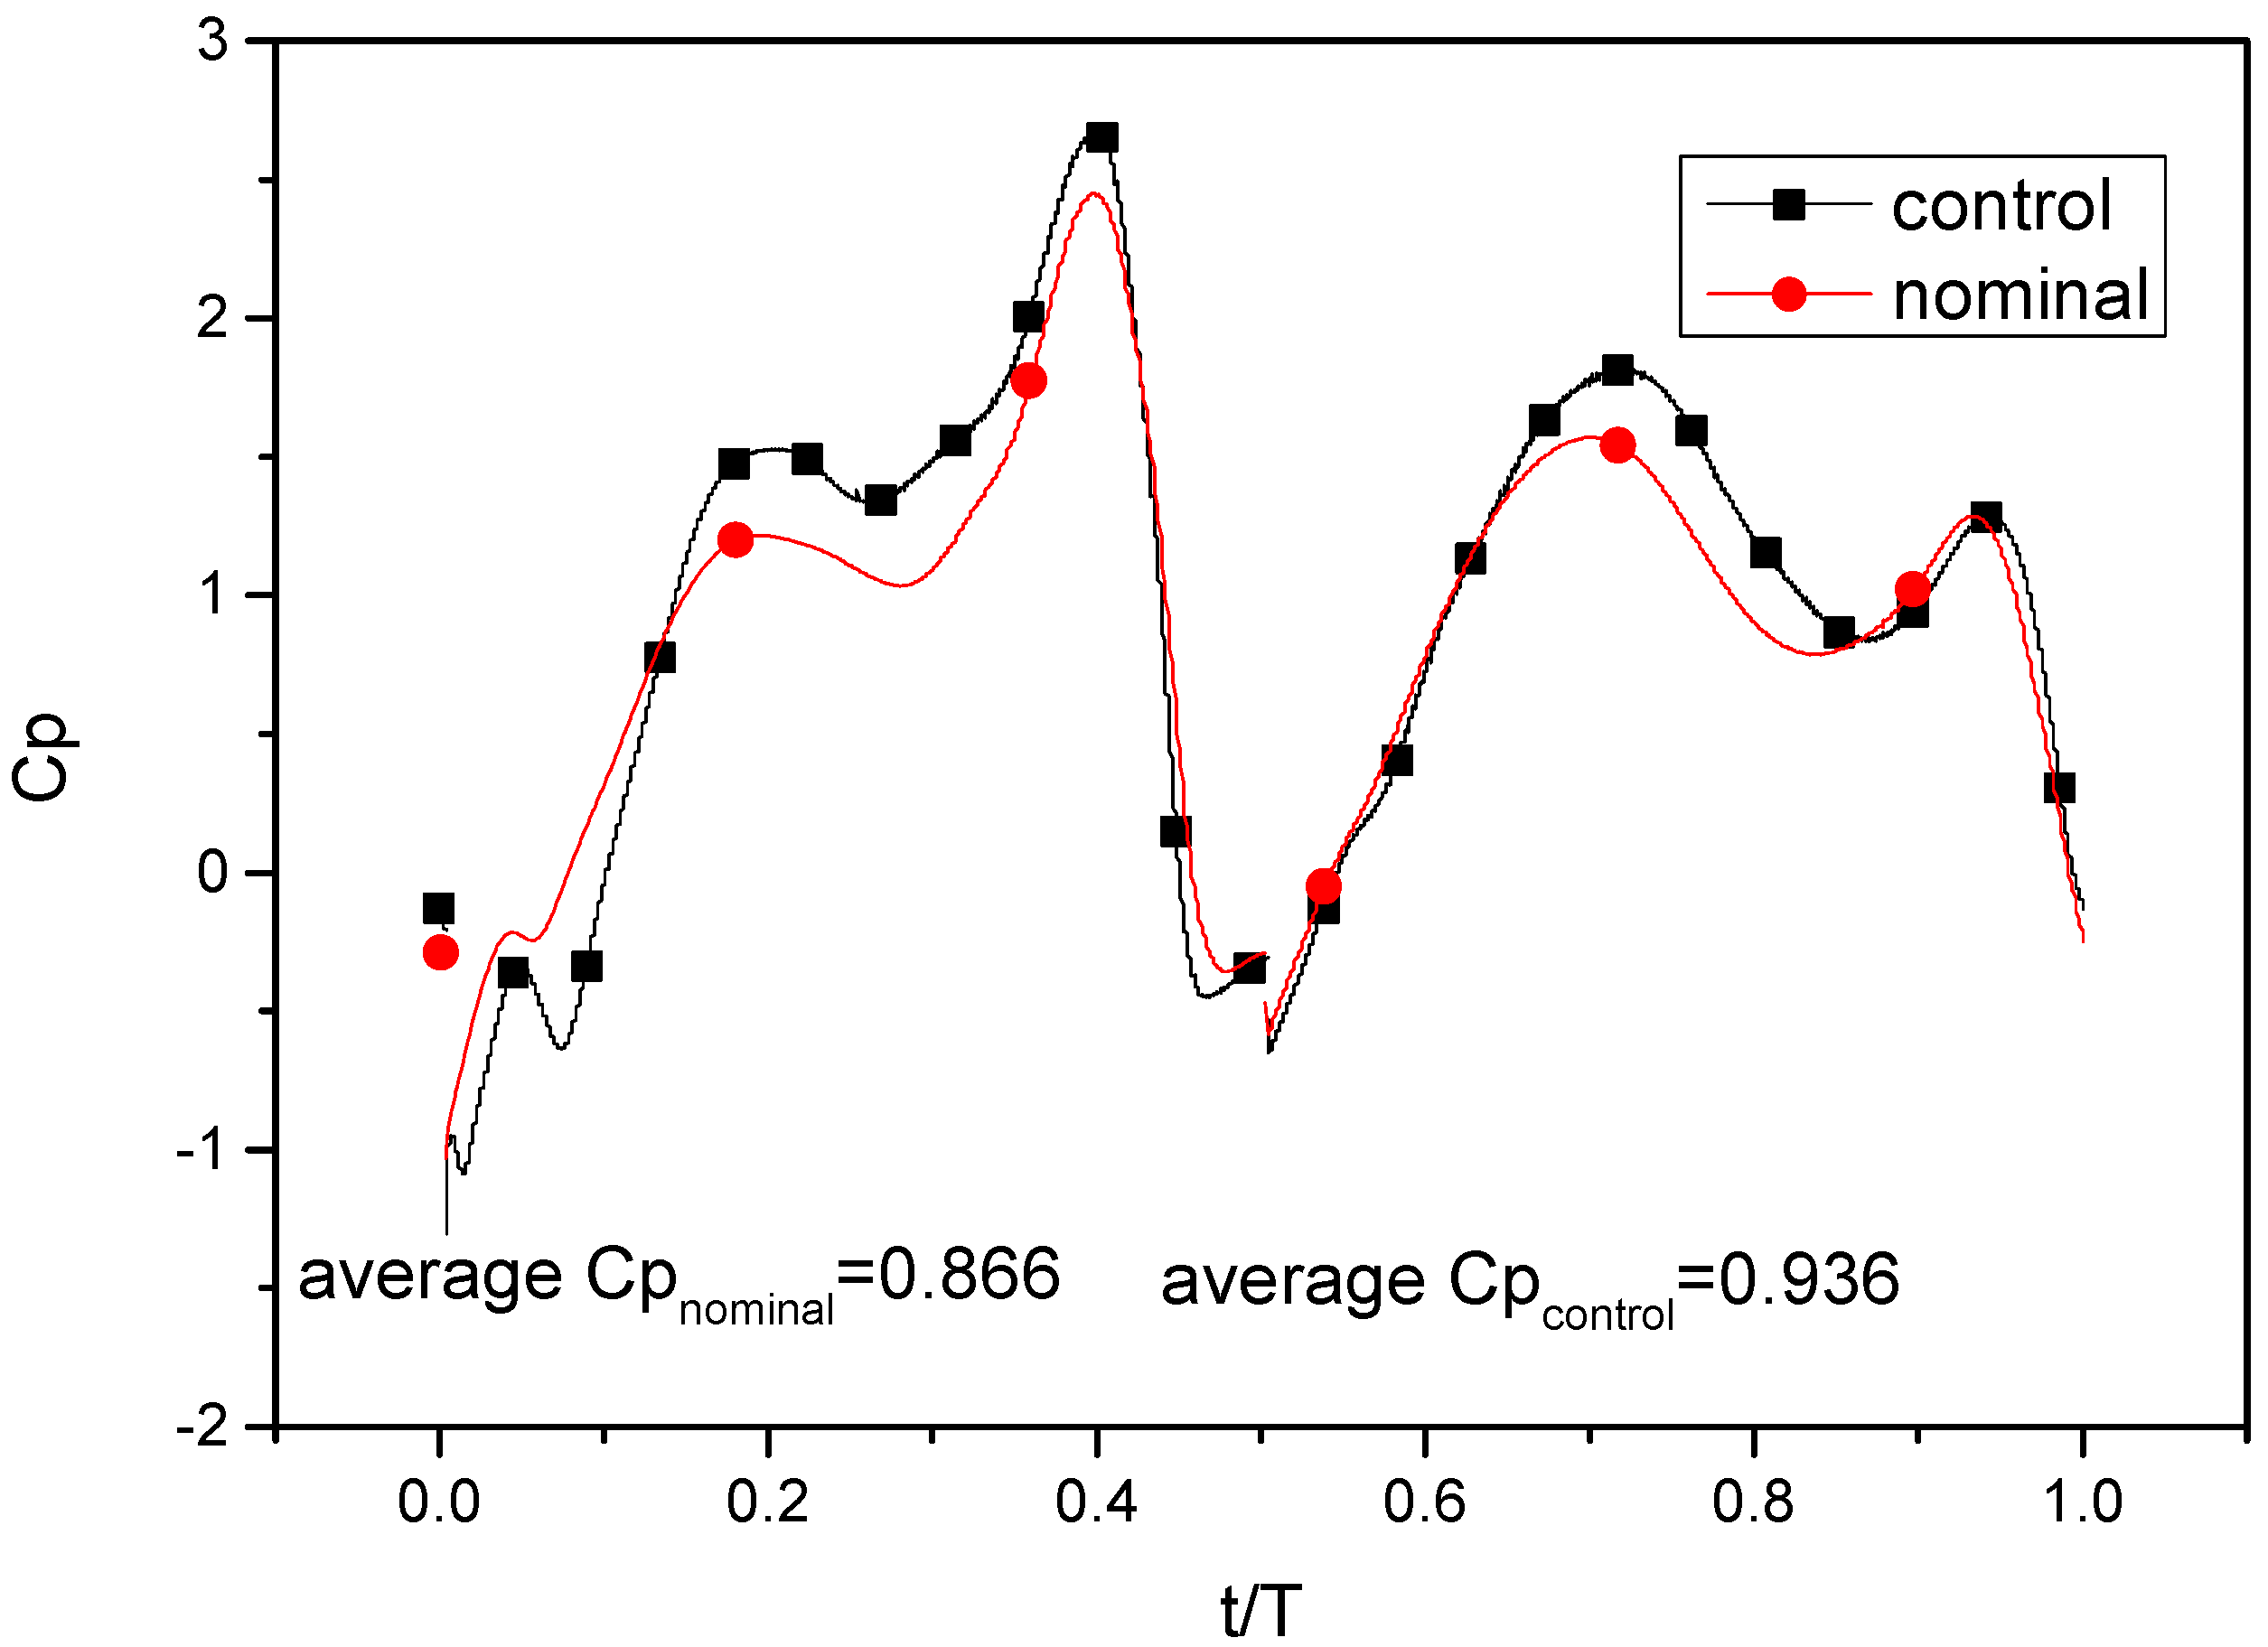
Figure 13 and Figure 14 indicate that the peak of Cp(t) records a clear increase. The DGF cases generate helpful peaks of output power at around t/T = 0.25 and t/T = 0.75.
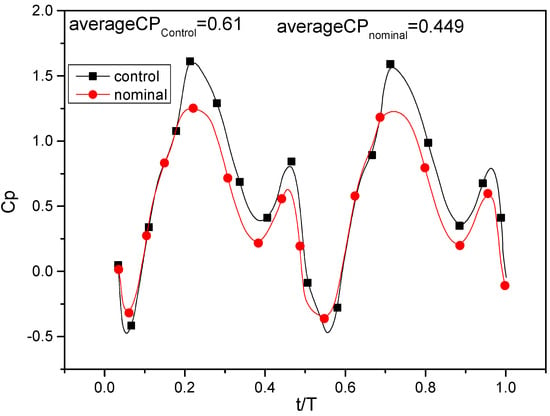
Figure 13.
Instantaneous progress of Cp(t).
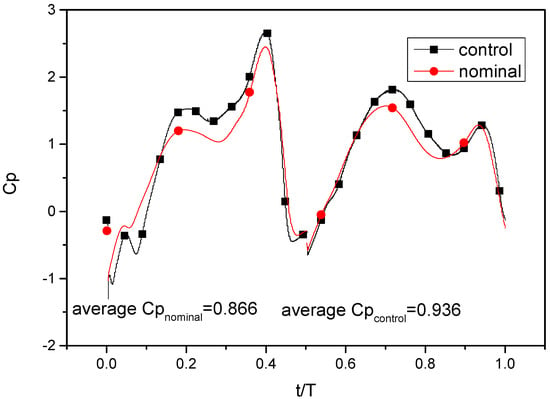
Figure 14.
Instantaneous progress of Cp(t) at: = 0.14, = 0.6, and Re = 1100.
In an arm mode turbine (Figure 13), the average output power increases from 0.449 to 0.61, which represents an improvement by about 35%. In a reversed D turbine, the average output power increases from 0.866 to 0.936, which represents an improvement by about 8%.
4. Conclusions
In this study, a 2D transient numerical method with a combined dynamic mesh technique was employed to investigate the effects of newly proposed expandable Gurney flaps on the performance of energy extraction using a flapping airfoil. The GFs deform successively, such that one of them expands in the first half of the cycle and returns to its initial shape in the second half. The results support the following conclusions.
- The proposed DGF increases lift and enhances the average output power.
- The investigation of DGF position shows that the DGF must be installed at the farthest point from the leading edge (L = 0).
- The expandable Gurney flap has an effect in two ways: firstly, it makes the LEV expand along the suction surface, delaying the flow separation, and, secondly, it supports the TEV strength and size which amplifies the pressure difference between the suction surface and the pressure surface, ultimately giving rise to a lift improvement.
- In an arm mode turbine, the average output power increases from 0.449 to 0.61, which represents an improvement by about 35%. In a reversed D turbine, the average output power increases from 0.866 to 0.936, which represents an improvement by about 8%.
Finally, the application of deformable Gurney flaps on a flapping turbine represents a promising novel idea for designing highly efficient energy extraction devices.
Author Contributions
Conceptualization, C.A. and G.L.; methodology, M.T.B., C.E.B., and A.Z.; software, M.T.B.; validation, N.L. and M.A.; formal analysis, N.L.; writing—original draft preparation, M.T.B., C.E.B., and A.Z.; writing—review and editing, N.L. and M.A. All authors have read and agreed to the published version of the manuscript.
Funding
This research received no external funding.
Data Availability Statement
The original contributions presented in this study are included in the article. Further inquiries can be directed to the corresponding author.
Conflicts of Interest
The authors declare that they have no known competing financial interests or personal relationships that could have appeared to influence the work reported in this paper.
Nomenclature
The following abbreviations are used in this manuscript:
| Chord length (m) | |
| Incoming flow velocity | |
| Airfoil drag coefficient, | |
| Airfoil lift coefficient, | |
| Airfoil pitching moment coefficient, | |
| Lift force (N) | |
| Drag force (N) | |
| Pitching moment on the airfoil (N.m) | |
| Plunge amplitude of the airfoil pivot point (m) | |
| Non-dimensional plunging amplitude (h/c) | |
| Airfoil instantaneous angle (deg) | |
| Pitching amplitude (deg) | |
| Flap pitching amplitude relative to trailing-edge tip (deg) | |
| Angular velocity of the airfoil (rad/s) | |
| Angular velocity of the Gurney flap (rad/s) | |
| Non-dimensional frequency, | |
| Flapping frequency (1/s) | |
| Phase angle between the pitching and plunging motions (deg) | |
| Power extracted by pitching motion (N/m2) | |
| Power extracted by plunging motion (N/m2) | |
| Power extracted by flap pitching motion (N/m2) | |
| Re | Reynolds number based on chord, |
| Aerodynamic power coefficient, | |
| Power coefficient due to plunging, | |
| Power coefficient due to pitching, | |
| Gurney flap power coefficient due to pitching, | |
| Airfoil velocity in Y direction (m/s) | |
| Effective angle of attack (deg) | |
| Effective upstream velocity (m/s) | |
| Maximum effective angle of attack (deg) | |
| DGF | Deformable Gurney flap |
| LEV | Leading-edge vortex |
| TEV | Trailing-edge vortex |
References
- Young, J.; Lai, J.C.S.; Platzer, M.F. A review of progress and challenges in flapping foil power generation. Prog. Aero Sci. 2014, 67, 228. [Google Scholar] [CrossRef]
- Zhu, Q. Energy harvesting by a purely passive flapping foil from shear flows. J. Fluids Struct. 2012, 34, 157–169. [Google Scholar] [CrossRef]
- Liu, Z.; Wang, Y.; Hua, X. Numerical studies and proposal of design equations on cylindrical oscillating wave surge converters under regular waves using SPH. Energy Convers. Manag. 2020, 203, 112242. [Google Scholar] [CrossRef]
- Zhang, D.; Ma, X.; Si, Y.; Huang, C.; Huang, B.; Li, W. Effect of doubly fed induction Generator Tidal current turbines on stability of a distribution grid under unbalanced voltage conditions. Energies 2017, 10, 212. [Google Scholar] [CrossRef]
- Li, Y.; Wang, J.; Zhang, P. Effects of gurney flaps on a NACA0012 airfoil. Flow Turbul. Combust. 2002, 68, 27–39. [Google Scholar] [CrossRef]
- Liu, T.; Montefort, J. Thin-airfoil theoretical interpretation for gurney flap lift enhancement. J. Aircr. 2007, 44, 667–671. [Google Scholar] [CrossRef]
- Ajalli, F.; Mani, M.; Tadjfar, M. Plunging wake analysis of an airfoil equipped with a Gurney flap. Exp. Tech. 2015, 39, 48–60. [Google Scholar] [CrossRef]
- Liebeck, R.H. Design of subsonic airfoils for high lift. J. Aircr. 1978, 15, 547–561. [Google Scholar] [CrossRef]
- Jang, C.S.; Ross, J.C.; Cummings, R.M. Numerical investigation of an airfoil with a Gurney flap. Aircr. Des. 1998, 1, 75. [Google Scholar] [CrossRef]
- Myose, R.; Papadakis, M.; Heron, I. Gurney flap experiments on airfoils, wings, and reflection planemodel. J. Aircr. 1998, 35, 206–211. [Google Scholar] [CrossRef]
- Giguere, P.; Lemay, J.; Dumas, G. Gurney flap effects and scaling for low-speed airfoils. In AIAA Paper; American Institute of Aeronautics and Astronautics: Reston, VA, USA, 1995; p. 1881. [Google Scholar]
- Lee, T.; Gerontakos, P. Oscillating wing loadings with trailing edge strips. J. Aircr. 2006, 43, 428–436. [Google Scholar] [CrossRef]
- Gerontakos, P.; Lee, T. Particle image velocimetry investigation of flow over unsteady airfoil with trailing edge strip. Exp. Fluids 2008, 44, 539–556. [Google Scholar] [CrossRef]
- Bianchini, A.; Balduzzi, F.; Di Rosa, D.; Ferrara, G. On the use of Gurney Flaps for the aerodynamic performance augmentation of Darrieus wind turbines. Energy Convers. Manag. 2019, 184, 402–415. [Google Scholar] [CrossRef]
- Syawitri, T.P.; Yao, Y.; Yao, J.; Chandra, B. Geometry optimisation of vertical axis wind turbine with Gurney flap for performance enhancement at low, medium and high ranges of tip speed ratios. Sustain. Energy Technol. Assess. 2022, 49, 101779. [Google Scholar] [CrossRef]
- Kotb, A.T.; Nawar, M.A.; Attai, Y.A.; Mohamed, M.H. Mohamed: Performance assessment of a modified wells turbine using an integrated casing groove and Gurney flap design for wave energy conversion. Renew. Energy 2022, 197, 627–642. [Google Scholar] [CrossRef]
- Han, D.; Dong, C.; Barakos, G.N. Performance improvement of variable speed rotors by Gurney flaps. Aerosp. Sci. Technol. 2018, 81, 118–127. [Google Scholar] [CrossRef]
- Xie, Y.H.; Jiang, W.; Lu, K.; Zhang, D. Numerical investigation into energy extraction of flapping airfoil with Gurney flaps. Energy 2016, 109, 694–702. [Google Scholar] [CrossRef]
- Zhu, B.; Huang, Y.; Zhang, Y.M. Energy harvesting properties of a flapping wing with an adaptive Gurney flap. Energy 2018, 152, 119–128. [Google Scholar] [CrossRef]
- Bouzaher, M.T.; Drias, N.; Guerira, B. Improvement of energy extraction efficiency for flapping airfoils by using oscillating gurney flaps. Arab. J. Sci. Eng. 2019, 44, 809–819. [Google Scholar] [CrossRef]
- Arfaoui, B.; Bouzaher, M.T.; Guerira, B.; Bensaci, C.E. On the Performance of Swing Arm Flapping Turbines. J. Sol. Energy Eng. 2021, 143, 011013. [Google Scholar] [CrossRef]
- Sun, G.; Wang, Y.; Xie, Y.; Lv, K.; Sheng, R. Research on the effect of a movable gurney flap on energy extraction of oscillating hydrofoil. Energy 2021, 225, 120206. [Google Scholar] [CrossRef]
- Li, Y.; Zhang, N.; Pan, Z. Propulsive performance of a newly conceptual design of flapping foil with fixed gurney plate-A numerical study. Ocean Eng. 2021, 239, 109800. [Google Scholar] [CrossRef]
- Tian, C.; Liu, X. Numerical study on the energy extraction characteristics of a flapping foil with movable lateral flaps. Renew. Energy 2024, 225, 120244. [Google Scholar] [CrossRef]
- Wu, J.; Shu, C.; Zhao, N.; Tian, F.-B. Numerical study on the power extraction performance of a flapping foil with a flexible tail. Phys. Fluids 2015, 27, 013602. [Google Scholar] [CrossRef]
- Wu, S.; Wang, L. Numerical Study on the Energy Harvesting Performance of a Flapping Foil with Attached Flaps. Processes 2024, 12, 1963. [Google Scholar] [CrossRef]
- Kinsey, T.; Dumas, G.; Lalande, G.; Ruel, J.; Mehut, A.; Viarouge, P.; Lemay, J.; Jean, Y. Prototype testing of a hydrokinetic turbine based on oscillating hydrofoils. Renew. Energy 2011, 36, 1710–1718. [Google Scholar] [CrossRef]
- Kinsey, T.; Dumas, G. Parametric Study of an Oscillating Airfoil in a Power-Extraction Regime. AIAA J. 2008, 46, 1318–1330. [Google Scholar] [CrossRef]
- Wernert, P.; Geissler, W.; Raffel, M.; Kompenhans, J. Experimental and numerical investigations of dynamic stall on a pitching airfoil. AIAA J. 1996, 34, 982–989. [Google Scholar] [CrossRef]
- Lee, T.; Gerontakos, P. Investigation of flow over an oscillating airfoil. J. Fluid Mech. 2004, 512, 313–341. [Google Scholar] [CrossRef]
- Young, J.; Lai, J.C.S. Mechanisms influencing the efficiency of oscillating airfoil propulsion. AIAA J. 2007, 45, 1695–1702. [Google Scholar] [CrossRef]
- Xiao, Q.; Liao, W.; Yang, S.; Peng, Y. How motion trajectory affects energy extraction performance of a biomimic energy generator with an oscillating foil? Renew. Energy 2012, 37, 61–75. [Google Scholar] [CrossRef]
- Wang, B.; Zhu, B.; Zhang, W. New type of motion trajectory for increasing the power extraction efficiency of flapping wing devices. Energy 2019, 189, 116072. [Google Scholar] [CrossRef]
- Hoke, C.M.; Young, J.; Lai, J.C. Enhancing the Power-Extraction Efficiency of a Flapping Foil by Active Morphing. AIAA J. 2023, 61, 4056–4069. [Google Scholar] [CrossRef]
- Usoh, C.O.; Young, J.; Lai, J.C.S.; Ashraf, M.A. Numerical Analysis of a Non-Profiled Plate for Flapping Wing Turbines. In Proceedings of the 18th Australasian Fluid Mechanics Conference Launceston, Launceston, Australia, 3–7 December 2012. [Google Scholar]
- Simpson, B.J.; Hover, F.S.; Triantafyllou, M.S. Experiments in direct energy extraction through flapping foils. In Proceedings of the Eighteenth International Offshore and Polar Engineering Conference. One Petro, Vancouver, BC, Canada, 6–11 July 2008. [Google Scholar] [CrossRef]
Disclaimer/Publisher’s Note: The statements, opinions and data contained in all publications are solely those of the individual author(s) and contributor(s) and not of MDPI and/or the editor(s). MDPI and/or the editor(s) disclaim responsibility for any injury to people or property resulting from any ideas, methods, instructions or products referred to in the content. |
© 2025 by the authors. Licensee MDPI, Basel, Switzerland. This article is an open access article distributed under the terms and conditions of the Creative Commons Attribution (CC BY) license (https://creativecommons.org/licenses/by/4.0/).


