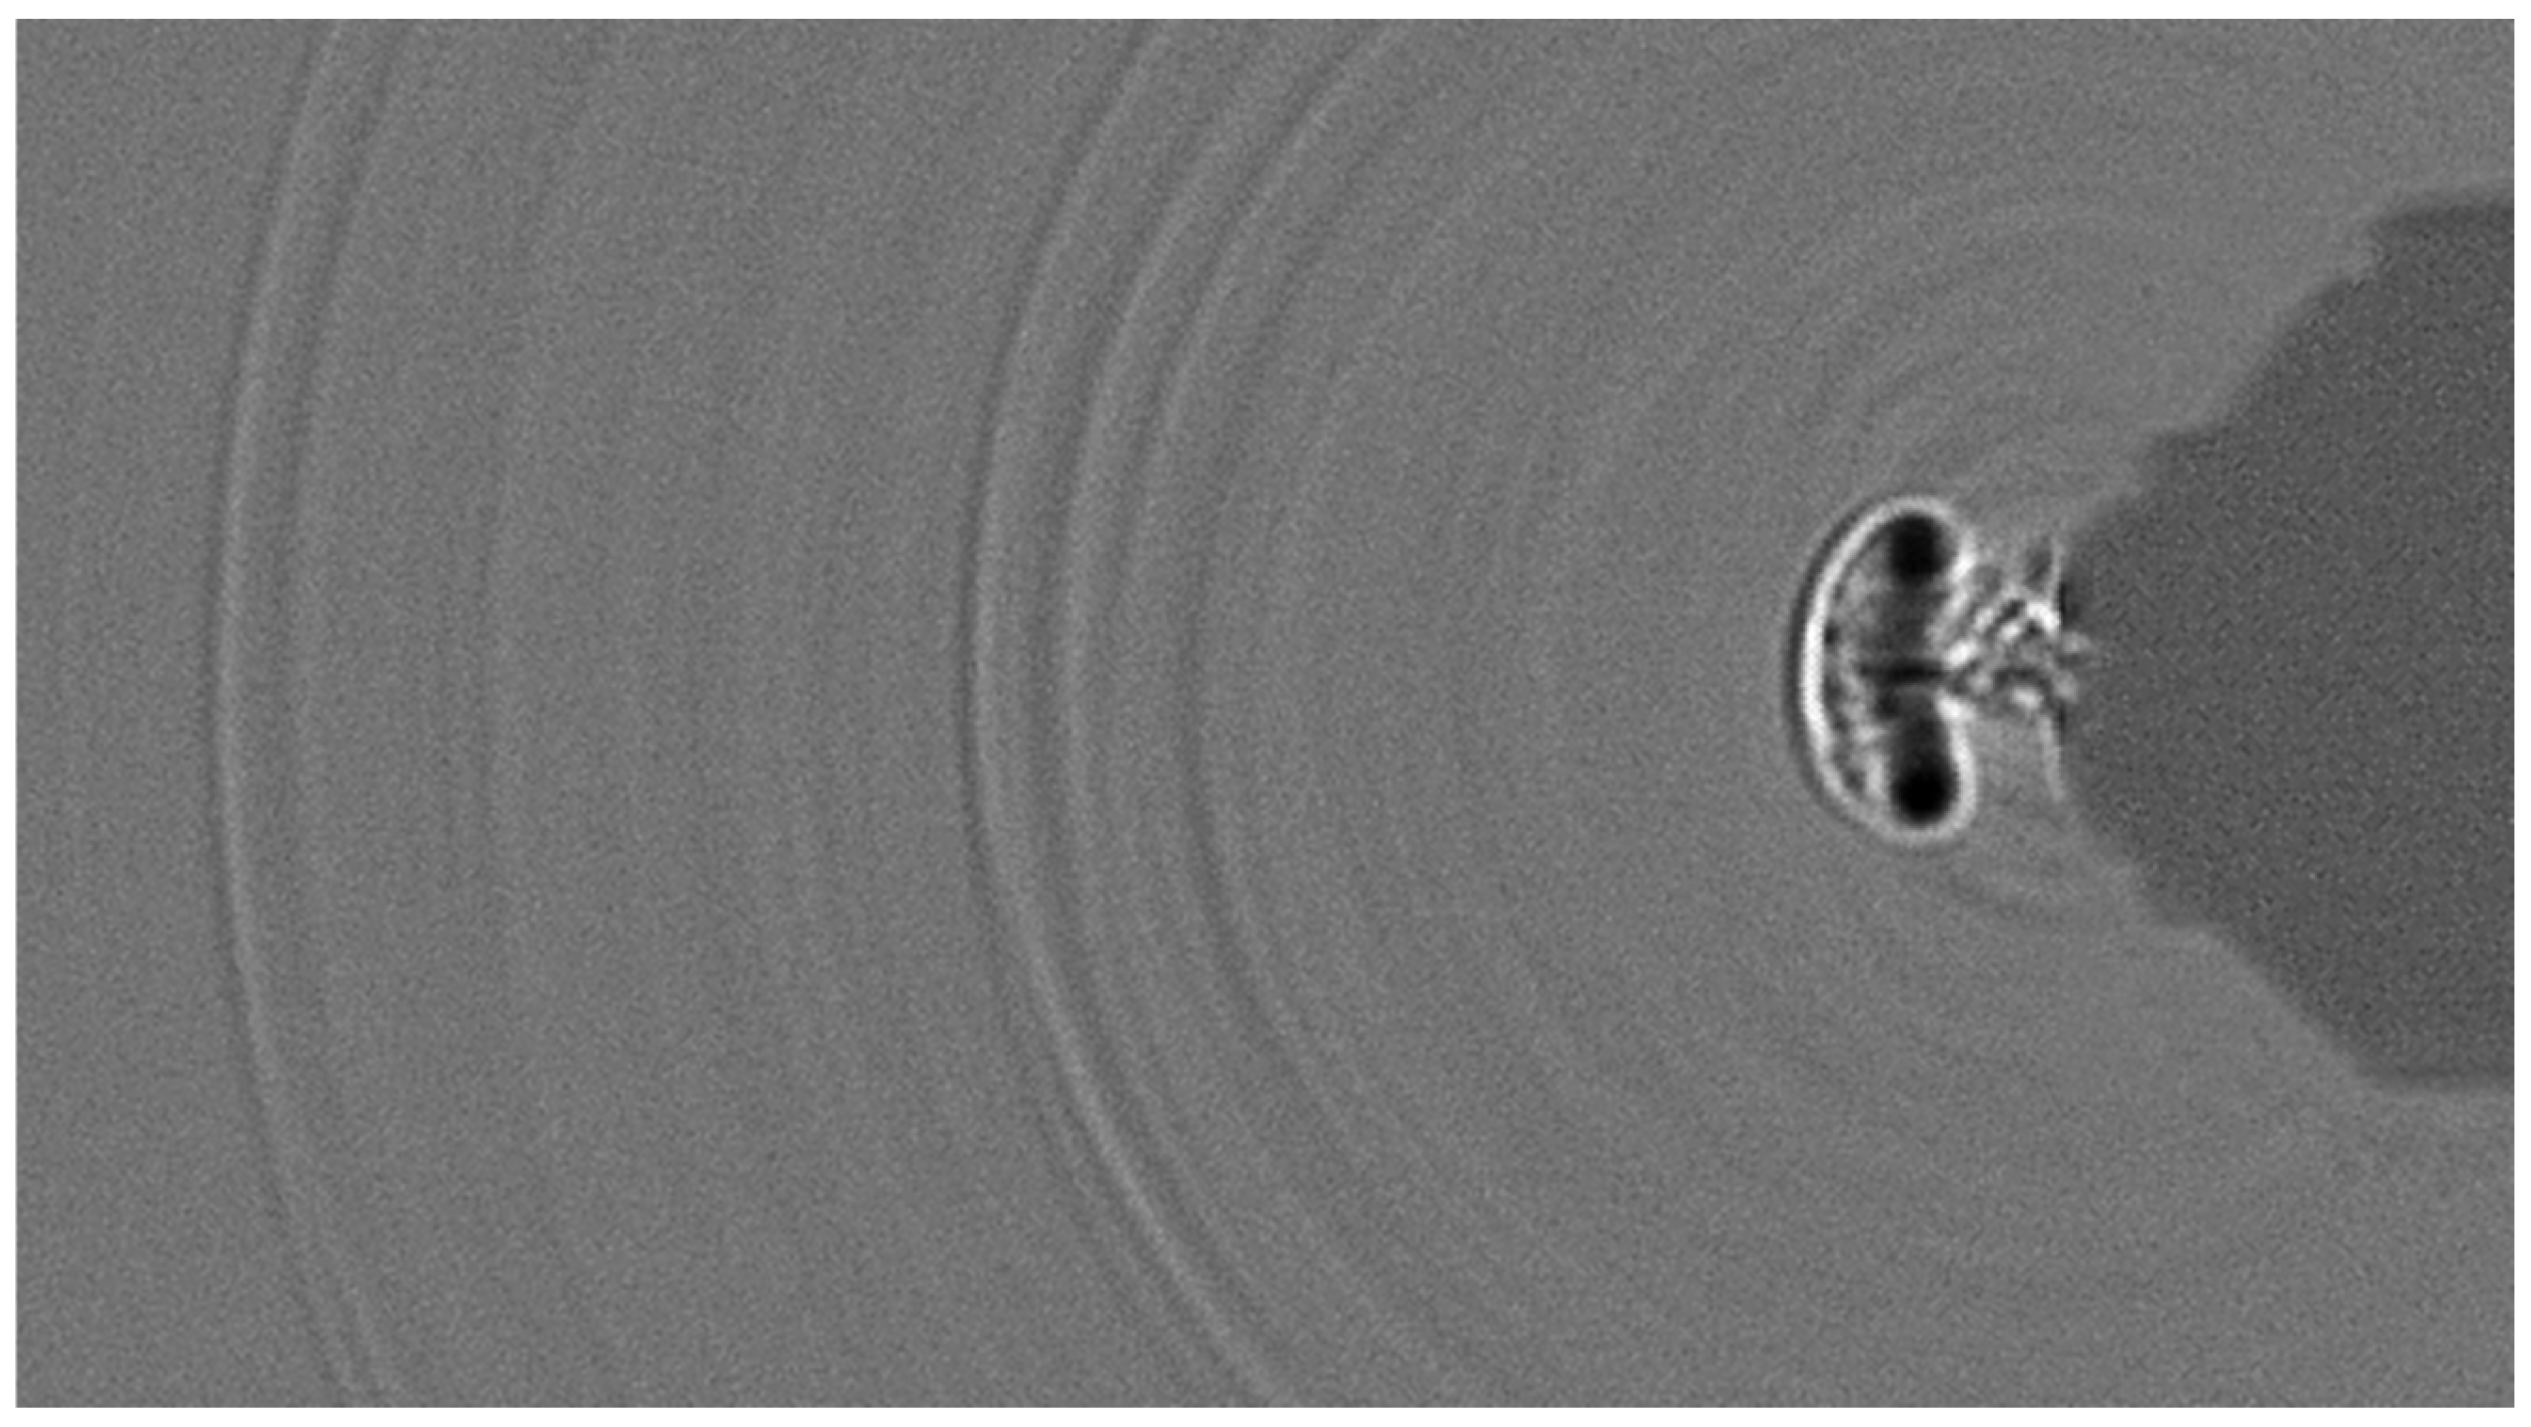
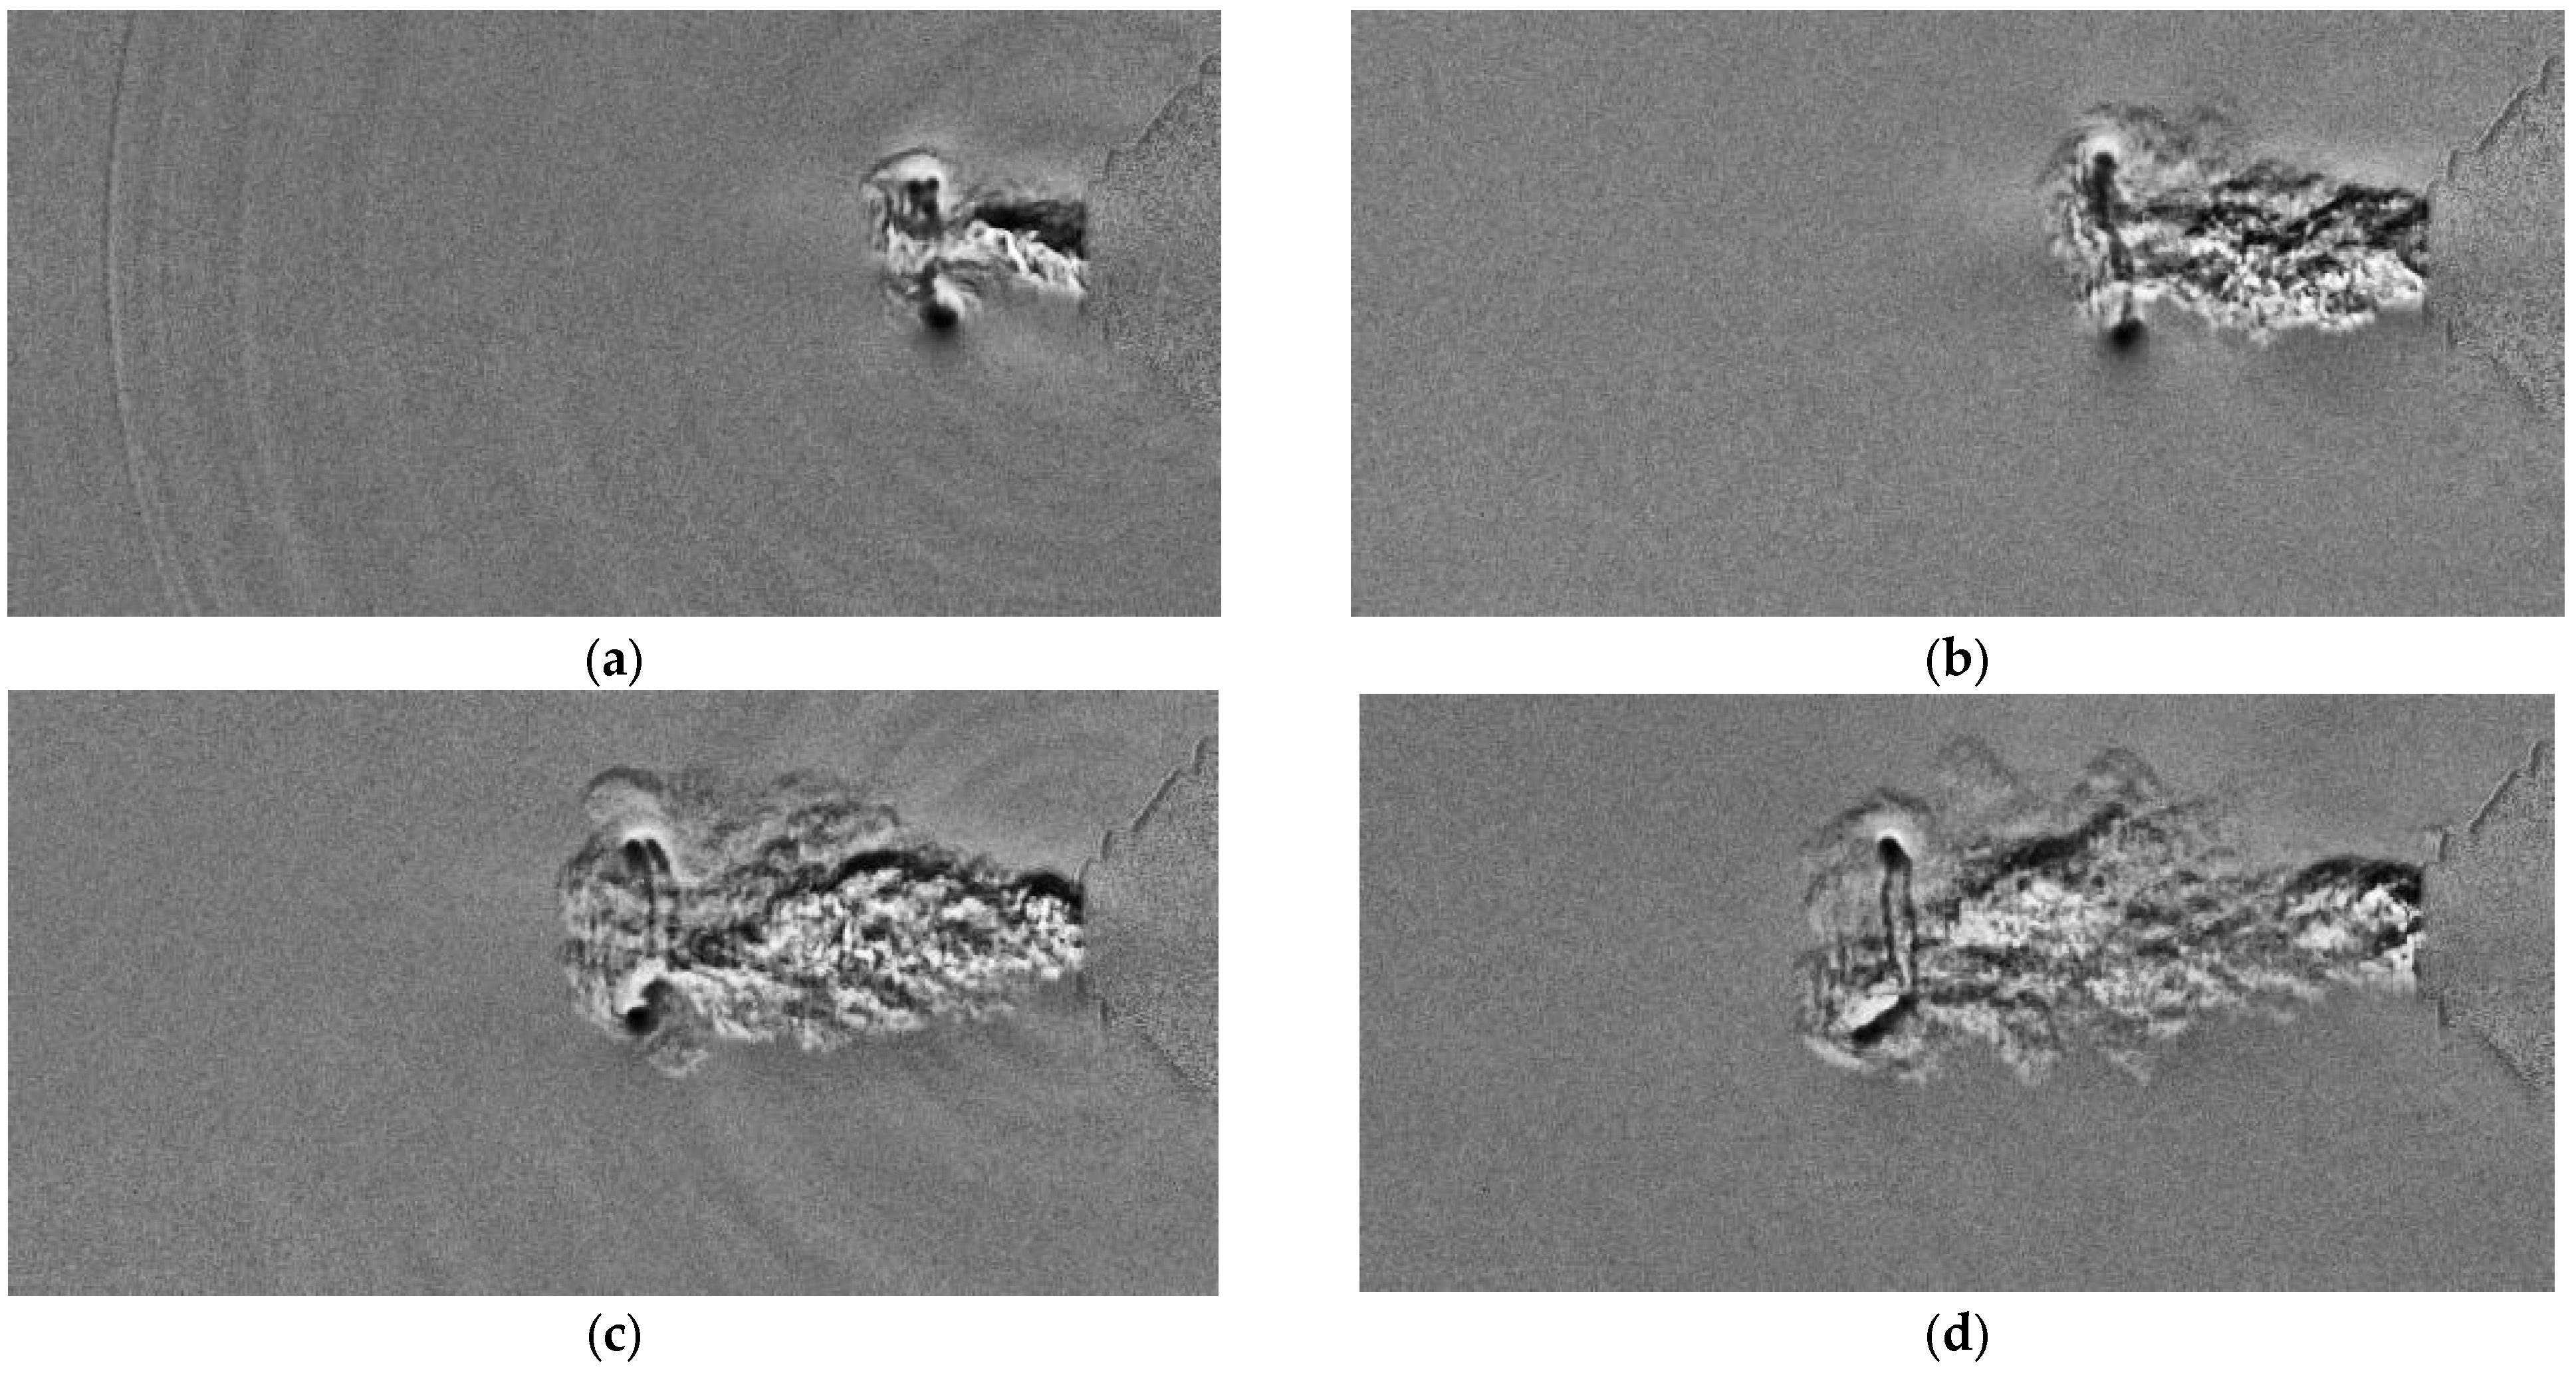
The firing sequence revealed a characteristic succession of flow structures captured with high-speed schlieren imaging. Immediately after discharge, a series of concentric sound pressure waves were observed propagating outward from the muzzle. These were followed by the emergence of the primary muzzle blast, which rapidly evolved into a vortex-ring boundary surrounding the expanding CO2 jet. As the projectile was expelled, the jet developed a complex shear-layer structure that later appeared to recede toward the muzzle, indicating partial flow reversal and entrainment. After this transient re-ingestion, a secondary muzzle blast was detected in the subsequent frames, propagating with lower intensity than the primary event. This sequence, initial acoustic emission, blast wave formation, vortex-ring development, jet evolution, and secondary blast, represents the complete early-phase dynamics of the discharge. These steps are further analyzed.
3.1. Sound Pressure Wave Fronts
Pressure waves were extracted from enhanced schlieren frames obtained in the single-mirror configuration, using the pipeline described below. Recordings were performed with a Phantom VEO 710 L high-speed camera (Wayne, NJ, USA) at a resolution of 1280 × 800 px and a frame rate of 7500 fps. The exposure time was set to 2 µs with 12-bit depth, and synchronization was internal.
Background normalization was achieved by correcting each frame through subtracting a reference background acquired under identical optical settings, then rescaled to [0, 1] to reduce illumination non-uniformity.
Contrast enhancement with ring emphasis was obtained by applying a mild band-pass filter (difference of Gaussians σlow > σhigh, and CLAHE) to accentuate faint, quasi-circular fronts while suppressing low-frequency illumination drift and high-frequency sensor noise.
For geometric calibration and center finding, the mirror aperture (visible as a circular disk) was segmented and fitted with a circle to obtain its radius in pixels. Using the known mirror diameter (254 mm), the pixel scale S (mm/px) and the optical axis (center) were determined. When the mirror was not in view, an alternative in-frame reference (such as the 5 mm ball) provided S.
For ring detection (pressure fronts), two complementary methods were used. For the radial profile, the angle-averaged intensity was computed as a function of radius about the optical center and local maxima were extracted (peak-finding with minimum distance and prominence constraints) and taken as ring radii. The second method was the constrained circular Hough, where candidate circles were searched with centers constrained near the optical axis and radii restricted to [, 0.95 ]. Detections from both methods were cross-checked, and spurious picks near the center or close to the mirror edge were rejected. The detected radii (px) were converted to millimeters: .
The propagation speed was obtained from frame to frame. The sequence was recorded at 7500 fps and
v was extracted, applying Equation (1).
where
is measured in meters. The measured v was compared to the speed of sound a, calculated to the measured ambient temperature reported.
Emission timing was also extracted from the frames. When multiple concentric fronts appeared in a single frame, their inferred emission times relative to capture were computed as
Using
a from the ambient temperature
T, and inter-pulse spacings were reported as
The uncertainty analysis was also taken into account. The dominant contributions were ring-pick uncertainty ( px in radius), calibration error in S, and frame timing ( one frame interval). Propagated uncertainties were reported for , v, and (seconds) via standard linear error propagation. This formulation assumes that the individual uncertainty sources are independent and that higher-order terms are negligible, which is acceptable given the small relative errors (<5%) associated with the present measurements.
All image processing and quantitative analysis were performed in MATLAB 2020a using a custom script. Background normalization was implemented by subtracting a reference frame and rescaling intensity with the MATLAB function
mat2gray. Contrast enhancement employed a combination of Gaussian filtering, Wiener denoising, and contrast-limited adaptive histogram equalization (
adapthisteq) to highlight faint circular features.
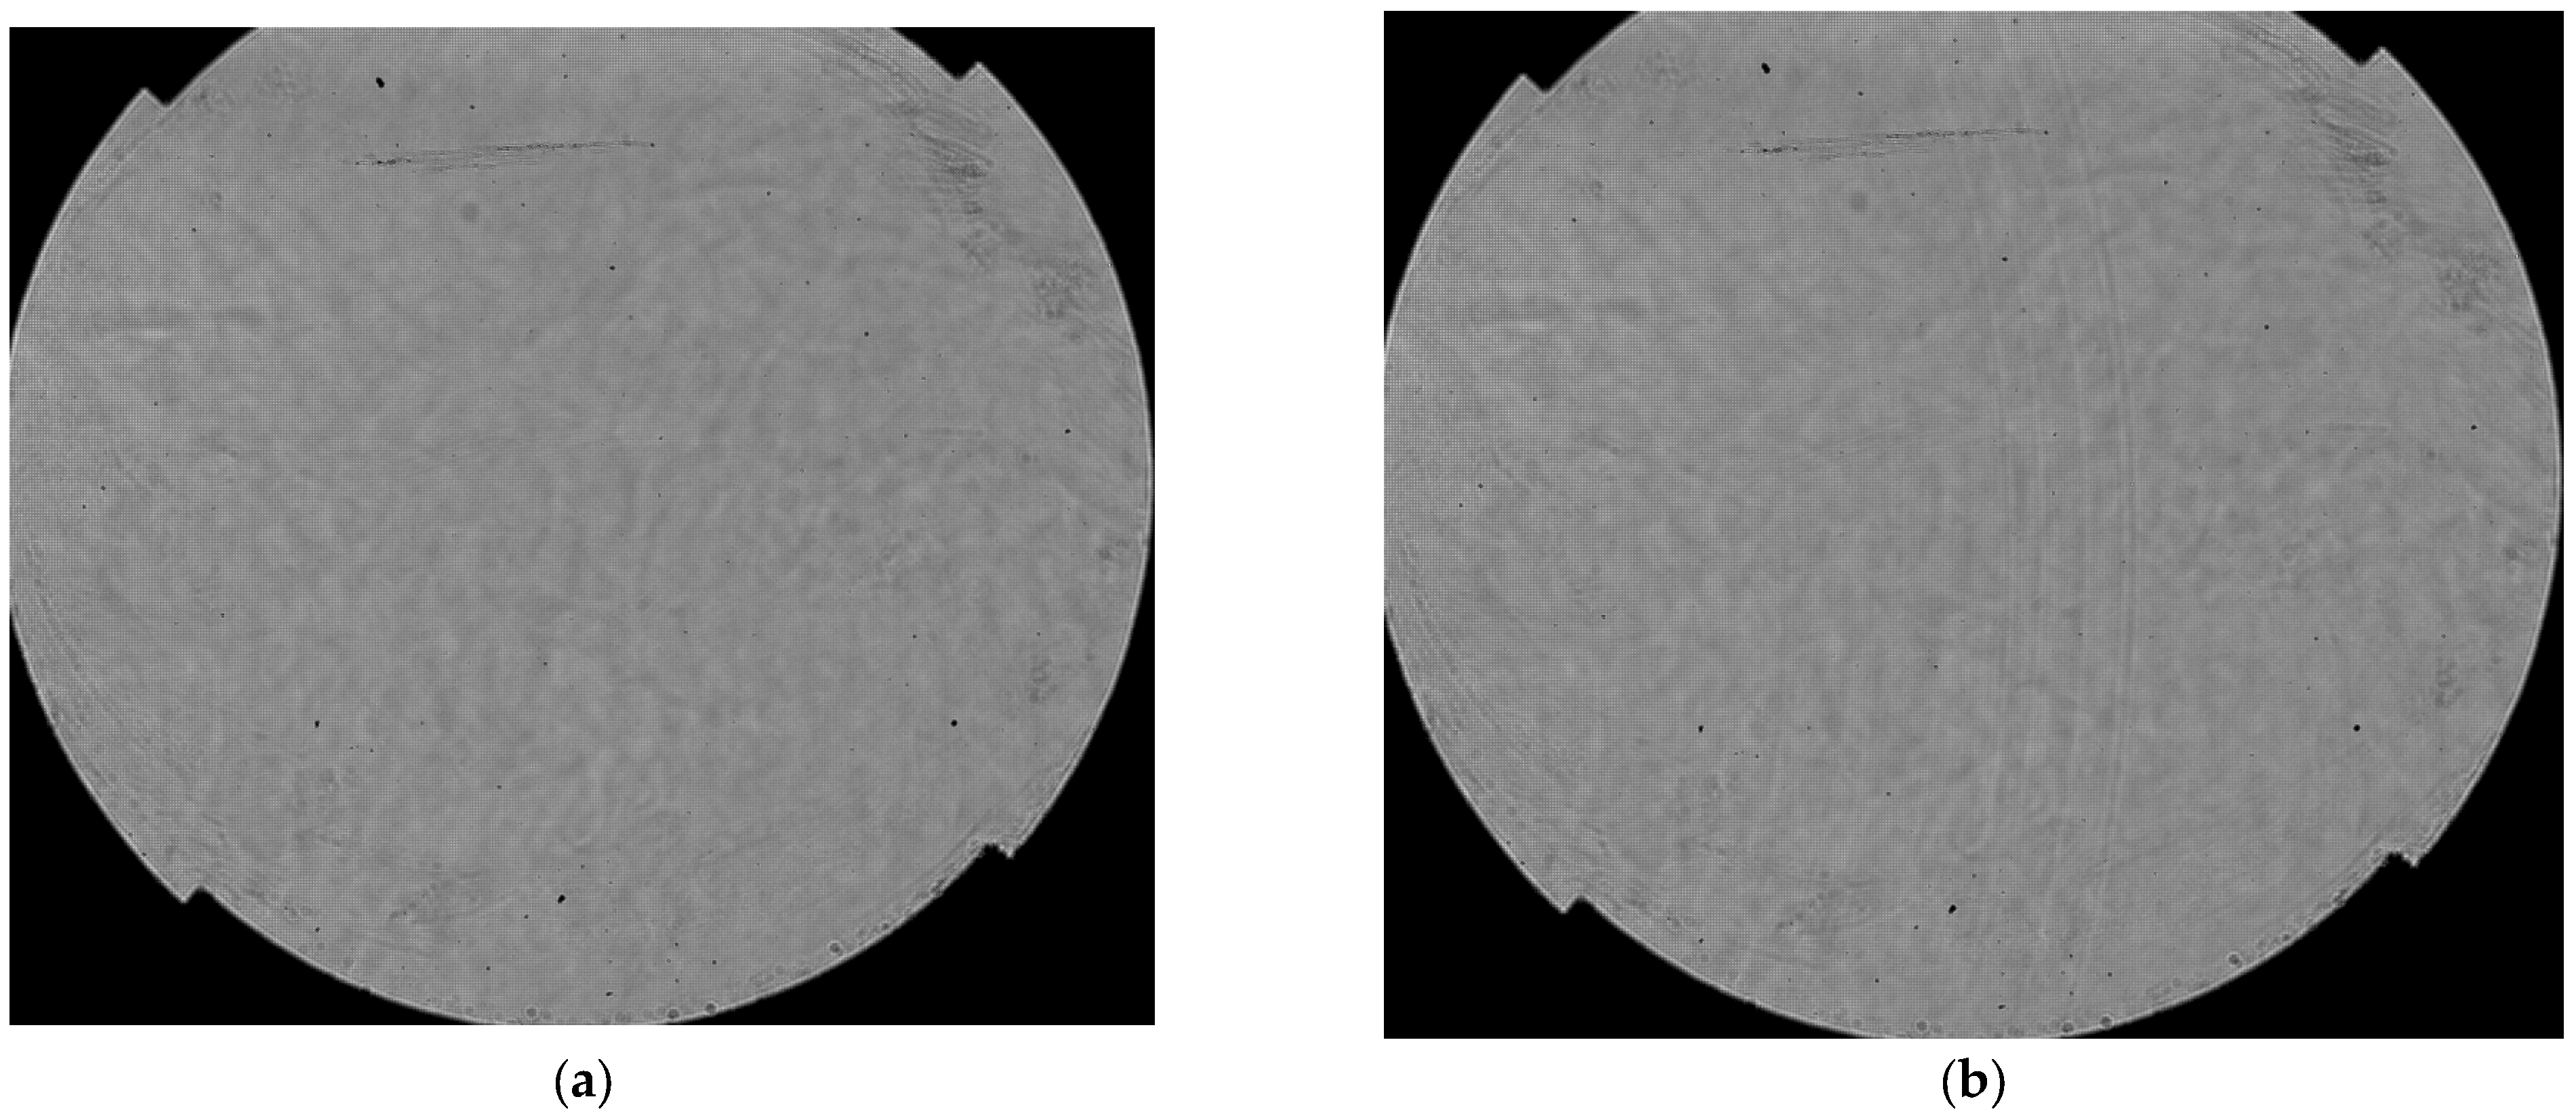
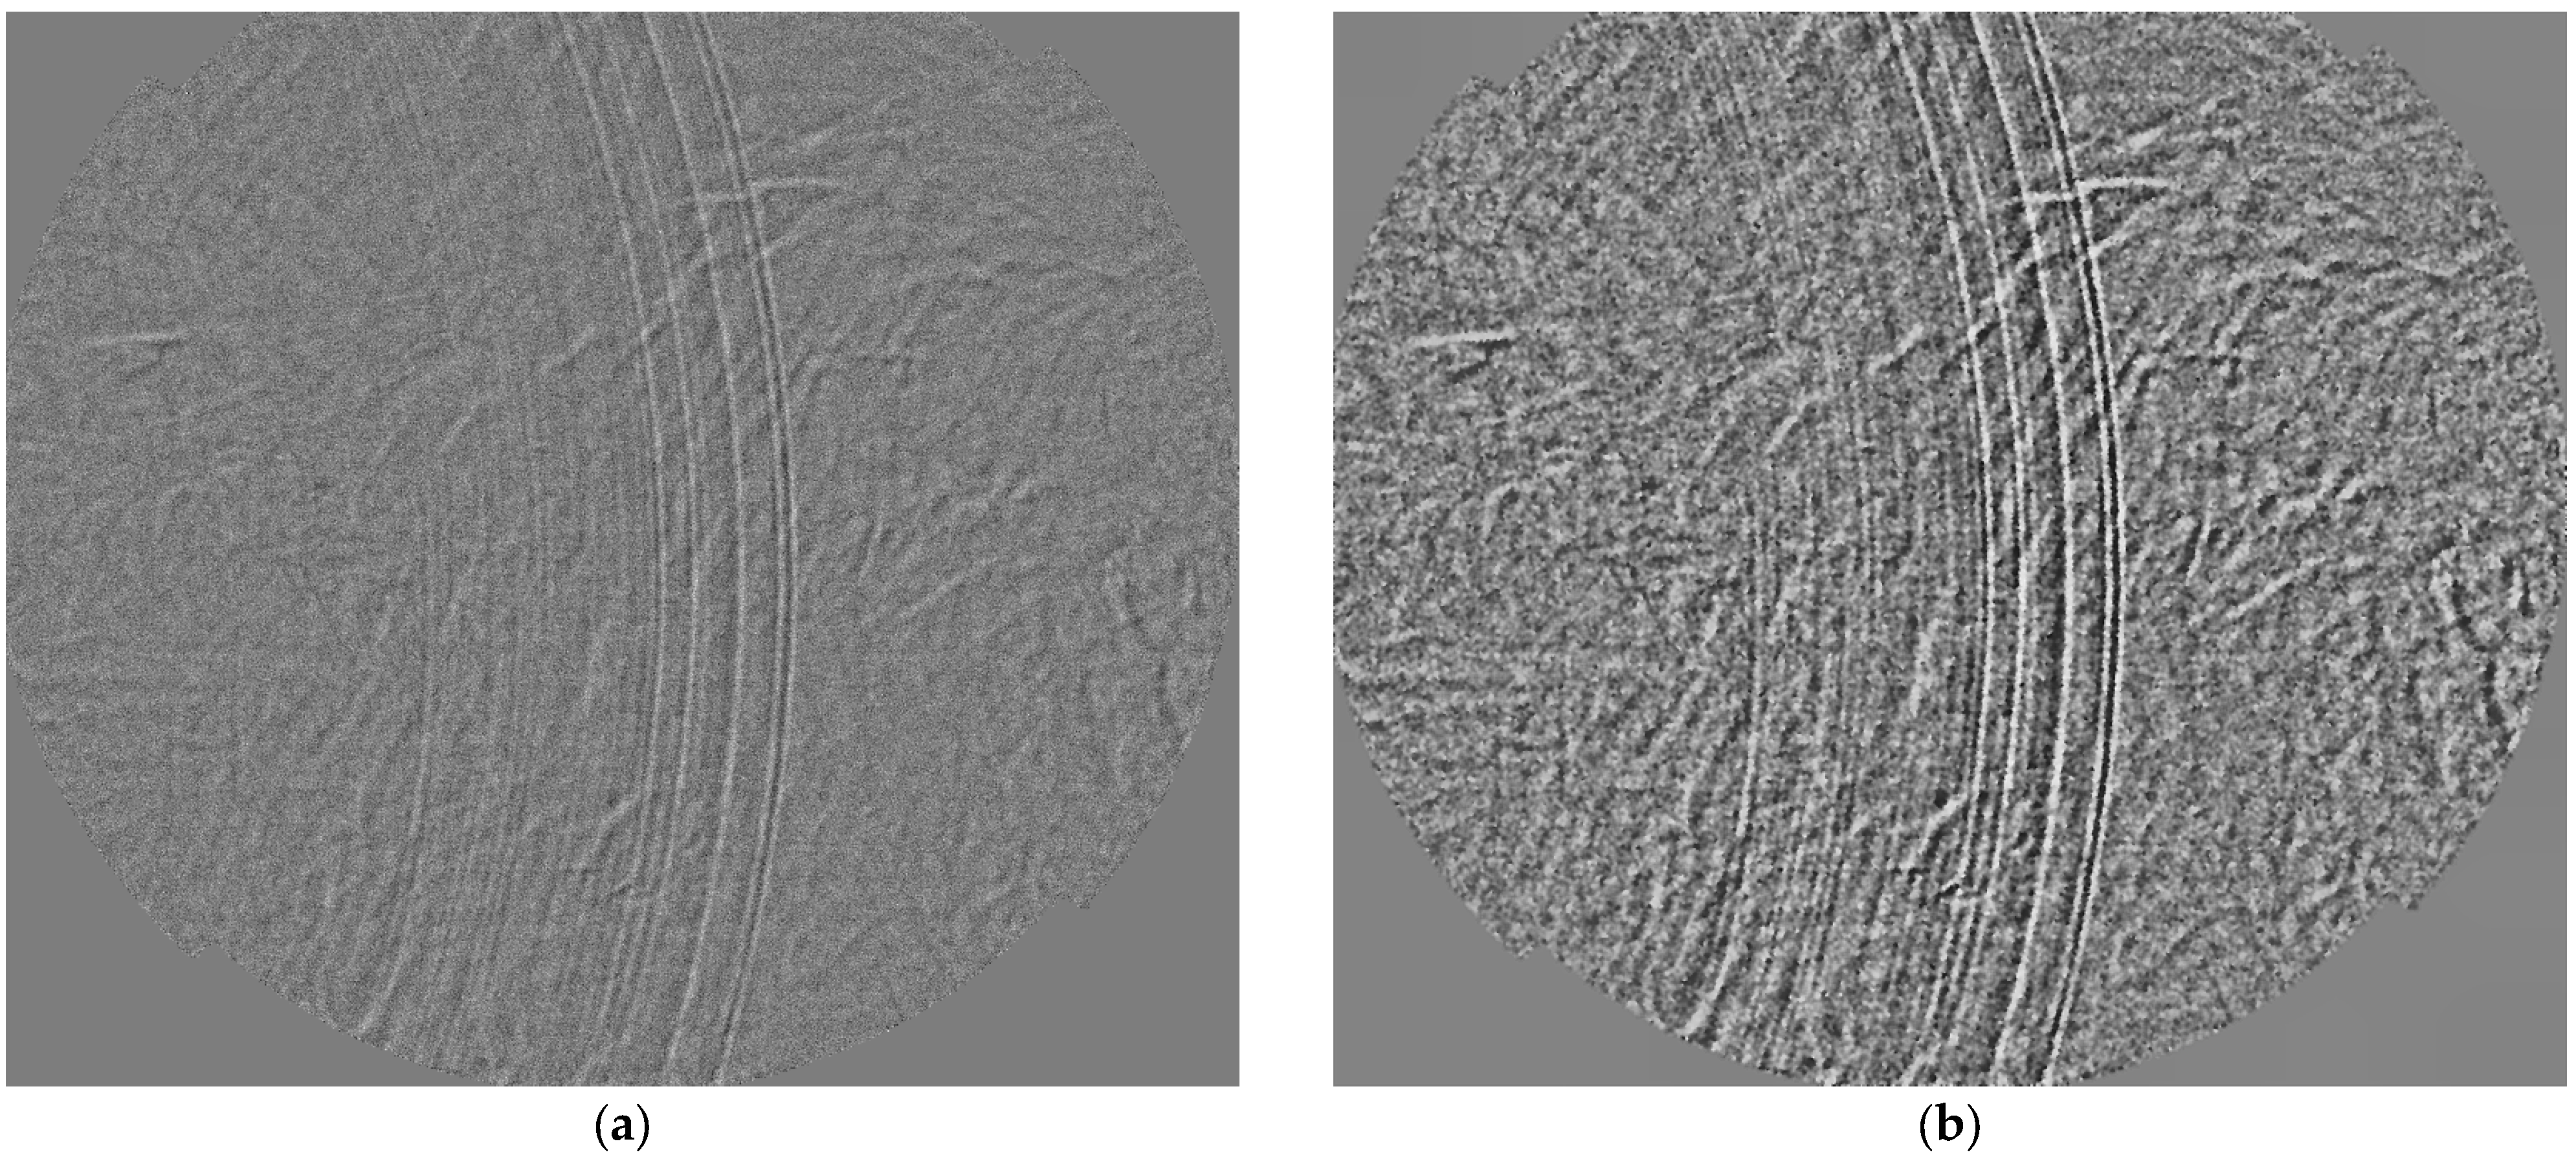
Figure 3 presents (a) the image of the tare image without the phenomena, emphasizing the outdoors heat, while (b) presents the raw image of the sound pressure waves.
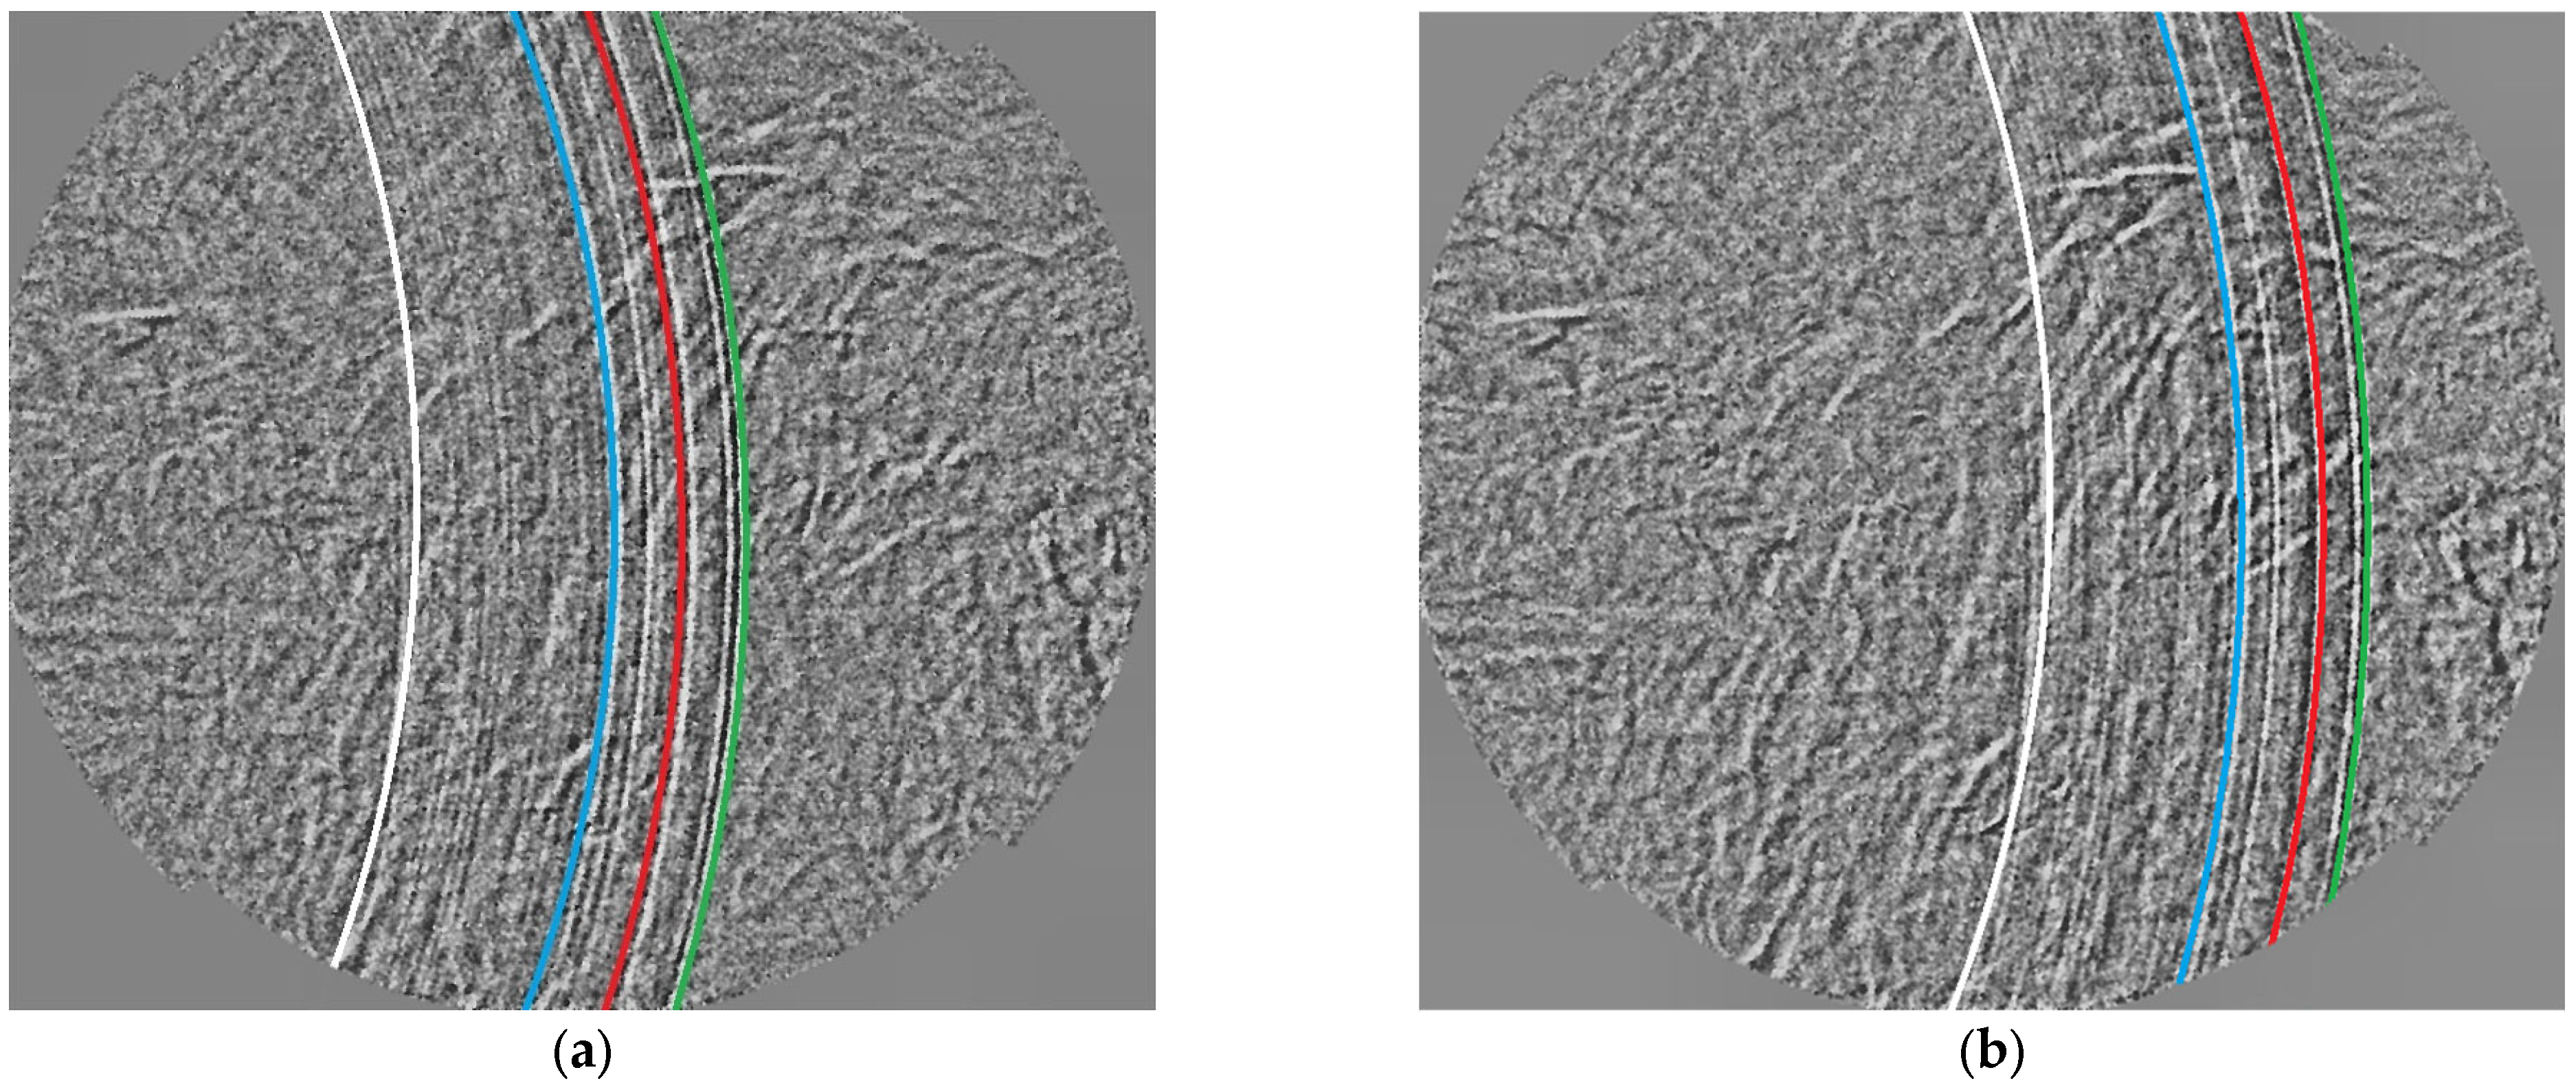
Figure 4 presents the results of the (a) background normalization and (b) the contrast enhanced image of the phenomenon.
Contrast enhancement highlights the internal structure of the pressure waves and provides information on the emission timing of otherwise faint wavefronts.
Geometric calibration was achieved by detecting the mirror aperture in the images and fitting it with
imfindcircles to obtain the optical center and scale factor in mm/px. Pressure-wave radii were identified by two complementary methods: (i) an angle-averaged radial intensity profile computed with
improfile and processed with
find_peaks, and (ii) a constrained circular Hough transform via
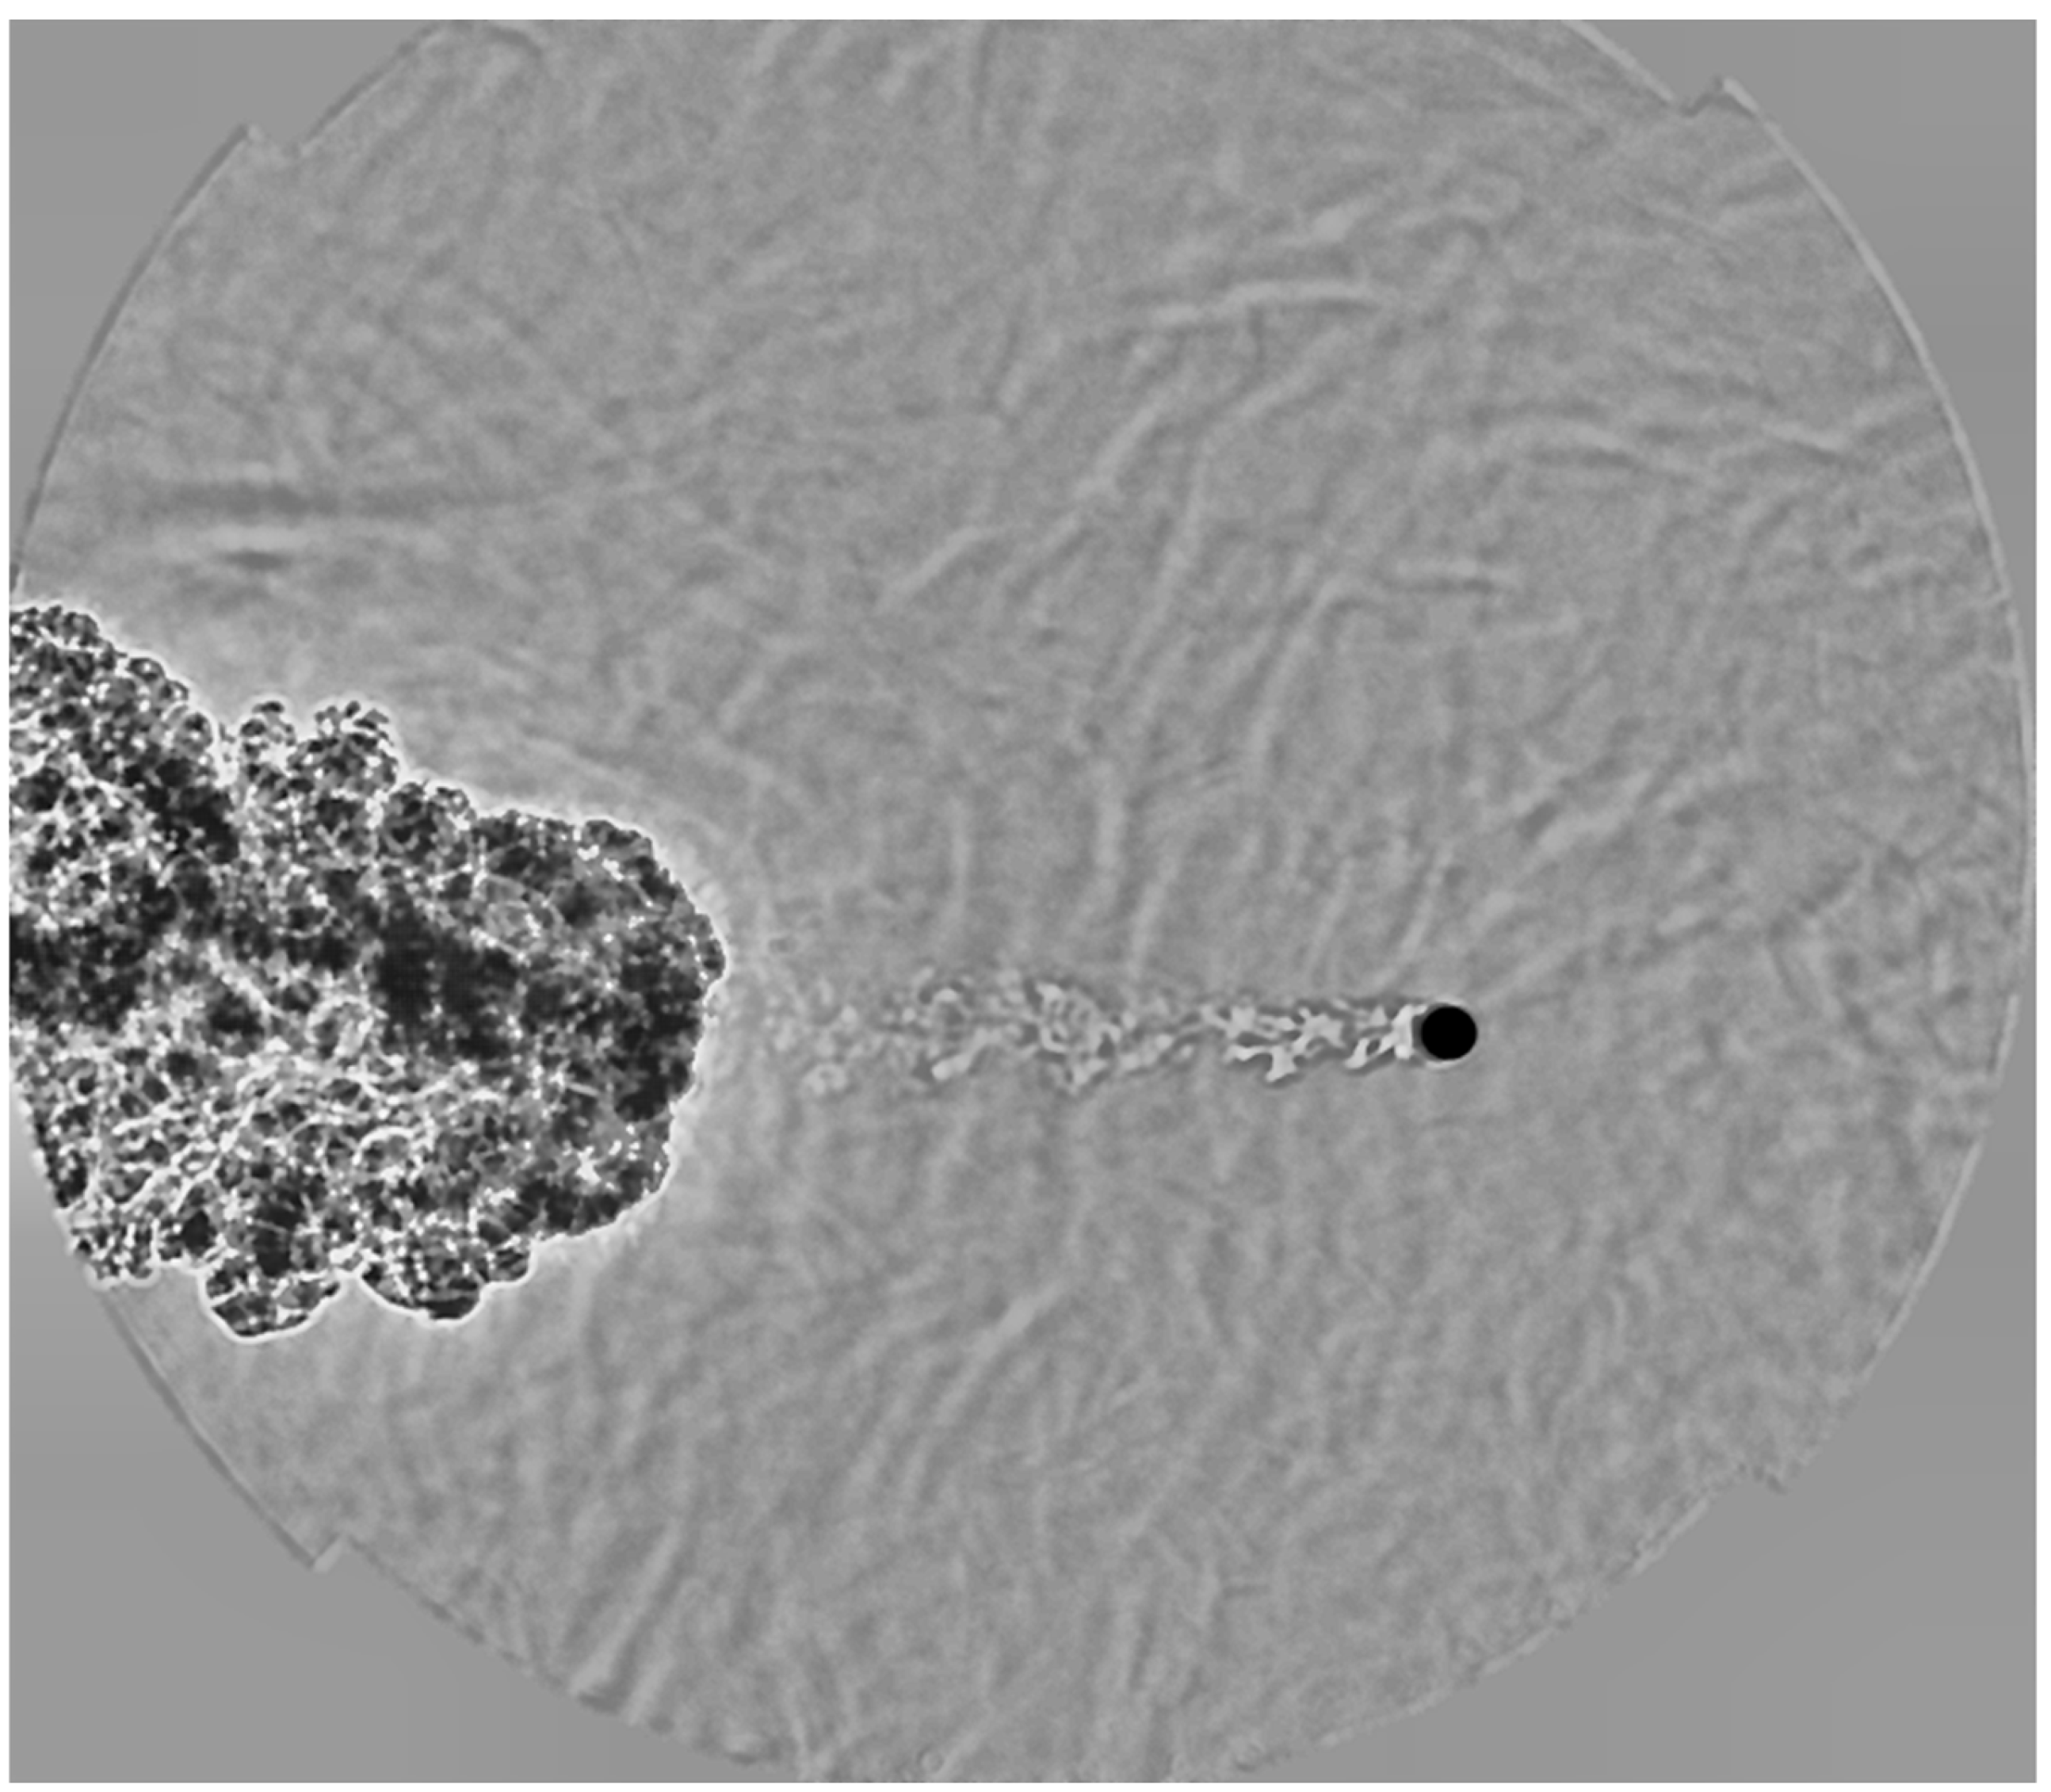
imfindcircles. The identified circular pressure waves are represented in
Figure 5 in two consecutive frames, (a) and (b).
The results were cross-checked and spurious detections near the center or mirror edge were discarded. Radii were converted from pixels to millimeters and stored for further analysis. The magnification factor was determined from the known mirror diameter, yielding a scale of 0.318 mm per pixel in real space.
Propagation velocities were then computed by tracking the same wavefront across consecutive frames, using the known frame interval (1/7500 s). In addition, multiple concentric fronts observed within a single frame were used to infer inter-pulse emission times based on the local speed of sound.
The sequence analysed up to this point represents the sound pressure waves generated immediately after CO2 release and prior to the formation of the muzzle shock. After background subtraction and contrast enhancement, multiple concentric fronts were resolved with sufficient contrast for quantitative tracking.
The green wavefront was quantified by identifying the most external intensity peak of the circular profile and measuring its horizontal distance from the inner edge of the mirror aperture. This procedure was applied to two consecutive frames, where the peak advanced from 512 px to 661 px, a displacement of 149 px. With the calibration factor of 0.318 mm/px, this corresponds to 47.4 mm. Over the frame interval of 133 µs, the resulting propagation velocity was:
which is in close agreement with the theoretical sound speed at 41 °C (a ≈ 355.6 m/s)
The theoretical value of the speed of sound under the recorded ambient temperature was estimated using the standard relation , where is the ratio of specific heats for air, is the specific gas constant, and is the absolute temperature. The measured propagation velocity of 355.5 m/s agrees closely with the theoretical value of 347 m/s for air at 41 °C, corresponding to a relative deviation of only ≈2.4%, which lies within the estimated experimental uncertainty.
Analysis of the additional red, blue, and white pressure fronts confirmed that all concentric waves propagated at the same velocity. Even when analyzed from the same frame these fronts were identified within a single frame, their radial separations (12.1 mm and 16.2 mm) translate into temporal delays of 34 µs and 45.6 µs when divided by the measured acoustic velocity. These values are consistent with the frame-to-frame tracking of the green front, demonstrating that the successive rings represent distinct pulses of the same acoustic train, all propagating at the local speed of sound.
Finally, uncertainties were estimated by propagating the effects of pixel resolution, calibration error, and frame timing.
The uncertainty in the velocity determination arises mainly from pixel-scale calibration, wavefront peak detection, and frame timing. With a calibration factor of 0.318 mm/px, an estimated ±1 px error in peak position corresponds to ±0.32 mm. Over the measured displacement of 149 px (47.4 mm) between frames, this gives a relative uncertainty of ≈0.95%. Including calibration (0.24%) and frame-timing (<0.1%) contributions, the total propagated error is approximately 1.25%.
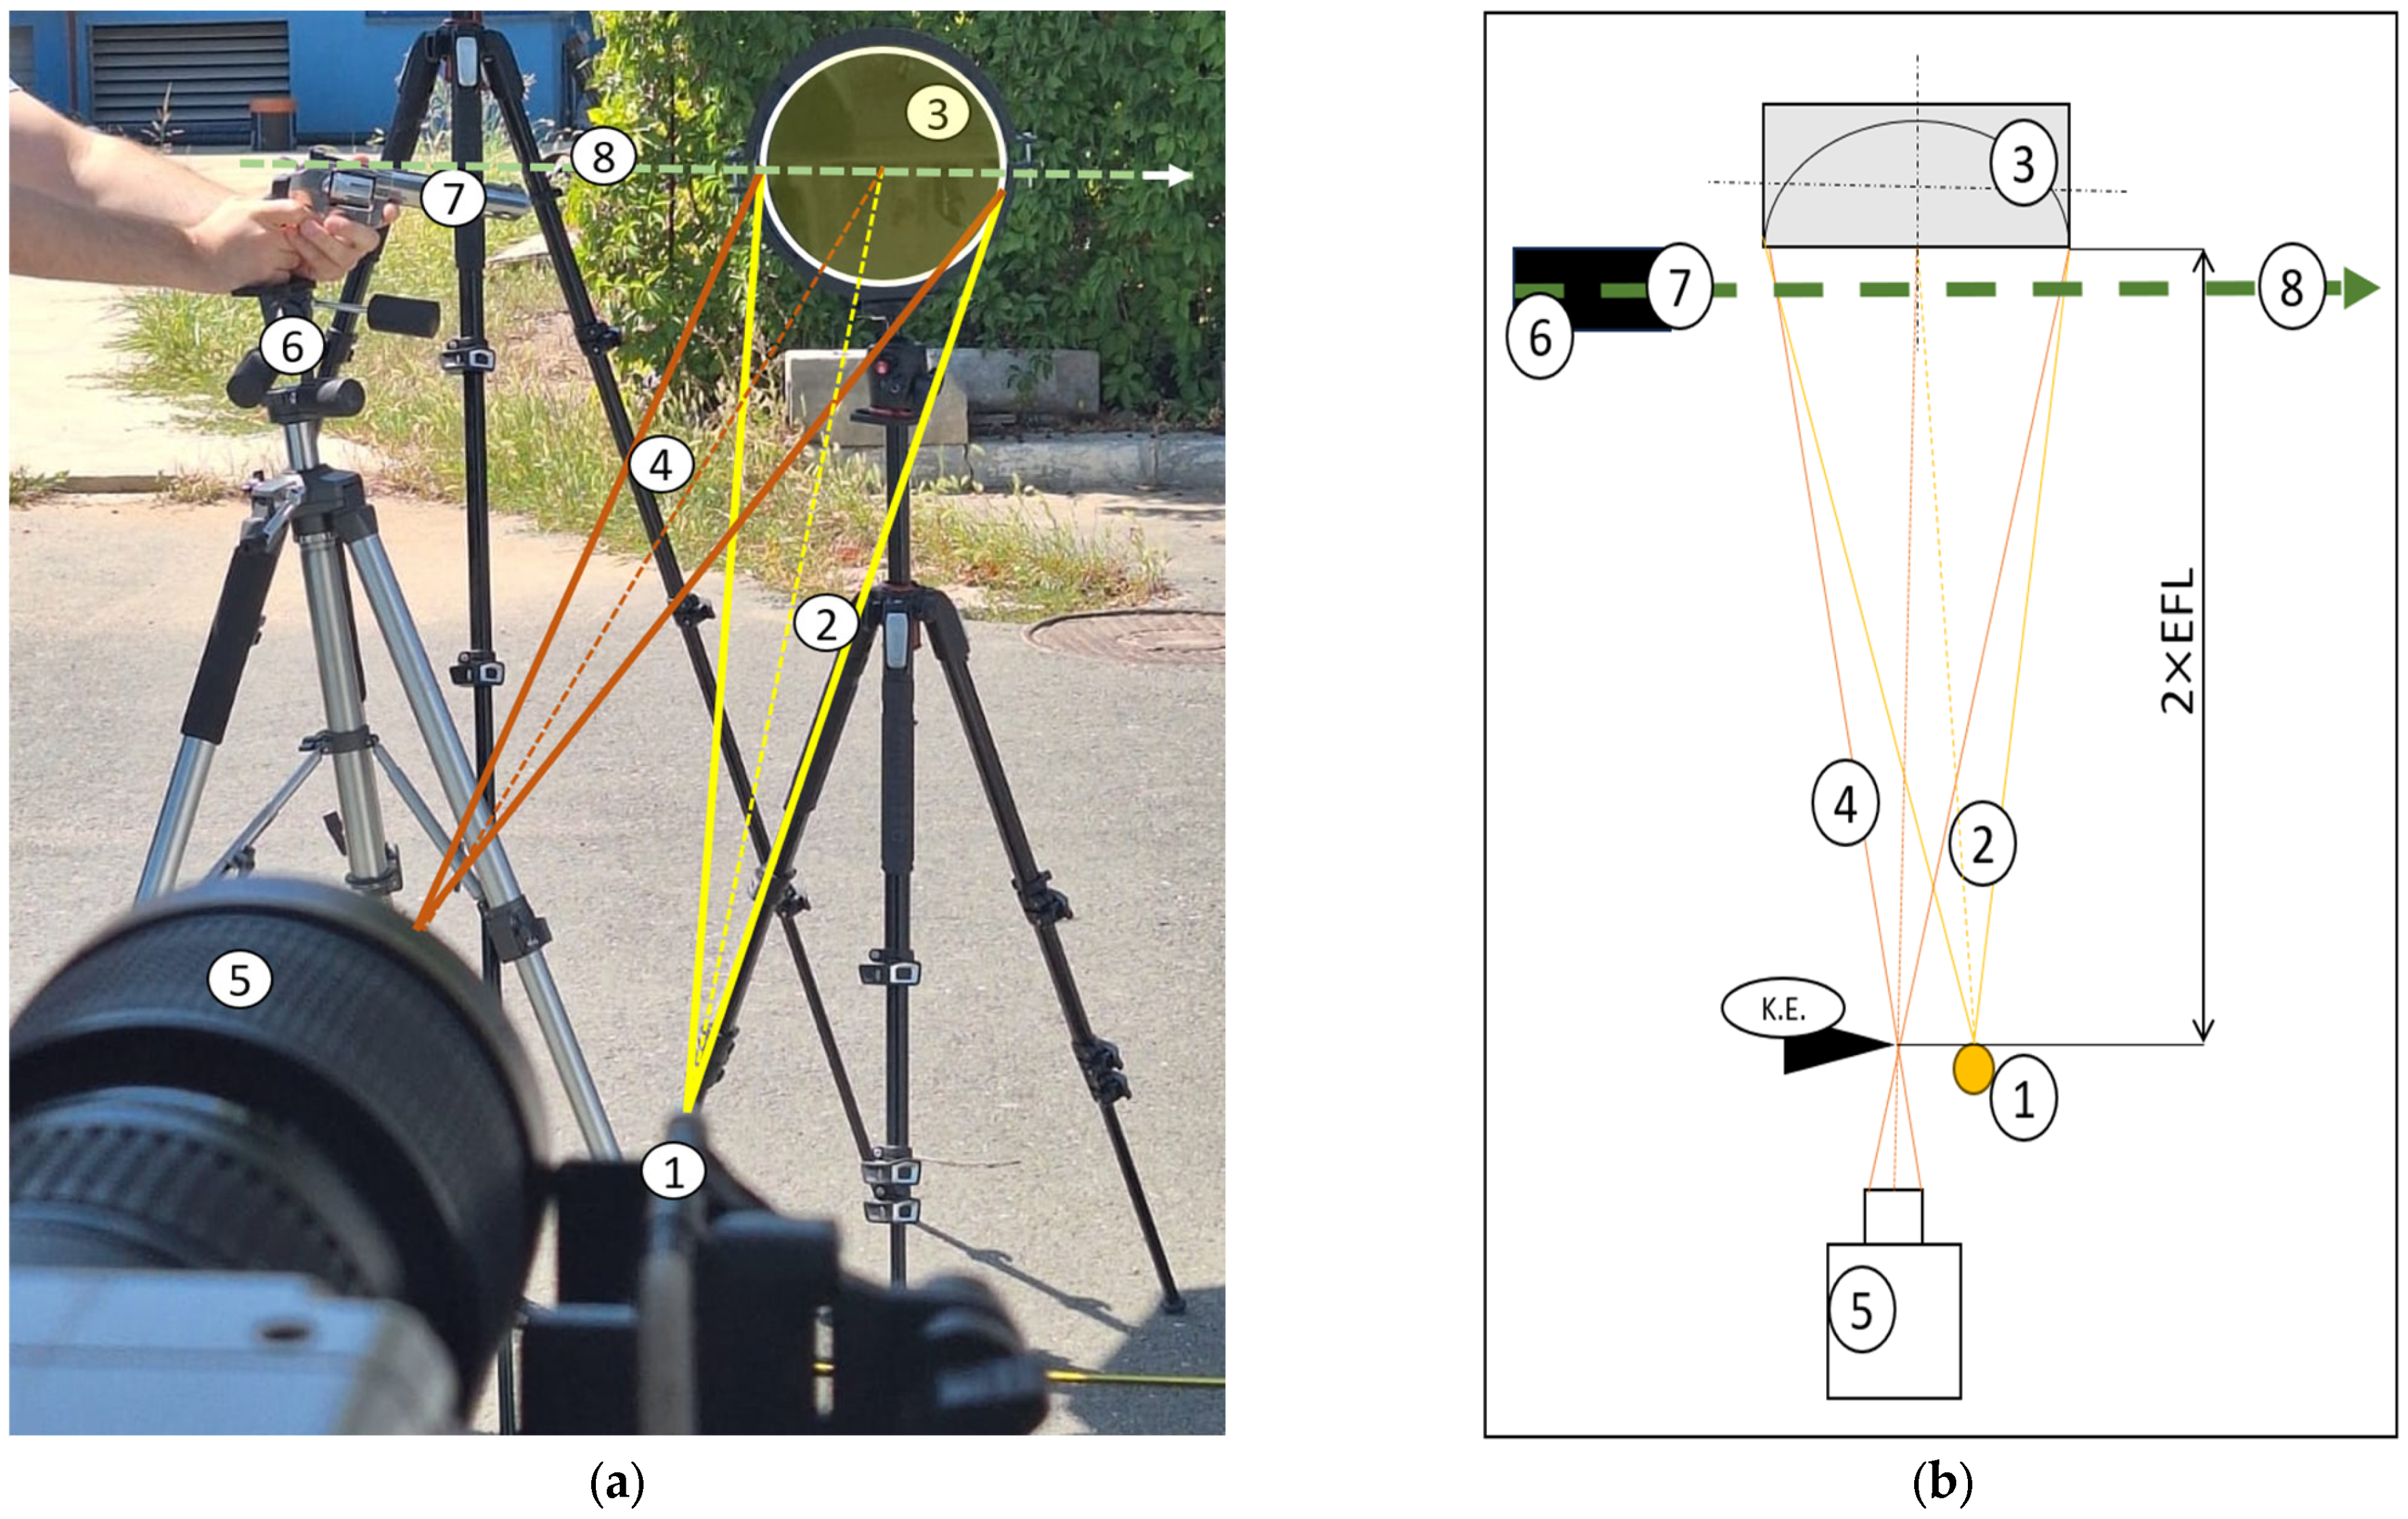
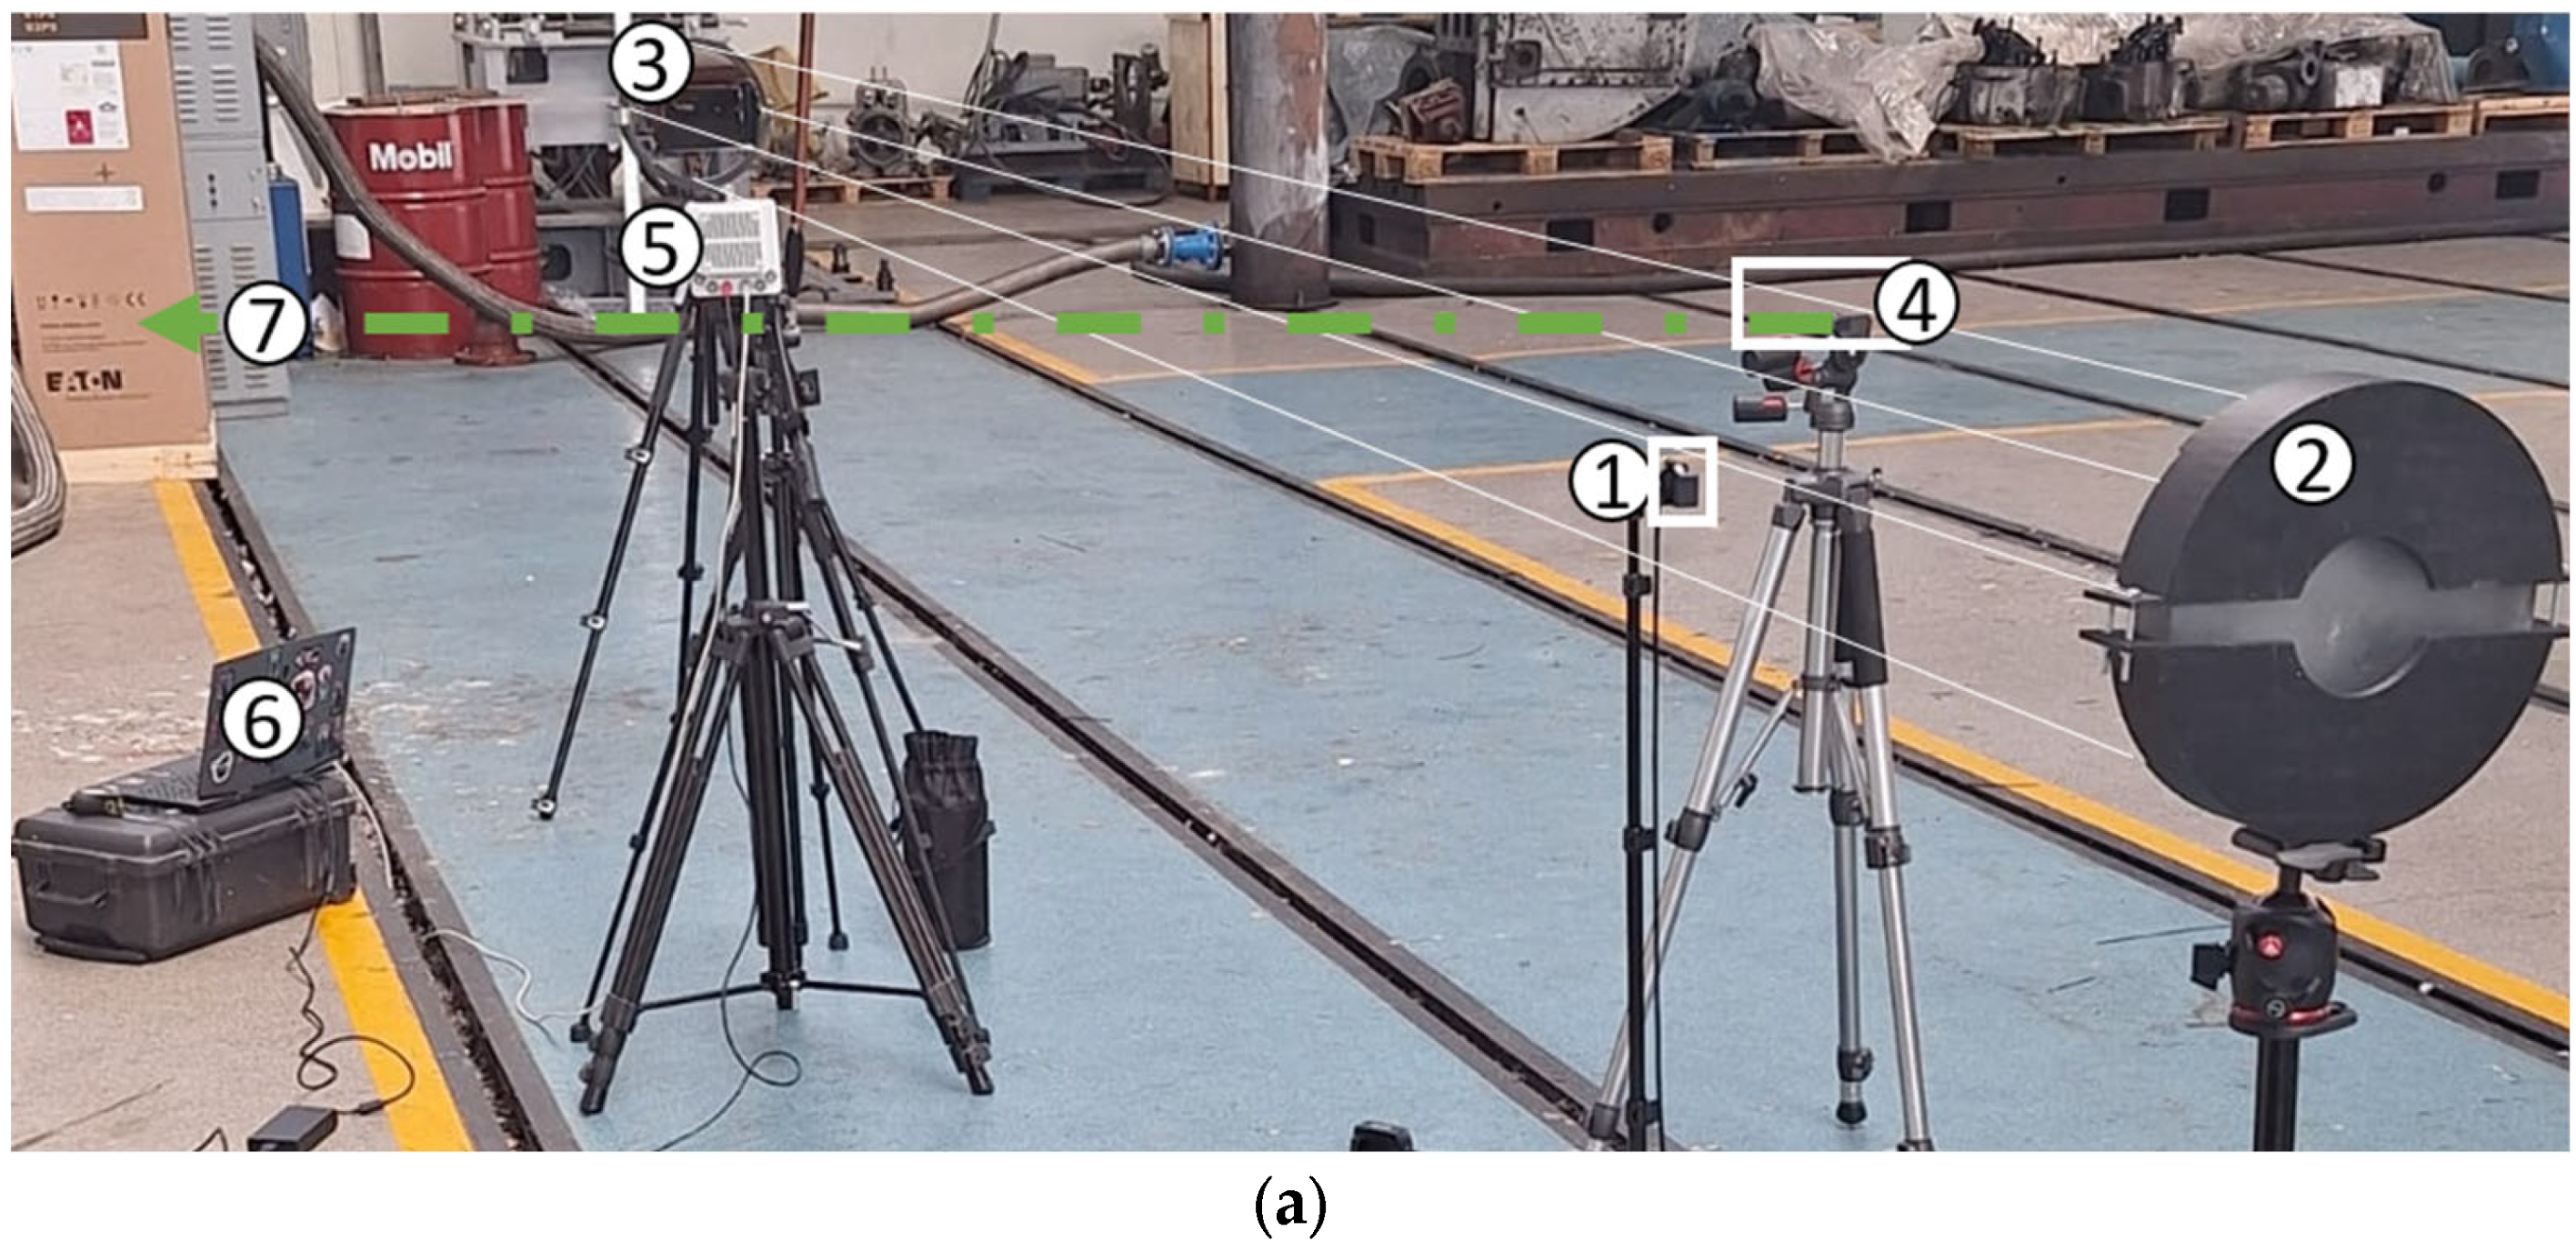
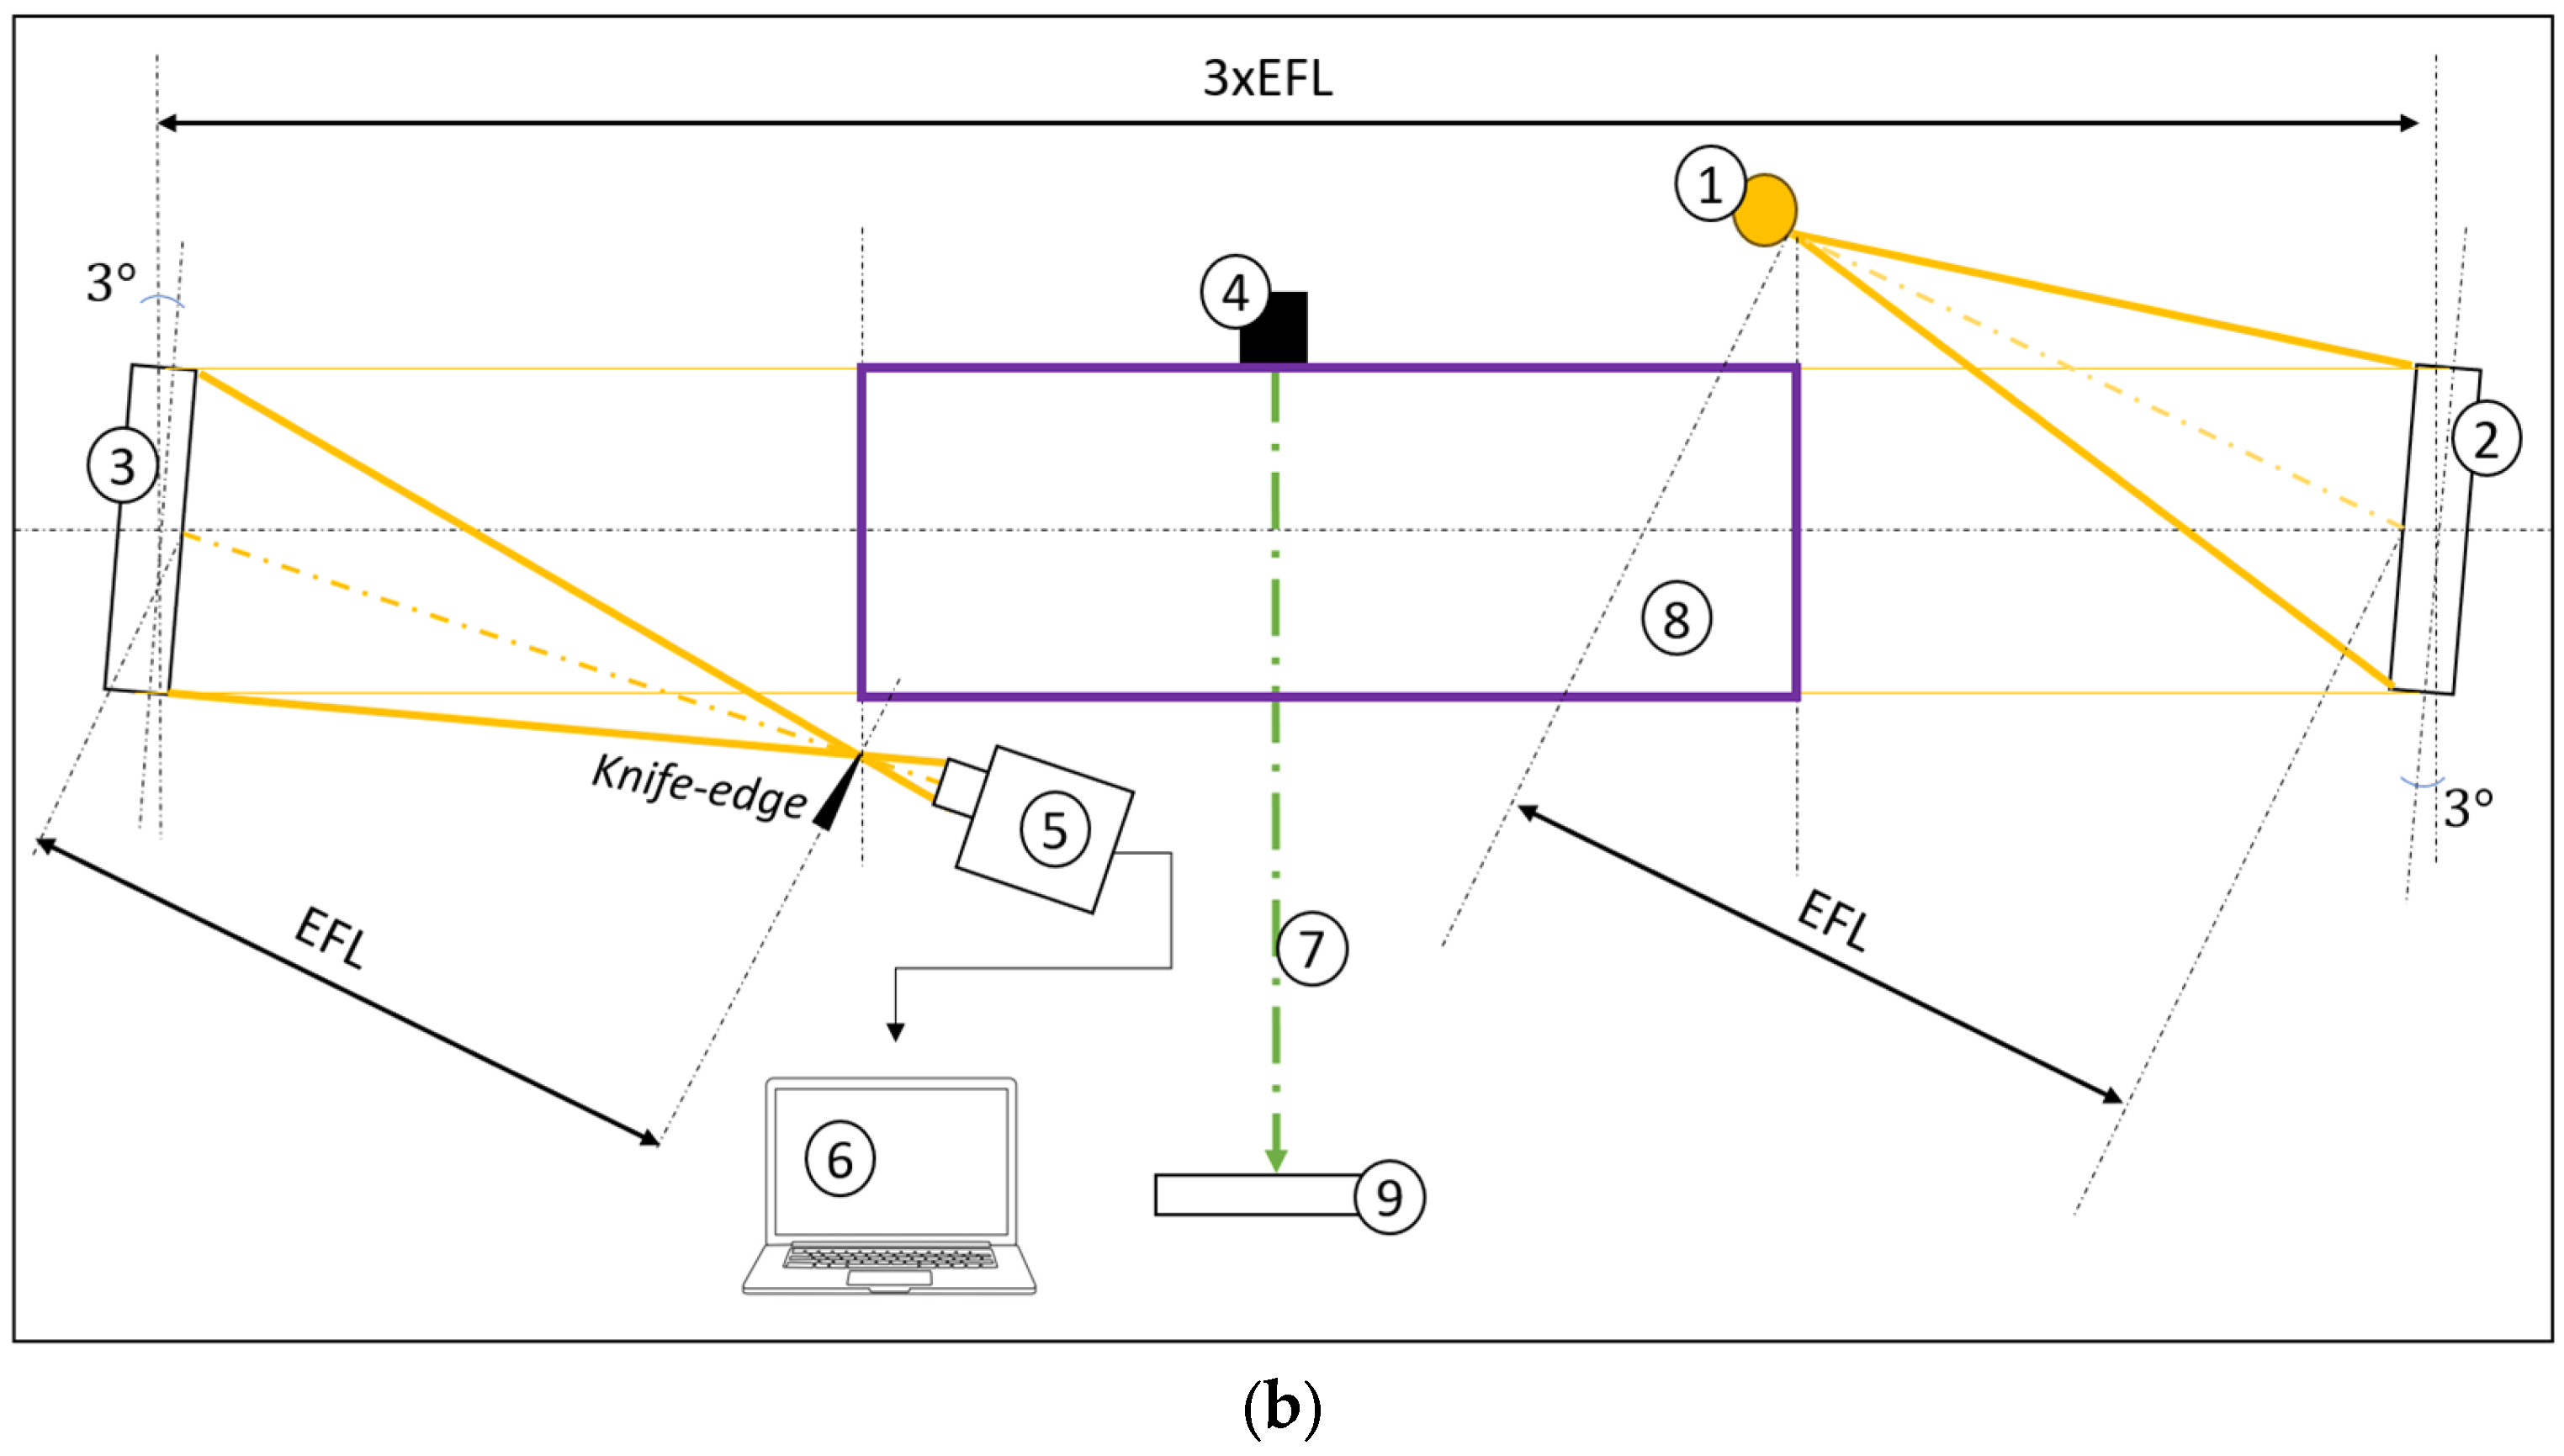
In addition to the schlieren recordings, a series of tests were conducted in a Z-type configuration operated without the knife edge, producing shadowgraph-like images of the early acoustic stage. In this arrangement, the sound pressure wave fronts were only faintly visible, appearing as weak concentric gradients surrounding the muzzle. Although the contrast was significantly lower than in the schlieren images, the onion-layered structure of the propagating waves could still be distinguished.
Figure 6a,b illustrate two representative post-processed frames, selected to exemplify the radial expansion of these fronts despite their reduced visibility. These recordings were conducted at 48,000 fps and a resolution of 512 × 256 confirming that even in a lower-sensitivity configuration, with the appropriate image post processing, the acoustic wave train preceding the muzzle shock can be qualitatively observed and correlated with the schlieren measurements.
Qualitatively, the Z-type configuration with the knife edge proved to be the most effective and sensitive arrangement for visualizing the acoustic wave fronts. In this setup, the pressure waves were captured with the highest contrast and detail, allowing individual fronts to be distinguished more clearly than in the shadowgraph-like configuration. The increased sensitivity provided by the knife edge not only enhanced the visibility of faint concentric rings but also enabled more accurate identification of their structure and propagation. This confirms that the Z-type schlieren with knife edge is the most suited configuration for documenting the early acoustic stage of the discharge.
The detailed analysis of the pressure wavefronts was initially conducted on the single-mirror configuration, since in this arrangement the effective zoom of the optical system made the wavefronts appear larger within the field of view. This scaling facilitated more accurate peak detection and distance measurements. The results obtained were subsequently confirmed by the Z-type schlieren recordings, where a sequence of post-processed frames at 7500 fps with a horizontally placed knife edge set at 50% is shown in
Figure 7.
Together, these observations validate the measurements performed on the single-mirror system while underscoring the superior sensitivity of the Z-type configuration for capturing faint acoustic features.
In conclusion, both the single-mirror and Z-type schlieren configurations yielded consistent quantitative results for the propagation velocity of the sound pressure waves, with measured values closely matching the theoretical sound speed at the experimental temperature. While the single-mirror system offered the advantage of apparent magnification, facilitating the detection of larger wavefronts, its sensitivity to faint structures was limited. By contrast, the Z-type arrangement with a knife edge provided superior contrast and reliability in capturing the acoustic fronts. Therefore, the single-mirror configuration can serve as a practical alternative when spatial constraints prevent the use of a two-mirror system, but the Z-type with knife edge remains the preferred method for high-sensitivity investigations.
3.2. Projectile Kinematics
This section examines the projectile kinematics through trajectory reconstruction, velocity–time analysis, acceleration and energy dissipation, drag model comparison, and error quantification. The analysis is based on images acquired in the no-knife configuration, which facilitated clearer identification and tracking of the projectile within the CO
2 jet. The recorded frames were processed in MATLAB 2020a using custom scripts developed for this study. The workflow included background subtraction, color-based segmentation of the red-marked projectile, centroid extraction, and conversion from pixel to physical units using the known projectile diameter. The resulting coordinates were then used for trajectory reconstruction, velocity calculation, and statistical analysis of vertical deviations. This approach ensured consistent and quantitative tracking of the projectile across the high-speed image sequence presented in
Figure 8.
The trajectory of the projectile was reconstructed by tracking the centroid of the ball, which had been pre-marked in red for robust segmentation, across consecutive frames acquired at 8300 fps in the no-knife configuration. Using the known ball diameter of 5 mm (corresponding to 60 pixels), a magnification factor was determined that allowed conversion of pixel coordinates into physical units. The reconstructed path showed that the motion was predominantly horizontal, with a fitted linear regression indicating a drift angle of –3.44 mrad. The fit quality, expressed by a coefficient of determination of R2 = 0.623, confirmed that the vertical component of motion was minor. Vertical deviations from the median trajectory were quantified, yielding a standard deviation of σ = 0.188 mm; most data points lay within the ±1σ interval, suggesting that fluctuations were small and most likely caused by local turbulence in the CO2 jet or tracking uncertainty.
The velocity of the projectile was obtained by measuring centroid displacements between successive frames and applying the same pixel-to-millimeter calibration. Instantaneous speed values ranged between 66 and 77 m/s, reflecting a combination of experimental uncertainty and local disturbances induced by the surrounding jet. A linear regression fit through the velocity data revealed a slight negative slope, consistent with gradual deceleration during the recorded interval. The mean velocity derived from this analysis was approximately 71 m/s, which is considered representative of the projectile’s initial speed in the test section.
The projectile speed, obtained from frame-to-frame centroid displacements (5 mm ↔ 60 px; 8300 fps), varies between 66–77 m/s over the analyzed interval. A linear fit to v (t) indicates a nearly constant regime with a representative mean speed of ≈71 m/s, which was adopted as the characteristic velocity in the test section.
The dominant uncertainties arise from centroid localization and scale calibration. With a centroid jitter of ±1–2 px and Δt = 1/8300 s, the per-frame velocity error is ±(0.7–1.4) m/s (since 1 px ⇒ 0.0833 mm 0.0000833 m/Δt ≈ 0.69 m/s). A ±1 px uncertainty on the 60 px diameter implies a scale error of ≈1.7% (≈±1.2 m/s at 71 m/s). Combining in quadrature gives a conservative ±1.6 m/s band. The value reported is, therefore, v = 71.0 ± 1.6 m/s.
This value is consistent with typical muzzle speeds for airsoft projectiles of comparable mass/diameter (≈60–90 m/s), supporting the validity of the optical tracking and calibration [
30].
The small oscillations in the instantaneous speeds primarily reflect image noise (sub-pixel centroid jitter), local refractive-index turbulence in the CO2 jet, and minor segmentation variability, rather than true ballistic oscillations.
The acceleration of the projectile was derived directly from the time-resolved velocity data obtained through image tracking. Once the projectile centroid was identified in each frame, the horizontal displacement was converted to physical units using the known magnification factor, and the velocity was calculated as the frame-to-frame displacement divided by the frame interval Δt = 1/8300 s. The instantaneous acceleration was then obtained by applying a finite-difference method to the velocity sequence, . This per-frame approach yields a pointwise estimate of the acceleration, although it is sensitive to experimental noise. To obtain a more robust value, a linear regression was also applied to the velocity–time data, with the slope of the regression line representing the average acceleration over the recorded interval. The fit indicates a mean deceleration of approximately −3.5 × 10² m/s2, consistent with aerodynamic drag acting on the projectile immediately after leaving the barrel.
The kinetic energy of the projectile was estimated from its measured velocity using , knowing the mass of the 5 mm polymer ball was known to be 0.3 g. At the representative velocity of 71 m/s, the corresponding kinetic energy is approximately 0.76 J, whereas at a residual speed of 1 m/s it reduces to only 0.00015 J. This implies that nearly the entire initial energy (ΔE ≈ 0.76 J) is dissipated during deceleration, predominantly through aerodynamic drag and interaction with the surrounding CO2 jet. These results demonstrate that the energy balance can be quantitatively assessed from the image-derived kinematic data.
To assess whether the measured velocity trend is consistent with aerodynamic drag, a quadratic drag model was applied. The governing equation of motion is expressed in Equation (6).
where
is the air density,
is the drag coefficient, A is the cross-sectional area and m is the projectile mass. For a 5 mm polymer ball of mass m = 0.3 g, the frontal area is
with radius r = 2.5 mm. Taking an air density of
(corresponding to ambient temperature of 41 °C) and a typical drag coefficient for a sphere at Reynolds numbers
,
, gives
. At the measured initial velocity of
, the corresponding drag force is 0.026 N, as calculated in Equation (7).
Which yields an instantaneous deceleration of .
The analytical solution of the drag law is presented in Equation (7).
Equation (7) defines characteristic scales of and . These indicate that the velocity decreases by a factor of e only after ~0.8 s of flight or ~58 m of travel. Whitin the short imaging window of 1.8 ms, the model therefore predicts a negligible velocity loss of , well below the experimental uncertainty (.
The velocity decay of the projectile was analyzed using the quadratic drag law v(x) = v0e−kx, where the drag coefficient k depends on projectile geometry, mass, and air density. Two scenarios were compared. In the first, a theoretical clean-air drag coefficient of k = 0.017 m−1 predicted only a gradual reduction in velocity, with the projectile retaining most of its speed over the first few tens of centimeters. In the second case, an effective coefficient of k = 1.40 m−1 was calculated directly from experimental measurements, where the speed decreased from 71 m/s at the muzzle to 50 m/s within 0.25 m of travel. This much larger effective coefficient reflects the influence of the expanding CO2 jet and near-muzzle turbulence, which significantly enhanced energy dissipation compared to clean-air conditions. The analysis thus demonstrates that projectile slowdown in this system cannot be described by free-flight aerodynamics alone, and instead requires consideration of muzzle flow interactions to provide realistic predictions.
The observed fluctuations in the frame-to-frame velocities are thus attributed to image processing noise and refractive-index disturbances in the CO2 jet rather than genuine ballistic deceleration. Overall, the comparison demonstrates that the measured projectile speeds are consistent with the aerodynamic drag model and validates the use of the image-based tracking method for near-field kinematic analysis.
It is further noted that a thin trace appears to adhere to the rear of the projectile as it exits the muzzle, as presented in
Figure 9. This feature is most likely associated with the turbulent wake forming immediately behind the ball, but its visibility in schlieren may be enhanced by the temperature difference between the ball cooled by the CO
2 jet and the warmer ambient air. While not the primary focus of this study, this observation highlights the combined aerodynamic and thermal effects present in the flow field.
3.3. Muzzle Shocks—Structure Analysis
The schlieren image sequence captured in no-knife configuration (
Figure 2) begins with the appearance of the acoustic pressure waves, emitted as concentric fronts from the sudden release of compressed gas inside the barrel. These pressure waves constitute the first visible structure in the flow and mark the onset of the firing process. Immediately after the passage of the acoustic waves, the initial underexpanded jet begins to issue from the muzzle as a compact, dense core with sharp gradients at its boundary, as presented in
Figure 10, in which it can be observed that it is preceded by the acoustic waves. The analysis conducted below is performed on a recording of the phenomena with the next settings: a full resolution of 120 × 800, a recording speed of 8300 fps, the exposure time used was 3 microseconds and the camera had a 12-bit depth.
In the first instants it appears as a short, bright discharge, but as it propagates outward it rapidly destabilizes and evolves into a sinuous dark line, the schlieren signature of shear-layer instabilities and vortex shedding, presented in
Figure 10. This organized jet structure is subsequently disrupted by a new train of pressure waves that propagate outward, breaking up the wavy pattern, as presented in the sequence from
Figure 11.
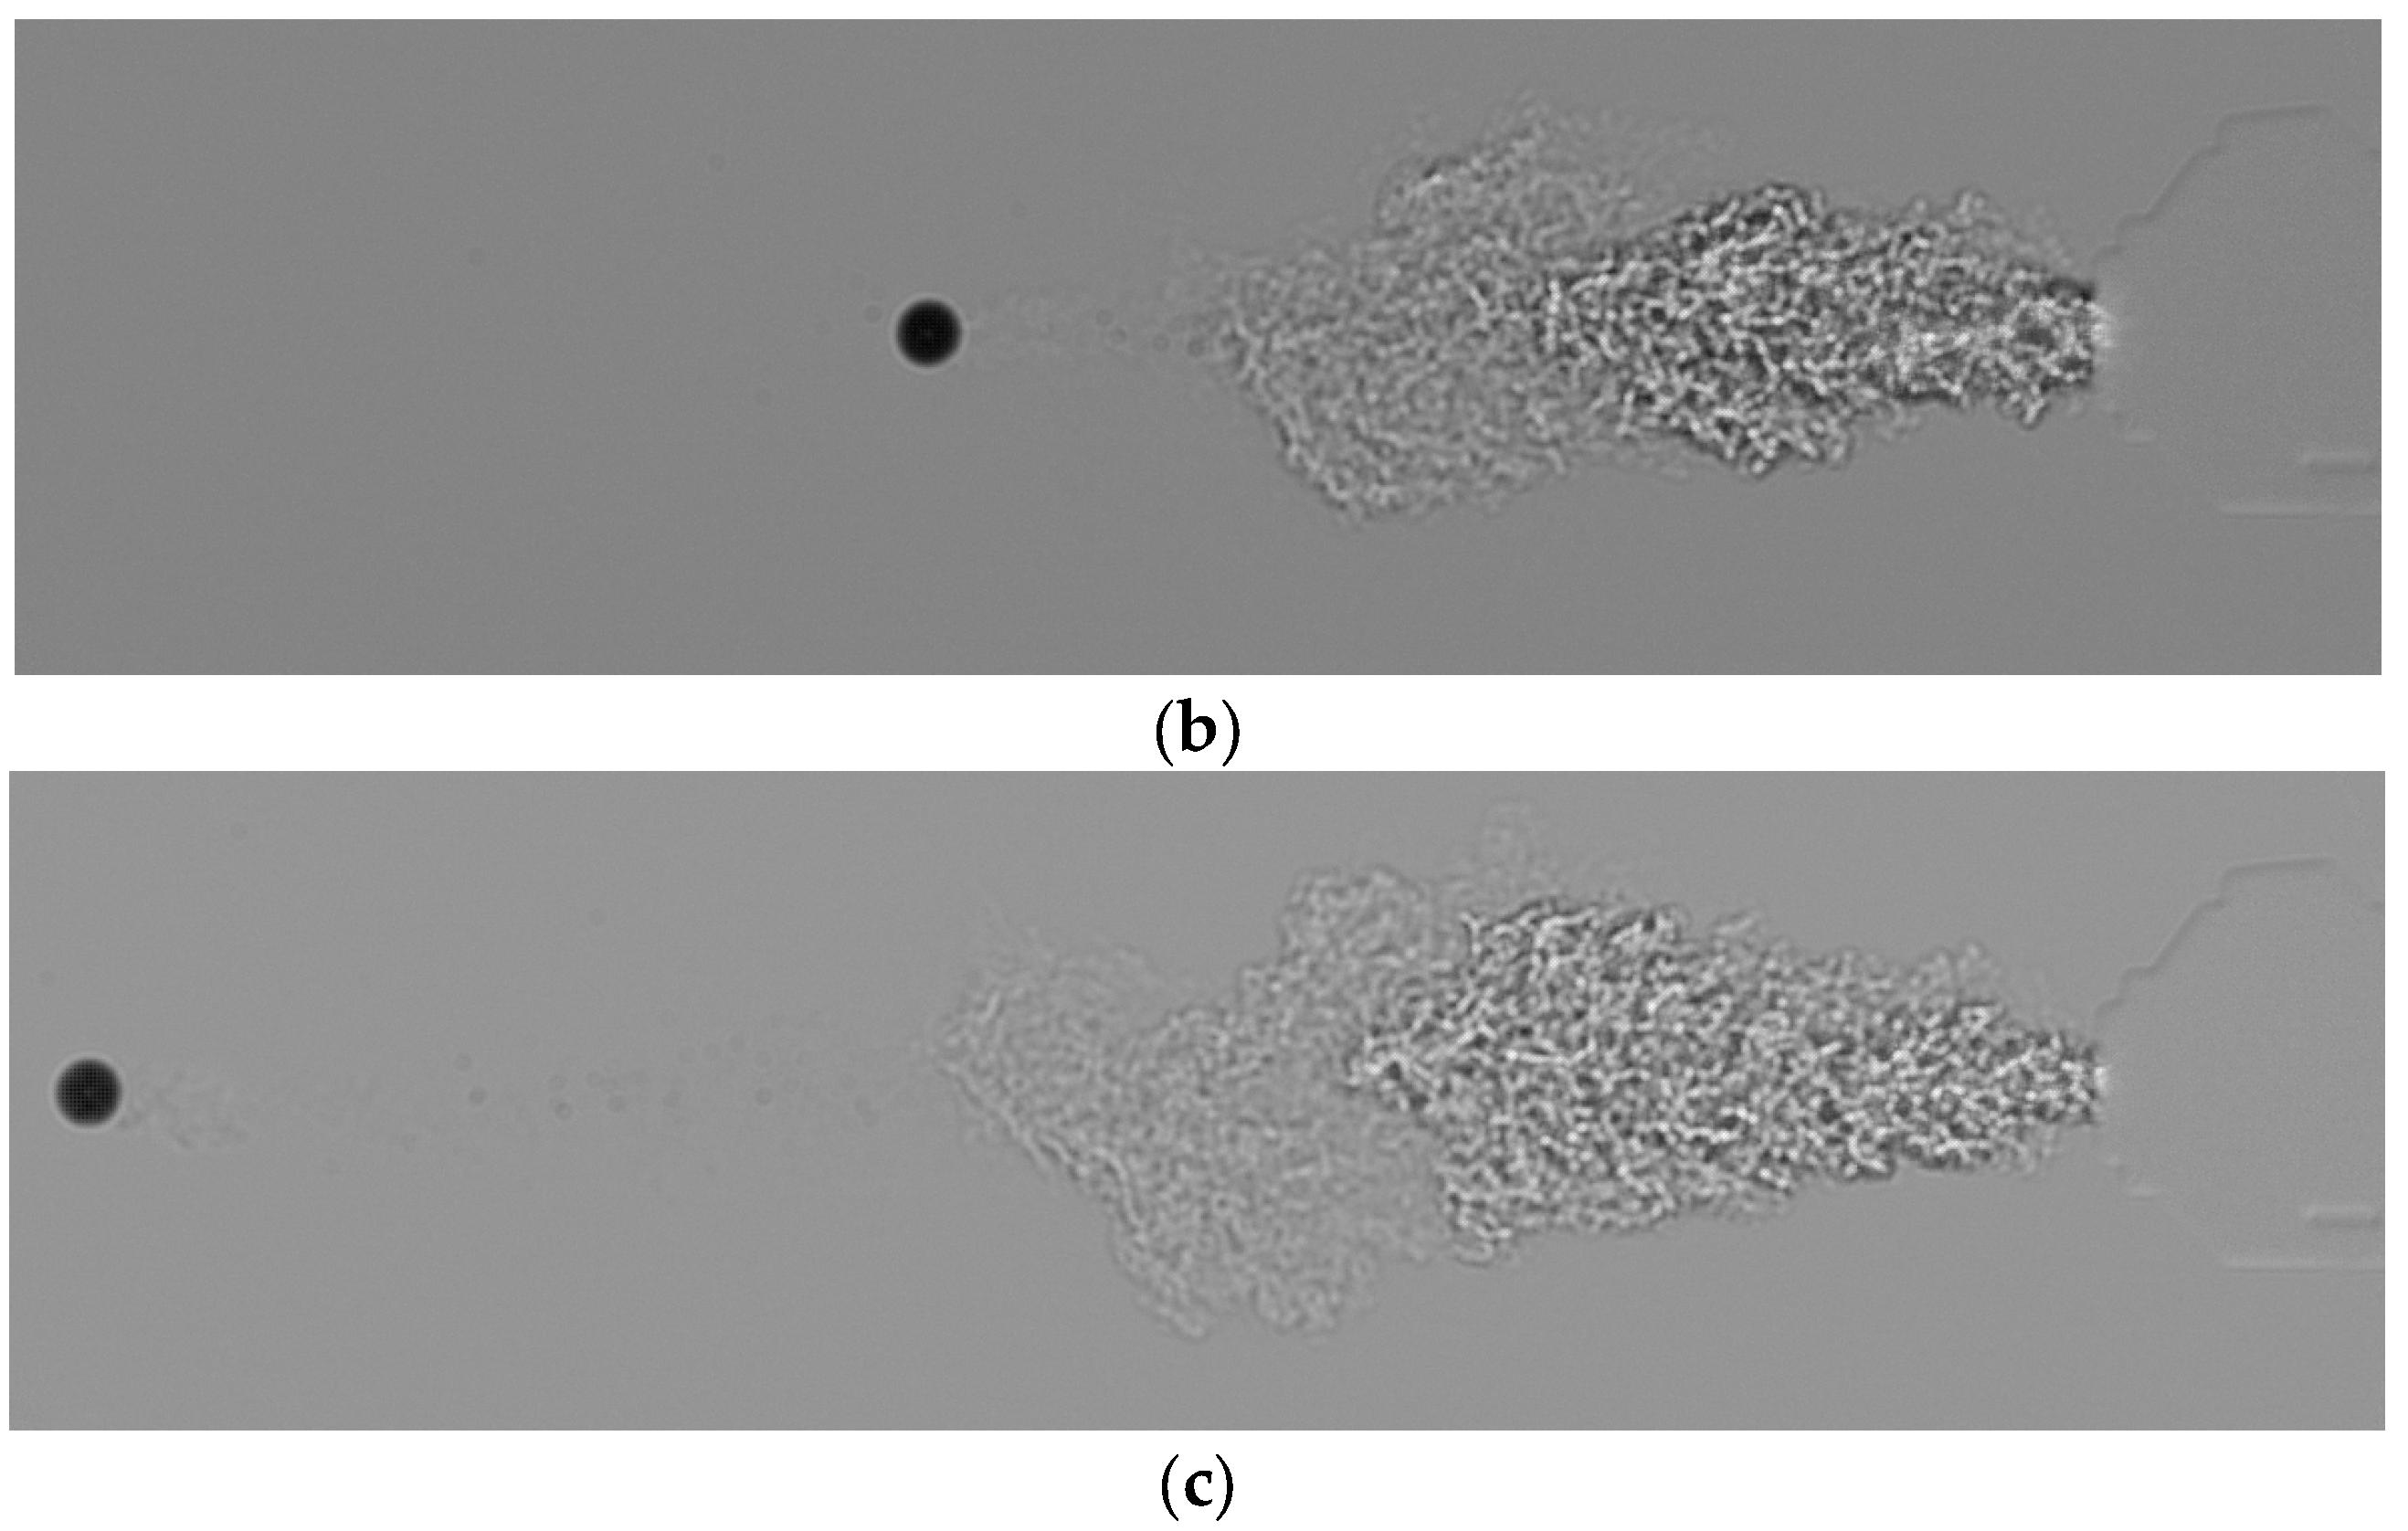
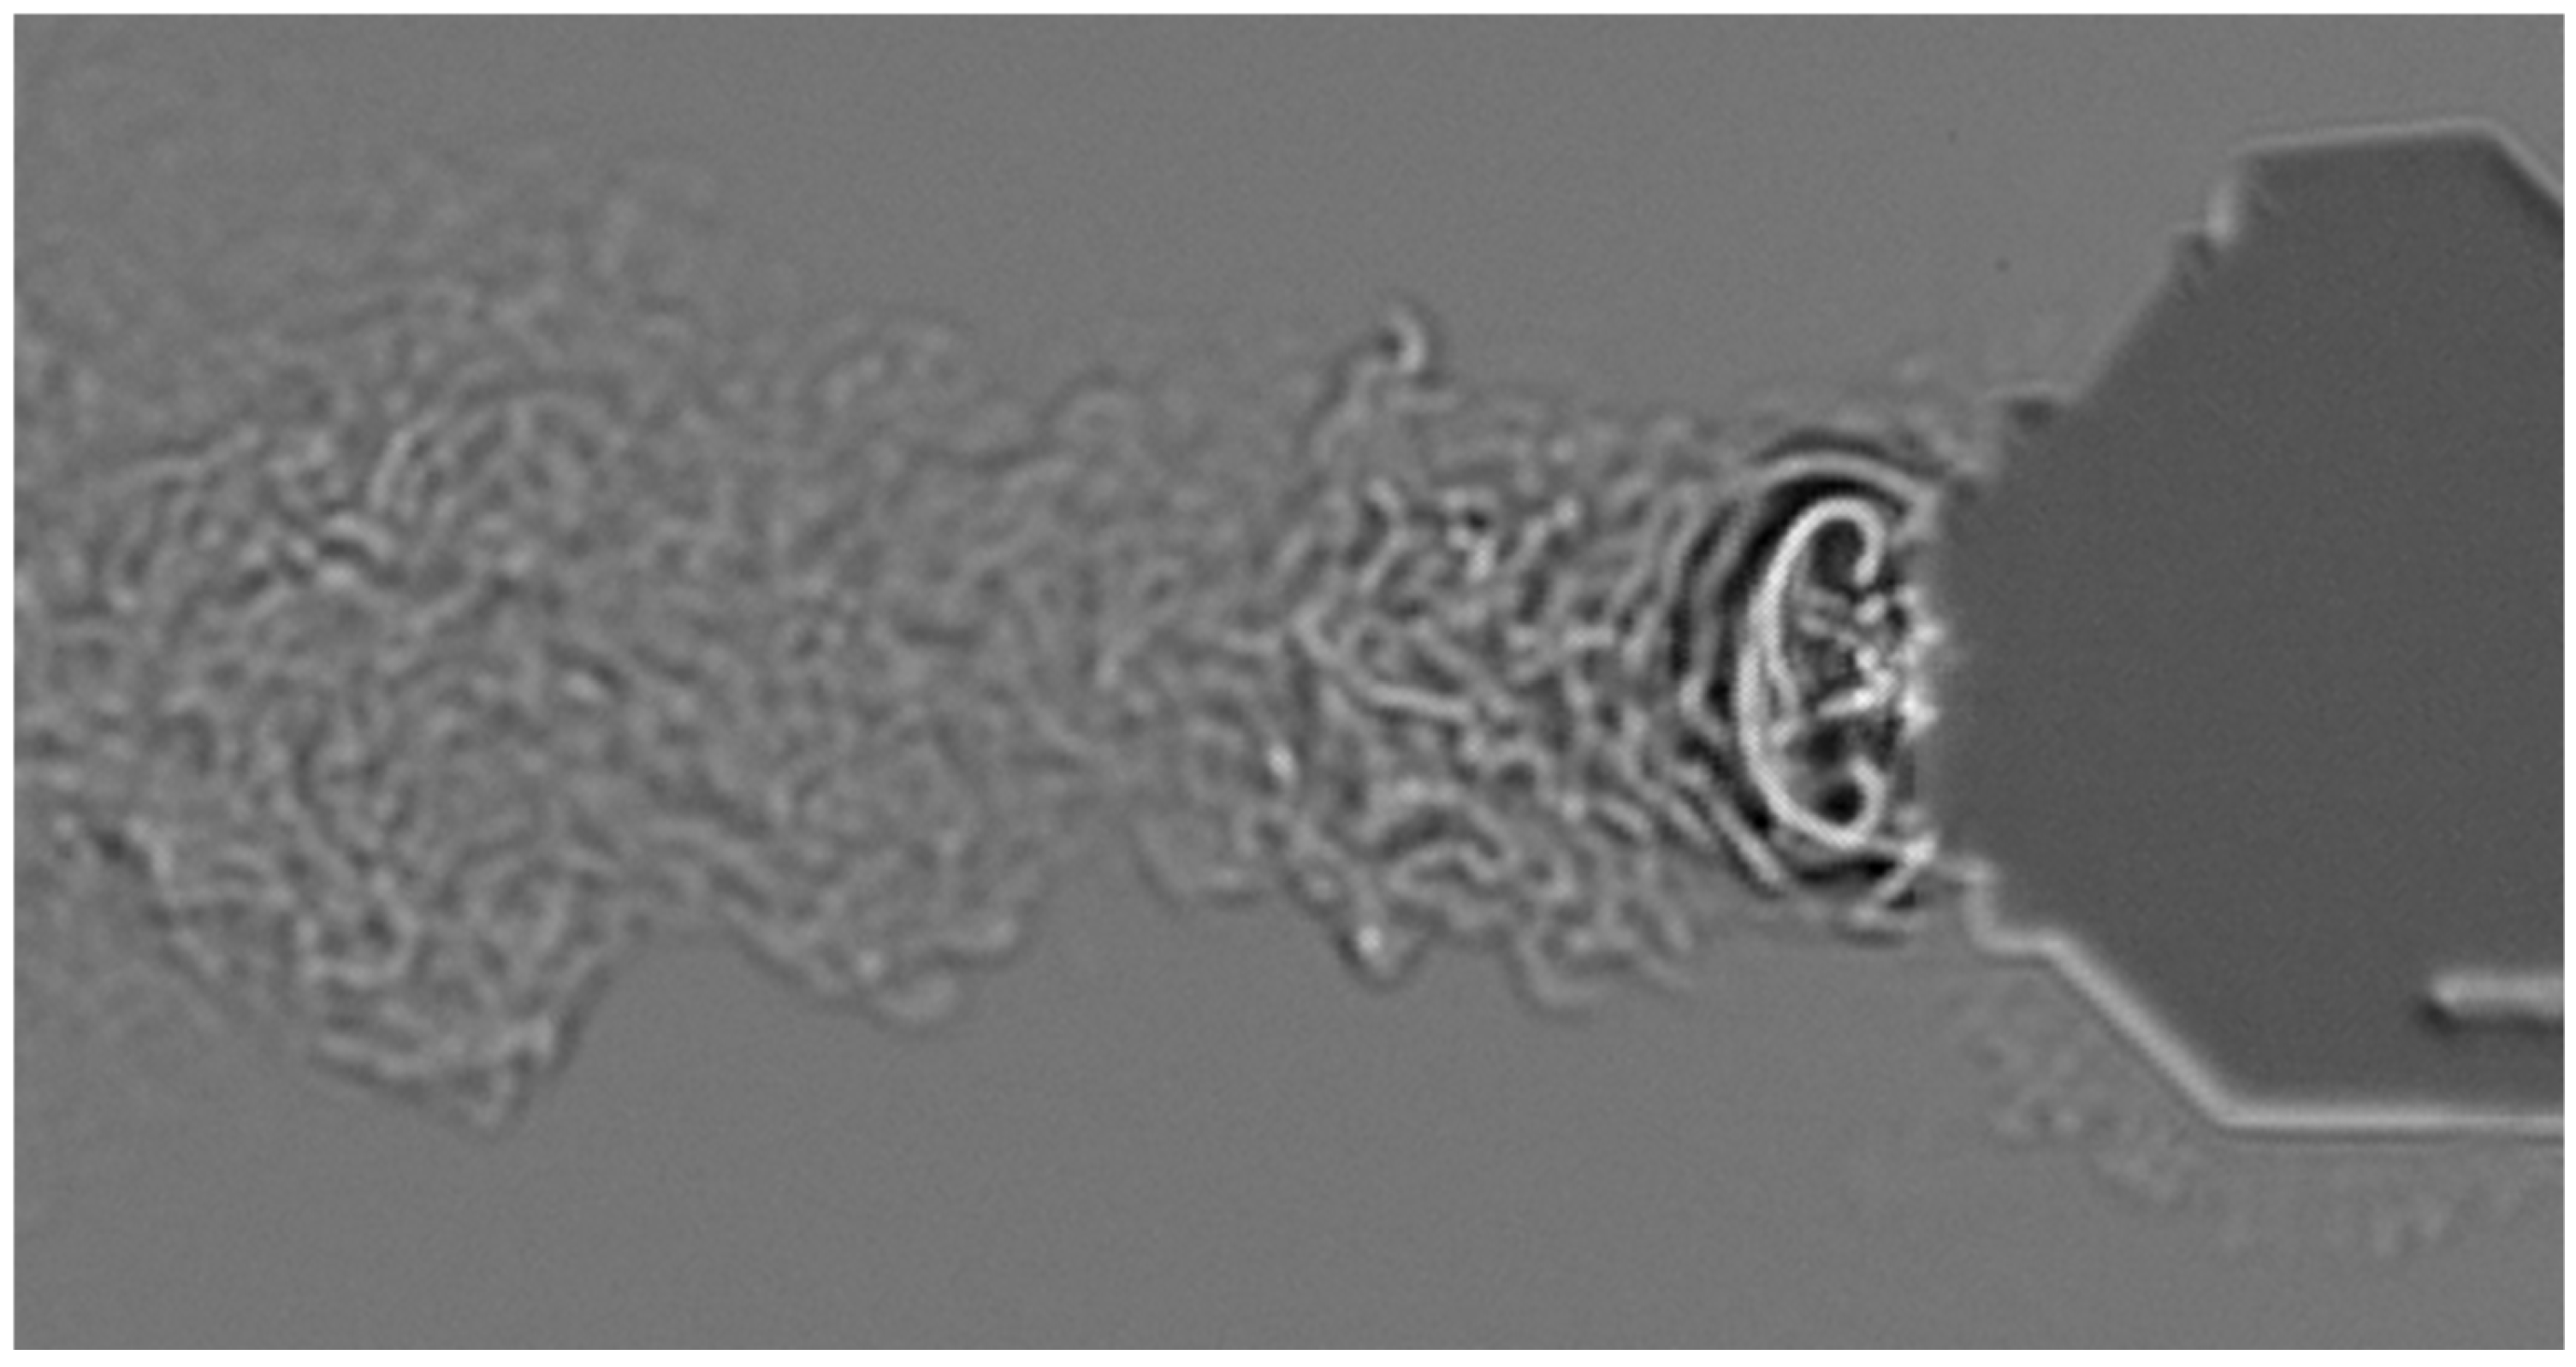
Following this disruption, a fresh discharge of gas issues from the barrel in the form of a mushroom-shaped jet, very similar to the first one, generated by the roll-up of a leading vortex ring that entrains surrounding air. This vortex-ring structure grows and expands ahead of the muzzle and occurs just before the ball exits the barrel, linking the gaseous blast with the projectile motion. This impinging jet sequence is depicted in
Figure 12.
Once the ball clears the muzzle, as shown in
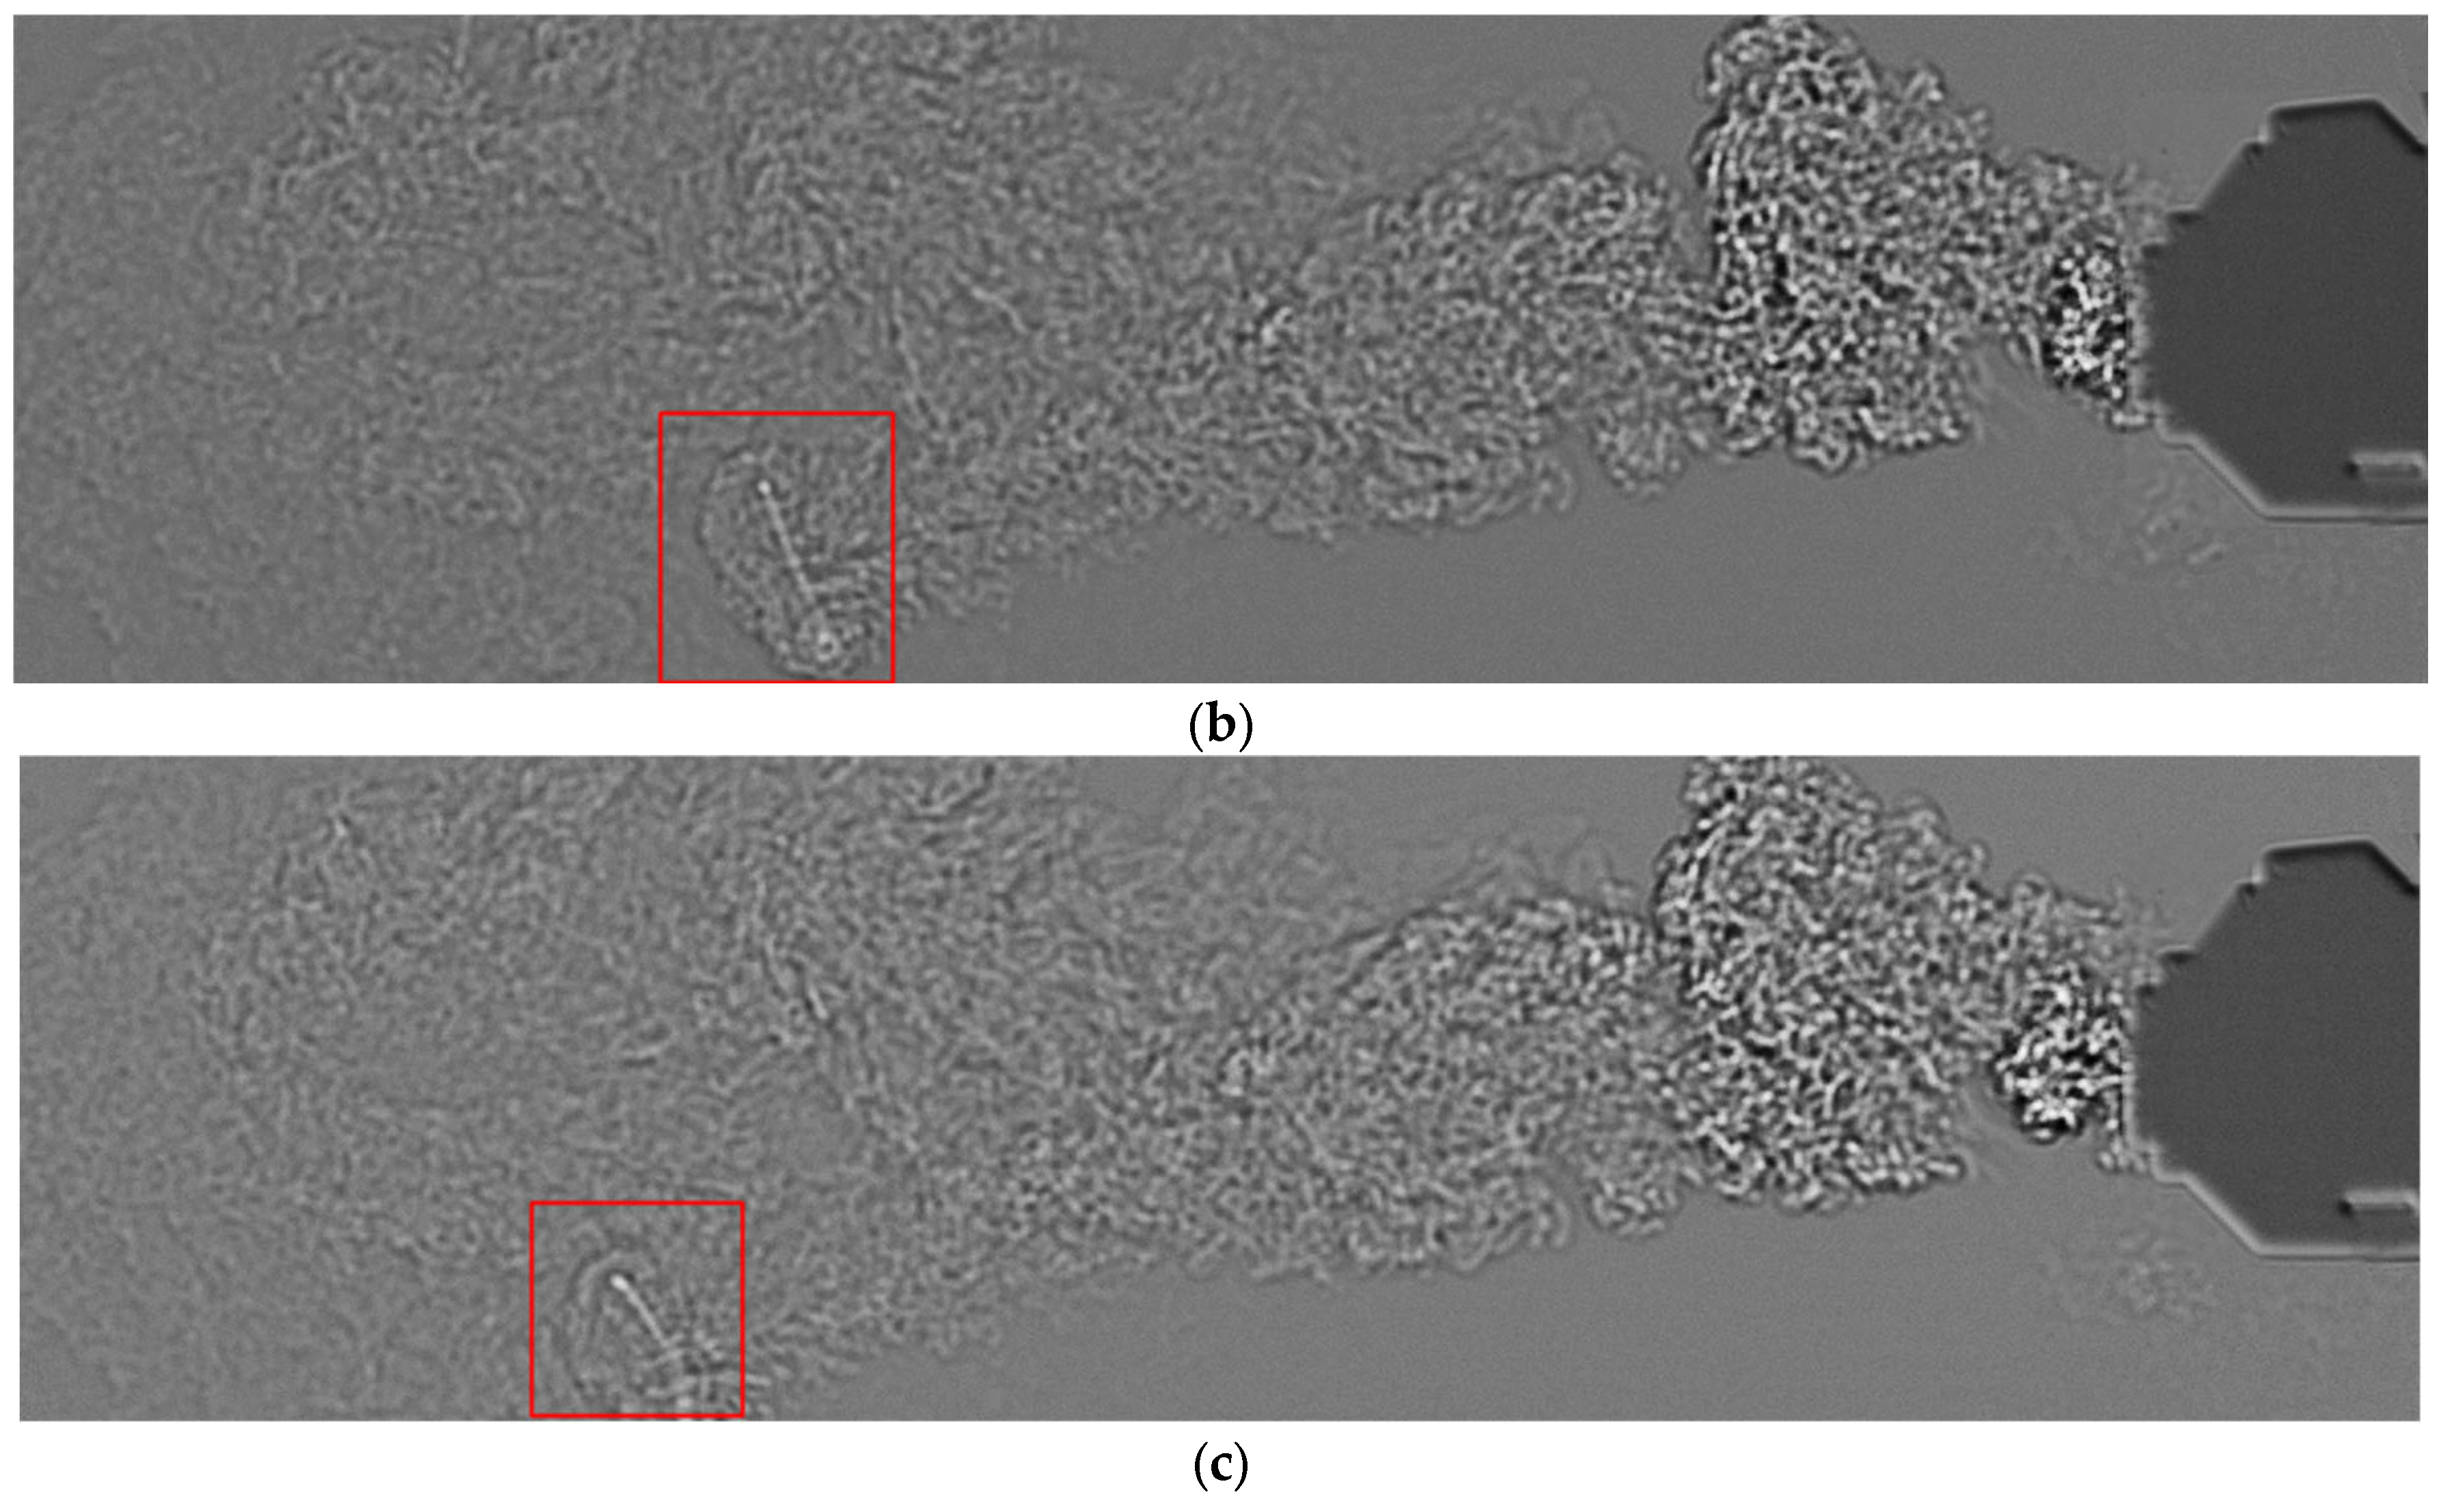
Figure 9, the remaining gas vents as a secondary underexpanded jet, weaker than the first but still visible in schlieren. During the brief interval before this jet emerges, the surrounding air appears to be drawn back toward the barrel, an effect caused by the low-pressure region left in the wake of the primary blast and by entrainment of ambient fluid into the expanding flow. Like the initial discharge, this residual jet depicted in
Figure 13 also develops a wavy structure whose propagation in the schlieren test area is presented in the sequence from
Figure 14, though here the schlieren cutoff renders it as a white sinuous line, corresponding to the opposite orientation of density gradients.
Taken together, the images document the complete firing sequence: initial pressure-wave emission, jet formation and instability, disruption by subsequent waves, development of another vortex-ring mushroom jet linked to projectile emergence, projectile emergence, the inward draw of the surrounding air, and finally the expulsion of the secondary underexpanded jet.
3.4. CO2 Jet Characteristics—SIV Analysis
A schlieren image velocimetry (SIV) analysis was carried out on the ball–impinging jet using PIVlab 2.63 [
31]. For consistency, the enhanced schlieren images were employed, following the same post-processing routine as described for the sequence in
Figure 12. The images used in this study were recorded in the same firing conditions as the ones presented before, meaning they were acquired from the first shot fired with a new CO
2 capsule. The frames were recorded at a speed of 72,000 fps. A parallel analysis was conducted on a 200,000 fps but rendered a wide range of spurious vectors due to the low resolution allowed by the camera at this recording speed (128
128 px).
A three-step FFT cross-correlation scheme was applied with interrogation window sizes of 32 × 16, 16 × 8, and 8 × 4 pixels, in line with the PIV requirement of maintaining at least three pixels per tracer element. In this case, the smallest turbulent eddies visible in the schlieren field acted as flow tracers. Owing to the strongly turbulent character of the jet, the resulting velocity vectors reproduced its evolving structure with good fidelity. The jet impinged on the ball before the projectile was released, as the gas escaped earlier from the muzzle. However, since the projectile carried significantly higher momentum and the jet rapidly dissipated energy through vortex formation, the projectile surpassed the jet within only a few microseconds, according to the frames presented in
Figure 8.
Several considerations were implemented to ensure robustness of the analysis: the region of interest (ROI) was restricted to the main jet in order to reduce computational demands; the projectile was masked to prevent spurious vectors, although the surrounding flow was still captured and included in the results.
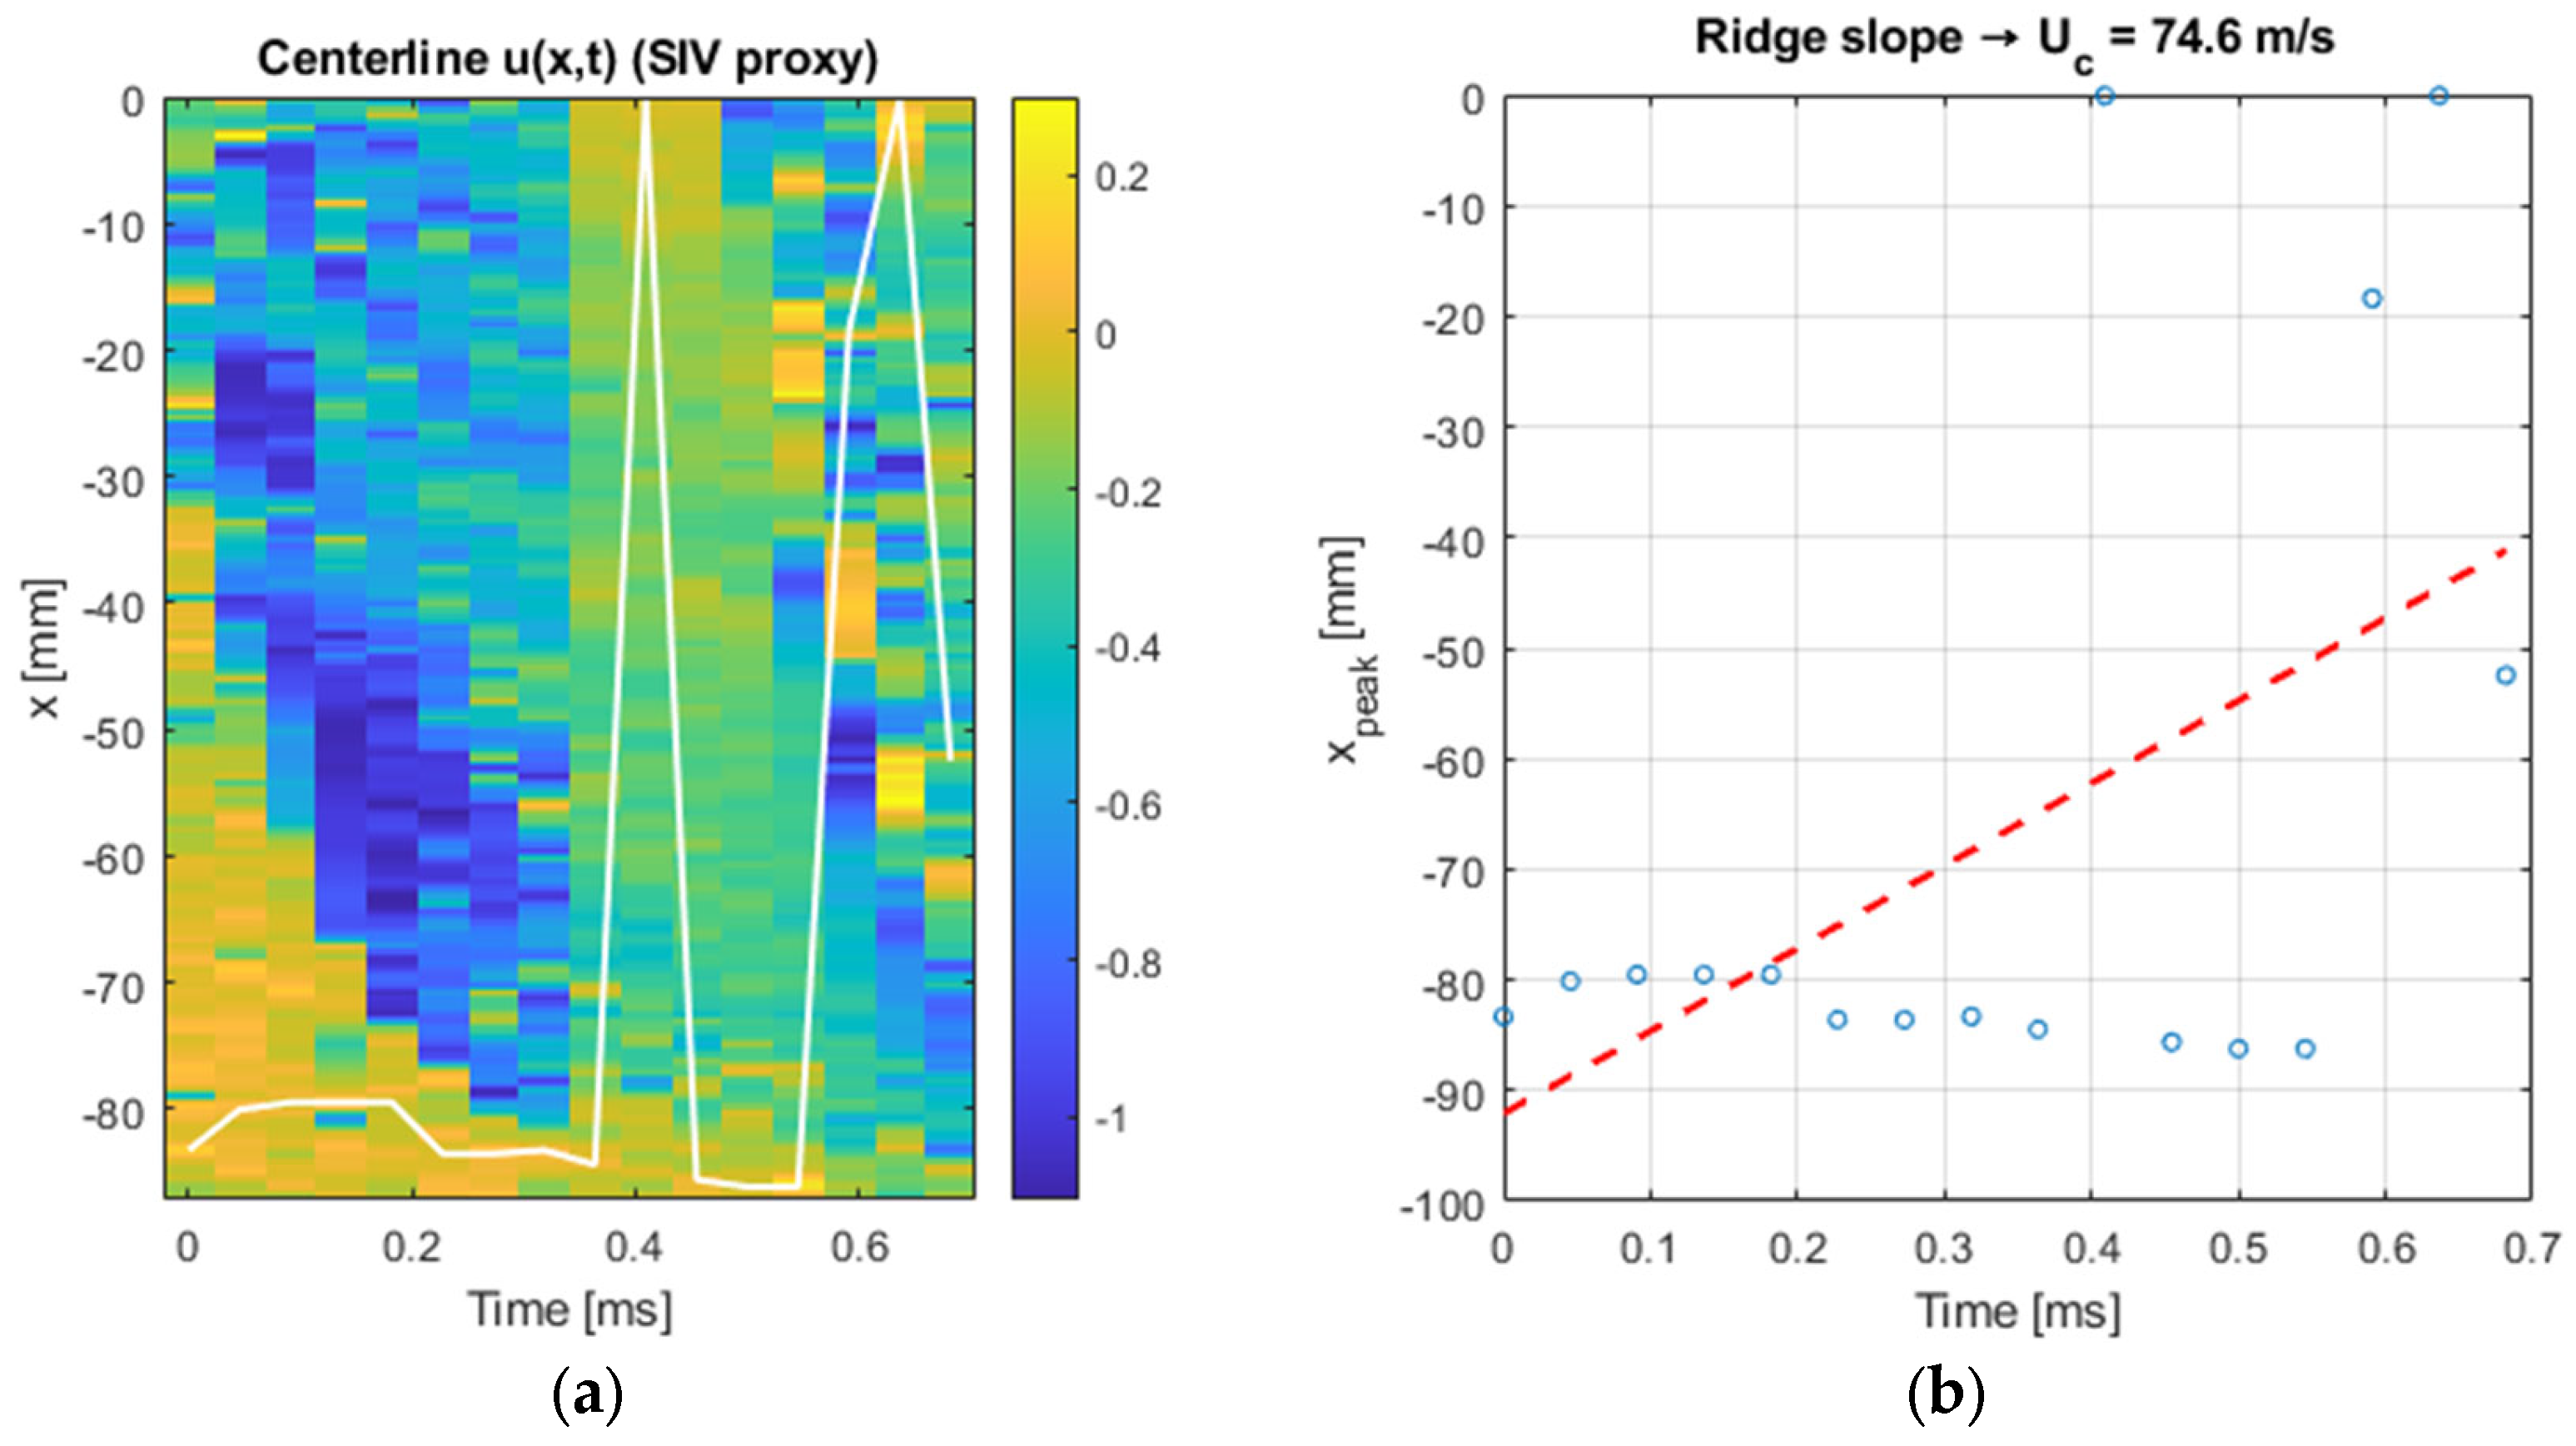
The centerline analysis yielded the spatio-temporal distribution of the streamwise velocity, from which a ridge-extraction method identified the dominant propagation of coherent structures. Linear regression of this ridge provided a convection velocity of approximately Uc = 74.6 m/s as seen in
Figure 15. This value is particularly relevant, as it falls close to the projectile’s mean velocity and highlights that the jet structures are initially convected at nearly the same order of magnitude as the ball. The convection speed reflects the transport of large-scale eddies and shear-layer instabilities rather than the instantaneous peak velocity of the gas, and therefore provides a robust metric for comparing jet–projectile interaction dynamics. At later times, the ridge deviates from linearity due to rapid turbulent breakdown, leading to a reduction in correlation strength and increased scatter. Nonetheless, the early-time estimate of U
c confirms that the gas jet initially trails the projectile with only a small velocity deficit, before dissipating energy through mixing and vortex formation. For the convection speed analysis, frames covering the projectile passage and a short interval thereafter were selected. In this range, coherent shear-layer structures are still visible and correlation peaks remain stable, allowing a reliable ridge slope to be extracted. At later times, the jet becomes highly fragmented, and the loss of structure coherence leads to unreliable convection speed estimates.
These results demonstrate that, although SIV is path-averaged, it provides a reliable characterization of convection speed and its role in the early phases of muzzle jet evolution. A list of the specific post-processing settings is provided in
Table 2.
The convection velocity extracted from the centerline SIV analysis (Uc = 74.6 m/s) is of the same order as the projectile velocity determined independently from image tracking (70 m/s). This similarity highlights that both the ball and the initial shear-layer structures are driven by the same muzzle pressure release. However, while the ball’s velocity represents the true motion of a solid body, the centerline u reflects the convection of flow structures in a rapidly evolving vortex–shear layer system. The numerical agreement should therefore be interpreted as a consequence of the shared initial impulse, rather than a direct equivalence between projectile speed and jet velocity.
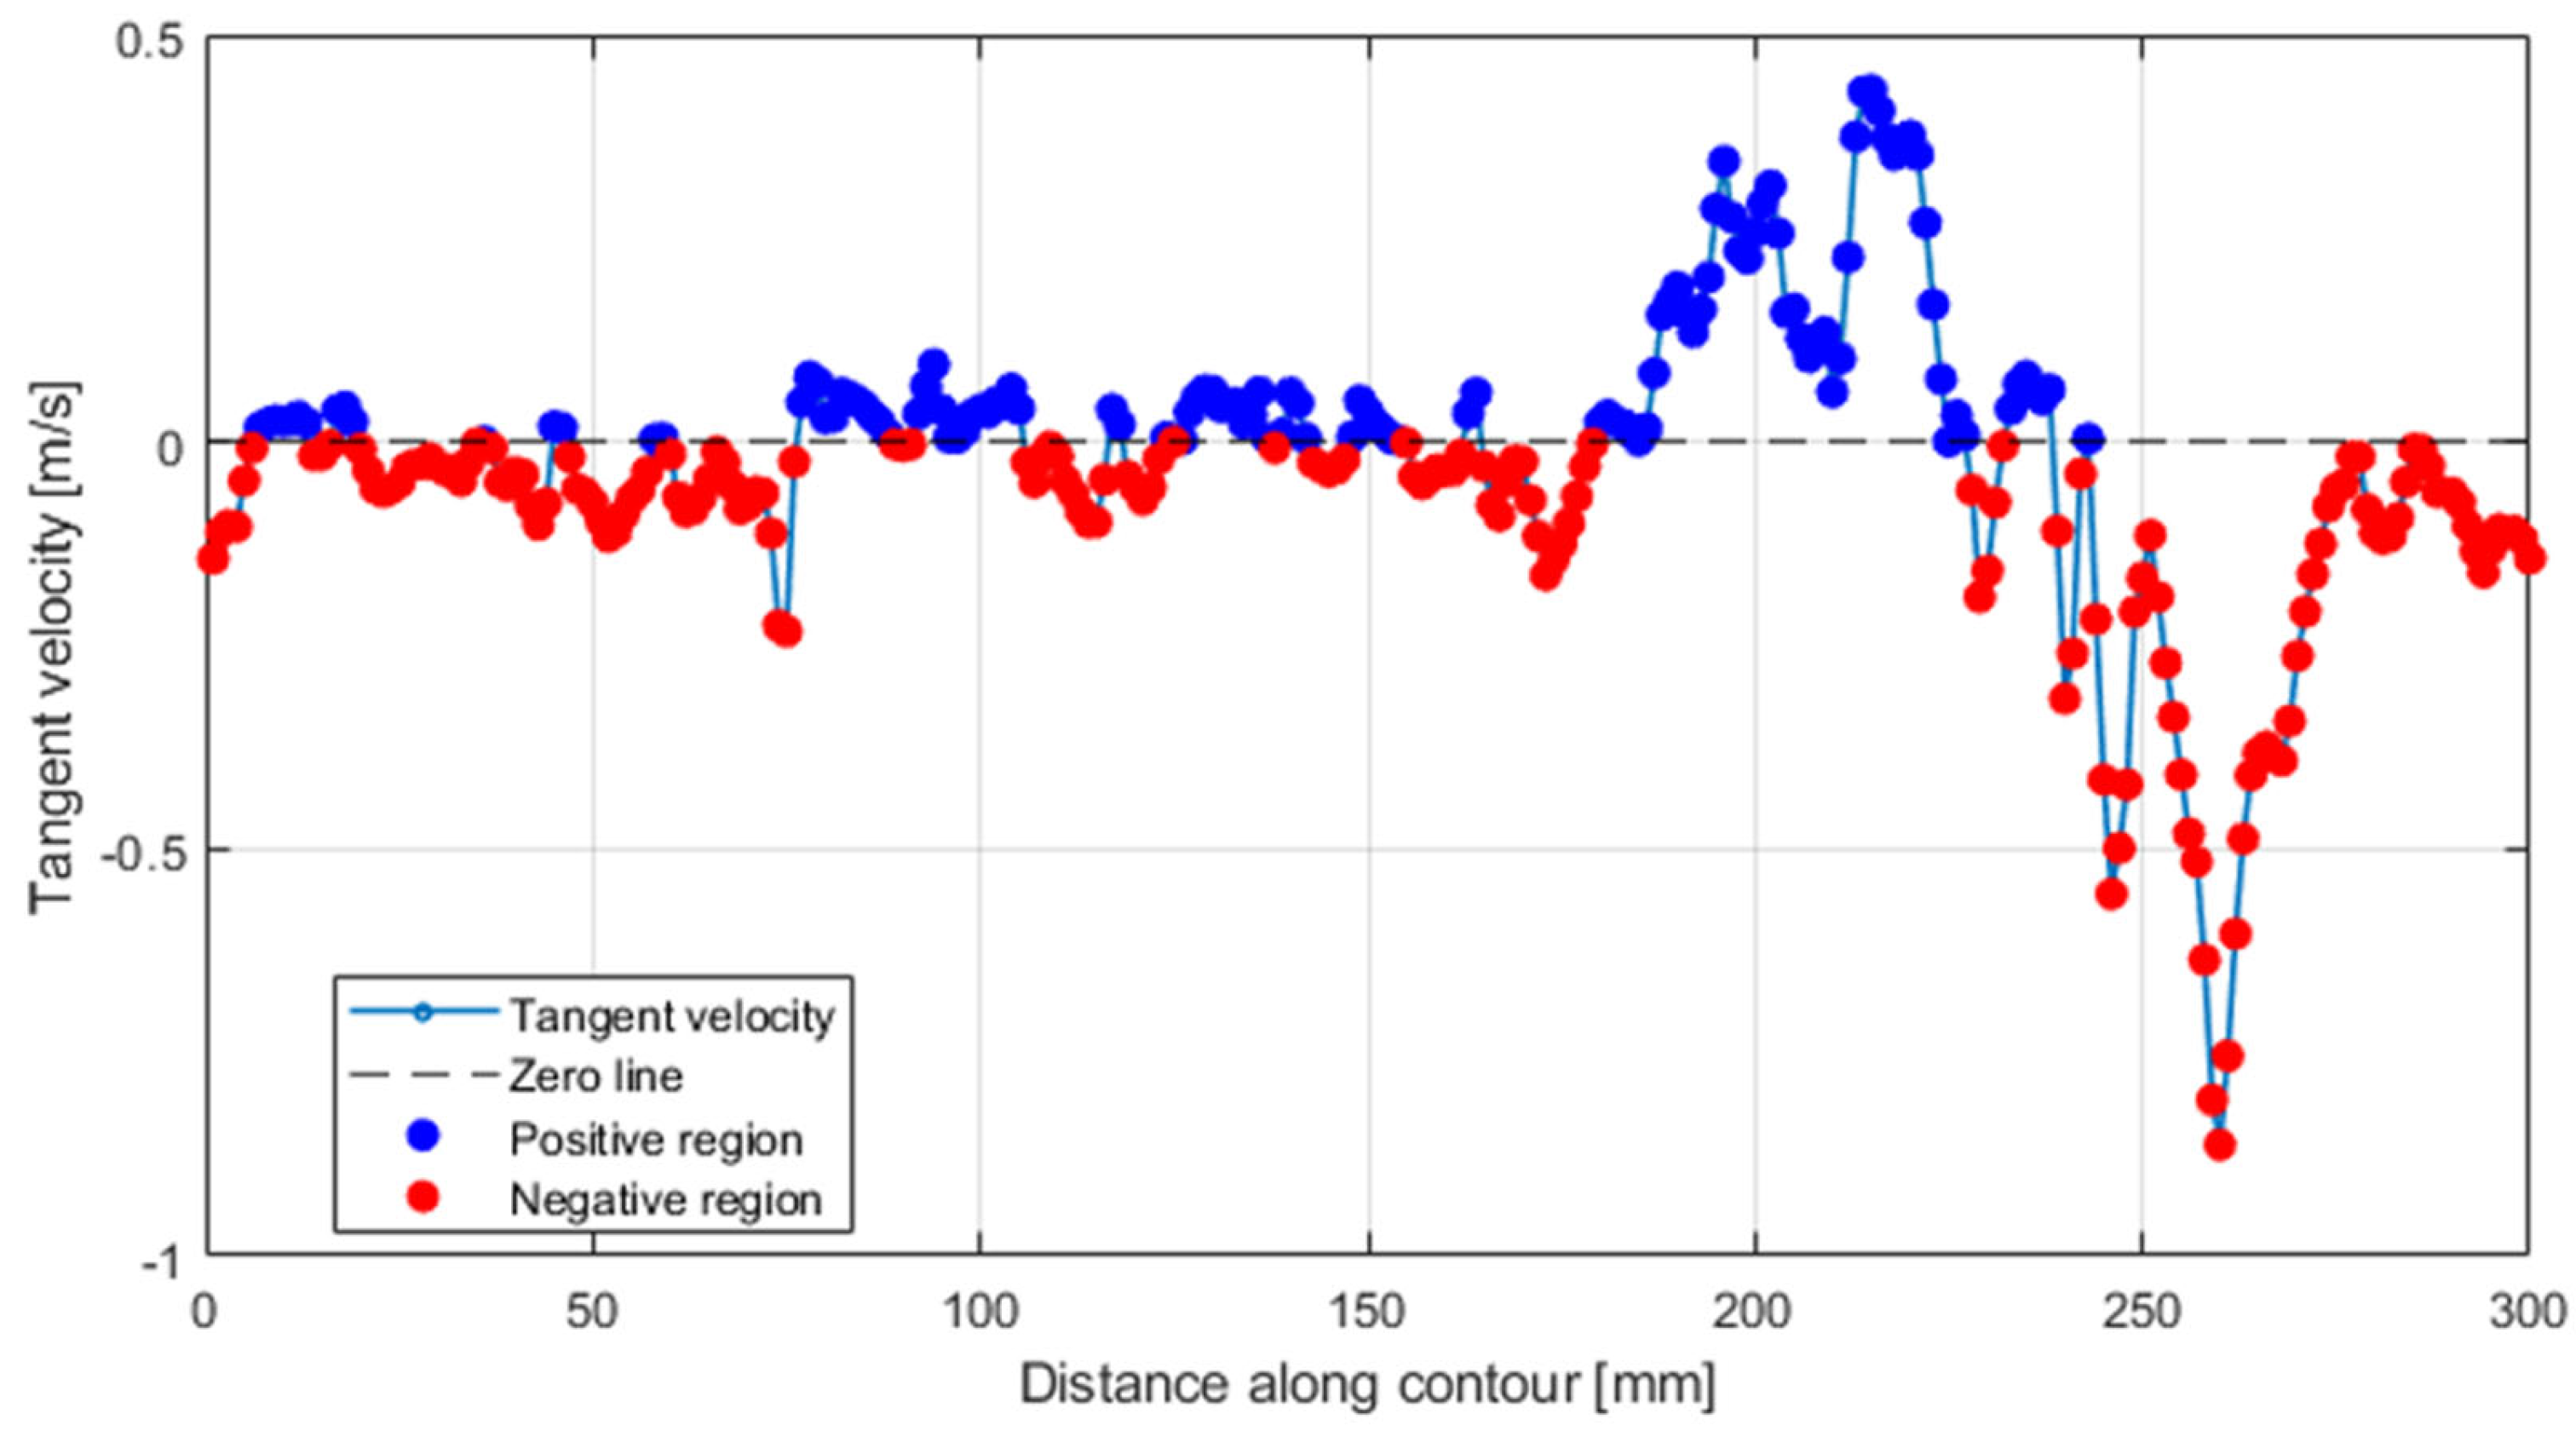
To complement the centerline analysis, tangent velocity was evaluated along the vortex boundary during the fully developed jet stage, after the projectile had already left the field of view. The profile in
Figure 16 shows alternating positive and negative values of up to ±0.8 m/s, revealing local forward and reverse motions within the shear layer. For distances up to ~150 mm along the contour, the velocities remain relatively small (|vₜ| < 0.1 m/s), indicating weak perturbations in the shear layer. Beyond ~180 mm, stronger oscillations appear, with positive peaks exceeding +0.5 m/s and negative peaks approaching −0.8 m/s. These variations are a clear signature of recirculation and vortex breakdown, corresponding to regions where the shear layer rolls up into vortical structures and produces localized acceleration and reversal of the flow direction. The presence of both positive and negative tangent velocities confirms the unsteady recirculation at the jet boundary. Physically, this implies that while the centerline flow continues downstream at a nearly constant convection speed, the vortex ring boundary undergoes strong fluctuations that dissipate energy through alternating shear stresses. This interpretation is consistent with the schlieren observations, where the jet envelope becomes increasingly distorted and fragmented in the late stages of the discharge.
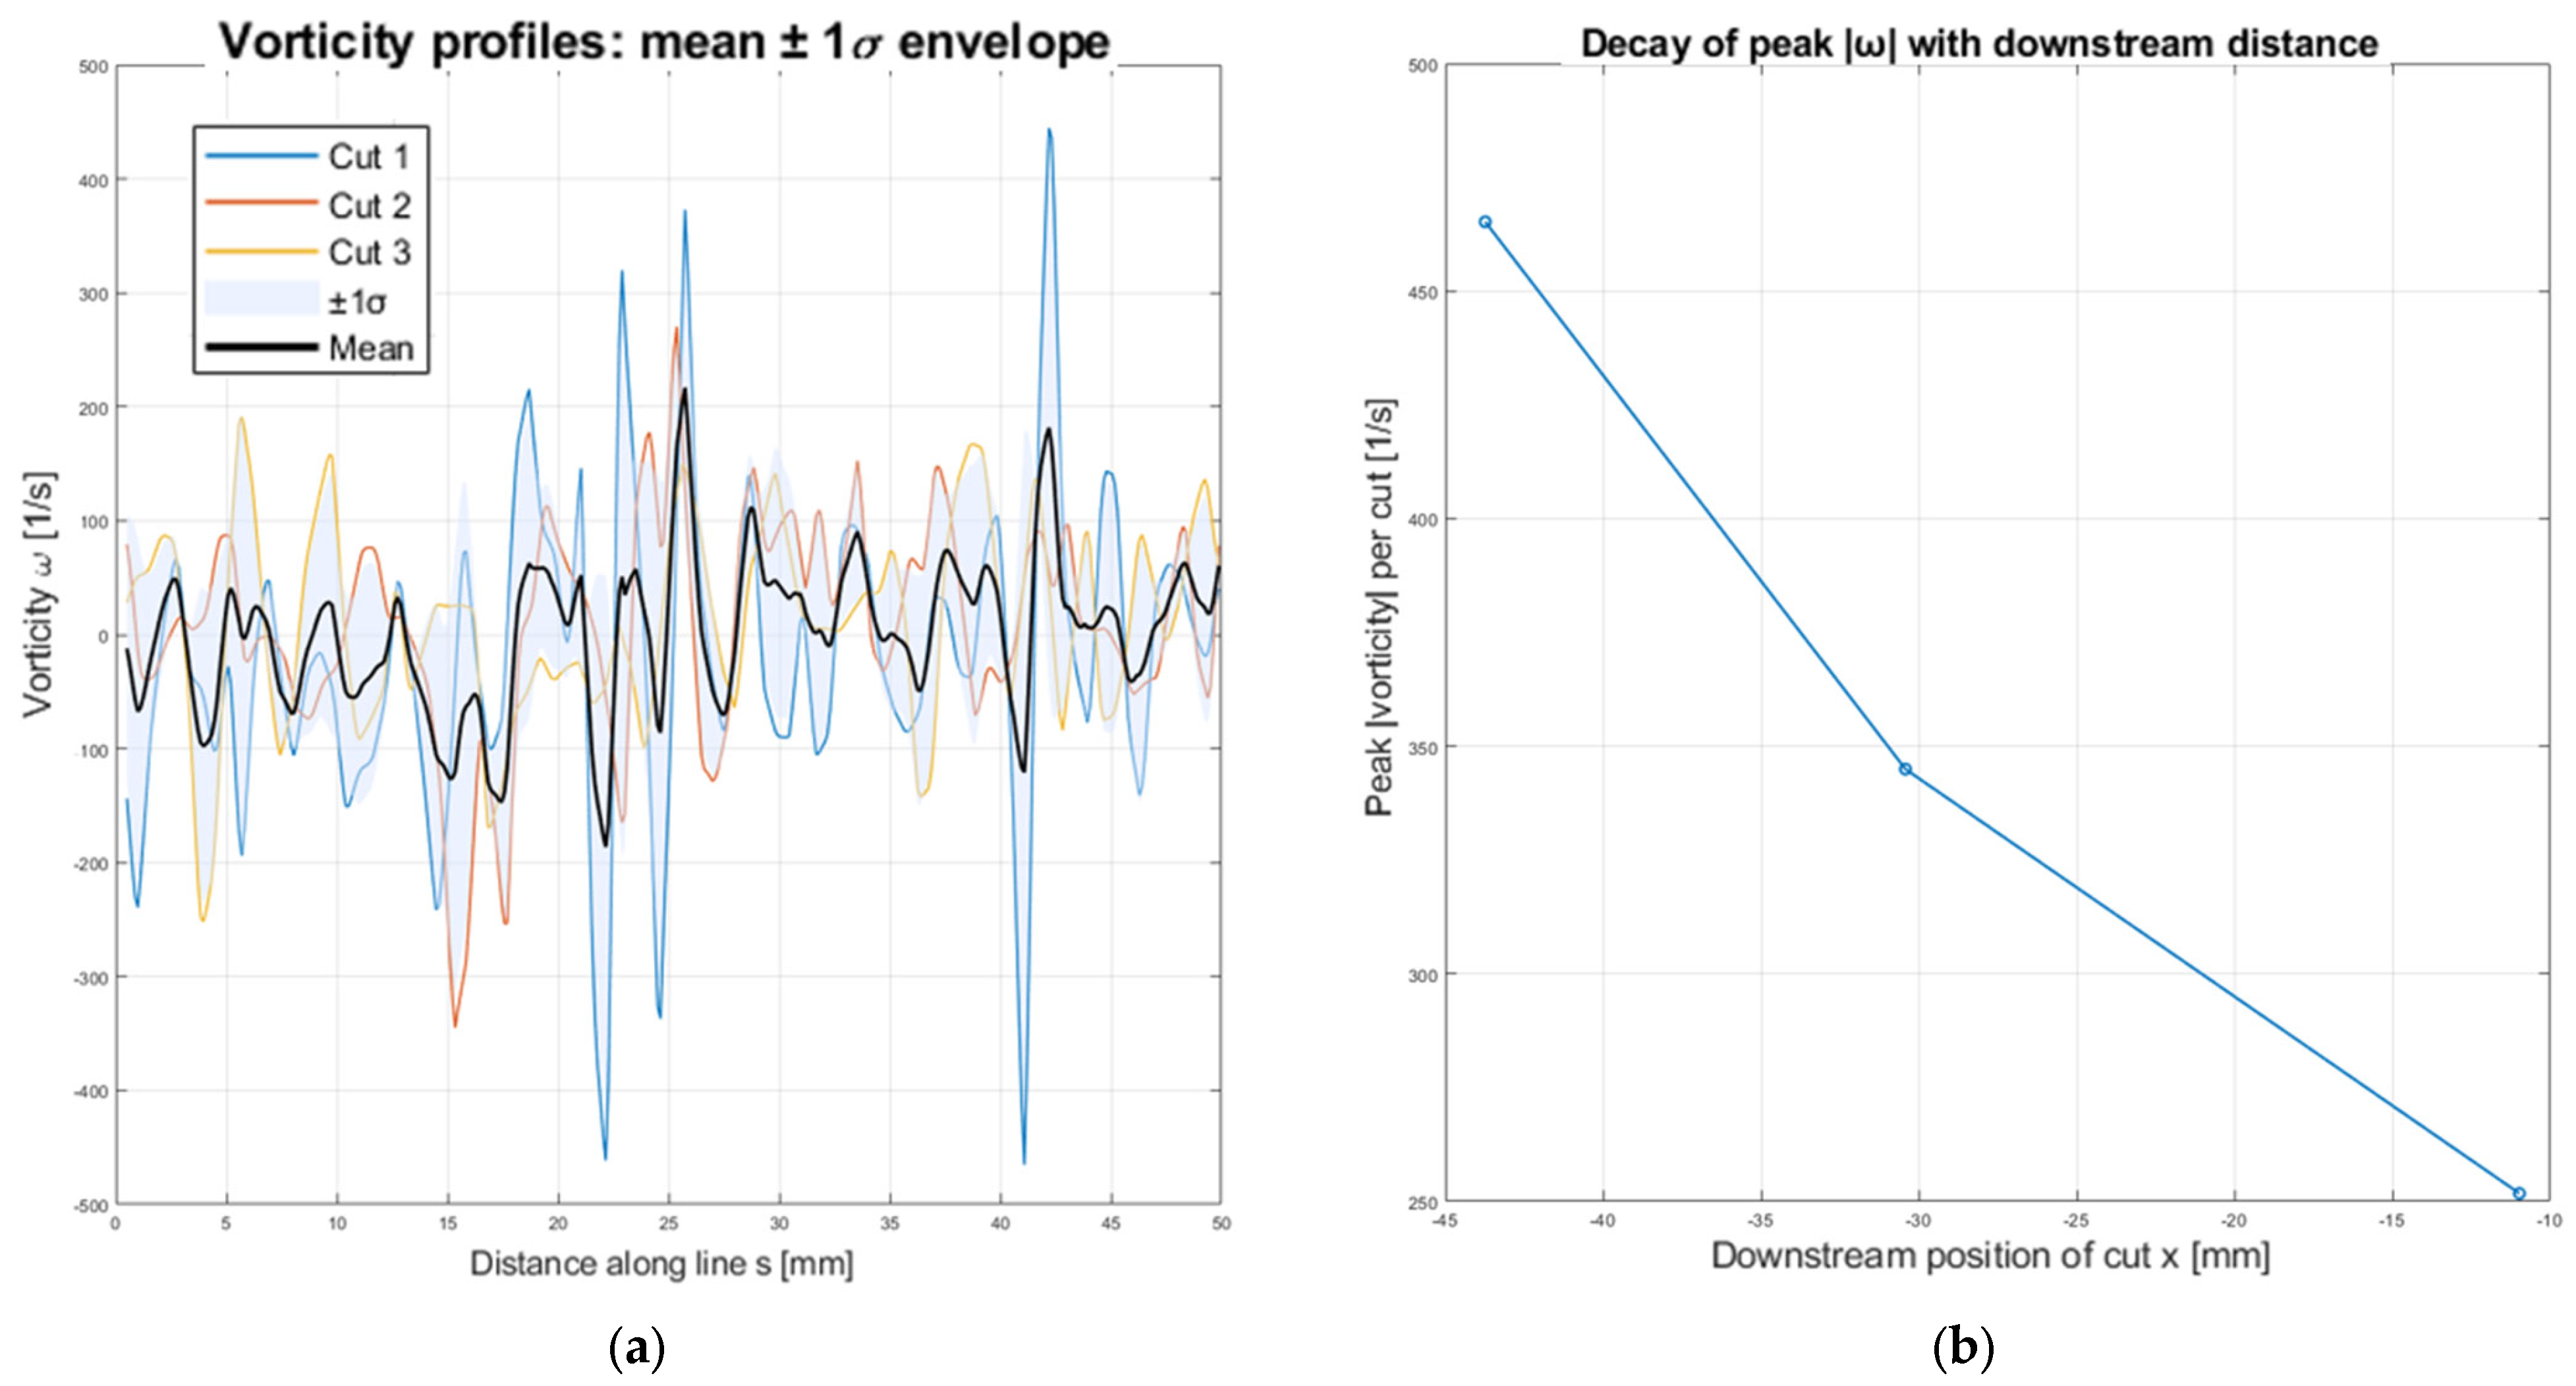
Vorticity was extracted along four vertical lines across the jet during the fully developed stage. To compare profiles consistently, each vorticity signal was interpolated onto a common arc-length coordinate and combined into an envelope representation (mean ±1σ). The individual profiles exhibit alternating positive and negative peaks, indicative of shear-layer roll-up. The envelope highlights a well-defined core with elevated vorticity and broader flanks where the magnitude decreases. The peak absolute vorticity |ω|, computed for each cut, decays with downstream distance, reflecting progressive mixing and dissipation of the jet as it expands. These results are presented in
Figure 17.
The SIV analysis provides quantitative insight into the otherwise qualitative schlieren recordings, enabling the extraction of convection velocity, tangent velocity, and vorticity profiles of the muzzle jet. While conventional tracking reveals projectile speed, only the SIV approach captures the dynamics of the surrounding flow, such as the transport of coherent shear-layer structures, the onset of recirculation, and the downstream decay of vorticity. These parameters are essential for understanding the interaction between the jet and the projectile, as well as the transition from organized structures to fully developed turbulence. Thus, the SIV methodology bridges the gap between visual observation and measurable flow quantities, offering a necessary complement to projectile kinematics for a complete characterization of the discharge process.
