Abstract
Understanding the transient flow phenomena accompanying projectile discharge is essential for improving the safety, efficiency, and predictability of small-scale ballistic systems. Despite extensive numerical studies on muzzle flows and shock formation, experimental visualization and quantitative data on the coupling between pressure waves, jet structures, and projectile motion remain limited. This work addresses this gap by employing high-speed schlieren imaging and schlieren image velocimetry (SIV) to investigate the near-field aerodynamics of an airsoft-type projectile propelled by a CO2 jet. Three optical configurations were analyzed—a Toepler single-mirror system, a Z-type without knife edge, and a Z-type with knife edge—to assess their sensitivity and suitability for resolving acoustic and turbulent features. The measured velocity of concentric pressure waves (≈355 m/s) agrees with the theoretical local speed of sound, validating the optical calibration. Projectile tracking yielded a mean speed of 71 ± 1.6 m/s, with drag and kinetic energy analyses confirming significant near-muzzle deceleration due to jet–projectile interaction. The SIV analysis provided additional insight into the convection velocity of coherent jet structures (≈75 m/s), tangent velocity fluctuations (±0.8 m/s), and vorticity distribution along the jet boundary. The results demonstrate that even compact schlieren setups, when coupled with quantitative image analysis, can capture the essential dynamics of unsteady compressible flows, providing a foundation for future diagnostic development and modeling of projectile–jet interactions.
1. Introduction
The study of transient compressible flows generated by projectile discharge has long been of interest in both applied and fundamental fluid mechanics. When a projectile is expelled from a barrel, the accompanying gas release produces a complex set of phenomena, including underexpanded jets, acoustic waves, shear layers, and in some cases bow shocks [1,2]. Li and Wang [3] showed that high-pressure muzzle jets generate complex shock collisions and vortical structures through jet–projectile interactions, while [4] emphasizes that underexpanded jets, shocks, and acoustic emissions dominate in higher-energy cases. Complementing these works, a recent numerical investigation [5] detailed how expanding propellant gases produce pressure waves, reflected shocks, and near-muzzle interactions immediately after projectile exit. In contrast, the present study examines a low-energy CO2-driven, subsonic projectile, demonstrating that schlieren imaging with frame-by-frame tracking can still provide quantitative data on pressure-wave propagation and shear-layer disturbances in compact laboratory setups.
These features are relevant not only to ballistics and propulsion but also to a wider understanding of unsteady jet dynamics and the interaction between gases and moving bodies. Despite the abundance of large-scale studies in supersonic and hypersonic contexts [6], the investigation of small-scale systems remains an important method of visualizing the fundamental physics of fluid flow and wave propagation, with the advantage of a higher accessibility [7,8].
Optical diagnostics play a key role in revealing these underlying physical properties. Among them, schlieren imaging remains one of the most powerful techniques for capturing density gradients in air and other gases. Its non-intrusive character, relatively low cost, and adaptability have secured its position in experimental fluid mechanics for more than a century [7,9]. In recent years, high-speed cameras have greatly expanded the potential of schlieren systems, enabling researchers to record transient phenomena such as blast waves [10,11,12], cavitation [13,14], and unsteady jet development. Schlieren imaging has been used to study missile-shaped bodies at high Mach numbers, revealing compressibility effects and shock oscillations, especially near cavities [15]. Background-Oriented Schlieren (BOS), especially when paired with high-speed cameras, offers a non-intrusive and cost-effective alternative for visualizing complex muzzle flows, capturing features like vortices and shock structures with resolution comparable to traditional schlieren methods [16]. Studying these transient shock waves is critical, as they affect projectile aerodynamics and accuracy, and BOS enables effective analysis in environments like firing ranges without the need for large, costly optics [17].
High-speed imaging of 152 mm howitzer firings revealed that blast waves expand at Mach 3–4 and decay to near sound speed within 13 m. Models accurately predicted the blast behavior, confirming steady energy release and 3D expansion. About 18–24% of muzzle flow energy converts into blast energy, with plume temperatures (980–1210 K) linked to combustion and muzzle flash. Differences between propellant charges were difficult to distinguish due to similar event characteristics [18]. The University of Tennessee Space Institute used a high-speed LED-based shadowgraph system to non-intrusively study firearm muzzle flows, capturing underexpanded jets and strong shock structures similar to those in large propulsion systems [19]. While schlieren has been extensively applied in firearms research to study muzzle blasts and bullet bow shocks [20,21], its use in compact, low-energy systems such as CO2-driven launchers is comparatively underexplored.
A key point of divergence in the literature is the degree to which small-scale systems can reproduce phenomena observed in higher-energy flows. Some authors argue that projectile-induced shocks are only relevant in supersonic regimes [22,23], while others emphasize that pressure waves and shear-layer instabilities in subsonic systems can also provide meaningful insights into transient jet dynamics [24,25]. This ongoing debate underscores the importance of carefully distinguishing between supersonic shock structures and acoustic pressure waves, particularly when working with projectiles at subsonic speeds.
This paper addresses the gap by applying high-speed schlieren imaging to visualize and quantify the muzzle flow of a 5 mm projectile launched from a CO2-driven airsoft system. With the projectile velocity measured at approximately 71 m/s, the body remains in the subsonic regime while the accompanying propellant jet produces visible pressure waves and shear-layer disturbances. By tracking both the projectile and the expanding wavefronts across frames, a methodology for converting schlieren images into quantitative measurements of velocity and propagation speed is demonstrated.
The significance of this work lies in showing that even compact laboratory setups can provide reproducible, quantitative insight into unsteady compressible flows. Beyond serving as a teaching or demonstration tool, the approach highlights how low-cost schlieren systems can contribute to experimental fluid mechanics by bridging the gap between qualitative visualization and quantitative diagnostics.
2. Experimental Setup and Imaging Configurations
The present section details upon the experimental setups, imaging configuration and data processing methods. The investigated phenomena come from firing an airsoft gun which expels a 5 mm polymer ball driven by a CO2 jet. When the projectile is expelled from the barrel by the sudden release of compressed CO2, the rapid jet expansion into the ambient air produces a transient sequence of flow structures. The high-pressure discharge generates circular pressure waves that propagate outward at approximately the speed of sound, while strong density gradients at the jet boundary give rise to a visible muzzle shock. The projectile itself travels at subsonic velocity and therefore does not form a bow shock, but its motion influences the near-field jet structure and contributes to the unsteady evolution of the flow.
The experimental campaign employed several schlieren configurations. The first was a Toepler single-mirror arrangement equipped with a horizontally oriented, anti-reflective knife edge. This series of experiments was conducted outdoors on a concrete surface, with the setup positioned 1.5 m above ground level. The elevated ambient temperature of 43 °C introduced noticeable air convection, visible in the recordings as a uniform shift in the background air stream, an effect that must be considered when interpreting the images. The single-mirror configuration was initially employed to image the projectile at close range, with the muzzle positioned 25 cm from the mirror aperture, primarily to achieve a clear, high-contrast view of the CO2 jet; this arrangement provided sharp imagery and appeared sensitive to jet structures, but the accompanying pressure waves and muzzle shock were only faintly visible.
The real-life setup is presented in the picture illustrated in Figure 1a, while Figure 1b presents the schematics of the setup, indicating the positioning of the knife edge.
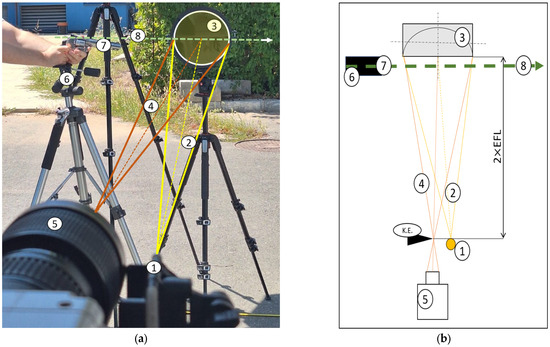
Figure 1.
Single-mirror schlieren configuration: (a) photograph of the aligned experimental setup, (b) corresponding schematic. In both subfigures: 1—point light source; 2—light path from source to parabolic mirror; 3—parabolic mirror; 4—light path from mirror to the high-speed camera; 5—high-speed camera focused on the knife edge (k.e.); 6—hand-stand support for the shooter; 7—airsoft gun; 8—projectile trajectory and jet propagation direction.
The second imaging configuration is a classic schlieren Z-type configuration without a knife edge, where the image appears to be more similar to a shadowgraph. In this configuration, the system was kept as a Z-type schlieren arrangement without a knife edge, with the camera zoom adjusted to focus on the muzzle region. Even without the knife edge, the flow features remained visible because the camera lens diaphragm acted as a limiting aperture, partially blocking deflected rays. This produced an effect analogous to a shadowgraph, where image contrast arises from the curvature of the refractive-index field rather than its first derivative. The reduced sensitivity of this mode meant that the weaker circular pressure waves were less visible, but the primary muzzle shock front, which generates larger angular deflections, appeared more distinctly than in the classical schlieren configuration. Testing in this configuration was carried out indoors, where the influence of direct sunlight was eliminated and the effects of air convection and heat dissipation from the concrete were significantly reduced.
This configuration closely resembles the Z-type arrangement shown in Figure 2, with subfigure (a) displaying a photograph of the setup and subfigure (b) the corresponding schematic.
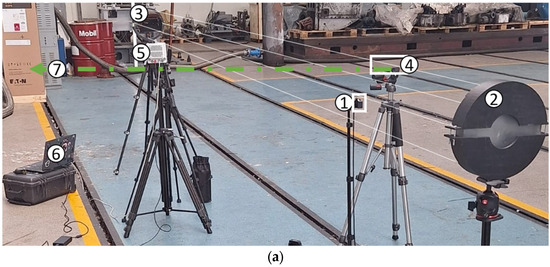
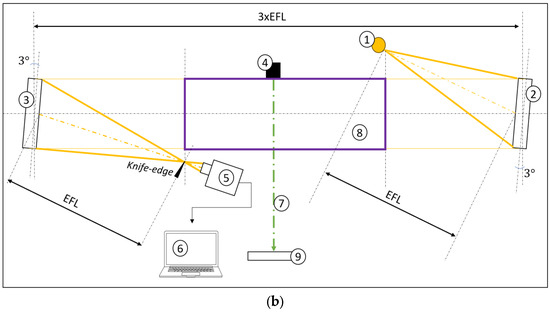
Figure 2.
Z-type schlieren configuration setup: (a) photograph of the setup and (b) schematics of the setup. For both subfigures: 1—light source; 2—first parabolic mirror; 3—second parabolic mirror; 4—shooter handstand; 5—high-speed camera; 6—data acquisition system; 7—projectile trajectory and jet propagation direction; 8—schlieren test region; 9—target.
The third configuration used was a classic schlieren Z-type configuration with a horizontally placed knife-edge, blocking 50% of the source image. All equipment used in the three imaging configurations are listed in Table 1.

Table 1.
List of equipment used in the experimental campaigns.
Although the Toepler and Z-type benches both employed parabolic mirrors with a focal length of 1524 mm and a diameter of 254 mm, the effective sensitivity of the configurations differed due to variations in signal-to-noise ratio (SNR) and aperture effects. For the indoor Z-type arrangement with a knife edge set at 50% cutoff and an effective source image size of 0.5 mm, the minimum detectable angular deflection is estimated at 3.3 × 10⁻⁶ rad. This corresponds to a density-gradient sensitivity of approximately 0.48 kg/m4 or about 42 Pa/mm at 300 K for a path length of 30 mm. In the outdoor Toepler single-mirror configuration, the presence of the beam splitter, background solar illumination, and heat-induced air convection reduced the effective SNR. Under these conditions, the detectable source image displacement was larger, in the range of 2–3% of the source image size, giving a minimum detectable angular deflection of approximately (6.6–9.9) × 10−6 or roughly 85–130 Pa/mm. In the Z-type configuration operated without a knife edge, the finite aperture of the camera lens diaphragm provided only minor vignetting, resulting in an effective cutoff of about 10–20% of that produced by a knife edge. This reduced the sensitivity by a further factor of 5–10, yielding a minimum detectable angular deflection on the order of (1.7–3.3) × 10−5 rad. The corresponding density-gradient sensitivity is approximately 2.4–4.8 kg/m4, equivalent to 210–420 Pa/mm under the same conditions.
In summary, the three configurations provided complementary diagnostic capabilities. The Z-type system with a 50% knife edge delivered the highest sensitivity, enabling detailed visualization of the initial pressure waves. The Toepler single-mirror arrangement, constrained by outdoor conditions, achieved lower sensitivity, while the Z-type operated without a knife edge emphasized the dominant muzzle shock but suppressed weaker gradients. These outcomes underline the role of system sensitivity in shaping the recorded flow features and establish the rationale for employing multiple configurations within the experimental campaign.
3. Data Processing and Results
The firing sequence revealed a characteristic succession of flow structures captured with high-speed schlieren imaging. Immediately after discharge, a series of concentric sound pressure waves were observed propagating outward from the muzzle. These were followed by the emergence of the primary muzzle blast, which rapidly evolved into a vortex-ring boundary surrounding the expanding CO2 jet. As the projectile was expelled, the jet developed a complex shear-layer structure that later appeared to recede toward the muzzle, indicating partial flow reversal and entrainment. After this transient re-ingestion, a secondary muzzle blast was detected in the subsequent frames, propagating with lower intensity than the primary event. This sequence, initial acoustic emission, blast wave formation, vortex-ring development, jet evolution, and secondary blast, represents the complete early-phase dynamics of the discharge. These steps are further analyzed.
3.1. Sound Pressure Wave Fronts
Pressure waves were extracted from enhanced schlieren frames obtained in the single-mirror configuration, using the pipeline described below. Recordings were performed with a Phantom VEO 710 L high-speed camera (Wayne, NJ, USA) at a resolution of 1280 × 800 px and a frame rate of 7500 fps. The exposure time was set to 2 µs with 12-bit depth, and synchronization was internal.
Background normalization was achieved by correcting each frame through subtracting a reference background acquired under identical optical settings, then rescaled to [0, 1] to reduce illumination non-uniformity.
Contrast enhancement with ring emphasis was obtained by applying a mild band-pass filter (difference of Gaussians σlow > σhigh, and CLAHE) to accentuate faint, quasi-circular fronts while suppressing low-frequency illumination drift and high-frequency sensor noise.
For geometric calibration and center finding, the mirror aperture (visible as a circular disk) was segmented and fitted with a circle to obtain its radius in pixels. Using the known mirror diameter (254 mm), the pixel scale S (mm/px) and the optical axis (center) were determined. When the mirror was not in view, an alternative in-frame reference (such as the 5 mm ball) provided S.
For ring detection (pressure fronts), two complementary methods were used. For the radial profile, the angle-averaged intensity was computed as a function of radius about the optical center and local maxima were extracted (peak-finding with minimum distance and prominence constraints) and taken as ring radii. The second method was the constrained circular Hough, where candidate circles were searched with centers constrained near the optical axis and radii restricted to [, 0.95 ]. Detections from both methods were cross-checked, and spurious picks near the center or close to the mirror edge were rejected. The detected radii (px) were converted to millimeters: .
The propagation speed was obtained from frame to frame. The sequence was recorded at 7500 fps and v was extracted, applying Equation (1).
where is measured in meters. The measured v was compared to the speed of sound a, calculated to the measured ambient temperature reported.
Emission timing was also extracted from the frames. When multiple concentric fronts appeared in a single frame, their inferred emission times relative to capture were computed as
Using a from the ambient temperature T, and inter-pulse spacings were reported as
The uncertainty analysis was also taken into account. The dominant contributions were ring-pick uncertainty ( px in radius), calibration error in S, and frame timing ( one frame interval). Propagated uncertainties were reported for , v, and (seconds) via standard linear error propagation. This formulation assumes that the individual uncertainty sources are independent and that higher-order terms are negligible, which is acceptable given the small relative errors (<5%) associated with the present measurements.
All image processing and quantitative analysis were performed in MATLAB 2020a using a custom script. Background normalization was implemented by subtracting a reference frame and rescaling intensity with the MATLAB function mat2gray. Contrast enhancement employed a combination of Gaussian filtering, Wiener denoising, and contrast-limited adaptive histogram equalization (adapthisteq) to highlight faint circular features. Figure 3 presents (a) the image of the tare image without the phenomena, emphasizing the outdoors heat, while (b) presents the raw image of the sound pressure waves.
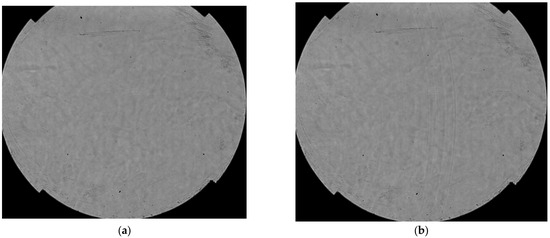
Figure 3.
(a) Background image captured in the schlieren single-mirror configuration, (b) raw image of the sound pressure waves.
Figure 4 presents the results of the (a) background normalization and (b) the contrast enhanced image of the phenomenon.
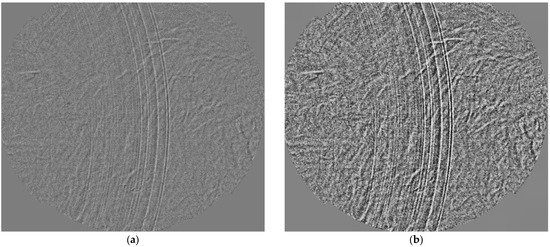
Figure 4.
(a) Post-processed image of the phenomena after background subtraction and normalization, (b) enhanced image of the sound pressure waves after applying contrast enhancement.
Contrast enhancement highlights the internal structure of the pressure waves and provides information on the emission timing of otherwise faint wavefronts.
Geometric calibration was achieved by detecting the mirror aperture in the images and fitting it with imfindcircles to obtain the optical center and scale factor in mm/px. Pressure-wave radii were identified by two complementary methods: (i) an angle-averaged radial intensity profile computed with improfile and processed with find_peaks, and (ii) a constrained circular Hough transform via imfindcircles. The identified circular pressure waves are represented in Figure 5 in two consecutive frames, (a) and (b).
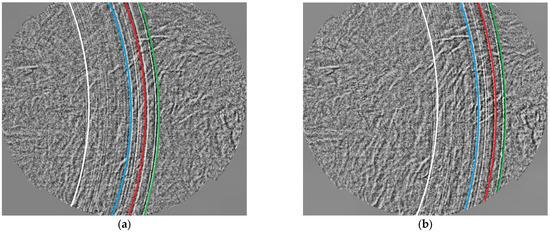
Figure 5.
Resulting circles defining pressure waves from consecutive frames (a) first frame, (b) second frame, where green, red, blue and white represent the tracked pressure waves.
The results were cross-checked and spurious detections near the center or mirror edge were discarded. Radii were converted from pixels to millimeters and stored for further analysis. The magnification factor was determined from the known mirror diameter, yielding a scale of 0.318 mm per pixel in real space.
Propagation velocities were then computed by tracking the same wavefront across consecutive frames, using the known frame interval (1/7500 s). In addition, multiple concentric fronts observed within a single frame were used to infer inter-pulse emission times based on the local speed of sound.
The sequence analysed up to this point represents the sound pressure waves generated immediately after CO2 release and prior to the formation of the muzzle shock. After background subtraction and contrast enhancement, multiple concentric fronts were resolved with sufficient contrast for quantitative tracking.
The green wavefront was quantified by identifying the most external intensity peak of the circular profile and measuring its horizontal distance from the inner edge of the mirror aperture. This procedure was applied to two consecutive frames, where the peak advanced from 512 px to 661 px, a displacement of 149 px. With the calibration factor of 0.318 mm/px, this corresponds to 47.4 mm. Over the frame interval of 133 µs, the resulting propagation velocity was:
which is in close agreement with the theoretical sound speed at 41 °C (a ≈ 355.6 m/s)
The theoretical value of the speed of sound under the recorded ambient temperature was estimated using the standard relation , where is the ratio of specific heats for air, is the specific gas constant, and is the absolute temperature. The measured propagation velocity of 355.5 m/s agrees closely with the theoretical value of 347 m/s for air at 41 °C, corresponding to a relative deviation of only ≈2.4%, which lies within the estimated experimental uncertainty.
Analysis of the additional red, blue, and white pressure fronts confirmed that all concentric waves propagated at the same velocity. Even when analyzed from the same frame these fronts were identified within a single frame, their radial separations (12.1 mm and 16.2 mm) translate into temporal delays of 34 µs and 45.6 µs when divided by the measured acoustic velocity. These values are consistent with the frame-to-frame tracking of the green front, demonstrating that the successive rings represent distinct pulses of the same acoustic train, all propagating at the local speed of sound.
Finally, uncertainties were estimated by propagating the effects of pixel resolution, calibration error, and frame timing.
The uncertainty in the velocity determination arises mainly from pixel-scale calibration, wavefront peak detection, and frame timing. With a calibration factor of 0.318 mm/px, an estimated ±1 px error in peak position corresponds to ±0.32 mm. Over the measured displacement of 149 px (47.4 mm) between frames, this gives a relative uncertainty of ≈0.95%. Including calibration (0.24%) and frame-timing (<0.1%) contributions, the total propagated error is approximately 1.25%.
In addition to the schlieren recordings, a series of tests were conducted in a Z-type configuration operated without the knife edge, producing shadowgraph-like images of the early acoustic stage. In this arrangement, the sound pressure wave fronts were only faintly visible, appearing as weak concentric gradients surrounding the muzzle. Although the contrast was significantly lower than in the schlieren images, the onion-layered structure of the propagating waves could still be distinguished. Figure 6a,b illustrate two representative post-processed frames, selected to exemplify the radial expansion of these fronts despite their reduced visibility. These recordings were conducted at 48,000 fps and a resolution of 512 × 256 confirming that even in a lower-sensitivity configuration, with the appropriate image post processing, the acoustic wave train preceding the muzzle shock can be qualitatively observed and correlated with the schlieren measurements.

Figure 6.
Post-processed consecutive frames obtained in no-knife-edge schlieren.
Qualitatively, the Z-type configuration with the knife edge proved to be the most effective and sensitive arrangement for visualizing the acoustic wave fronts. In this setup, the pressure waves were captured with the highest contrast and detail, allowing individual fronts to be distinguished more clearly than in the shadowgraph-like configuration. The increased sensitivity provided by the knife edge not only enhanced the visibility of faint concentric rings but also enabled more accurate identification of their structure and propagation. This confirms that the Z-type schlieren with knife edge is the most suited configuration for documenting the early acoustic stage of the discharge.
The detailed analysis of the pressure wavefronts was initially conducted on the single-mirror configuration, since in this arrangement the effective zoom of the optical system made the wavefronts appear larger within the field of view. This scaling facilitated more accurate peak detection and distance measurements. The results obtained were subsequently confirmed by the Z-type schlieren recordings, where a sequence of post-processed frames at 7500 fps with a horizontally placed knife edge set at 50% is shown in Figure 7.

Figure 7.
Post-processed image sequence of the sound pressure wavefronts captured in the Z-type configuration.
Together, these observations validate the measurements performed on the single-mirror system while underscoring the superior sensitivity of the Z-type configuration for capturing faint acoustic features.
In conclusion, both the single-mirror and Z-type schlieren configurations yielded consistent quantitative results for the propagation velocity of the sound pressure waves, with measured values closely matching the theoretical sound speed at the experimental temperature. While the single-mirror system offered the advantage of apparent magnification, facilitating the detection of larger wavefronts, its sensitivity to faint structures was limited. By contrast, the Z-type arrangement with a knife edge provided superior contrast and reliability in capturing the acoustic fronts. Therefore, the single-mirror configuration can serve as a practical alternative when spatial constraints prevent the use of a two-mirror system, but the Z-type with knife edge remains the preferred method for high-sensitivity investigations.
3.2. Projectile Kinematics
This section examines the projectile kinematics through trajectory reconstruction, velocity–time analysis, acceleration and energy dissipation, drag model comparison, and error quantification. The analysis is based on images acquired in the no-knife configuration, which facilitated clearer identification and tracking of the projectile within the CO2 jet. The recorded frames were processed in MATLAB 2020a using custom scripts developed for this study. The workflow included background subtraction, color-based segmentation of the red-marked projectile, centroid extraction, and conversion from pixel to physical units using the known projectile diameter. The resulting coordinates were then used for trajectory reconstruction, velocity calculation, and statistical analysis of vertical deviations. This approach ensured consistent and quantitative tracking of the projectile across the high-speed image sequence presented in Figure 8.

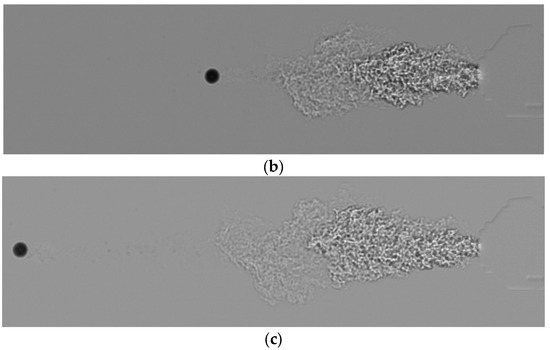
Figure 8.
Schlieren sequence of the ball exiting the gun in the schlieren test area captured with Phantom Veo 10 L, at 8300 fps, in no-knife configuration.
The trajectory of the projectile was reconstructed by tracking the centroid of the ball, which had been pre-marked in red for robust segmentation, across consecutive frames acquired at 8300 fps in the no-knife configuration. Using the known ball diameter of 5 mm (corresponding to 60 pixels), a magnification factor was determined that allowed conversion of pixel coordinates into physical units. The reconstructed path showed that the motion was predominantly horizontal, with a fitted linear regression indicating a drift angle of –3.44 mrad. The fit quality, expressed by a coefficient of determination of R2 = 0.623, confirmed that the vertical component of motion was minor. Vertical deviations from the median trajectory were quantified, yielding a standard deviation of σ = 0.188 mm; most data points lay within the ±1σ interval, suggesting that fluctuations were small and most likely caused by local turbulence in the CO2 jet or tracking uncertainty.
The velocity of the projectile was obtained by measuring centroid displacements between successive frames and applying the same pixel-to-millimeter calibration. Instantaneous speed values ranged between 66 and 77 m/s, reflecting a combination of experimental uncertainty and local disturbances induced by the surrounding jet. A linear regression fit through the velocity data revealed a slight negative slope, consistent with gradual deceleration during the recorded interval. The mean velocity derived from this analysis was approximately 71 m/s, which is considered representative of the projectile’s initial speed in the test section.
The projectile speed, obtained from frame-to-frame centroid displacements (5 mm ↔ 60 px; 8300 fps), varies between 66–77 m/s over the analyzed interval. A linear fit to v (t) indicates a nearly constant regime with a representative mean speed of ≈71 m/s, which was adopted as the characteristic velocity in the test section.
The dominant uncertainties arise from centroid localization and scale calibration. With a centroid jitter of ±1–2 px and Δt = 1/8300 s, the per-frame velocity error is ±(0.7–1.4) m/s (since 1 px ⇒ 0.0833 mm 0.0000833 m/Δt ≈ 0.69 m/s). A ±1 px uncertainty on the 60 px diameter implies a scale error of ≈1.7% (≈±1.2 m/s at 71 m/s). Combining in quadrature gives a conservative ±1.6 m/s band. The value reported is, therefore, v = 71.0 ± 1.6 m/s.
This value is consistent with typical muzzle speeds for airsoft projectiles of comparable mass/diameter (≈60–90 m/s), supporting the validity of the optical tracking and calibration [30].
The small oscillations in the instantaneous speeds primarily reflect image noise (sub-pixel centroid jitter), local refractive-index turbulence in the CO2 jet, and minor segmentation variability, rather than true ballistic oscillations.
The acceleration of the projectile was derived directly from the time-resolved velocity data obtained through image tracking. Once the projectile centroid was identified in each frame, the horizontal displacement was converted to physical units using the known magnification factor, and the velocity was calculated as the frame-to-frame displacement divided by the frame interval Δt = 1/8300 s. The instantaneous acceleration was then obtained by applying a finite-difference method to the velocity sequence, . This per-frame approach yields a pointwise estimate of the acceleration, although it is sensitive to experimental noise. To obtain a more robust value, a linear regression was also applied to the velocity–time data, with the slope of the regression line representing the average acceleration over the recorded interval. The fit indicates a mean deceleration of approximately −3.5 × 10² m/s2, consistent with aerodynamic drag acting on the projectile immediately after leaving the barrel.
The kinetic energy of the projectile was estimated from its measured velocity using , knowing the mass of the 5 mm polymer ball was known to be 0.3 g. At the representative velocity of 71 m/s, the corresponding kinetic energy is approximately 0.76 J, whereas at a residual speed of 1 m/s it reduces to only 0.00015 J. This implies that nearly the entire initial energy (ΔE ≈ 0.76 J) is dissipated during deceleration, predominantly through aerodynamic drag and interaction with the surrounding CO2 jet. These results demonstrate that the energy balance can be quantitatively assessed from the image-derived kinematic data.
To assess whether the measured velocity trend is consistent with aerodynamic drag, a quadratic drag model was applied. The governing equation of motion is expressed in Equation (6).
where is the air density, is the drag coefficient, A is the cross-sectional area and m is the projectile mass. For a 5 mm polymer ball of mass m = 0.3 g, the frontal area is with radius r = 2.5 mm. Taking an air density of (corresponding to ambient temperature of 41 °C) and a typical drag coefficient for a sphere at Reynolds numbers , , gives . At the measured initial velocity of , the corresponding drag force is 0.026 N, as calculated in Equation (7).
Which yields an instantaneous deceleration of .
The analytical solution of the drag law is presented in Equation (7).
Equation (7) defines characteristic scales of and . These indicate that the velocity decreases by a factor of e only after ~0.8 s of flight or ~58 m of travel. Whitin the short imaging window of 1.8 ms, the model therefore predicts a negligible velocity loss of , well below the experimental uncertainty (.
The velocity decay of the projectile was analyzed using the quadratic drag law v(x) = v0e−kx, where the drag coefficient k depends on projectile geometry, mass, and air density. Two scenarios were compared. In the first, a theoretical clean-air drag coefficient of k = 0.017 m−1 predicted only a gradual reduction in velocity, with the projectile retaining most of its speed over the first few tens of centimeters. In the second case, an effective coefficient of k = 1.40 m−1 was calculated directly from experimental measurements, where the speed decreased from 71 m/s at the muzzle to 50 m/s within 0.25 m of travel. This much larger effective coefficient reflects the influence of the expanding CO2 jet and near-muzzle turbulence, which significantly enhanced energy dissipation compared to clean-air conditions. The analysis thus demonstrates that projectile slowdown in this system cannot be described by free-flight aerodynamics alone, and instead requires consideration of muzzle flow interactions to provide realistic predictions.
The observed fluctuations in the frame-to-frame velocities are thus attributed to image processing noise and refractive-index disturbances in the CO2 jet rather than genuine ballistic deceleration. Overall, the comparison demonstrates that the measured projectile speeds are consistent with the aerodynamic drag model and validates the use of the image-based tracking method for near-field kinematic analysis.
It is further noted that a thin trace appears to adhere to the rear of the projectile as it exits the muzzle, as presented in Figure 9. This feature is most likely associated with the turbulent wake forming immediately behind the ball, but its visibility in schlieren may be enhanced by the temperature difference between the ball cooled by the CO2 jet and the warmer ambient air. While not the primary focus of this study, this observation highlights the combined aerodynamic and thermal effects present in the flow field.
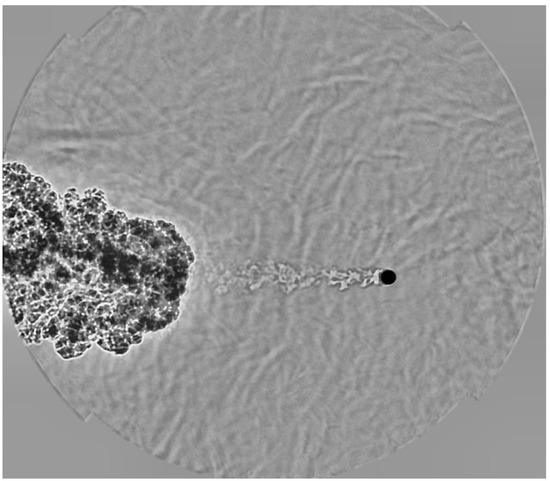
Figure 9.
Toepler-schlieren image of the projectile after muzzle exit, showing a rear wake trace likely enhanced by thermal gradients between the CO2 jet and ambient air.
3.3. Muzzle Shocks—Structure Analysis
The schlieren image sequence captured in no-knife configuration (Figure 2) begins with the appearance of the acoustic pressure waves, emitted as concentric fronts from the sudden release of compressed gas inside the barrel. These pressure waves constitute the first visible structure in the flow and mark the onset of the firing process. Immediately after the passage of the acoustic waves, the initial underexpanded jet begins to issue from the muzzle as a compact, dense core with sharp gradients at its boundary, as presented in Figure 10, in which it can be observed that it is preceded by the acoustic waves. The analysis conducted below is performed on a recording of the phenomena with the next settings: a full resolution of 120 × 800, a recording speed of 8300 fps, the exposure time used was 3 microseconds and the camera had a 12-bit depth.
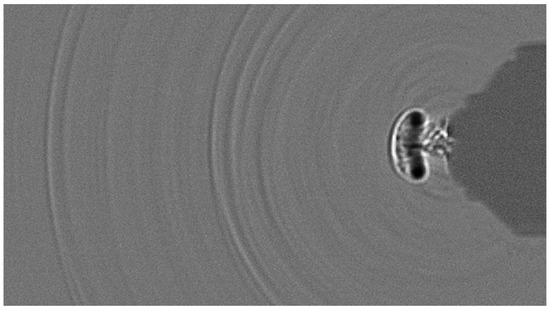
Figure 10.
Post-processed schlieren image of the initial muzzle blast, preceded by the acoustic waves.
In the first instants it appears as a short, bright discharge, but as it propagates outward it rapidly destabilizes and evolves into a sinuous dark line, the schlieren signature of shear-layer instabilities and vortex shedding, presented in Figure 10. This organized jet structure is subsequently disrupted by a new train of pressure waves that propagate outward, breaking up the wavy pattern, as presented in the sequence from Figure 11.
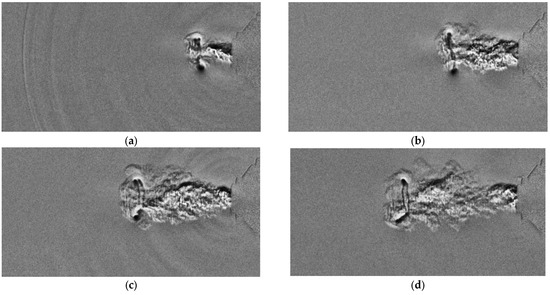
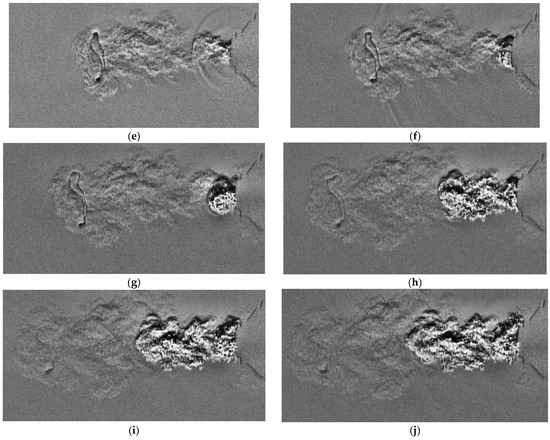
Figure 11.
Post processed background-subtracted, contrast enhanced, sequence of schlieren frames showing the dispersion of the sinuous dark line formed by the initial underexpanded jet. The coherent wavy structure, generated by shear-layer instabilities and vortex shedding, is progressively broken up as a new train of pressure waves propagates from the muzzle and interacts with the jet, leading to the loss of its organized form.
Following this disruption, a fresh discharge of gas issues from the barrel in the form of a mushroom-shaped jet, very similar to the first one, generated by the roll-up of a leading vortex ring that entrains surrounding air. This vortex-ring structure grows and expands ahead of the muzzle and occurs just before the ball exits the barrel, linking the gaseous blast with the projectile motion. This impinging jet sequence is depicted in Figure 12.


Figure 12.
Post-processed, contrast-enhanced sequence of schlieren frames of the jet impinging on the projectile.
Once the ball clears the muzzle, as shown in Figure 9, the remaining gas vents as a secondary underexpanded jet, weaker than the first but still visible in schlieren. During the brief interval before this jet emerges, the surrounding air appears to be drawn back toward the barrel, an effect caused by the low-pressure region left in the wake of the primary blast and by entrainment of ambient fluid into the expanding flow. Like the initial discharge, this residual jet depicted in Figure 13 also develops a wavy structure whose propagation in the schlieren test area is presented in the sequence from Figure 14, though here the schlieren cutoff renders it as a white sinuous line, corresponding to the opposite orientation of density gradients.
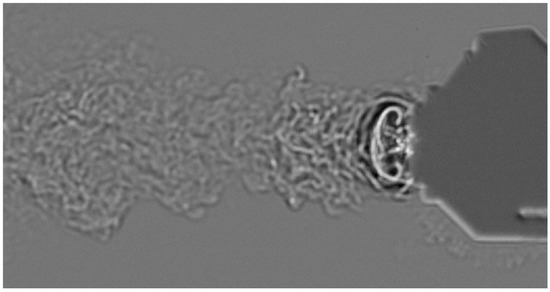
Figure 13.
Post-processed, subtracted background no knife schlieren image of the secondary underexpanded jet, which appears after the surrounding air is drawn back toward the muzzle and develops into a weaker discharge marked by a white sinuous line.

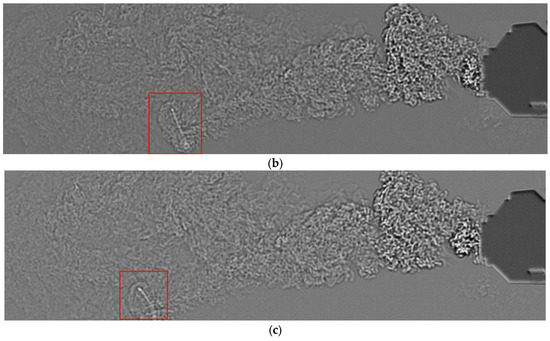
Figure 14.
Sequence of schlieren images showing the secondary jet, where the weaker discharge appears after the air is drawn back toward the muzzle and develops prominently into a distinctive white sinuous line.
Taken together, the images document the complete firing sequence: initial pressure-wave emission, jet formation and instability, disruption by subsequent waves, development of another vortex-ring mushroom jet linked to projectile emergence, projectile emergence, the inward draw of the surrounding air, and finally the expulsion of the secondary underexpanded jet.
3.4. CO2 Jet Characteristics—SIV Analysis
A schlieren image velocimetry (SIV) analysis was carried out on the ball–impinging jet using PIVlab 2.63 [31]. For consistency, the enhanced schlieren images were employed, following the same post-processing routine as described for the sequence in Figure 12. The images used in this study were recorded in the same firing conditions as the ones presented before, meaning they were acquired from the first shot fired with a new CO2 capsule. The frames were recorded at a speed of 72,000 fps. A parallel analysis was conducted on a 200,000 fps but rendered a wide range of spurious vectors due to the low resolution allowed by the camera at this recording speed (128 128 px).
A three-step FFT cross-correlation scheme was applied with interrogation window sizes of 32 × 16, 16 × 8, and 8 × 4 pixels, in line with the PIV requirement of maintaining at least three pixels per tracer element. In this case, the smallest turbulent eddies visible in the schlieren field acted as flow tracers. Owing to the strongly turbulent character of the jet, the resulting velocity vectors reproduced its evolving structure with good fidelity. The jet impinged on the ball before the projectile was released, as the gas escaped earlier from the muzzle. However, since the projectile carried significantly higher momentum and the jet rapidly dissipated energy through vortex formation, the projectile surpassed the jet within only a few microseconds, according to the frames presented in Figure 8.
Several considerations were implemented to ensure robustness of the analysis: the region of interest (ROI) was restricted to the main jet in order to reduce computational demands; the projectile was masked to prevent spurious vectors, although the surrounding flow was still captured and included in the results.
The centerline analysis yielded the spatio-temporal distribution of the streamwise velocity, from which a ridge-extraction method identified the dominant propagation of coherent structures. Linear regression of this ridge provided a convection velocity of approximately Uc = 74.6 m/s as seen in Figure 15. This value is particularly relevant, as it falls close to the projectile’s mean velocity and highlights that the jet structures are initially convected at nearly the same order of magnitude as the ball. The convection speed reflects the transport of large-scale eddies and shear-layer instabilities rather than the instantaneous peak velocity of the gas, and therefore provides a robust metric for comparing jet–projectile interaction dynamics. At later times, the ridge deviates from linearity due to rapid turbulent breakdown, leading to a reduction in correlation strength and increased scatter. Nonetheless, the early-time estimate of Uc confirms that the gas jet initially trails the projectile with only a small velocity deficit, before dissipating energy through mixing and vortex formation. For the convection speed analysis, frames covering the projectile passage and a short interval thereafter were selected. In this range, coherent shear-layer structures are still visible and correlation peaks remain stable, allowing a reliable ridge slope to be extracted. At later times, the jet becomes highly fragmented, and the loss of structure coherence leads to unreliable convection speed estimates.
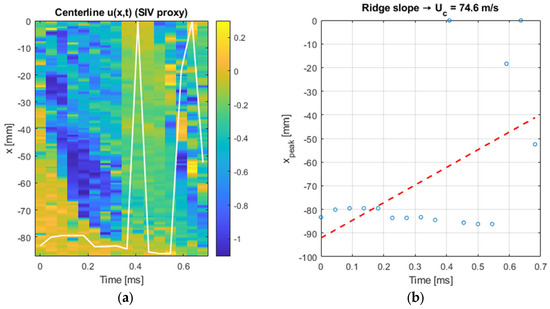
Figure 15.
U velocity across the projectile impinging jet centerline: (a) centerline SIV proxy, (b) centerline ridge slope.
These results demonstrate that, although SIV is path-averaged, it provides a reliable characterization of convection speed and its role in the early phases of muzzle jet evolution. A list of the specific post-processing settings is provided in Table 2.

Table 2.
PIVlab post-processing settings.
The convection velocity extracted from the centerline SIV analysis (Uc = 74.6 m/s) is of the same order as the projectile velocity determined independently from image tracking (70 m/s). This similarity highlights that both the ball and the initial shear-layer structures are driven by the same muzzle pressure release. However, while the ball’s velocity represents the true motion of a solid body, the centerline u reflects the convection of flow structures in a rapidly evolving vortex–shear layer system. The numerical agreement should therefore be interpreted as a consequence of the shared initial impulse, rather than a direct equivalence between projectile speed and jet velocity.
To complement the centerline analysis, tangent velocity was evaluated along the vortex boundary during the fully developed jet stage, after the projectile had already left the field of view. The profile in Figure 16 shows alternating positive and negative values of up to ±0.8 m/s, revealing local forward and reverse motions within the shear layer. For distances up to ~150 mm along the contour, the velocities remain relatively small (|vₜ| < 0.1 m/s), indicating weak perturbations in the shear layer. Beyond ~180 mm, stronger oscillations appear, with positive peaks exceeding +0.5 m/s and negative peaks approaching −0.8 m/s. These variations are a clear signature of recirculation and vortex breakdown, corresponding to regions where the shear layer rolls up into vortical structures and produces localized acceleration and reversal of the flow direction. The presence of both positive and negative tangent velocities confirms the unsteady recirculation at the jet boundary. Physically, this implies that while the centerline flow continues downstream at a nearly constant convection speed, the vortex ring boundary undergoes strong fluctuations that dissipate energy through alternating shear stresses. This interpretation is consistent with the schlieren observations, where the jet envelope becomes increasingly distorted and fragmented in the late stages of the discharge.
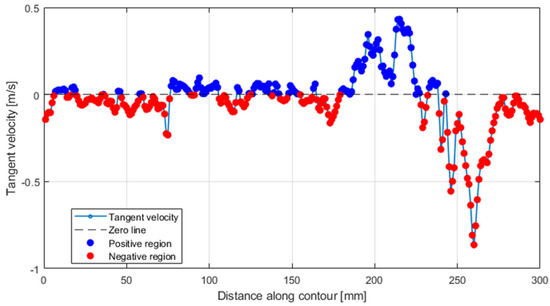
Figure 16.
Tangent velocity distribution along vortex boundary.
Vorticity was extracted along four vertical lines across the jet during the fully developed stage. To compare profiles consistently, each vorticity signal was interpolated onto a common arc-length coordinate and combined into an envelope representation (mean ±1σ). The individual profiles exhibit alternating positive and negative peaks, indicative of shear-layer roll-up. The envelope highlights a well-defined core with elevated vorticity and broader flanks where the magnitude decreases. The peak absolute vorticity |ω|, computed for each cut, decays with downstream distance, reflecting progressive mixing and dissipation of the jet as it expands. These results are presented in Figure 17.
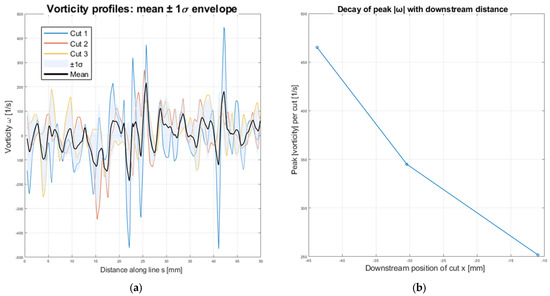
Figure 17.
Vorticities along 4 lines of the jet (a) vorticity profiles, (b) decay of peak with downstream distance.
The SIV analysis provides quantitative insight into the otherwise qualitative schlieren recordings, enabling the extraction of convection velocity, tangent velocity, and vorticity profiles of the muzzle jet. While conventional tracking reveals projectile speed, only the SIV approach captures the dynamics of the surrounding flow, such as the transport of coherent shear-layer structures, the onset of recirculation, and the downstream decay of vorticity. These parameters are essential for understanding the interaction between the jet and the projectile, as well as the transition from organized structures to fully developed turbulence. Thus, the SIV methodology bridges the gap between visual observation and measurable flow quantities, offering a necessary complement to projectile kinematics for a complete characterization of the discharge process.
4. Conclusions
This study demonstrates that compact schlieren systems, when paired with high-speed imaging, can yield quantitative and repeatable insights into transient compressible phenomena such as pressure-wave propagation, muzzle blasts, projectile motion, and jet–projectile interaction. The measured velocities of the acoustic wavefronts were consistent with the theoretical speed of sound at the recorded ambient conditions, validating both the optical calibration and the accuracy of the image-based analysis.
A comparison of three optical configurations—the Toepler single-mirror, the Z-type without knife edge, and the Z-type with knife edge—revealed the essential trade-off between magnification and sensitivity. While the single-mirror system offered superior zoom and ease of alignment, only the Z-type with a horizontal knife edge provided sufficient sensitivity to resolve faint acoustic structures and secondary pressure waves with clarity.
Projectile tracking yielded an average velocity of 71 ± 1.6 m/s, with measured deceleration and drag values highlighting the strong influence of the expanding CO2 jet in amplifying local energy losses beyond those predicted by clean-air drag laws. The corresponding kinetic energy dissipation was shown to occur primarily within the first milliseconds after discharge, underlining the importance of including near-muzzle flow dynamics in small-scale ballistic analyses.
The Schlieren Image Velocimetry (SIV) analysis offered complementary insight into the jet’s internal dynamics, quantifying a convection velocity of approximately 75 m/s together with tangent-velocity oscillations and vorticity decay. Although the SIV data represent path-averaged quantities rather than instantaneous fields, the results clearly captured the dominant mechanisms of vortex roll-up, shear-layer instability, and subsequent energy dissipation. The similarity between the convection velocity and projectile speed confirms that both phenomena are initially governed by the same transient pressure release.
The similarity between the projectile velocity and the convection speed of the jet’s coherent structures arises from their shared acceleration phase, driven by the rapid CO2 expansion at the moment of discharge. Both the projectile and the leading gas front are initially propelled by the same pressure release, resulting in comparable velocities. As the projectile exits the muzzle, the gas jet detaches and evolves independently, forming shear-layer vortices that convect downstream at diminishing speeds due to turbulence and energy dissipation.
By integrating quantitative schlieren velocimetry with direct projectile tracking, this work bridges solid-body and flow-field dynamics, providing a unified description of the discharge sequence. The findings collectively demonstrate that even low-cost schlieren systems can be developed into robust diagnostic tools for muzzle flow studies and small-scale ballistic experiments.
Nevertheless, several methodological limitations were identified, including the short temporal window imposed by the camera’s memory, the path-averaged character of the SIV technique, and the restriction to a single projectile type and firing condition. Future work will focus on optimizing these limitations through several strategies: (1) extending recording time by employing high-speed cameras with higher on-board memory and optimized frame sub-sampling, (2) implementing ensemble-averaged or phase-locked SIV processing to recover instantaneous flow features from repeated firings; (3) testing a broader range of projectile masses and CO2 pressures to assess scaling effects; and (4) combining schlieren measurements with synchronized pressure transducers and numerical simulations to validate velocity and drag data. In addition, future extensions of this work may incorporate advanced optical methods such as Background-Oriented Schlieren (BOS), rainbow schlieren, or tomographic multi-view reconstruction to enhance spatial sensitivity and coverage.
In summary, the present study establishes a validated methodology for quantitative visualization of muzzle flow phenomena using compact schlieren systems. Through the proposed methodological optimizations, this approach can evolve from a demonstrative setup into a standardized diagnostic framework for investigating low-energy ballistic flows and compressible jet–projectile interactions.
Author Contributions
Conceptualization, E.-G.P. and V.D.; methodology, E.-G.P., R.A.R. and S.S.; software, E.-G.P. and R.A.R.; validation, S.S., O.D. and E.-G.P.; formal analysis, V.D.; investigation, S.S. and O.D.; resources, E.-G.P. and V.D.; data curation, E.-G.P. and R.A.R.; writing—original draft preparation, E.-G.P., O.D. and S.S.; writing—review and editing, E.-G.P., S.S. and R.A.R. All authors have read and agreed to the published version of the manuscript.
Funding
This research received no external funding.
Institutional Review Board Statement
Not applicable.
Informed Consent Statement
Not applicable.
Data Availability Statement
All generated data is contained in the article or available by request.
DURC Statement
This study is limited to the field of experimental fluid mechanics and optical diagnostics, which aims to improve non-invasive measurement methods for educational and research purposes. The experimental apparatus employs low-energy CO2 propulsion (<2 J) and does not pose any threat to public health or national security. The authors acknowledge the dual-use potential of research involving gas-dynamics testing and confirm that all necessary precautions have been taken to prevent misuse. The authors advocate for responsible deployment of scientific knowledge, ethical research conduct, and transparent reporting to foster beneficial outcomes.
Conflicts of Interest
The authors declare no conflicts of interest.
Abbreviations
The following abbreviations are used in this manuscript:
| BOS | Background-Oriented Schlieren |
| CLAHE | Contrast-Limited Adaptive Histogram Equalization |
| DoG | Difference of Gaussians |
| EFL | Effective Focal Length |
| FFT | Fast Fourier Transform |
| fps | Frames per Second |
| PIV | Particle Image Velocimetry |
| PIVlab | Open-Source MATLAB Toolbox for PIV Analysis |
| ROI | Region of Interest |
| SIV | Schlieren Image Velocimetry |
| SNR | Signal-to-Noise Ratio |
| CO2 | Carbon Dioxide |
| The following symbols are used in this manuscript: | |
| a | Speed of sound (m s−1) |
| ai | Instantaneous acceleration |
| A | Cross-sectional area |
| Cd | Drag coefficient |
| ΔE | Initial energy |
| Δr | Radial displace between frames (m) |
| Δt | Time step between frames (s) |
| Δti | Inter-pulse time spacing between successive wave fronts (s) |
| Δυ | Velocity loss |
| Δy | Median trajectory line |
| Ek | Kinetic energy |
| Fd | Drag force |
| m | Projectile mass |
| r | Radius |
| ri | Radius of detected pressure wave (px) |
| rimm | Radius of detected pressure wave (mm) |
| rmin, rmax | Minimum and maximum search radii for circle detection (px) |
| R | Coefficient of determination |
| Re | Reynolds number |
| ρ | Air density |
| S | Pixel scale (mm px−1) |
| ti | Inferred emission time of wavefront relative to capture (s) |
| TC | Ambient temperature (°C) |
| TK | Ambient temperature (K) |
| υ | Propagation velocity of pressure wave (m s−1) |
| Initial velocity | |
| σlow | Standard deviation of the larger Gaussian kernel (lower frequency) |
| σhigh | Standard deviation of the smaller Gaussian kernel (higher frequency) |
| d | Projectile diameter |
| m | Projectile mass [g] |
| t | time |
| x, y | Coordinates of the image plane [px or mm] |
| U | Projectile velocity |
| UC | Convection velocity of coherent jet structures (m/s) |
| vt | Tangent velocity along vortex boundary (m/s) |
| Vorticity (1/s) | |
| Magnitude of vorticity (1/s) | |
| Ek | Kinetic energy (J) |
| Air/CO2 density (kg/m3) | |
| c | Speed of sound (m/s) |
| Ma | Mach number |
| Re | Reynolds number |
| Cd | Drag coefficient (–) |
References
- Gopalapillai, R.; Kim, H.D.; Setoguchi, T. On the Near-Field Aerodynamics of a Projectile Launched from a Ballistic Range. J. Mech. Sci. Technol. 2007, 21, 1129–1138. [Google Scholar] [CrossRef]
- Zhao, X.Y.; Zhou, K.D.; He, L.; Wang, J.; Zheng, Q. Numerical Simulation and Experiment on Impulse Noise in a Small-Caliber Rifle with Muzzle Brake. Shock Vib. 2019, 2019, 5938034. [Google Scholar] [CrossRef]
- Li, Z.; Wang, H. Mechanism of Evolution of Shock Wave of Muzzle Jet under Initial Interference and Its Simplified Model. Aerospace 2024, 11, 381. [Google Scholar] [CrossRef]
- Zhang, X.; Wang, Y. Comprehensive Review of Multi-Scenario Muzzle Flow Field Dynamics: Mechanisms, Challenges, and Future Perspectives. Phys. Fluids 2025, 37, 081301. [Google Scholar] [CrossRef]
- Tu, X.; Du, P.; Nan, F.; Han, P.; Chen, F. Numerical Investigation on Characteristics of the Muzzle Flow Field at Different Ambient Temperatures. Phys. Fluids 2024, 36, 066113. [Google Scholar] [CrossRef]
- Settles, G.; Brandt, A.; Miller, J. Full-Scale Schlieren Imaging of Shock Waves for Aviation Security Research. In Proceedings of the SPIE Optical Diagnostics in Aviation Security, Sorrento, Italy, 1–4 September 1998. [Google Scholar]
- Settles, G.S. Schlieren and Shadowgraph Techniques: Visualizing Phenomena in Transparent Media; Springer: Berlin/Heidelberg, Germany, 2001. [Google Scholar] [CrossRef]
- Töpler, A. Optische Studien nach der Methode der Schlierenbeobachtung. Ann. Phys. 1867, 207, 33–55. [Google Scholar] [CrossRef]
- Mazumdar, A. Principles and Techniques of Schlieren Imaging Systems; Columbia University: New York, NY, USA, 2013. [Google Scholar] [CrossRef]
- Kleine, H.; Takayama, K. Combined Schlieren and Interferometry Visualization of Blast Waves. Phys. Fluids 2001, 13, S4. [Google Scholar] [CrossRef][Green Version]
- Jin, J.; Mursenkova, I.V.; Sysoev, N.N.; Vinnichenko, N.A.; Znamenskaya, I.A.; Glazyrin, F.N. Experimental Investigation of Blast Waves from Plasma Sheet Using the Background Oriented Schlieren and Shadow Methods. J. Flow Vis. Image Process. 2011, 18, 311–328. [Google Scholar] [CrossRef]
- Thomas, C.J.H.; Johnson, C.E. Investigation into Helmet–Head Shock Wave Interactions at Low Overpressures through Free-Field Blasts and Schlieren Imagery. Shock Waves 2024, 34, 399–412. [Google Scholar] [CrossRef]
- Fujisawa, N.; Fujita, Y.; Yanagisawa, K.; Fujisawa, K.; Yamagata, T. Simultaneous Observation of Cavitation Collapse and Shock Wave Formation in Cavitating Jet. Exp. Therm. Fluid Sci. 2018, 94, 159–167. [Google Scholar] [CrossRef]
- Martí-López, L.; Ocaña, R.; Piñeiro, E.; Asensio, A. Laser Peening Induced Shock Waves and Cavitation Bubbles in Water Studied by Optical Schlieren Visualization. Phys. Procedia 2011, 12, 442–451. [Google Scholar] [CrossRef][Green Version]
- Saravanan, S.; Nagashetty, K.; Hegde, G.M.; Jagadeesh, G.; Reddy, K.P.J. Schlieren Visualization of Shock Wave Phenomena over a Missile-Shaped Body at Hypersonic Mach Numbers. Proc. Inst. Mech. Eng. Part G J. Aerosp. Eng. 2011, 225, 26–34. [Google Scholar] [CrossRef]
- Moumen, A.; Grossen, J.; Ndindabahizi, I.; Gallant, J.; Hendrick, P. Visualization and Analysis of Muzzle Flow Fields Using the Background-Oriented Schlieren Technique. J. Vis. 2020, 23, 409–423. [Google Scholar] [CrossRef]
- Hruschka, R.; Klatt, D.; Leopold, F. Different Methods for Density Gradient Visualization within Transient Gun Muzzle Flow Fields in Comparison. In Proceedings of the 18th International Symposium on Flow Visualization, Zurich, Switzerland, 26–29 June 2018. [Google Scholar] [CrossRef]
- Steward, B.; Gross, K.; Perram, G. Optical Characterization of Large-Caliber Muzzle Blast Waves. Propellants Explos. Pyrotech. 2011, 36, 387–394. [Google Scholar] [CrossRef]
- Schwartz, M.J.; Schmisseur, J.D. Characterization of Near-Muzzle Ballistic Flow Fields Using High-Speed Shadowgraphy. In Proceedings of the AIAA Scitech 2019 Forum, San Diego, CA, USA, 7–11 January 2019. [Google Scholar] [CrossRef]
- Settles, G.S.; Grumstrup, T.P.; Dodson, L.J.; Miller, J.D.; Gatto, J.A. Full-Scale High-Speed Schlieren Imaging of Explosions and Gunshots. In Proceedings of the 26th International Congress on High-Speed Photography and Photonics, Alexandria, VA, USA, 7–12 March 2005; Paisley, D.L., Kleinfelder, S., Snyder, D.R., Thompson, B.J., Eds.; SPIE: Bellingham, WA, USA, 2005; p. 60. [Google Scholar] [CrossRef]
- Moumen, A.; Laboureur, D.; Gallant, J.; Hendrick, P. Quantitative Investigation of Ballistics Flow Fields by Background-Oriented Schlieren Technique. J. Phys. Conf. Ser. 2023, 2478, 062006. [Google Scholar] [CrossRef]
- Roohani, H.; Gledhill, I.M.A.; Mahomed, I.; Skews, B.W. Bow Shock Stand-Off Distance for Subsonic Decelerating Bodies. Shock Waves 2020, 30, 115–129. [Google Scholar] [CrossRef]
- Wu, Y.C.; Chang, H.; Tsung, T.T. Characteristics of Supersonic Projectile Shock Wave. Adv. Mater. Res. 2011, 201–203, 2571–2577. [Google Scholar] [CrossRef]
- Brouillette, M. Shock Waves at Microscales. Shock Waves 2003, 13, 3–12. [Google Scholar] [CrossRef]
- Li, S.; Ukeiley, L.S. Experimental Investigation of the Fluctuating Static Pressure in a Subsonic Axisymmetric Jet. Int. J. Aeroacoust. 2021, 20, 196–220. [Google Scholar] [CrossRef]
- Edmund Optics. Precision Parabolic Mirrors. Available online: https://www.edmundoptics.com/f/precision-parabolic-mirrors/11895/ (accessed on 15 September 2025).
- Edmund Optics. LS-W1 Datasheet. Available online: https://www.edmundoptics.com/p/ls-wl1-laser-driven-white-light-source-kit/49417/?srsltid=AfmBOoqgSmOryb7OlsxNI5Bnmx3mNm66CwZCopG8PN2bEXrdmVCtQmCs (accessed on 15 September 2025).
- Vision Research. Phantom VEO 710 High-Speed Camera Datasheet; Rev. 3; Vision Research: Wayne, NJ, USA, 2023; Available online: https://komiweb.co.kr/2015/images/data/DS_WEB-VEO710.pdf (accessed on 15 September 2025).
- Tamron. SP AF 70–200 mm F/2.8 Di LD (IF) Macro Review. Available online: https://www.dpreview.com/reviews/tamron-70-200-2p8-c16/6 (accessed on 15 September 2025).
- Wikipedia. Airsoft Gun. Available online: https://en.wikipedia.org/wiki/Airsoft_gun (accessed on 23 September 2025).
- Thielicke, W.; Stamhuis, E.J. PIVlab—Particle Image Velocimetry (PIV) Tool with GUI. MathWorks File Exchange. Available online: https://www.mathworks.com/matlabcentral/fileexchange/27659-pivlab-particle-image-velocimetry-piv-tool-with-gui (accessed on 10 September 2025).
Disclaimer/Publisher’s Note: The statements, opinions and data contained in all publications are solely those of the individual author(s) and contributor(s) and not of MDPI and/or the editor(s). MDPI and/or the editor(s) disclaim responsibility for any injury to people or property resulting from any ideas, methods, instructions or products referred to in the content. |
© 2025 by the authors. Licensee MDPI, Basel, Switzerland. This article is an open access article distributed under the terms and conditions of the Creative Commons Attribution (CC BY) license (https://creativecommons.org/licenses/by/4.0/).