Article

Numerical Investigation of NASA SC (2)-0714 Airfoil Icing in a Supersonic Flow

Department of Applied Mathematics, Nizhny Novgorod State Technical University n.a. R.E. Alekseev, 603155 Nizhny Novgorod, Russia
*
Author to whom correspondence should be addressed.
Fluids 2025, 10(10), 260; https://doi.org/10.3390/fluids10100260
Submission received: 27 August 2025 / Revised: 26 September 2025 / Accepted: 30 September 2025 / Published: 5 October 2025
(This article belongs to the Special Issue High-Speed Processes in Continuous Media)

Abstract

Modern software systems have implemented calculation techniques that allow numerical modeling of the icing of various aerodynamic objects and show themselves well when modeling the icing of objects at subsonic speeds. This paper describes a technique that is used to solve the problem of icing the profile of a NASA SC (2)-0714 airfoil streamlined by a supersonic gas stream. A feature of modeling this class of problems is the consideration of factors that arise when moving at high speeds: at supersonic flight speed, aerodynamic heating of the surface above 0 °C is observed, which is accompanied by a high intensity of impinging supercooled water droplets on this surface. The results of the numerical solution of the NASA SC (2)-0714 airfoil icing problem showed that even at a positive airfoil surface temperature, ice shapes can grow at the leading edge due to intense deposition of supercooled droplets.

1. Introduction

Icing leads to deterioration of the aerodynamic characteristics of the aircraft, which can result in premature stalling and loss of control, and it also disrupts the operation of control systems, causing jamming of controls and distortion of sensor readings. The icing process depends significantly on the altitude of the flight, the speed, and the type of clouds encountered, each of which creates unique conditions for the formation of ice.
Supersonic aircraft can be operated in a wide range of altitudes—from the surface layers to the stratosphere (above 20,000 m). At an altitude of 6000 to 13,000 m (upper layer of clouds), icing is practically not observed due to the low moisture content in the atmosphere [1]. Basically, ice buildup on the lifting surfaces of the aircraft occurs at low altitudes (less than 6000 m), when the air contains a large number of supercooled water droplets [2]. However, there are powerful cumulonimbus clouds that, with highly developed thunderstorm activity in the troposphere, can reach the stratosphere boundary (up to 16,000 m) [1,3].
According to FAR 25 [3] aircraft flight is allowed at supersonic speed, at levels no less than 11,100 m, and at lower altitudes (levels) in special zones. At supersonic flight speeds, strong heating of the streamlined surface is observed, at which icing should not occur. However, if sufficient supercooled water droplets or ice crystals are present in the atmosphere, icing becomes possible, even at a positive aircraft surface temperature [1,2,3,4,5]. Severe icing can lead to critical consequences, including loss of control of the aircraft, engine failure, or malfunctions of the life support system. Even a short flight in the clouds or in the precipitation zone at supersonic speed can lead to a faster increase in ice and a sharp deterioration in the aerodynamic characteristics of the aircraft, in comparison with subsonic modes.
The introduction of numerical modeling in the design process to find the optimal tactical and technical characteristics reduces the development time, cost, scope of experimental studies, and flight tests, and simplifies the introduction of changes in the design of the aircraft (LA) that are still under development [6]. Numerical modeling of icing is an increasingly important aspect of engineering design and safety.
In the literature, Lei and Zha [7], Welge, Nelson and Bonet [8], and Yousuf and Kamal [9] present studies on the effect of incoming supersonic flow velocity on aerodynamic characteristics of airfoils. These studies allow us to determine critical angles of attack and evaluate the effectiveness of using these profiles in the design of supersonic aircraft. Icing studies of supersonic aircraft are currently almost non-existent and are a relatively understudied area. It is generally accepted that due to the high heating of aerodynamic surfaces at speeds above 1000 km/h, icing does not occur [3]. Nevertheless, with sufficient water content, icing is likely for supersonic aircraft [3]. In this regard, conducting numerical studies of the icing of objects moving at supersonic speed will allow testing of the methodology and will be useful in the design of new aircraft and in the refinement of those already created.

2. Computational Approach

In the LOGOS engineering analysis and supercomputer modeling software package version 5.3.24, refs. [10,11,12] implemented a method for solving the Navier–Stokes equations, supplemented by equations of motion of water droplets, water film and geometric algorithms of grid motion. This technique is used to numerically solve aerodynamics problems, taking icing into account, and is a phased approach. At the first stage, the three-dimensional system of Navier–Stokes equations is solved [13], which simulates the motion of gas in the calculated region. In addition to this, for simulating the motion of water droplets within the computational domain, the system of equations [14,15] is solved using the Eulerian approximation. At the next stage, the equations of motion of water films on the solid surface of the object under study are solved [16]. According to the results of this stage, the parameters of ice growth are determined. The next step is to transform the icy surface and use the IDW (Inverse Distance Weighting) method [17]. After the transformation of the surface of the simulation model, the presented steps can be repeated until they reach the final point in time set by the user. At each stage, the results from the previous one are used. The equations of the described steps are presented in part below and are used in solving aerodynamics problems, taking icing into account.

2.1. Equations for Aerodynamic Flow and Turbulence

The Reynolds-averaged Navier–Stokes (RANS) equations [10,18,19,20,21] are used for numerical modeling of aerodynamic flow characteristics in the computational domain. In their conservative form, in Cartesian coordinates, the equations are as follows (averaging signs are omitted):
ρ t + ρ u = 0 , ρ u t + ρ u u = p + τ μ + τ t , ρ E t + ρ u H = u τ μ + τ t q μ + q t .
In system (1), the following conventional notations are employed: ρ is density, u is the velocity vector with components u, v, w and p is pressure, E = CνT + 0.5(u2 + v2 + w2) is total gas energy, H = CpT + 0.5(u2 + v2 + w2) is total gas enthalpy, τμ and τt are molecular and turbulent stress tensors, qμ and qt are molecular and turbulent heat flux densities, T is temperature, Cν = (CpTR/m) is specific heat capacity at constant volume, Cp is specific heat capacity at constant pressure, R is the universal gas constant, and m is the molar mass of the gas.
System (1) is supplemented with different types of boundary conditions: free boundary, outflow, symmetry, periodicity, and wall conditions. A detailed description of the boundary conditions can be found in [20]. To solve the Navier–Stokes equations numerically, we use the finite volume method (FVM) [20,21,22].
The system of Equation (1) is not closed, due to the unknown connection of one of the main variables of this system, τt and qt, and the average flow parameters. To close the system of equations, the Boussinesq hypothesis is used, according to which a linear relationship is established between the gradients of the averaged velocity by the introduction of turbulent viscosity μt, which is calculated using various turbulence models. In this study, the standard k-ω SST model presented in the classic form in [23] is used to account for turbulence. The limitations of this method can be manifested in some inaccurate prediction of the separation and reconnection zones of the flow, as well as in the assessment of the level of turbulence in these areas.

2.2. Equations for Motion of Liquid Droplet as a Continuous Medium in a Gas Flow

The calculated fields obtained in the previous step are used in numerical modeling of the motion of water droplets. To numerically model the motion of liquid droplets in the calculated area in the form of a continuous medium, an Eulerian approach is used, in which the distributions of gas-dynamic fields are taken as input data. This calculation is performed after each iteration of solving the system of Equation (1) by solving the system of water volume fraction, particle velocity, and temperature equations [14,15].
α t + · α u w = 0 , α u w t + u w α u w = C D Re d 24 K u a u w + ( 1 ρ a ρ w ) 1 F r 2 g , α T w t + · α u w T w = 0 ,
where α is defined as the volume fraction of water, u w is the velocity of droplets, u a is the carrier phase velocity (the aerodynamic flow is determined from Equation (1)), CD is a drag coefficient, Red is the droplets Reynolds number, ρ a is density of air, ρ w is density of the liquid phase, Fr = U/√ L g ¯ is the Froude number, U is the speed of air at freestream, L is the characteristic length (typically the airfoil chord length), K = ρ d 2   U / 18 L μ is an inertia parameter, μ is the dynamic viscosity of air, Tw is the temperature of the continuum phase; and g is the gravity vector.
Due to adiabatic compression and an increase in flow density in the region of the stagnation point, the gas temperature increases. However, due to the limited heat transfer rate, the temperature of the supercooled water droplets may not correspond to the ambient temperature at a high water content or at high ram-stream speeds. This physical effect must be taken into account when undertaking numerical modeling of icing at supersonic speeds. To do this, the system of equations of motion of liquid droplets uses the temperature transfer equation.
This system of Equation (2) must be supplemented by boundary conditions. In general, we use three main types of boundary conditions for the liquid phase: inflow boundary conditions, outflow boundary conditions, and impermeable boundary. For the inflow and outflow boundaries, a boundary condition of the first kind is used, for which parameter values are set as constants, functions, and tables. In the icing problem, such parameters include the velocity and temperature of the carrier phase, the volume fraction, and diameter of water droplets.
Ice accretion occurs on those areas of the surface where liquid droplets fall in sufficient quantities and a water film is formed. To determine the parts of the surface most susceptible to the impingement of droplets, the collection efficiency of liquid droplets upon collision with the surface is introduced. This parameter characterizes the ability of the considered surface area to collect water and is defined as the local mass flux of water onto the airfoil surface, normalized by the product of the velocity and volume fraction of water in the liquid phase at the inflow boundary [14]:
β = α ρ w u i L W C U S i S i ,
where α is the volume fraction of droplets, LWC is liquid water content, U is speed of air at free stream, and Si is the local area normal.

2.3. Equations for Water Film Motion over Solid Surface and Compatibility Relations

To calculate the collection efficiency of the liquid phase (the forming water film) on a solid surface, we calculate the mass, momentum, and temperature of the droplets, which are used in the equation of motion of the liquid film, called the Shallow-Water Icing Model (SWIM) [16] and written as follows:
ρ w h f t + div u ¯ f h f = m ˙ d m ˙ e v a p m ˙ i c e , ρ w h f c p , w T ˜ t + div u ¯ f h f c p , w T ˜ = c p , w T ˜ d + u d 2 2 m ˙ d 0.5 L e v a p + L s u b m ˙ e v a p + L f u s c p , i c e T ˜ m ˙ i c e + Q ˙ c o n v + Q ˙ c o n d ,
where ρ w is the water density, h f is film thickness, u ¯ f is the speed of motion of the film in the direction x, m ˙ d is the mass flow entering the control volume as a result of impinging droplets, m ˙ e v a p is evaporation/sublimation flow, m ˙ i c e is the mass flow leaving the control volume as a result of freezing, c p , w is specific heat of water, T ˜ is scaled temperature (=TTref), T ˜ d is scaled temperature of supercooled droplets, u d is impact droplet velocity, L e v a p is evaporation latent heat of water, L s u b is sublimation latent heat of ice, L f u s is fusion latent heat of ice, Q ˙ c o n v is convective heat flux from air, and Q ˙ c o n d is conductive heat flux from structure.
There are three unknown parameters in the system of Equation (4): the film thickness h f , the equilibrium temperature T ˜ of the air/film/ice/wall interface, and the icing mass flux m ˙ i c e , so additional compatibility relations are needed to close this system. The way the compatibility relations are written, based on the experimental observations in [16], is the following:
h f 0 ,     m ˙ i c e 0 ,   h f T ˜ 0 ,     m ˙ i c e T ˜ 0
In accordance with (5), the systems of nonlinear Equation (4) are divided into three modifications:
Modification I:   m ˙ i c e = 0 ,   h f > 0 ,     T ˜ > 0 ;
Modification II: T ˜ = 0 ,     T = T 0 ,     m ˙ i c e > 0 ,     h f > 0 ;
Modification III: h f = 0 ,     T ˜ < 0 ,     m ˙ i c e > 0   .
For each of the options, a different system of nonlinear equations is used, and sampled according to an explicit scheme.

2.4. Model Surface Motions

The next step is to calculate the ice formed on the surfaces of the models. Based on the mass of the ice buildup, by using motion algorithms [11], new coordinates of nodes on the surface of the calculated model are determined, after which it is deformed. Algorithms of motion are based on the IDW (Inverse Distance Weighting) method [17,24], which refers to methods for direct interpolation of control node displacements. This method is based on an interpolation function of the following form:
s ( x ) = w i ( x ) s j ( x ) w j ( x )
w j ( x ) = A j L x x b j a + α L x x b j b ,
where w i ( x ) —there is a weight function, s j ( x ) —is determined not only by the displacement of the j-th boundary node, but also by the position of the point x for which the displacement is calculated, A j —node weight proportional to the area of its surrounding faces, L is the characteristic area size, αL—the scale of the boundary region, a and b are some exponents.
A more detailed description of the method is presented in [10,11,17,24].

3. Numerical Simulation

Yousuf and Kamal [9] and Xu et al. [25] present the results of numerical modeling of the flow of subsonic and supersonic flow of the ideal gas of the NASA SC (2)-0714 airfoil [26] and the similar NASA SC (2)-1010 airfoil without taking icing into account. Statement of tasks from these works will be used in numerical modeling of tasks, the results of which will be presented below.
The procedure presented in Section 2 is used for numerical modeling of aerodynamics and icing problems. NASA SC (2)-0714 airfoil, the general view of which is shown in Figure 1, is used as the studied model.
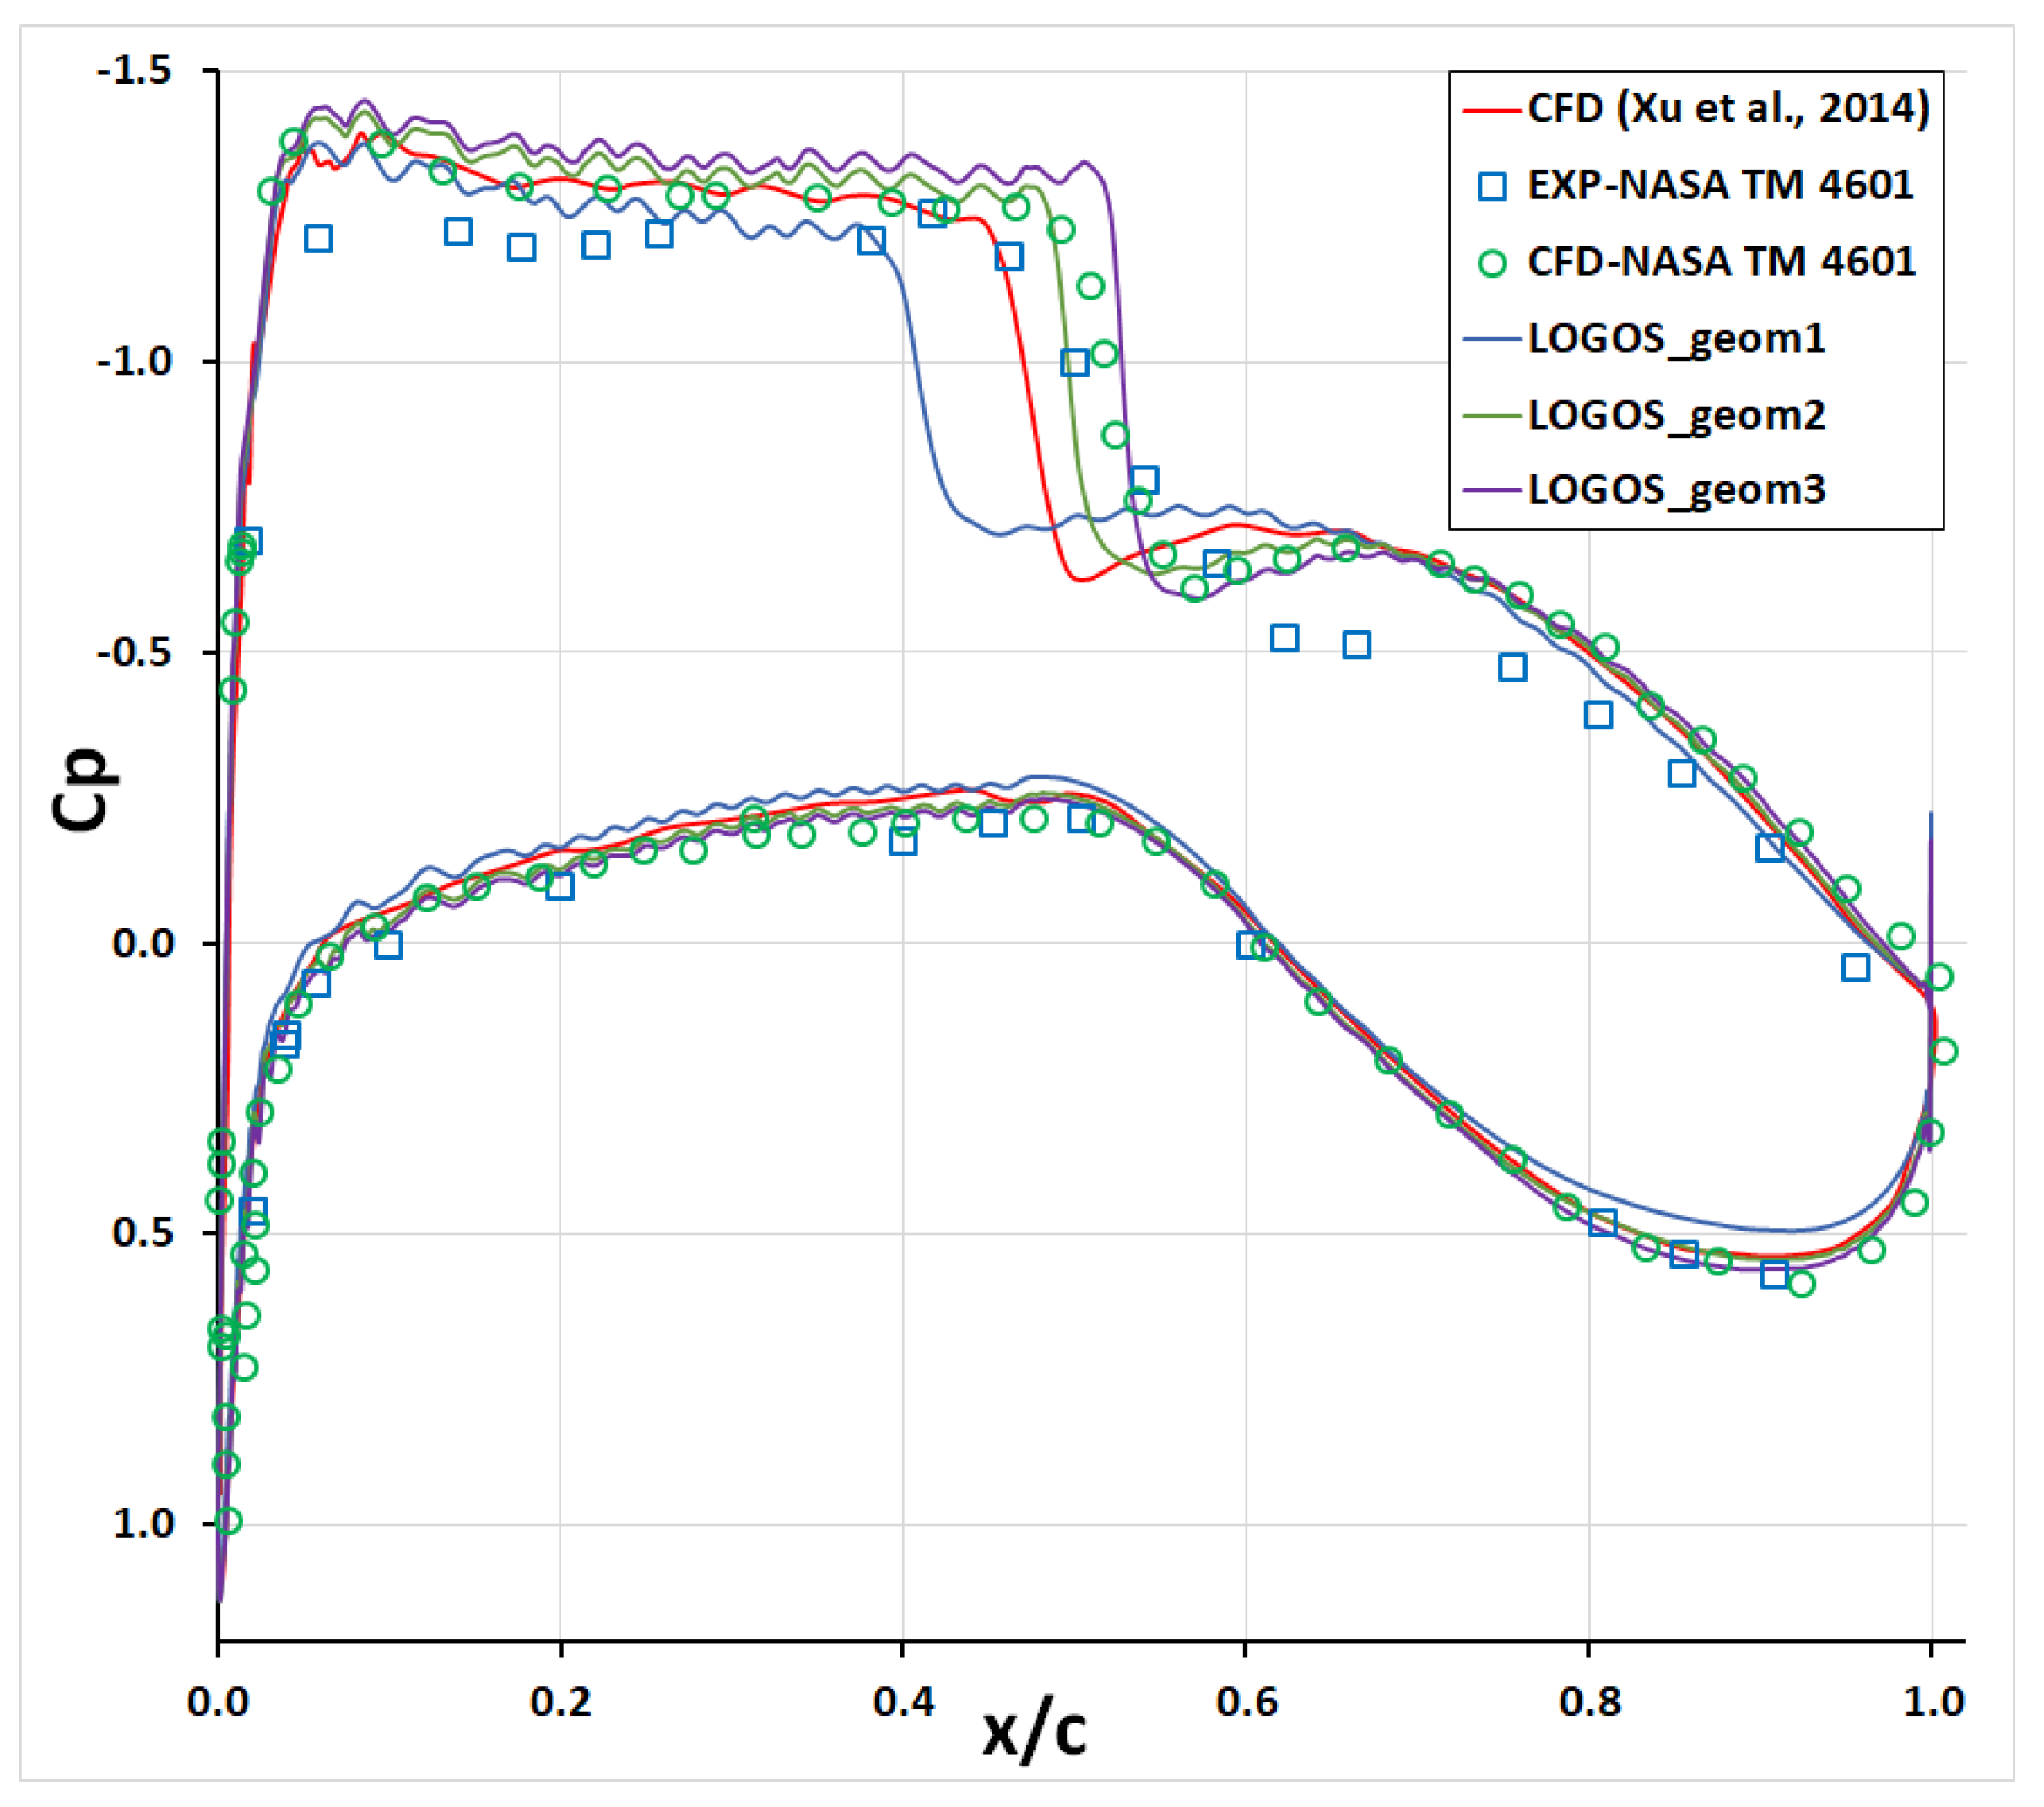
The chord length of the NASA SC (2)-071 airfoil is 0.25 m. The aerodynamic profile is positioned at a distance of 25 chord lengths from the external walls to minimize the influence of disturbances originating from them. Within this study, mesh independence verification was conducted. Results for both the wall–film transition and icing phases depend on the numerical solution of the aerodynamic problems. A total of three mesh models were utilized, with cell counts of 72, 95, and 150 thousand. The average size of a concentrated cell on the leading edge of the wing is 2 × 10⁻³, 1 × 10⁻³, and 1 × 10⁻³ m, respectively. The dimensionless distance from the wall to the first mesh cell is Y+≈1. This requirement stems from the need to deform the mesh model effectively. With a sufficiently coarse mesh, inaccurate solution results will be obtained. Conversely, with a sufficiently fine mesh, issues related to mesh deformation arise. Figure 2 illustrates the pressure coefficient distribution on the wing for various mesh models generated during the solution of the first case outlined in Table 1.
Figure 2 show the following data: CFD is numerical calculation data presented in the work Xu et al. [25]; EXP-NASA TM 4601is experimental data from [25,26]; CFD-NASA TM 4601is numerical calculation data from the work [25]; LOGOS_geom1 and others—data obtained using the LOGOS software package (geom1, geom2, geom3—variants of grid models used to assess the convergence of numerical calculations). As depicted in Figure 2, convergence is achieved using a mesh model consisting of 95,000 cells. Therefore, all subsequent calculations will be performed with this mesh model—one containing 95,000 cells. The thickness of the mesh along the Oz axis is 1 cell. In anticipated locations where shock waves are expected to form, the mesh has been thickened. This is necessary to ensure greater accuracy in the computations. The average size of a concentrated cell at the thickening point is 0.001 m. The mesh consists of unstructured cells constructed using quadrilateral elements. Ten prism-shaped cells representing the boundary layer were positioned in the region of the model surface. As illustrated in Figure 2, the distribution of the pressure coefficient on the upper wing surface exhibits waviness when simulated using LOGOS. This is due to a mesh effect, specifically related to the grid resolution of the boundary layer (Y+ ~ 1). Table 1 shows the parameters of the tasks to be solved.
In cases No 1 and No 2, only stationary tasks are solved for verification of gas-dynamic calculations, which are the main ones in the design icing method. In cases No 3 and No 4, aerodynamics and icing problems are solved. Icing tasks are solved in three stages:
-
The first stage models the viscous compressible flow using the Reynolds-averaged Navier–Stokes equations. Turbulent flows are incorporated using the equations of the k-ω SST model. At the same stage, the motion of liquid droplets in the form of a continuous medium is simulated using the Euler equation system. The continuum droplets are assumed to have no effect on the gas flow and to have a size of 20 µm [3];
-
The second stage models the motion of the water film on the solid surface using the results of the first stage;
-
The third stage involves deformation of the computational model surface at ice accretion locations. Numerical discretization on the equations is performed by the finite volume method on arbitrary unstructured grids, which is a specific feature of numerical discretization of the equations.
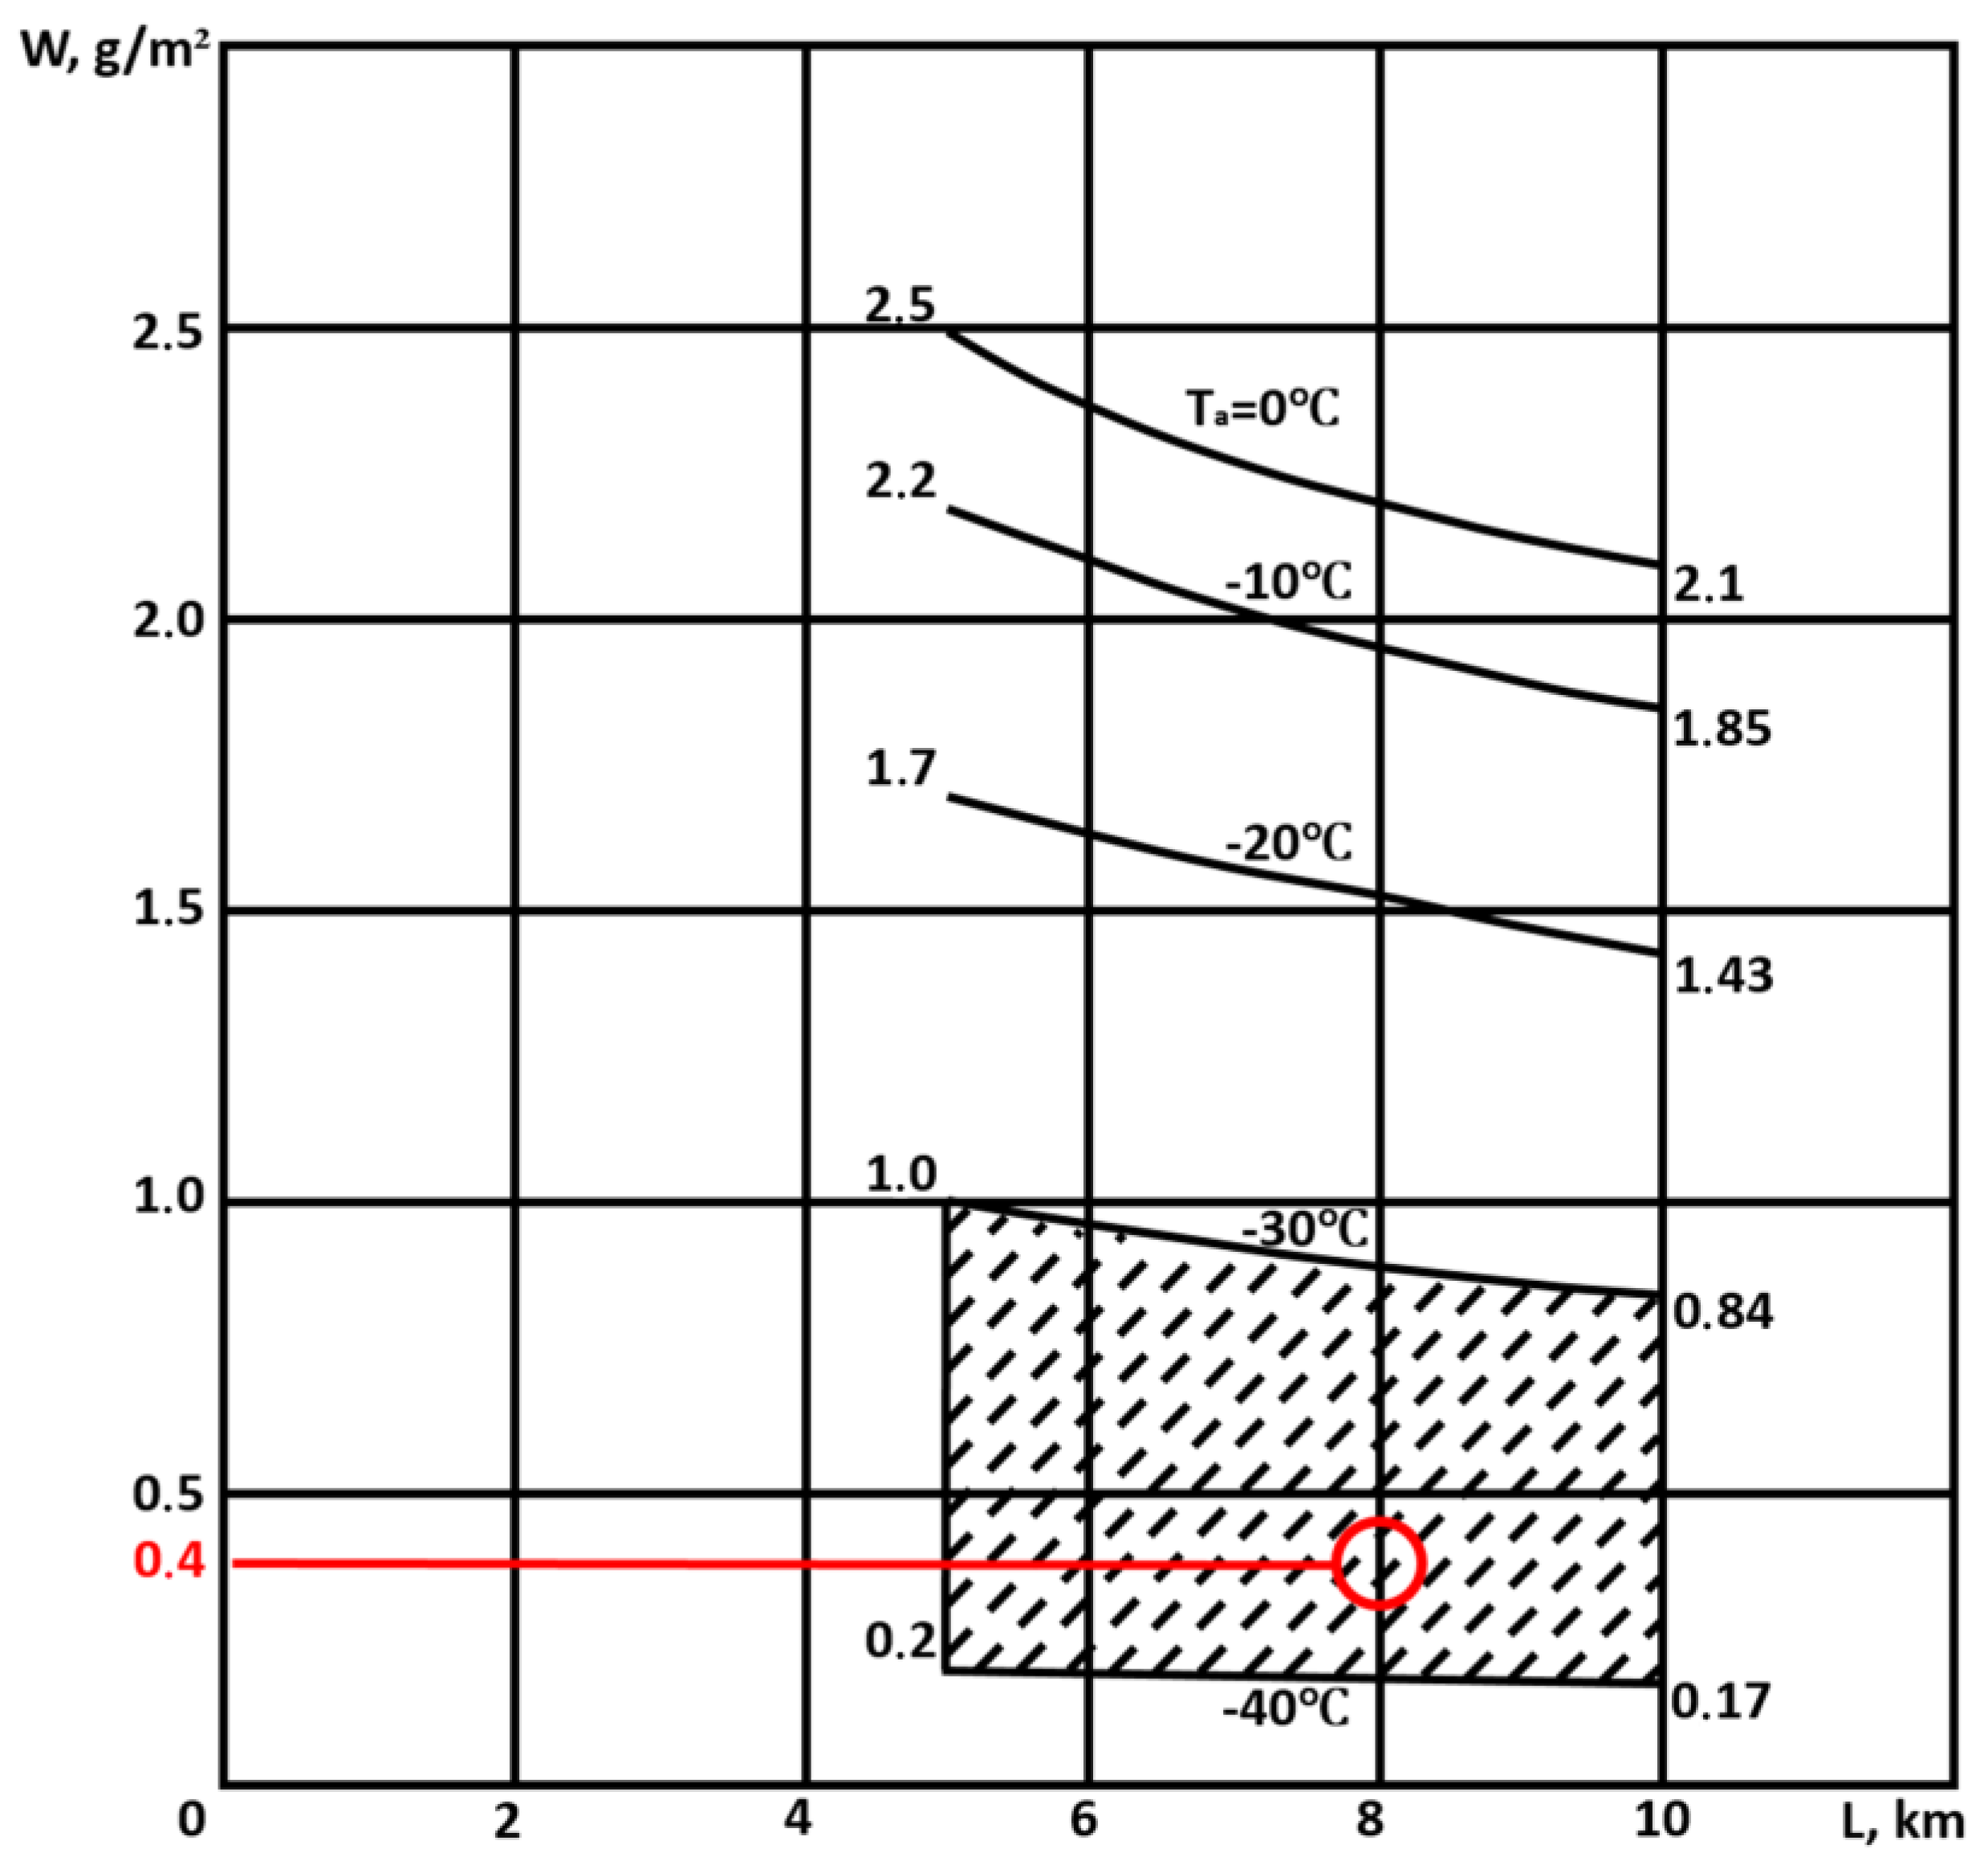
The liquid water content in the icing problem is 0.4 g/m3. This value of water content is marked with a red circle in the diagram of water content dependence on flight altitude, shown in Figure 3 [3]. Specifically, this value is equal to the intermittent maximum icing at a horizontal extent from 5000 to 10,000 m at an outside air temperature of 246.25 °K (−36.9 °C) and an altitude of 8000 m.
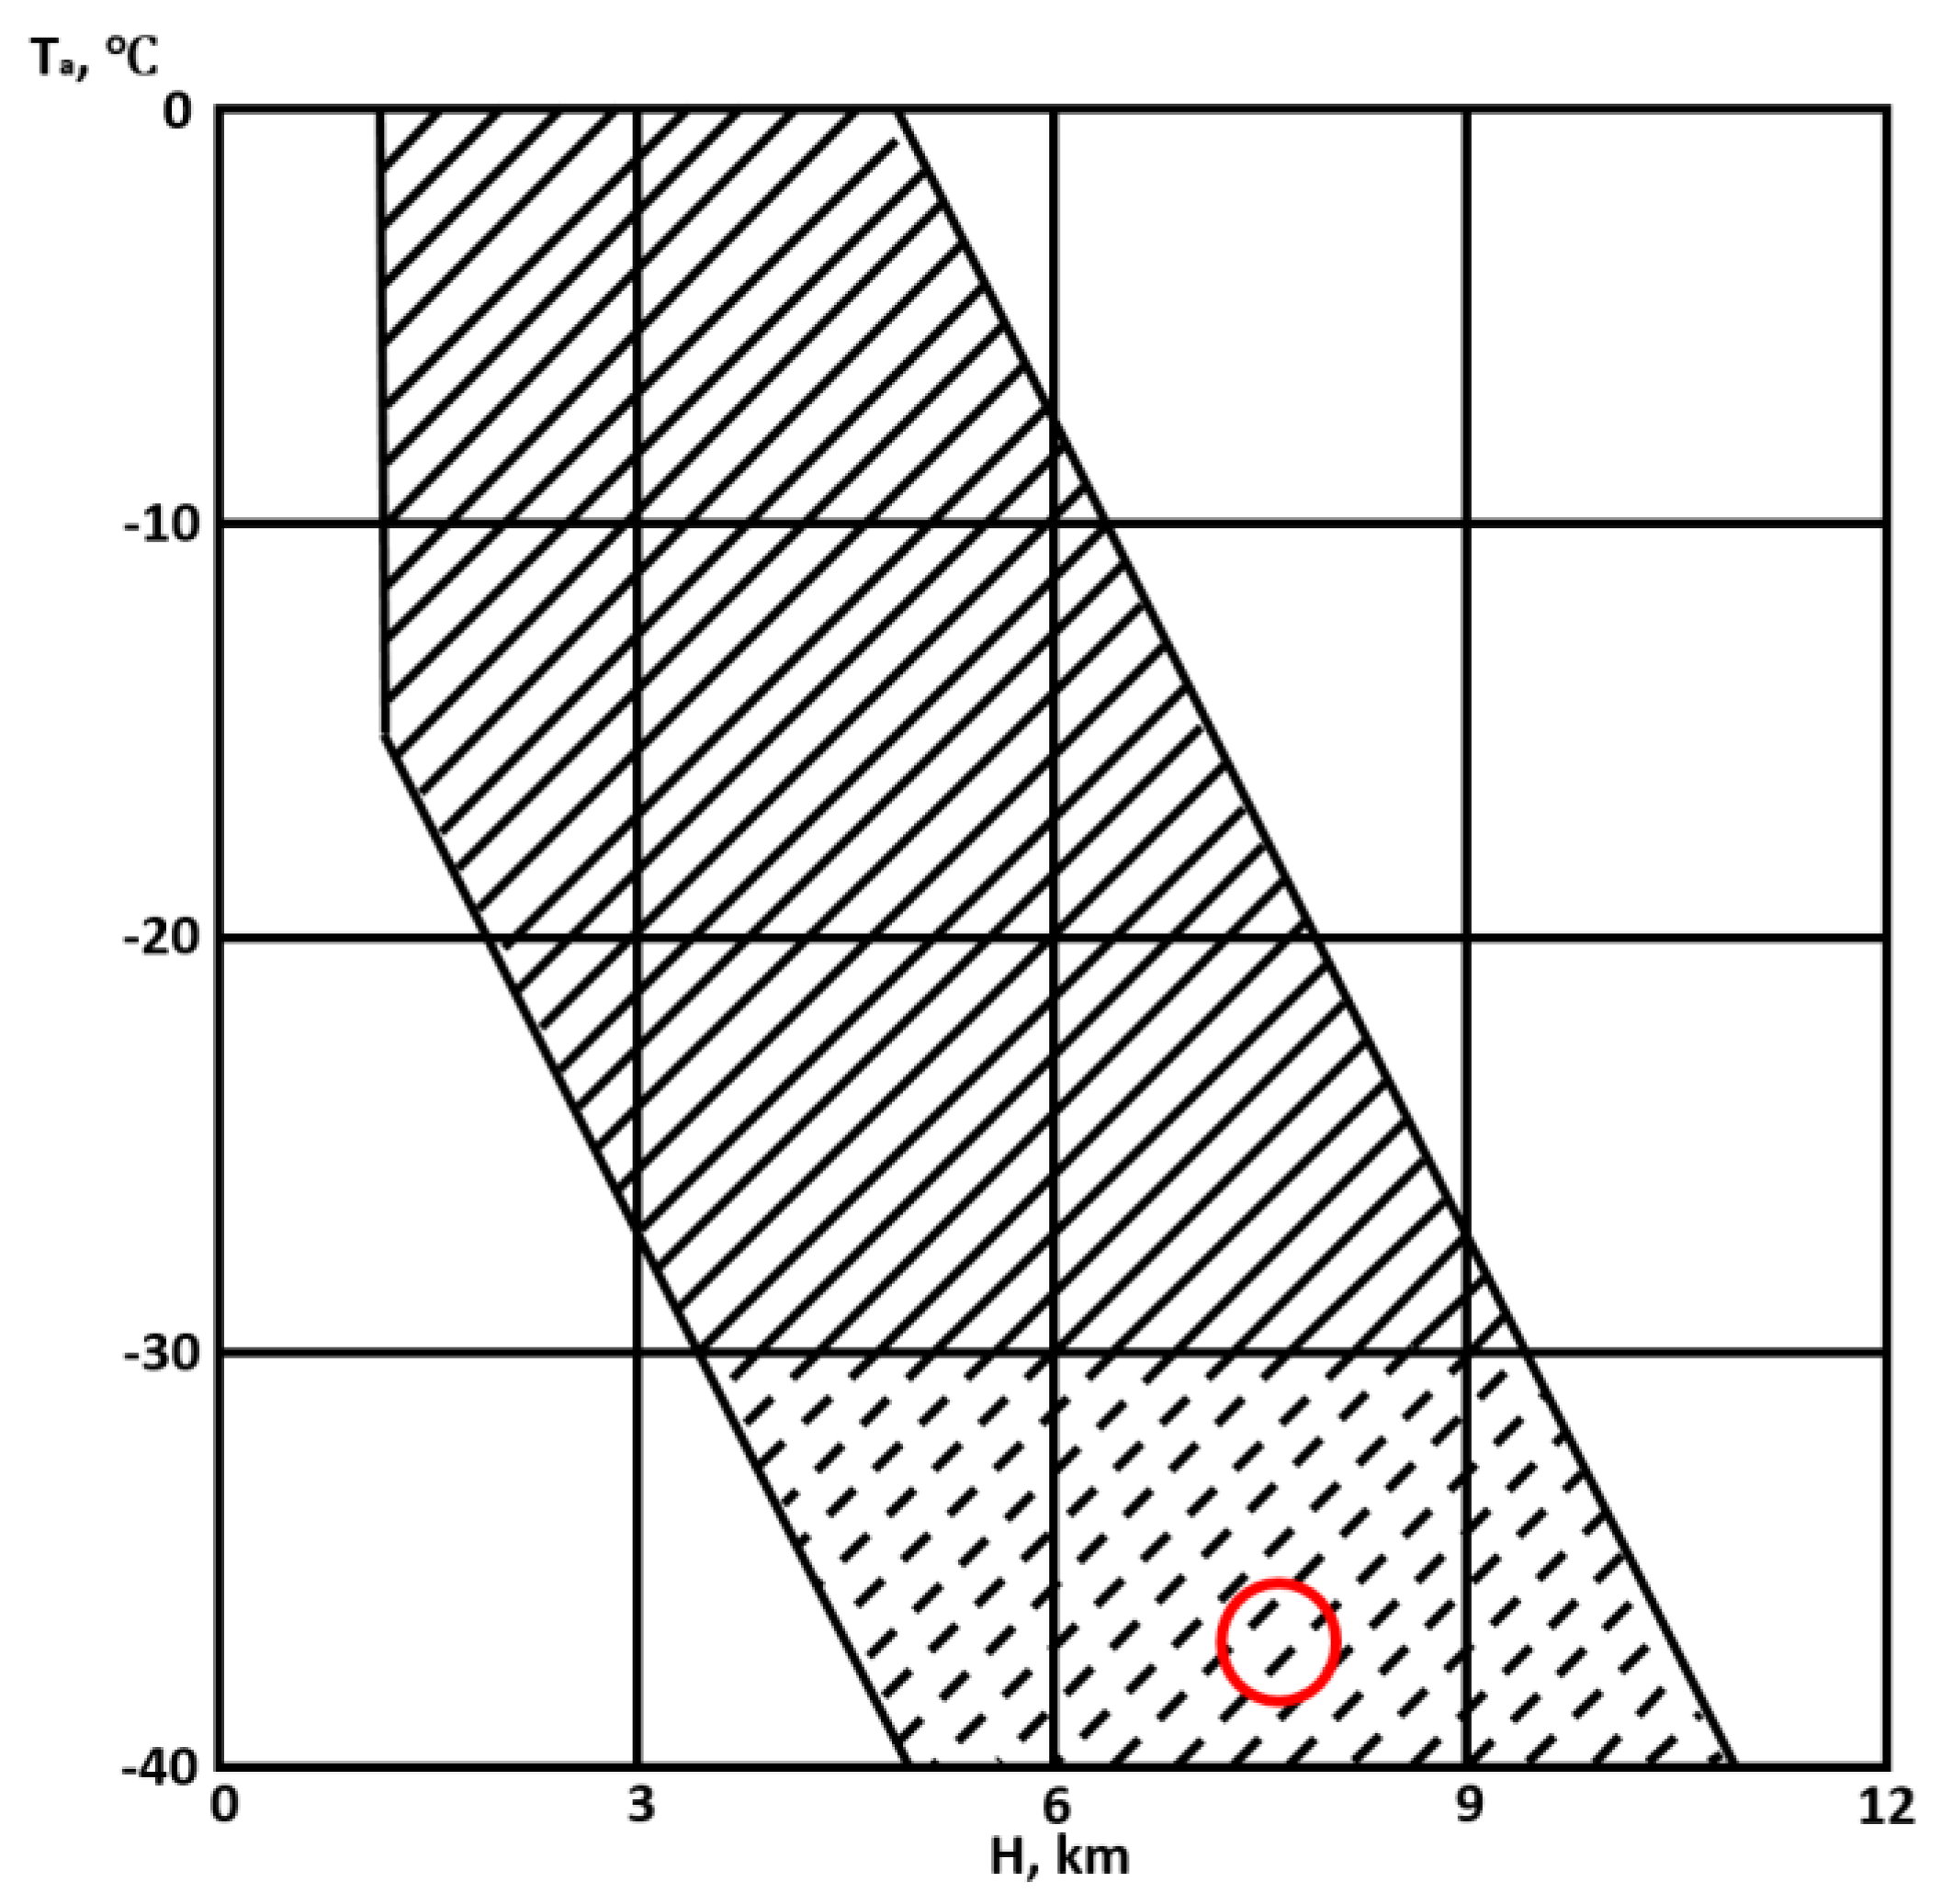
Figure 3 shows a shaded area where there is a risk of icing, but it is poorly studied [3]. The icing time in tasks 3 and 4 was set to 27 s (this time was used on the assumption that at a speed of Mach 1.2, the icing zone of approximately 10,000 m will be covered [3]). According to the schedule of possible icing zones from [3], presented in Figure 4, at the selected parameters of tasks, numerical modeling should occur during the icing of the streamlined profile of the NASA SC (2)-0714 airfoil. The area with the selected parameters is shown in Figure 4 by a red circle.
In Figure 4, the red circle marks the simulated icing regime (incoming flow temperature 246.25, altitude 8000 m) of the airfoil profile moving at supersonic speed.
All simulations were performed using the LOGOS software package intended for computational fluid dynamics simulations on arbitrary unstructured grids. LOGOS has undergone rigorous verification [19,20] and demonstrated robust performance across various hydrodynamic problems, including turbulent and geophysical flow simulations [10,12].

4. Result and Discussion

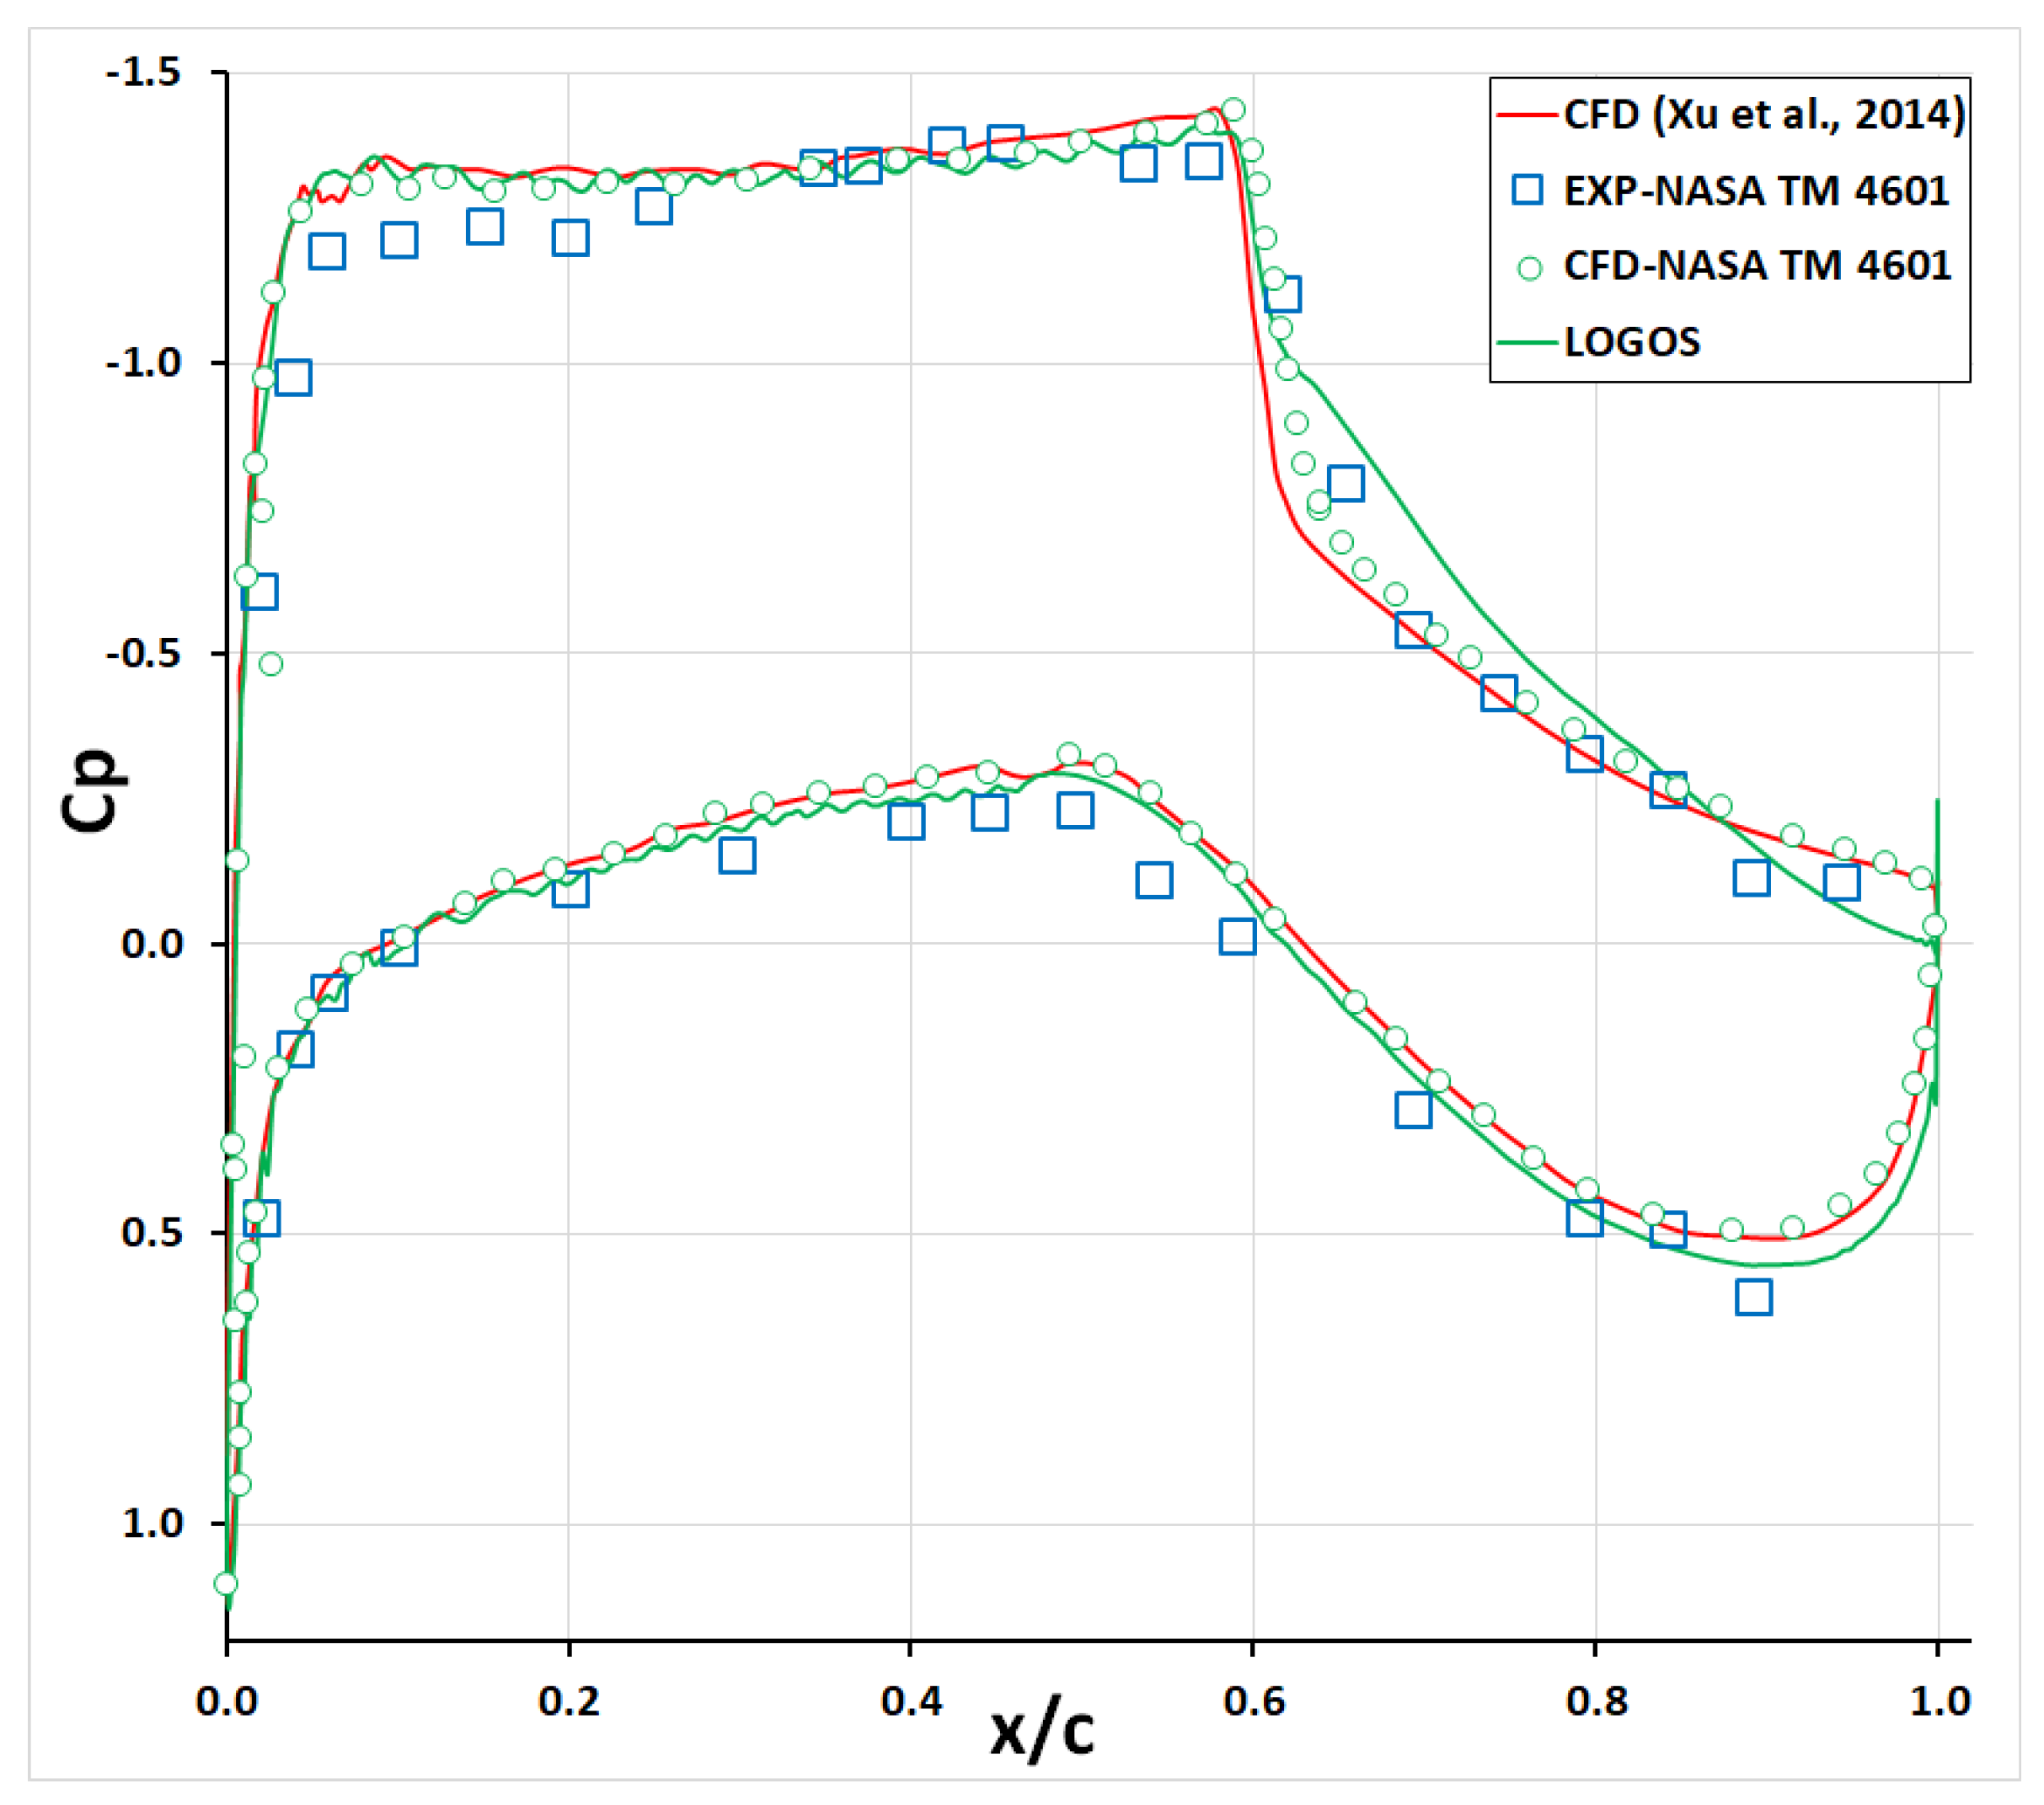
To analyze the results of steady-state flow of subsonic flow at Mach numbers of 0.7055 and 0.74 (cases No 1 and No 2), Figure 5 and Figure 6 show the distributions of pressure coefficients for the NASA SC (2)-0714 airfoil.
As can be seen from Figure 5 and Figure 6, the grid model used provides a good correspondence of the distribution of the pressure coefficient on the wing with experimental data [25] and the results of numerical calculations. The obtained difference in the place of the end of the shock wave will not affect icing airfoil.
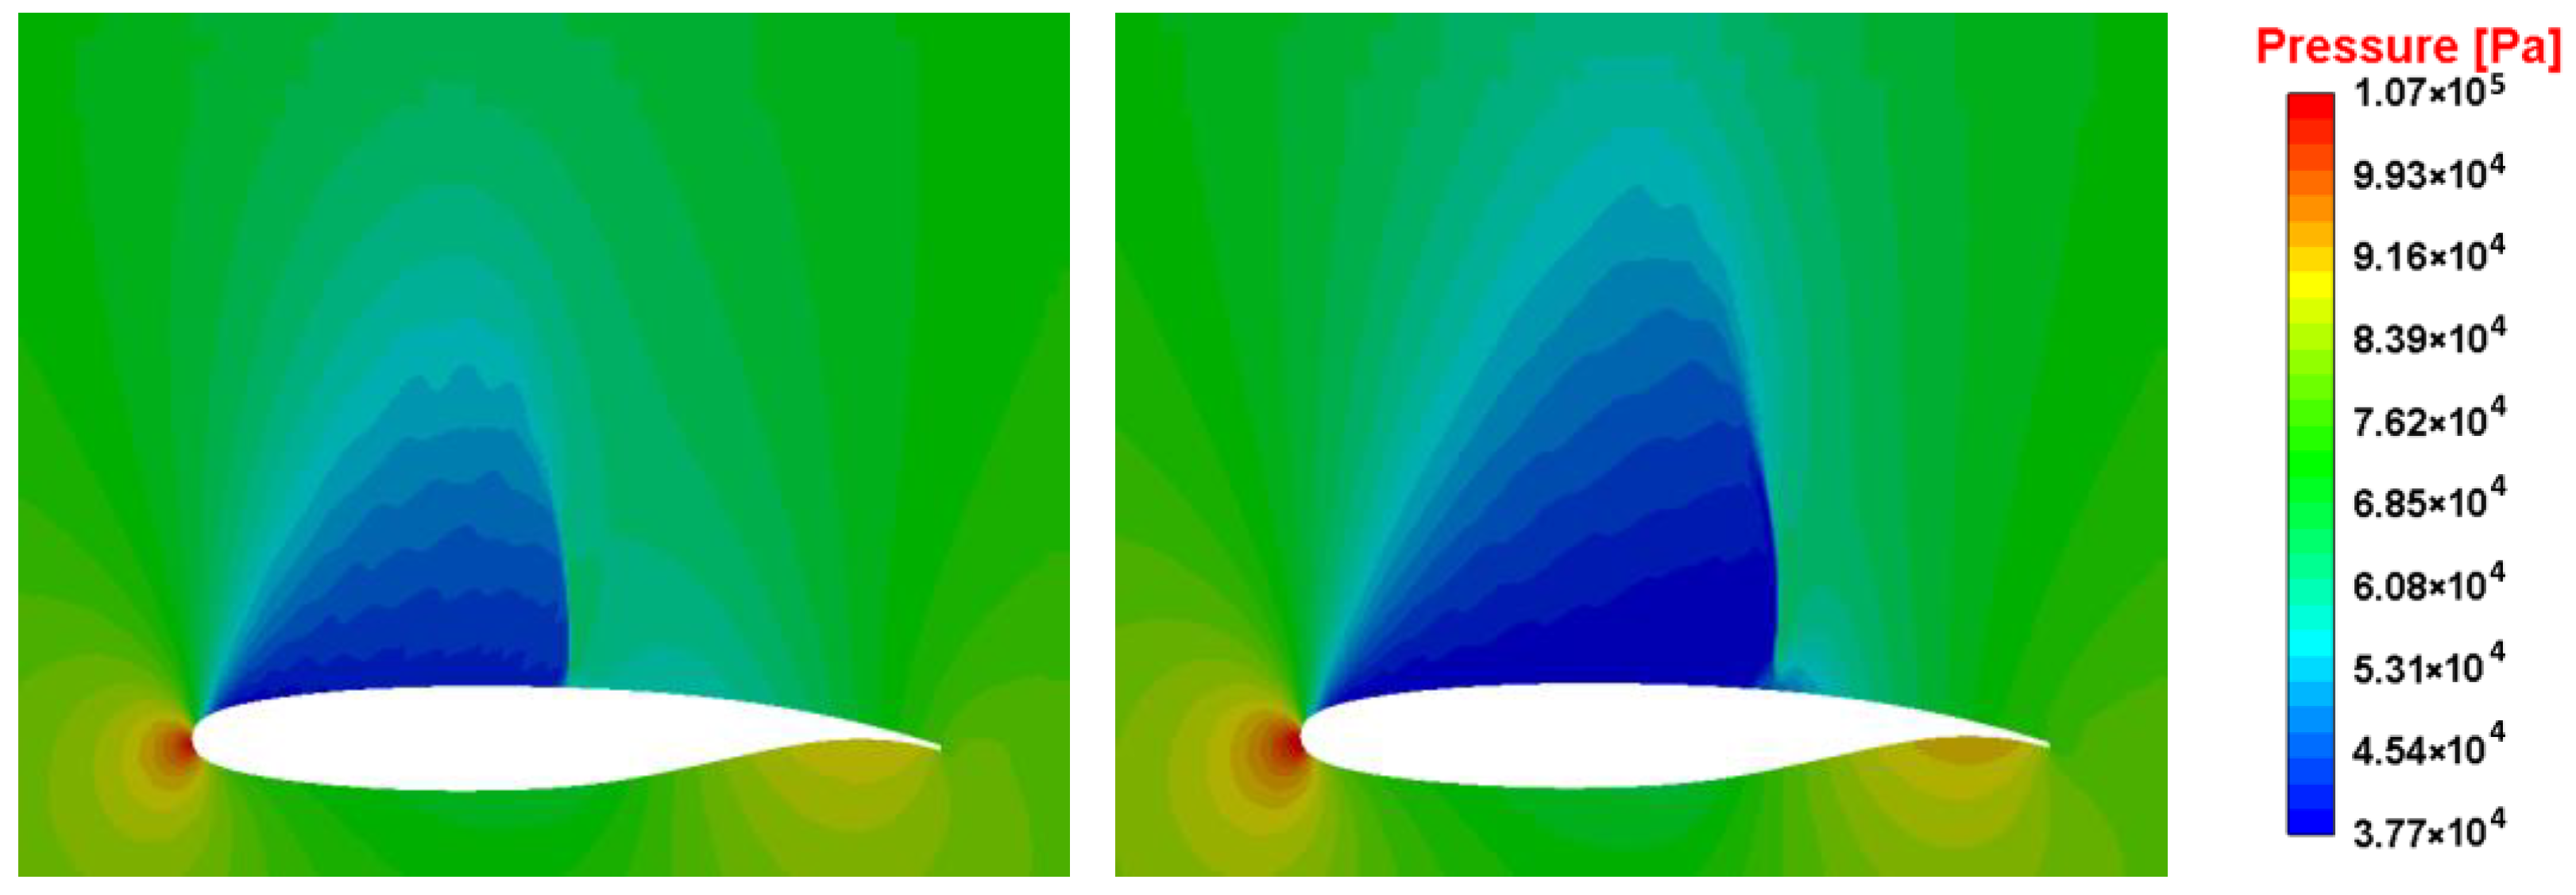
Figure 7 and Figure 8 show the Mach number and pressure distributions in the vicinity of the wing profile for cases No 1 and No 2 from Table 1.
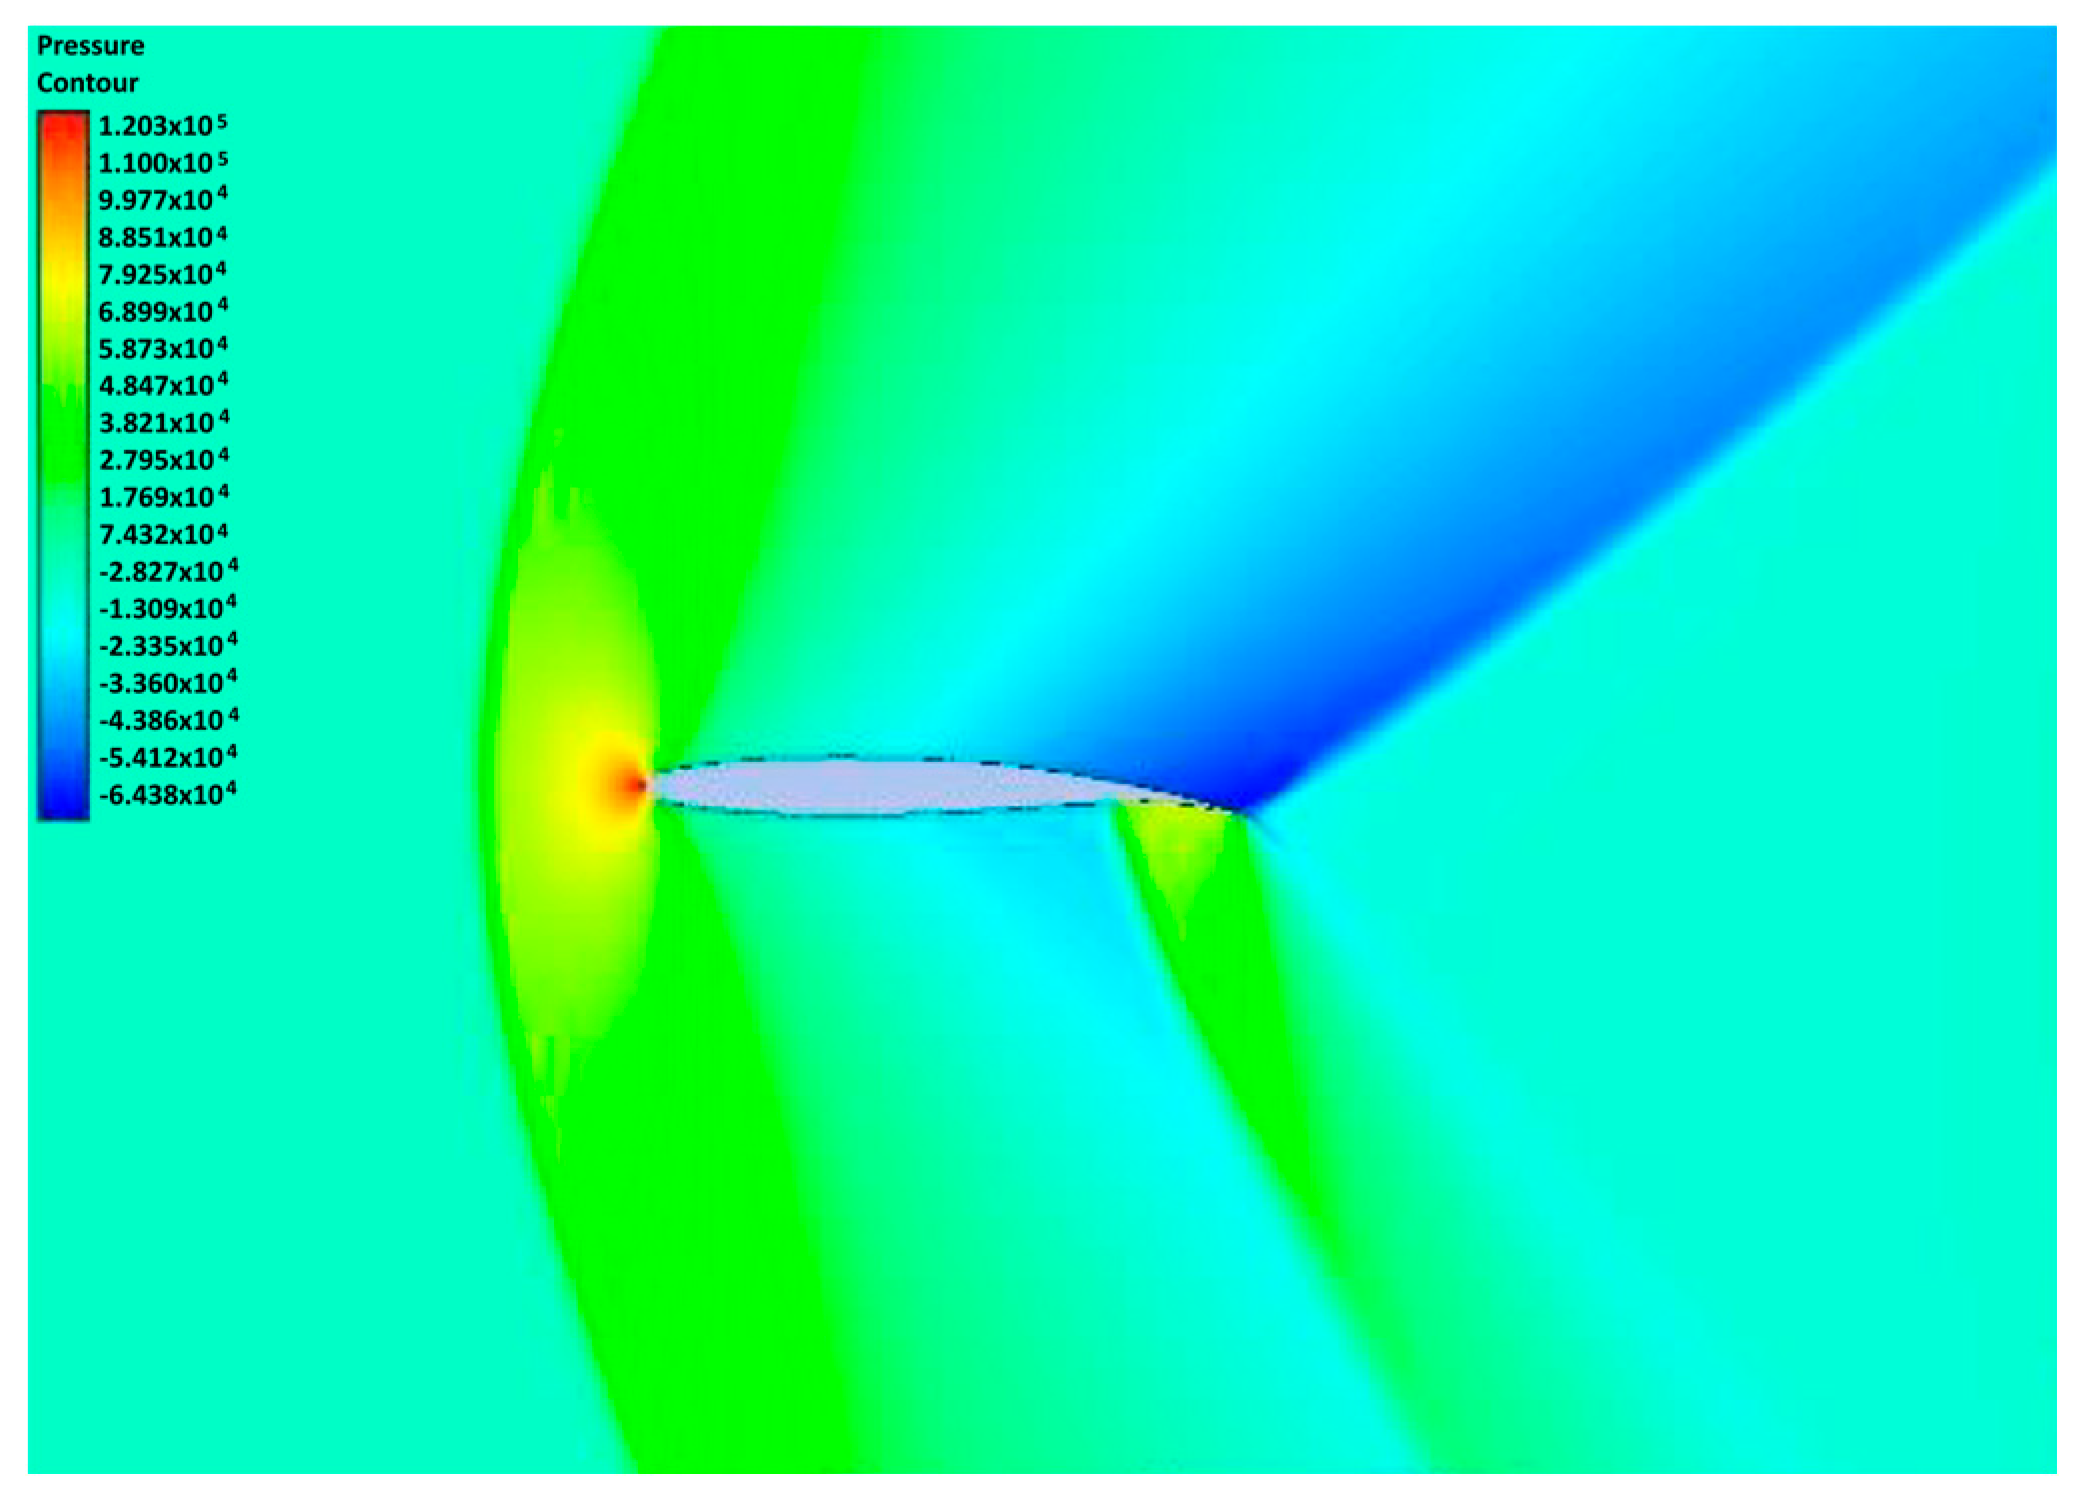
Figure 7 and Figure 8 show that with an increase in the Mach number, there is an increase in the rarefied zone in the upper part of the wing, and the zone of increased pressure in the vicinity of the stagnation point expands. One can also observe the absence of obvious shock waves propagating from the wing profile in comparison with the results presented in Figure 9 and Figure 10. The technique presented in this work is usually used for numerical modeling of the icing of aircraft moving at subsonic speeds, but it is not considered for use in modeling the icing of aircraft moving at supersonic speeds. The results presented in Figure 9 and Figure 10 are the result of its application to such tasks.
Figure 9 and Figure 10 show the Mach number and pressure distributions in the vicinity of the NASA SC (2)-0714 airfoil for the third and fourth cases. These figures show oblique pressure surges formed at supersonic speeds. In cases No 3 and No 4, numerical modeling of the icing was carried out. The pressure distribution data shown in Figure 10 can be indirectly compared with the results presented in the work by Yousuf and Kamal [9]. The pressure distribution data presented in Figure 10 can be indirectly compared with the results presented in Figure 11 from the work of Yusuf and Kamal [9].
Despite the differences in the angles of attack within the cases, the resulting shock waves and their general distribution showed similar patterns with the data from the work of Yousuf and Kamal [9]. Figure 12, Figure 13 and Figure 14 show the obtained distribution of the volume fraction of water, the flow temperature, and the density air in the vicinity of the airfoil.
Figure 12 shows that a large area of water droplet compaction is formed near the profile, and the air flow temperature (Figure 13) in the area of the airfoil leading edge exceeds 0 °C. The area with an air flow temperature above 0 °C is shown in Figure 13 with black isolines. An increase in the volume fraction of water around the airfoil occurs following the compression wave, and is calculated by solving system (2). Due to the high velocity ahead of the body, a region of elevated air pressure forms. An increase in pressure leads to an increased density, which results in a higher concentration of water droplets.
With increasing pressure and density, the surface temperature also increases in the airfoil, as can be seen in Figure 15.
When assessing the distribution of the droplet collection coefficient on the wing surface, shown in Figure 16, it can be noted that the bulk of the droplets settle in the vicinity of the flow stagnation point.
In this case, the temperature of the drops impinging on the airfoil is negative (Figure 17), despite the positive temperature of the flow in the vicinity of the model (Figure 13).
The settled drops at a positive temperature of the airfoil surface are transformed into a liquid film and flow down to the airfoil trailing edge, as can be seen in Figure 18. The thickness of the water film is greater towards the airfoil trailing edge.
At the same time, the water film that has flown down to the airfoil trailing edge does not freeze due to the positive surface temperature, as can be seen in Figure 19, and ice forms only on the leading edge of the airfoil.
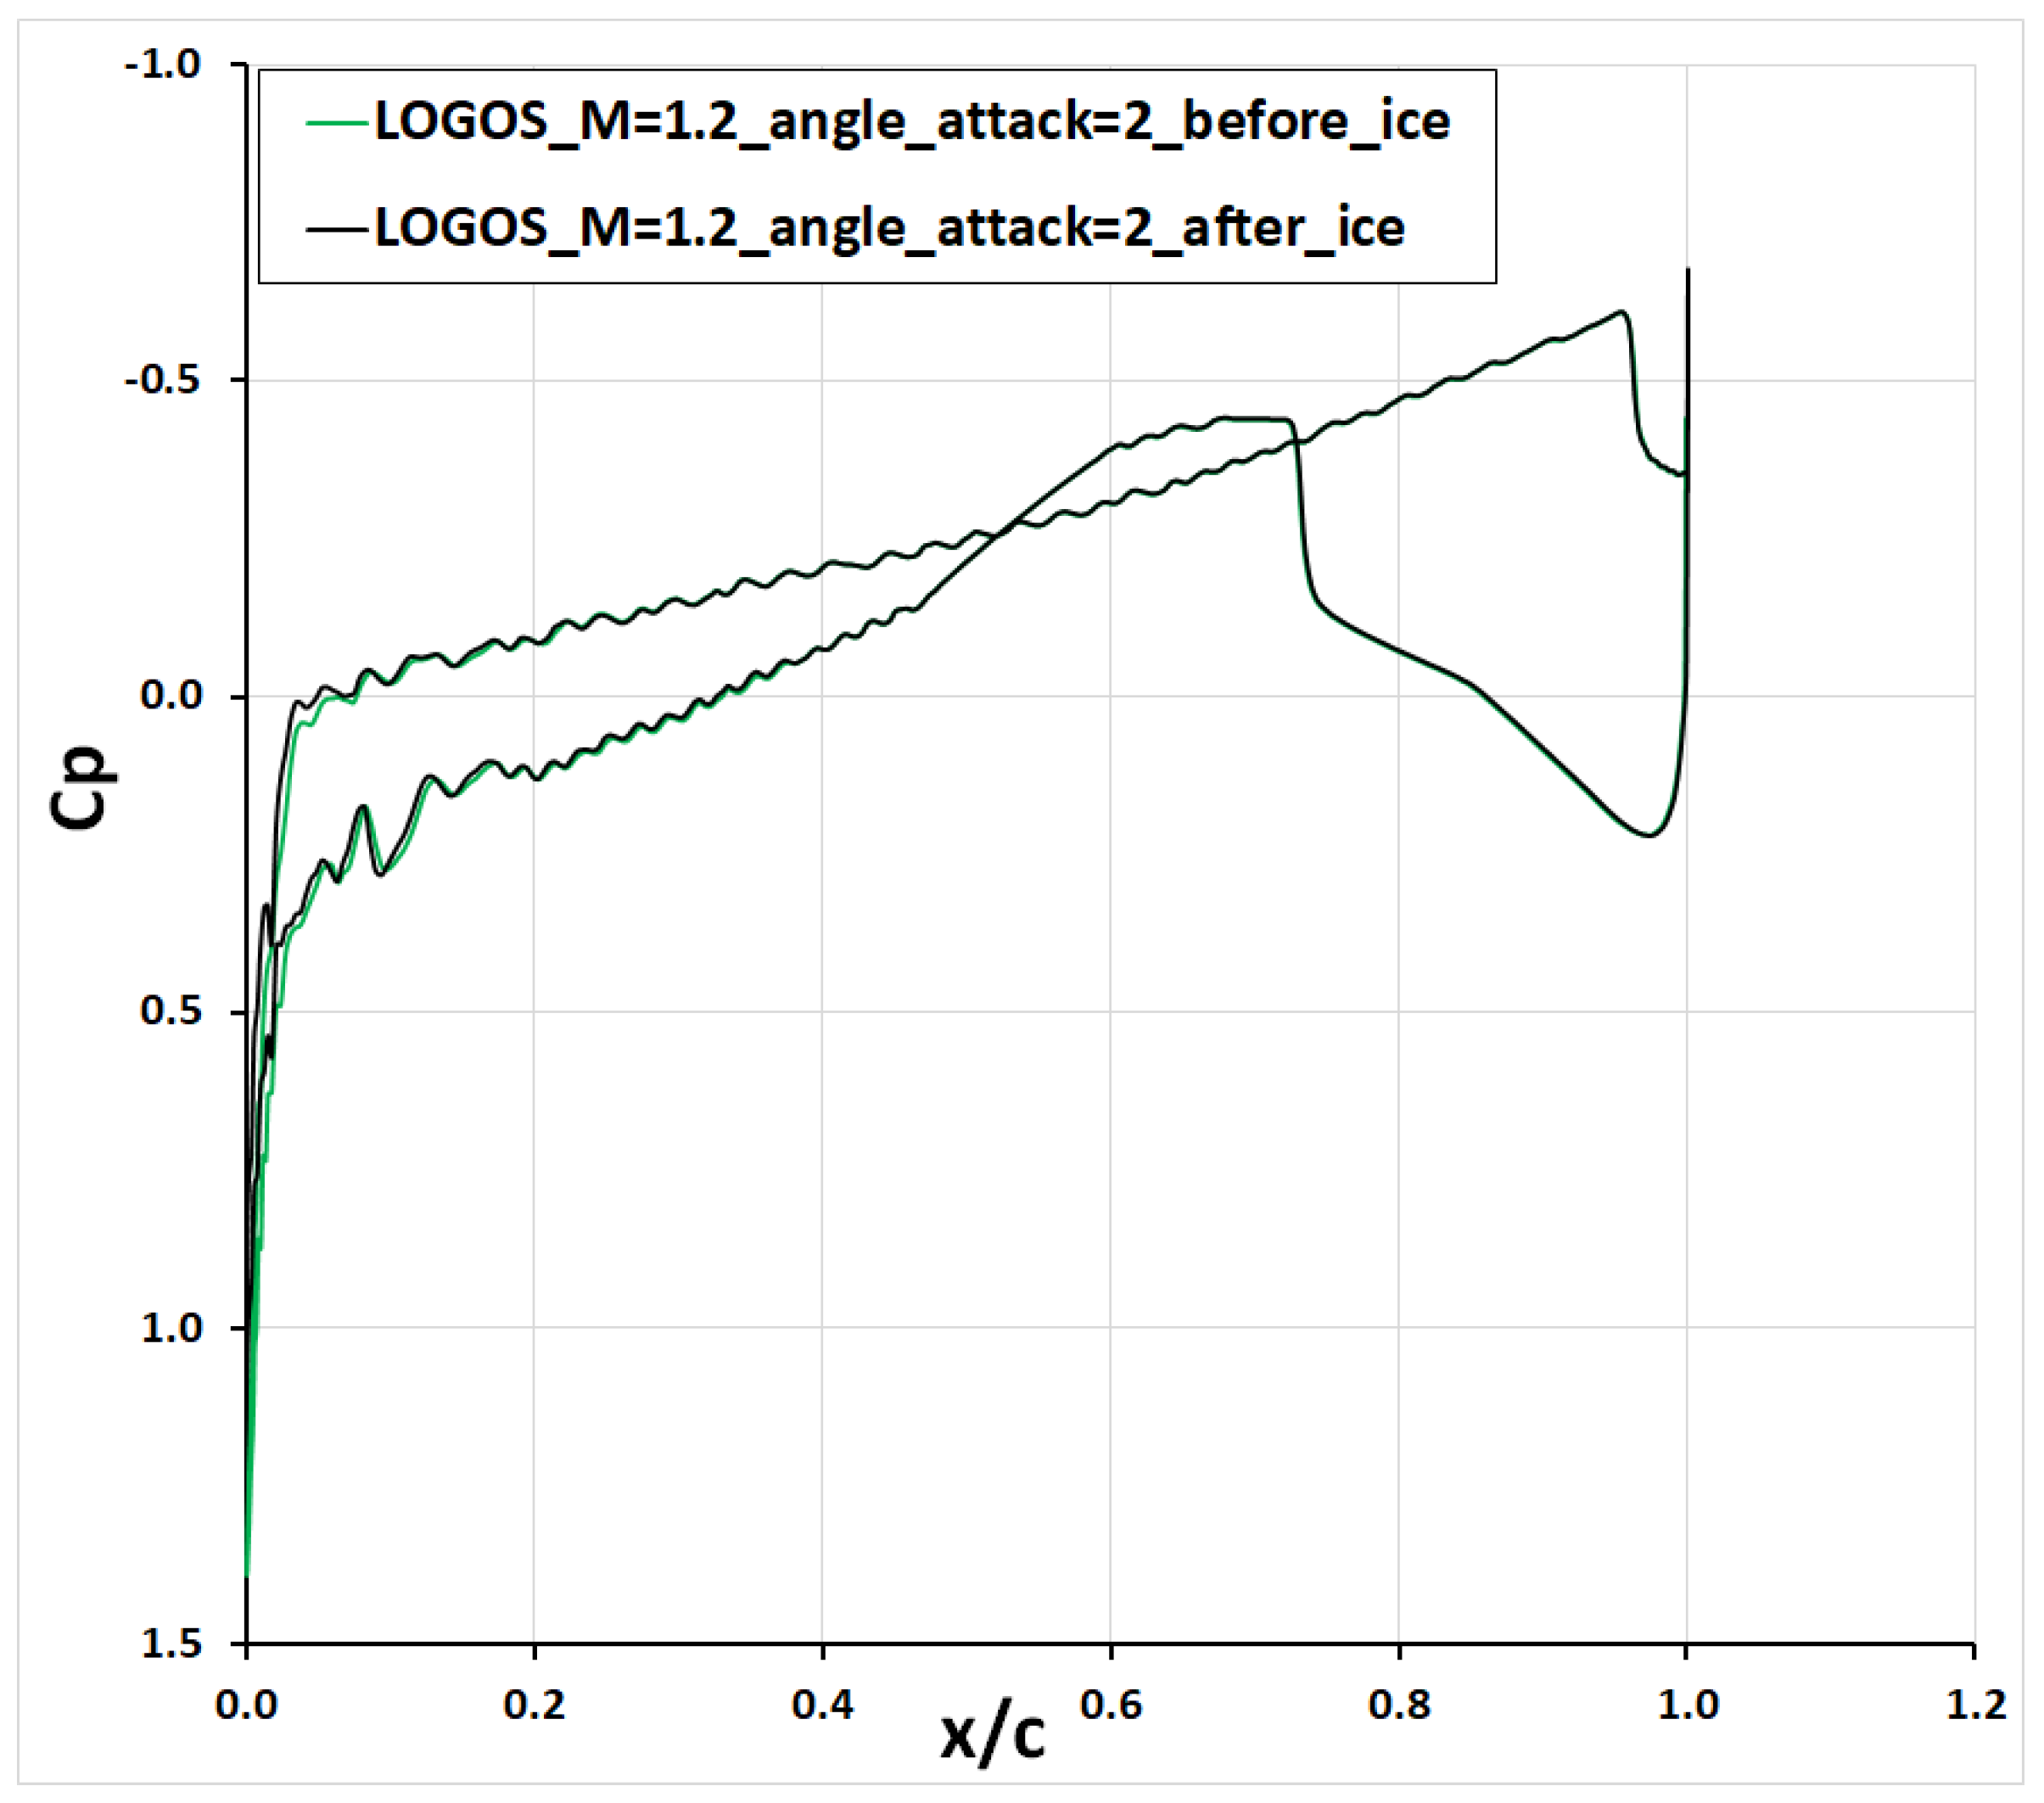
The pressure coefficient distribution for case No 4 is shown in Figure 20, enabling a quantitative evaluation of the impact of supersonic flow on the NASA SC (2)-0714 airfoil, both before and after ice formation.
As shown in Figure 20, the ice formed has practically no effect on the distribution of the pressure coefficient on the airfoil. After icing, there is a slight increase in the pressure coefficient at the leading edge of the airfoil.
The main factor of ice formation on the leading edge of the airfoil, despite the positive temperature of the incident flow in the vicinity of the stagnation point (~31 °C), is the high flow velocity and a large number of impinging supercooled droplets. The positive temperature allows the formation of a water film, flowing down under the action of the incident flow, but does not allow all the ice in the area of the stagnation point on the airfoil surface to melt. During the icing time of 27 s, the height of the accumulated ice on the leading edge of the airfoil is ~1 mm for the considered cases No 3 and No 4. This height of the ice build-up does not greatly affect the aerodynamic characteristics of the airfoil moving at a supersonic speed. The assumption that the droplet temperature is equal to the flow temperature in system (2) leads to an underestimation of the icing. This error occurs due to the use of a positive temperature value at the stagnation point as an input parameter for the system of Equation (4) describing the motion of the water film. The use of the temperature transfer equation in the system of Equation (2) allows for adequate numerical modeling of the icing process, especially when modeling icing at supersonic speeds.

5. Conclusions

The main purpose of this study was to conduct an icing study of the NASA SC (2)-0714 airfoil moving at supersonic speed (Mach number 1.2). In numerical modeling of such problems, it is necessary to take into account the temperature of water droplets contained in the incoming stream, due to the limited heat transfer rate. This allows you to determine the possibility of icing at high speeds. At subsonic speeds, there is practically no difference in the temperatures of the incoming stream and droplets; therefore, such tasks were not considered in this work. Data from works [10,25] were used to formulate the formulation of problems in this work. Numerical studies of the icing on the NASA SC (2)-0714 airfoil showed that with supersonic flow, ice formation on the airfoil surface is possible, despite the positive temperature on the model surface. At the same time, the bulk of the ice formed is located on the leading edge of the airfoil in the vicinity of the stagnation point and has a low height. It is important to note that numerical models of icing, including those used in this work, were mainly developed and validated for the subsonic speed range. In this regard, for the reliable application of the technique to calculations of icing at supersonic speeds, additional verification is required.

Author Contributions

Conceptualization, A.K. (Andrey Kozelkov) and A.K. (Andrey Kurkin); data curation, N.G.; formal analysis, A.K. (Andrey Kozelkov) and N.G.; investigation, A.K. (Andrey Kozelkov), N.G. and A.K. (Andrey Kurkin); methodology, A.K. (Andrey Kozelkov) and A.K. (Andrey Kurkin); software, N.G.; supervision, A.K. (Andrey Kurkin); validation, N.G.; visualization, N.G.; writing—original draft, A.K. (Andrey Kozelkov) and A.K. (Andrey Kurkin); writing—review and editing, A.K. (Andrey Kozelkov) and A.K. (Andrey Kurkin). All authors have read and agreed to the published version of the manuscript.

Funding

This research was funded by the Ministry of Science and Higher Education of the Russian Federation (project No. FSWE-2024-0001 (research topic: “Developing numerical methods, models and algorithms to describe liquid and gas flows in natural environment, and in the context of industrial objects’ operation in standard and emergency conditions on mainframes with exa- and zeta capacity”)).

Institutional Review Board Statement

Not applicable.

Informed Consent Statement

Not applicable.

Data Availability Statement

The original contributions presented in this study are included in the article. Further inquiries can be directed to the corresponding author.

Conflicts of Interest

The authors declare no conflicts of interest.

References

  1. Bogatkin, O.G. Fundamentals of Aviation Meteorology: A Textbook; Publishing House of RGGMU: St. Petersburg, Russia, 2009. [Google Scholar]
  2. Callaghan, E.E.; Serafini, J.S. Analytical Investigation of Icing Limit for Diamond-Shaped Airfoil in Transonic and Supersonic Flow; NACA TN 2861; NACA Tech: Washington, DC, USA, 1953. [Google Scholar]
  3. Federal Aviation Authority (FAA). Airworthness Standards: Transport Category Airplanes, CFR Title 14, Part 25. 2025. Available online: https://www.ecfr.gov/current/title-14/chapter-I/subchapter-C/part-25 (accessed on 25 May 2025).
  4. Suhanov, D.B.; Serebryakov, L.I.; Radchenko, P.A.; Strijhak, S.V. To the Problem of Selecting the Anti-Icing System for the Swept Wing of Supersonic Flight Demonstrator. In Recent Developments in High-Speed Transport; Strelets, D.Y., Korsun, O.N., Eds.; Springer Aerospace Technology; Springer: Singapore, 2023. [Google Scholar] [CrossRef]
  5. Demidov, A.I.; Shishelova, T.I. Problem of aircraft icing and applied methods of combating it. Int. J. Experiment. Educ. 2014, 8, 88–89. [Google Scholar]
  6. Bragg, M.B.; Paraschivoiu, I.; Saeed, F. Aircraft Icing; Wiley: New York, NY, USA, 2002. [Google Scholar]
  7. Lei, Z.-J.; Zha, G.-C. Lift Enhancement of Supersonic Thin Airfoil at Low Speed by Co-Flow Jet Active Flow Control. In Proceedings of the AIAA AVIATION, Virtual, 2–6 August 2021. [Google Scholar] [CrossRef]
  8. Welge, H.; Nelson, C.; Bonet, J. Supersonic vehicle systems for the 2020 to 2035 timeframe. In Proceedings of the 28th AIAA Applied Aerodynamics Conference, Chicago, IL, USA, 28 June–1 July 2010; p. 4930. [Google Scholar]
  9. Yousuf, A.B.; Kamal, T.M.B. Study of the Aerodynamic Characteristics of a Supercritical Airfoil under Supersonic Flow. In Proceedings of the International Conference on Mechanical, Industrial and Materials Engineering 2022 (ICMIME 2022), Rajshahi, Bangladesh, 20–22 December 2022. [Google Scholar]
  10. Kozelkov, A.; Kurkin, A.; Kurulin, V.; Plygunova, K.; Krutyakova, O. Validation of the LOGOS Software Package Methods for the Numerical Simulation of Cavitational Flows. Fluids 2023, 8, 104. [Google Scholar] [CrossRef]
  11. Sarazov, A.V.; Kozelkov, A.S.; Strelets, D.Y.; Zhuchkov, R.N. Modeling Object Motion on Arbitrary Unstructured Grids Using an Invariant Principle of Computational Domain Topology: Key Features. Symmetry 2023, 15, 2081. [Google Scholar] [CrossRef]
  12. Kozelkov, A.S.; Struchkov, A.V.; Strelets, D.Y. Two Methods to Improve the Efficiency of Supersonic Flow Simulation on Unstructured Grids. Fluids 2022, 7, 136. [Google Scholar] [CrossRef]
  13. Fletcher, C.A.J. Computational Techniques for Fluid Dynamics; Springer: Berlin, Germany, 1991. [Google Scholar]
  14. Kim, J.W.; Dennis, P.G.; Sankar, L.N.; Kreeger, R.E. Ice Accretion Modeling using an Eulerian Approach for Droplet Impingement. In Proceedings of the 51st AIAA Aerospace Sciences Meeting including the New Horizons Forum and Aerospace Exposition, Grapevine, TX, USA, 7–10 January 2013. AIAA 2013-0246. [Google Scholar]
  15. Norde, E. Eulerian Method for Ice Crystal Icing in Turbofan Engines. Ph.D. Thesis, University of Twente, Enschede, The Netherlands, 2017. [Google Scholar] [CrossRef]
  16. Bourgault, Y.; Beaugendre, H.; Habashi, W.G. Development of a Shallow-Water Icing Model in FENSAP-ICE. J. Aircr. 2000, 37, 640–646. [Google Scholar] [CrossRef]
  17. Uyttersprot, L. Inverse Distance Weighting Mesh Deformation. A Robust and Efficient Method for Unstructured Meshes. Master’s Thesis, Department of Aerodynamics, Delft University of Technology, Delft, The Netherlands, 12 February 2014; p. 177. [Google Scholar]
  18. Kozelkov, A.S.; Galanov, N.G.; Semenov, I.V.; Zhuchkov, R.N.; Strelets, D.Y. Computational Investigation of the Water Droplet Effects on Shapes of Ice on Airfoils. Aerospace 2023, 10, 906. [Google Scholar] [CrossRef]
  19. Kozelkov, A.; Galanov, N. Consideration of surface roughness when modeling icing processes. Ecol. Syst. Devices 2024, 10, 58–69. [Google Scholar] [CrossRef]
  20. Ferziger, J.H.; Peric, M. Computational Method for Fluid Dynamics; Springer: New York, NY, USA, 2002. [Google Scholar]
  21. Hirsch, C. Computational Methods for Inviscid and Viscous Flows. In Numerical Computation of Internal and External Flows; Butterworth-Heinemann: Oxford, UK, 1990; Volume 2. [Google Scholar]
  22. Jasak, H. Error Analysis and Estimation for the Finite Volume Method with Applications to Fluid Flow; Department of Mechanical Engineering, Imperial College of Science: London, UK, 1996. [Google Scholar]
  23. Menter, F.R.; Kuntz, M.; Langtry, R. Ten years of industrial experience with SST turbulence model. Turbul. Heat Mass 2003, 4, 625–632. [Google Scholar]
  24. Luke, E.; Collins, E.; Blades, E. A fast mesh deformation method using explicit interpolation. J. Comput. Phys. 2012, 231, 586–601. [Google Scholar] [CrossRef]
  25. Xu, X.; Liu, D.-W.; Chen, D.-H.; Wei, Z.; Wang, Y.-J. Investigation on Improved Correlation of CFD and EFD for Supercritical Airfoil. Res. J. Appl. Sci. Eng. Technol. 2014, 7, 1007–1011. [Google Scholar] [CrossRef]
  26. Harris, C.D. NASA Supercritical Airfoils, NASA TP 2969, 1990. Airfoil Coordinates. Airfoil Tools. Available online: http://airfoiltools.com/airfoil/details?airfoil=sc20714-il (accessed on 26 March 2025).
Figure 1. General view of NASA SC (2)-0714 airfoil [26].
Fluids 10 00260 g001
Figure 2. Comparison of pressure coefficient distributions around the NASA SC (2)-0714 airfoil for the first case (M = 0.7055, α = 0.5202) on different mesh models.
Fluids 10 00260 g002
Figure 3. Dependence of liquid water content on the horizontal extent of the icing zone under intermittent maximum icing conditions at altitudes in the range of 1200 to 11,000 m for clouds (cumuliform) with the mean droplet diameter of 20 microns [3].
Fluids 10 00260 g003
Figure 4. A possible icing zone defined by the altitude and temperature of outside air for intermittent maximum icing [3].
Fluids 10 00260 g004
Figure 5. Comparison of pressure coefficient distributions on the NASA SC (2)-0714 airfoil for the first case (M = 0.7055, α = 0.5202).
Fluids 10 00260 g005
Figure 6. Comparison of pressure coefficient distributions on the NASA SC (2)-0714 airfoil for the second case (M = 0.74, α = 2).
Fluids 10 00260 g006
Figure 7. Mach number distribution around the NASA SC (2)-0714 airfoil for the first case (M = 0.7055, α = 0.5202), (left), and the second case (M = 0.74, α = 2), (right).
Fluids 10 00260 g007
Figure 8. Pressure distribution around the NASA SC (2)-0714 airfoil for the first case (M = 0.7055, α = 0.5202), (left), and the second case (M = 0.74, α = 2), (right).
Fluids 10 00260 g008
Figure 9. Mach number distribution around the NASA SC (2)-0714 airfoil for the third case (M = 1.2, α = 0.5202), (left), and the fourth case (M = 1.2, α = 2), (right).
Fluids 10 00260 g009
Figure 10. Pressure distribution around the NASA SC (2)-0714 airfoil for the third case (M = 1.2, α = 0.5202), (left), and the fourth case (M = 1.2, α = 2), (right).
Fluids 10 00260 g010
Figure 11. Pressure distribution around the NASA SC (2)-0714 airfoil from the work by Yousuf and Kamal [9].
Fluids 10 00260 g011
Figure 12. Distribution of the volume fraction of water around the NASA SC (2)-0714 airfoil for the third case (M = 1.2, α = 0.5202), (left), and the fourth case (M = 1.2, α = 2), (right).
Fluids 10 00260 g012
Figure 13. Distribution of flow temperature around the NASA SC (2)-0714 airfoil for the third case (M = 1.2, α = 0.5202), (left), and the fourth case (M = 1.2, α = 2), (right).
Fluids 10 00260 g013
Figure 14. Distribution of flow density around the NASA SC (2)-0714 airfoil for the third case (M = 1.2, α = 0.5202), (left), and the fourth case (M = 1.2, α = 2), (right).
Fluids 10 00260 g014
Figure 15. Temperature distribution of the air flow on the surface of the NASA SC (2)-0714 airfoil for the third case (M = 1.2, α = 0.5202), (left), and the fourth case (M = 1.2, α = 2), (right).
Fluids 10 00260 g015
Figure 16. Distribution of droplet collection efficiency (β) on the surface of the NASA SC (2)-0714 airfoil for the third case (M = 1.2, α = 0.5202), (left), and the fourth case (M = 1.2, α = 2), (right).
Fluids 10 00260 g016
Figure 17. Temperature distribution of water droplets on the surface of the NASA SC (2)-0714 airfoil for the third case (M = 1.2, α = 0.5202), (left), and the fourth case (M = 1.2, α = 2), (right).
Fluids 10 00260 g017
Figure 18. Distribution of water film thickness on the surface of the NASA SC (2)-0714 airfoil for the third case (M = 1.2, α = 0.5202), (left), and the second case (M = 1.2, α = 2), (right).
Fluids 10 00260 g018
Figure 19. Distribution of ice thickness on the surface of the NASA SC (2)-0714 airfoil for the third case (M = 1.2, α = 0.5202), (left), and the fourth case (M = 1.2, α = 2), (right).
Fluids 10 00260 g019
Figure 20. Pressure coefficient distributions were compared for the fourth case (M = 1.2, α = 2), both before and after icing, on the NASA SC (2)-0714 airfoil.
Fluids 10 00260 g020
Table 1. Parameters of steady cases.
CasesMach NumberTemperature Air, °KPressure Air,
Pa
Angle of Attack
α, °
10.7055249.1875.950.5202
20.74249.1875.952
31.2246.2535.650.5202
41.2246.2535.652
Disclaimer/Publisher’s Note: The statements, opinions and data contained in all publications are solely those of the individual author(s) and contributor(s) and not of MDPI and/or the editor(s). MDPI and/or the editor(s) disclaim responsibility for any injury to people or property resulting from any ideas, methods, instructions or products referred to in the content.