
Effects of pH and NaCl on the Spatial Structure and Conformation of Myofibrillar Proteins and the Emulsion Gel System—Insights from Computational Molecular Dynamics on Myosin of Golden Pompano

 and
and 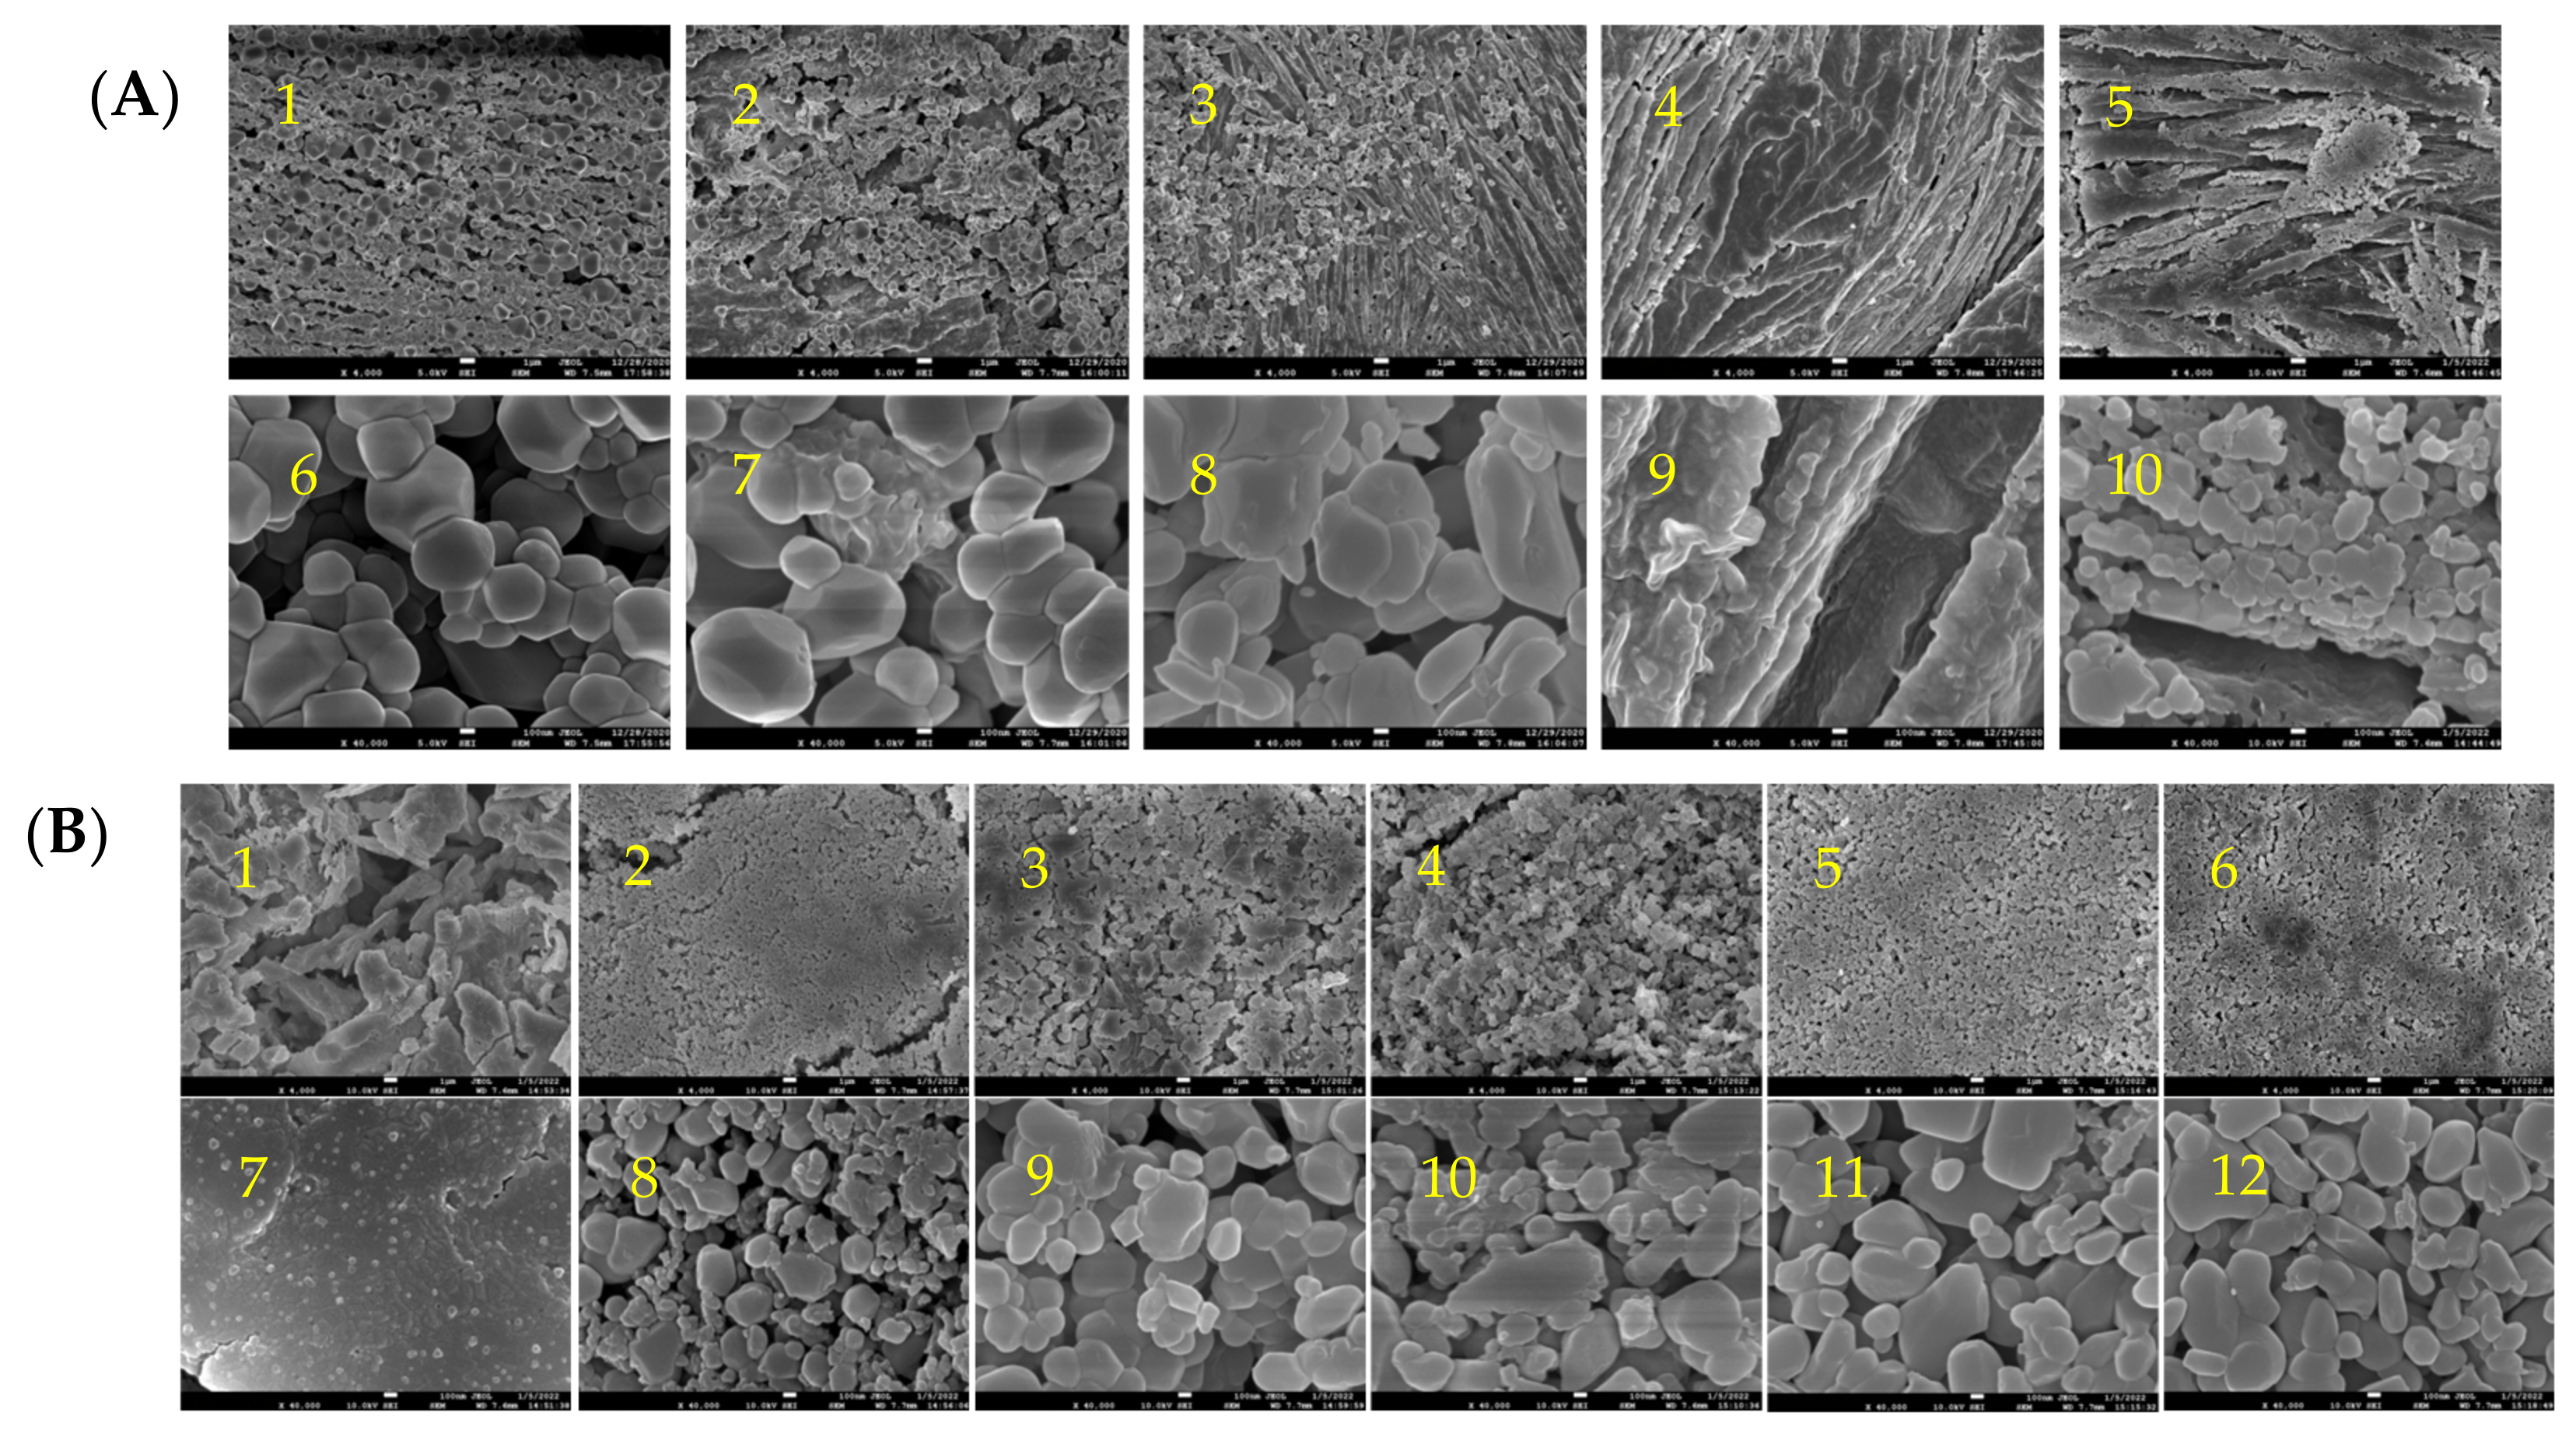
Abstract
1. Introduction
2. Results and Discussion
2.1. The Microscopic Morphology and Structure of Golden Pompano Myofibrillar Protein
2.2. Molecular Dynamics (MD) Simulations on pH and Salinity Effects
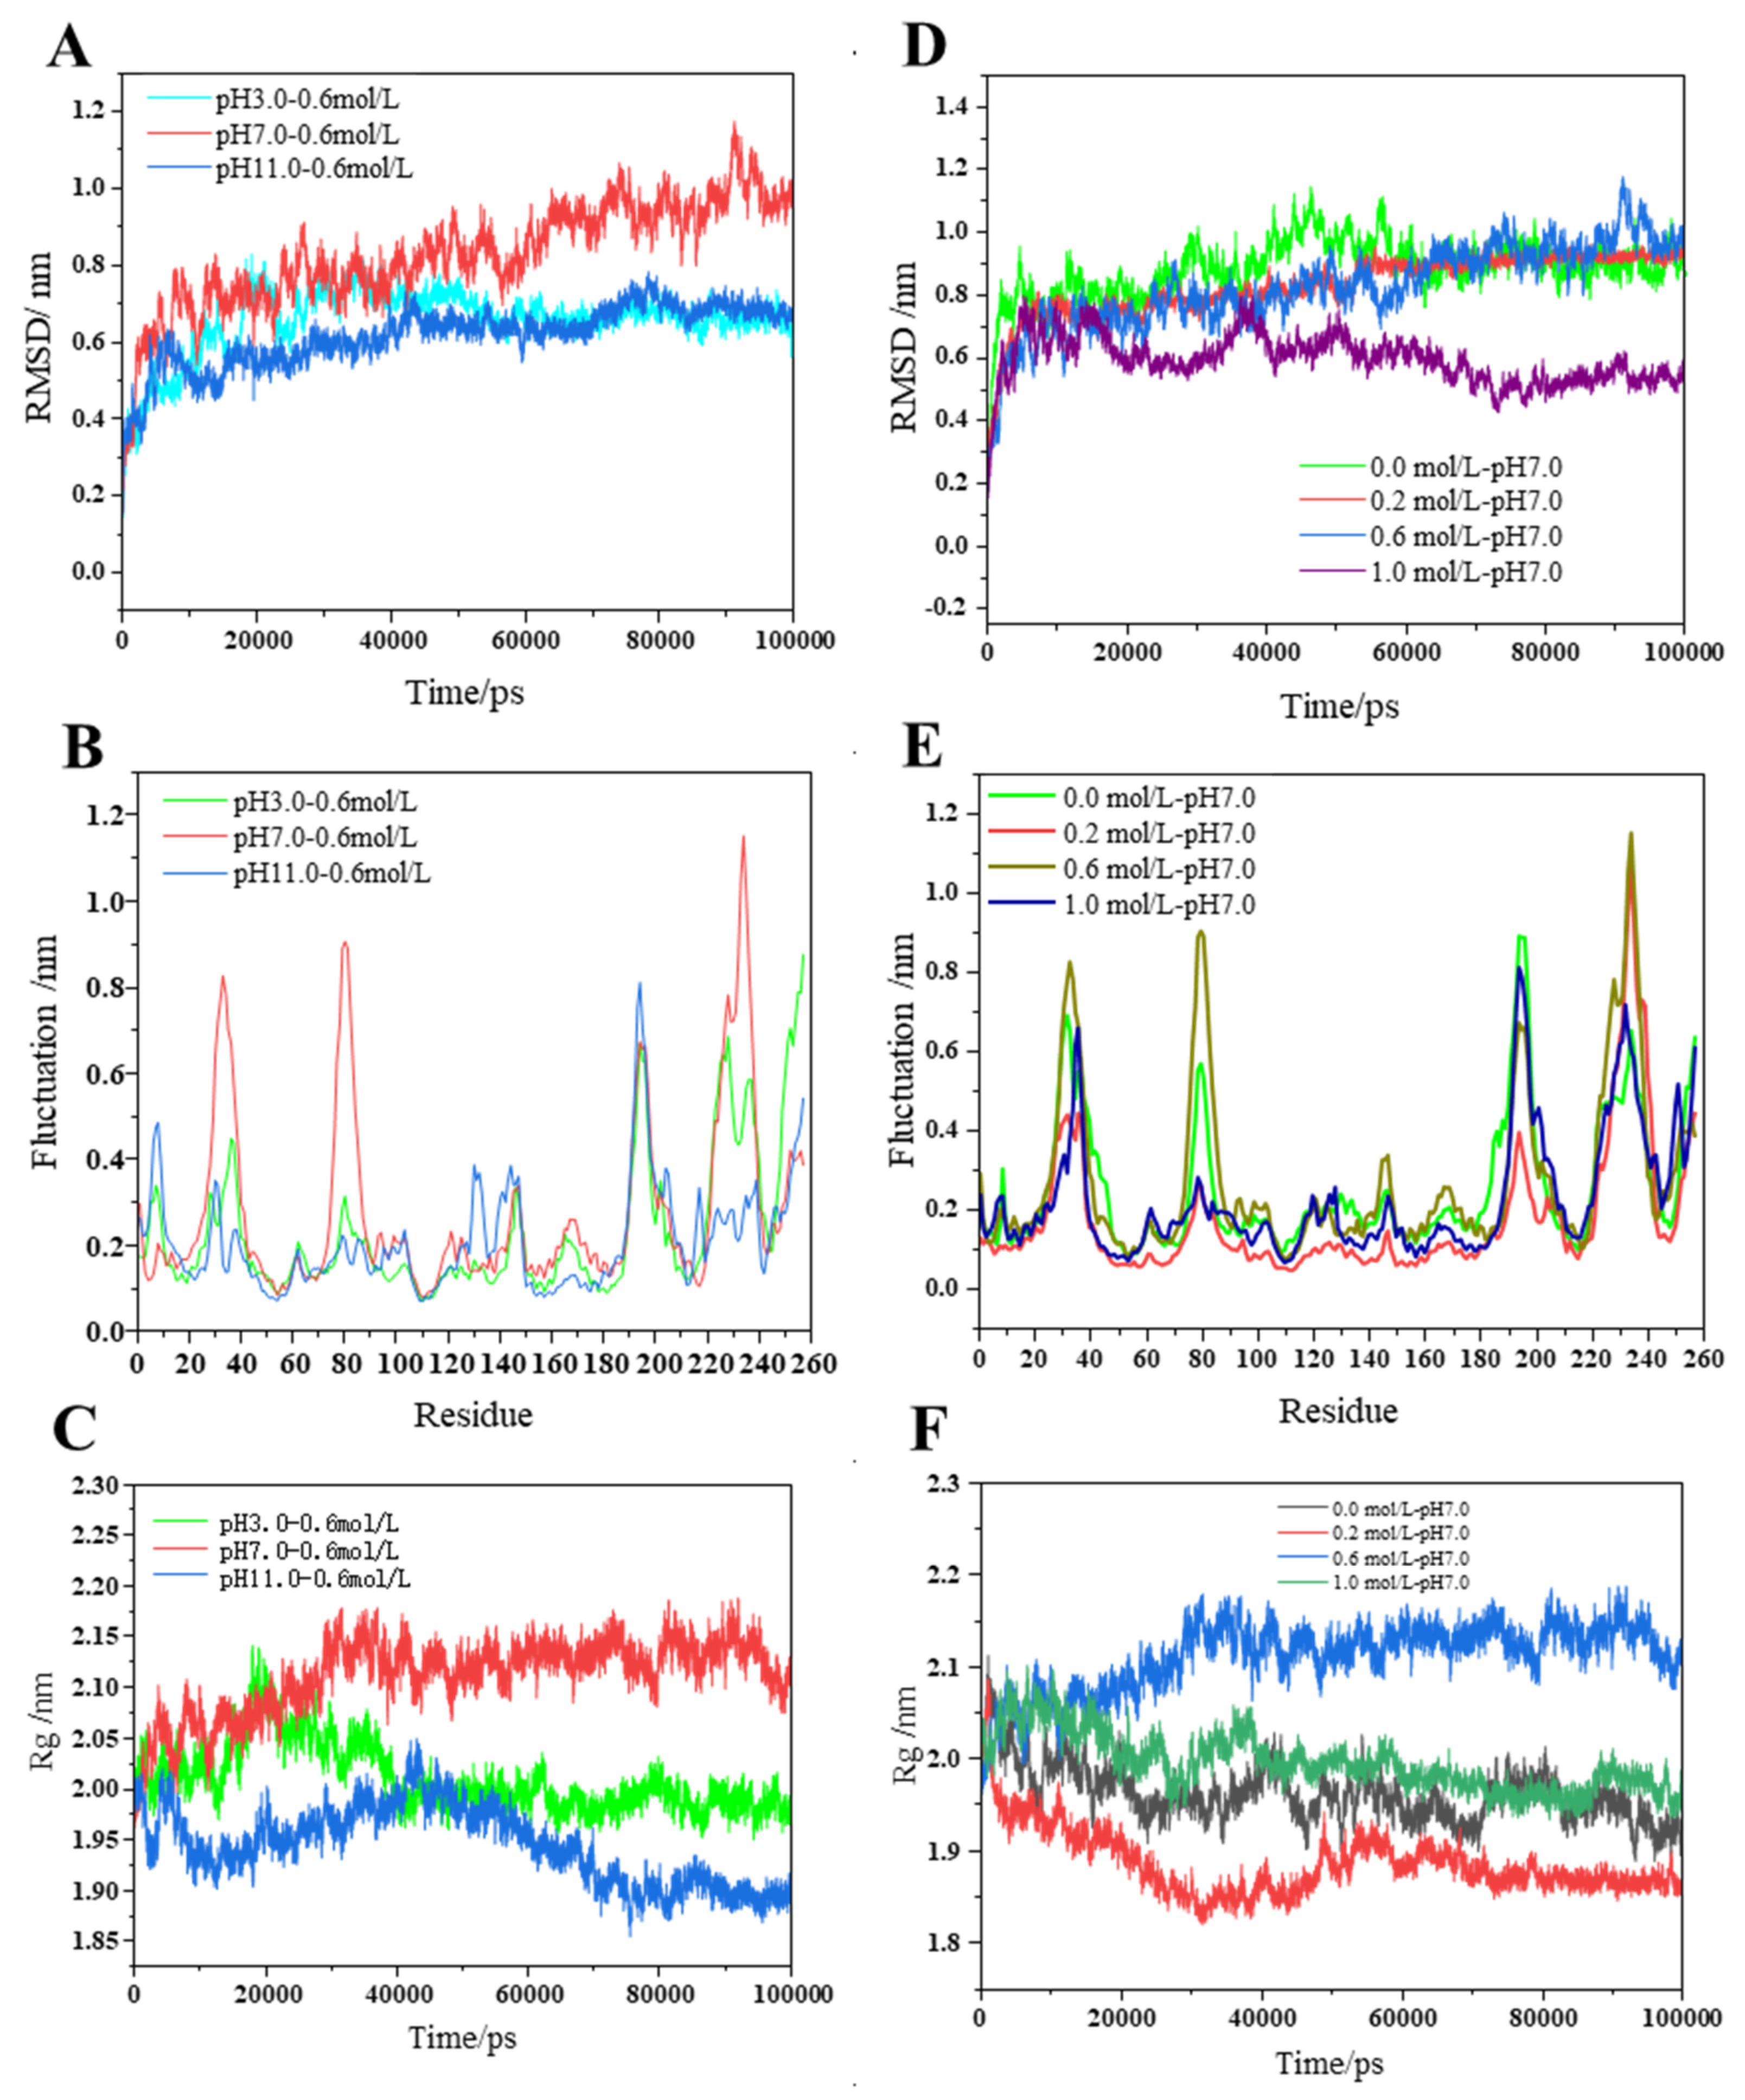
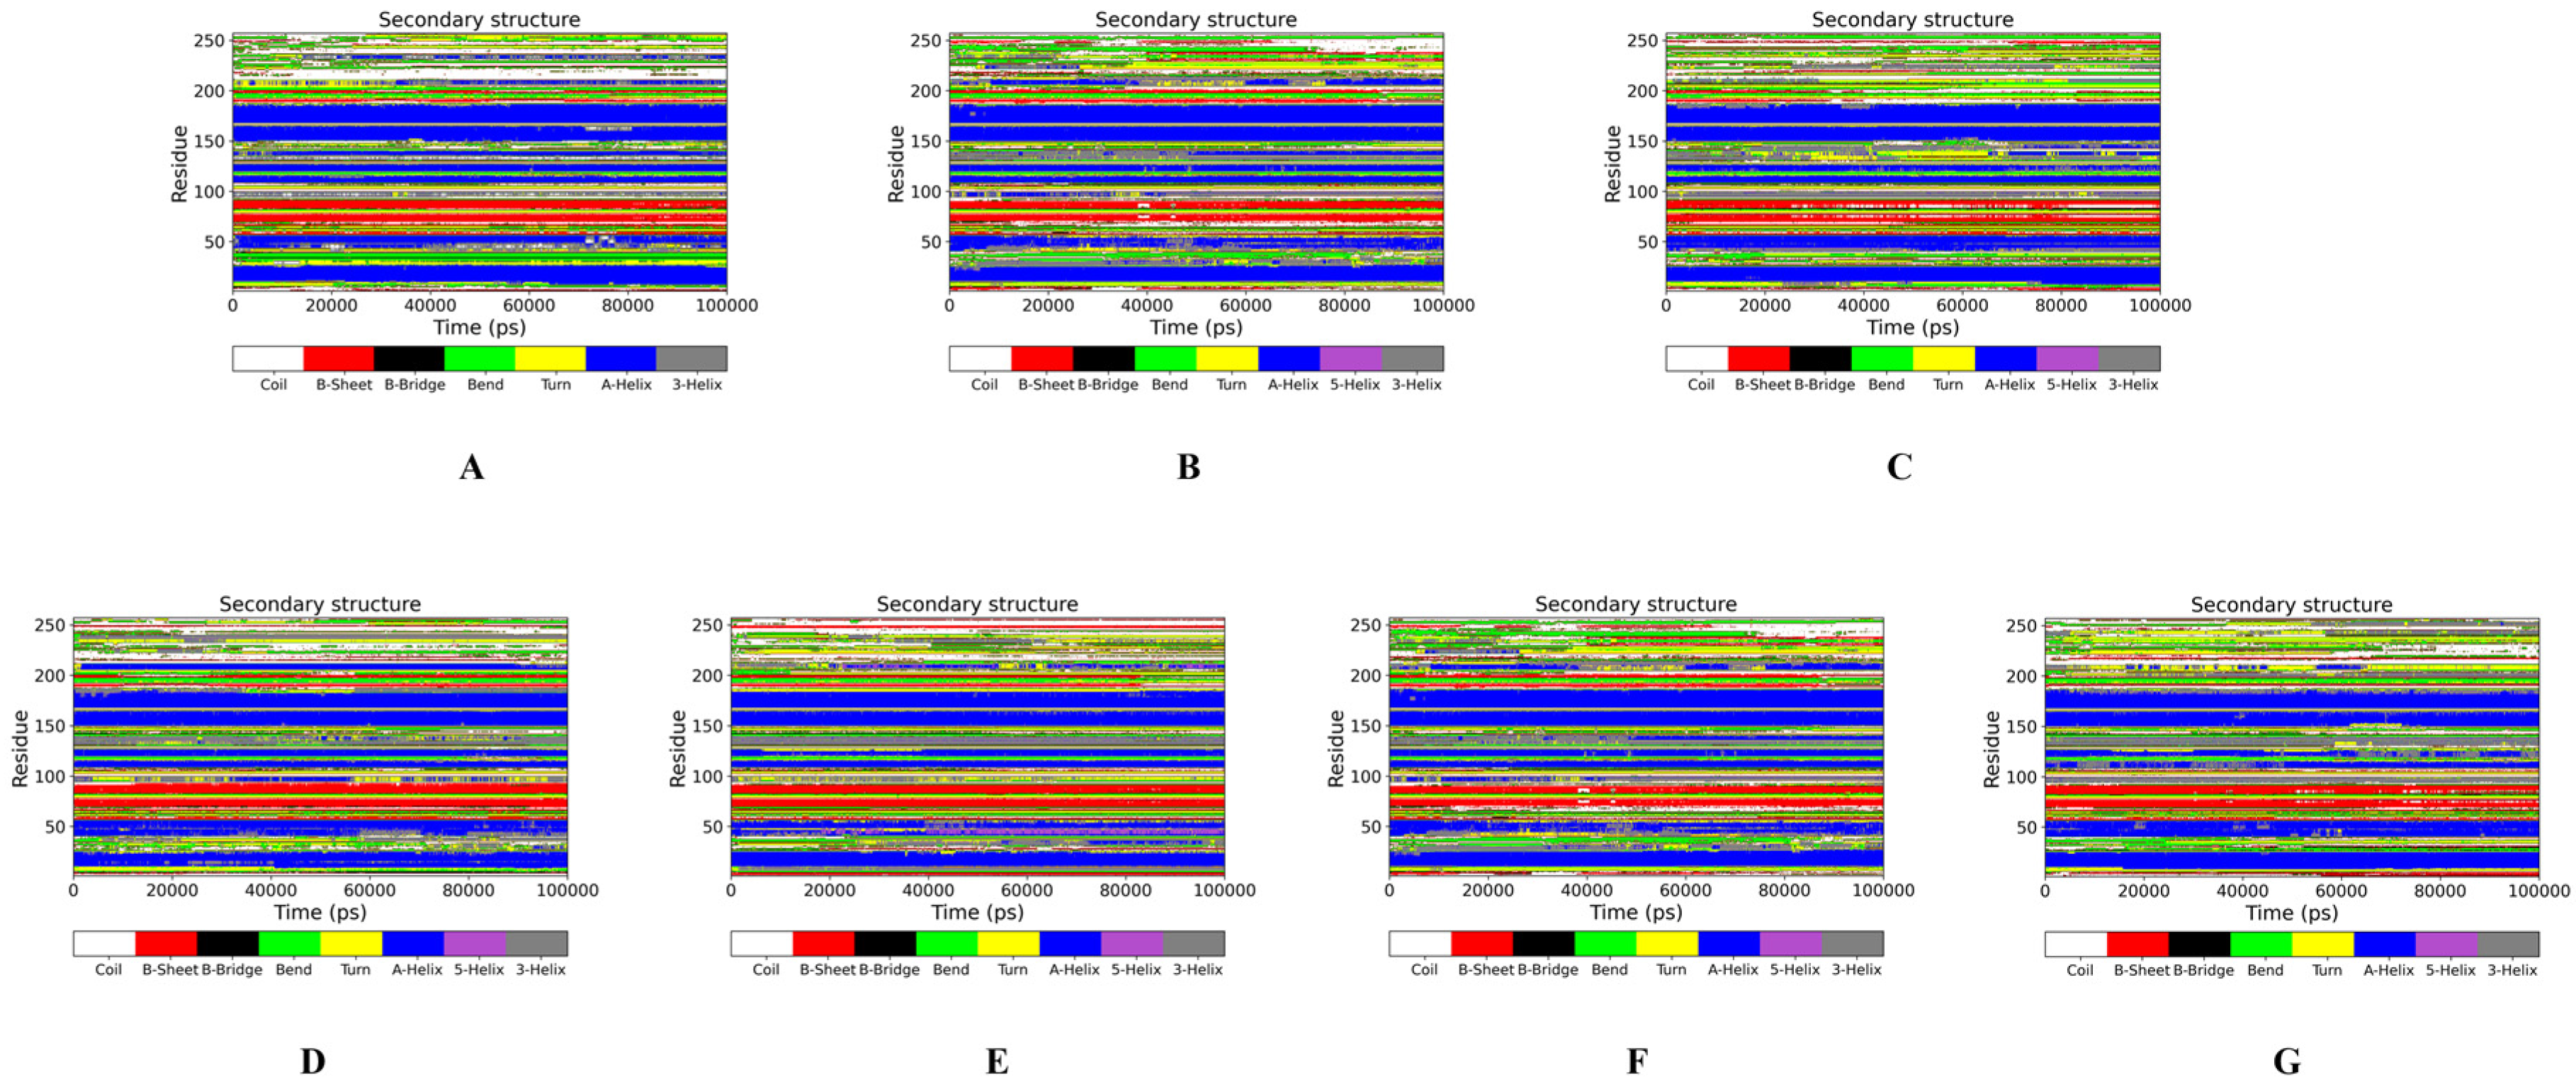
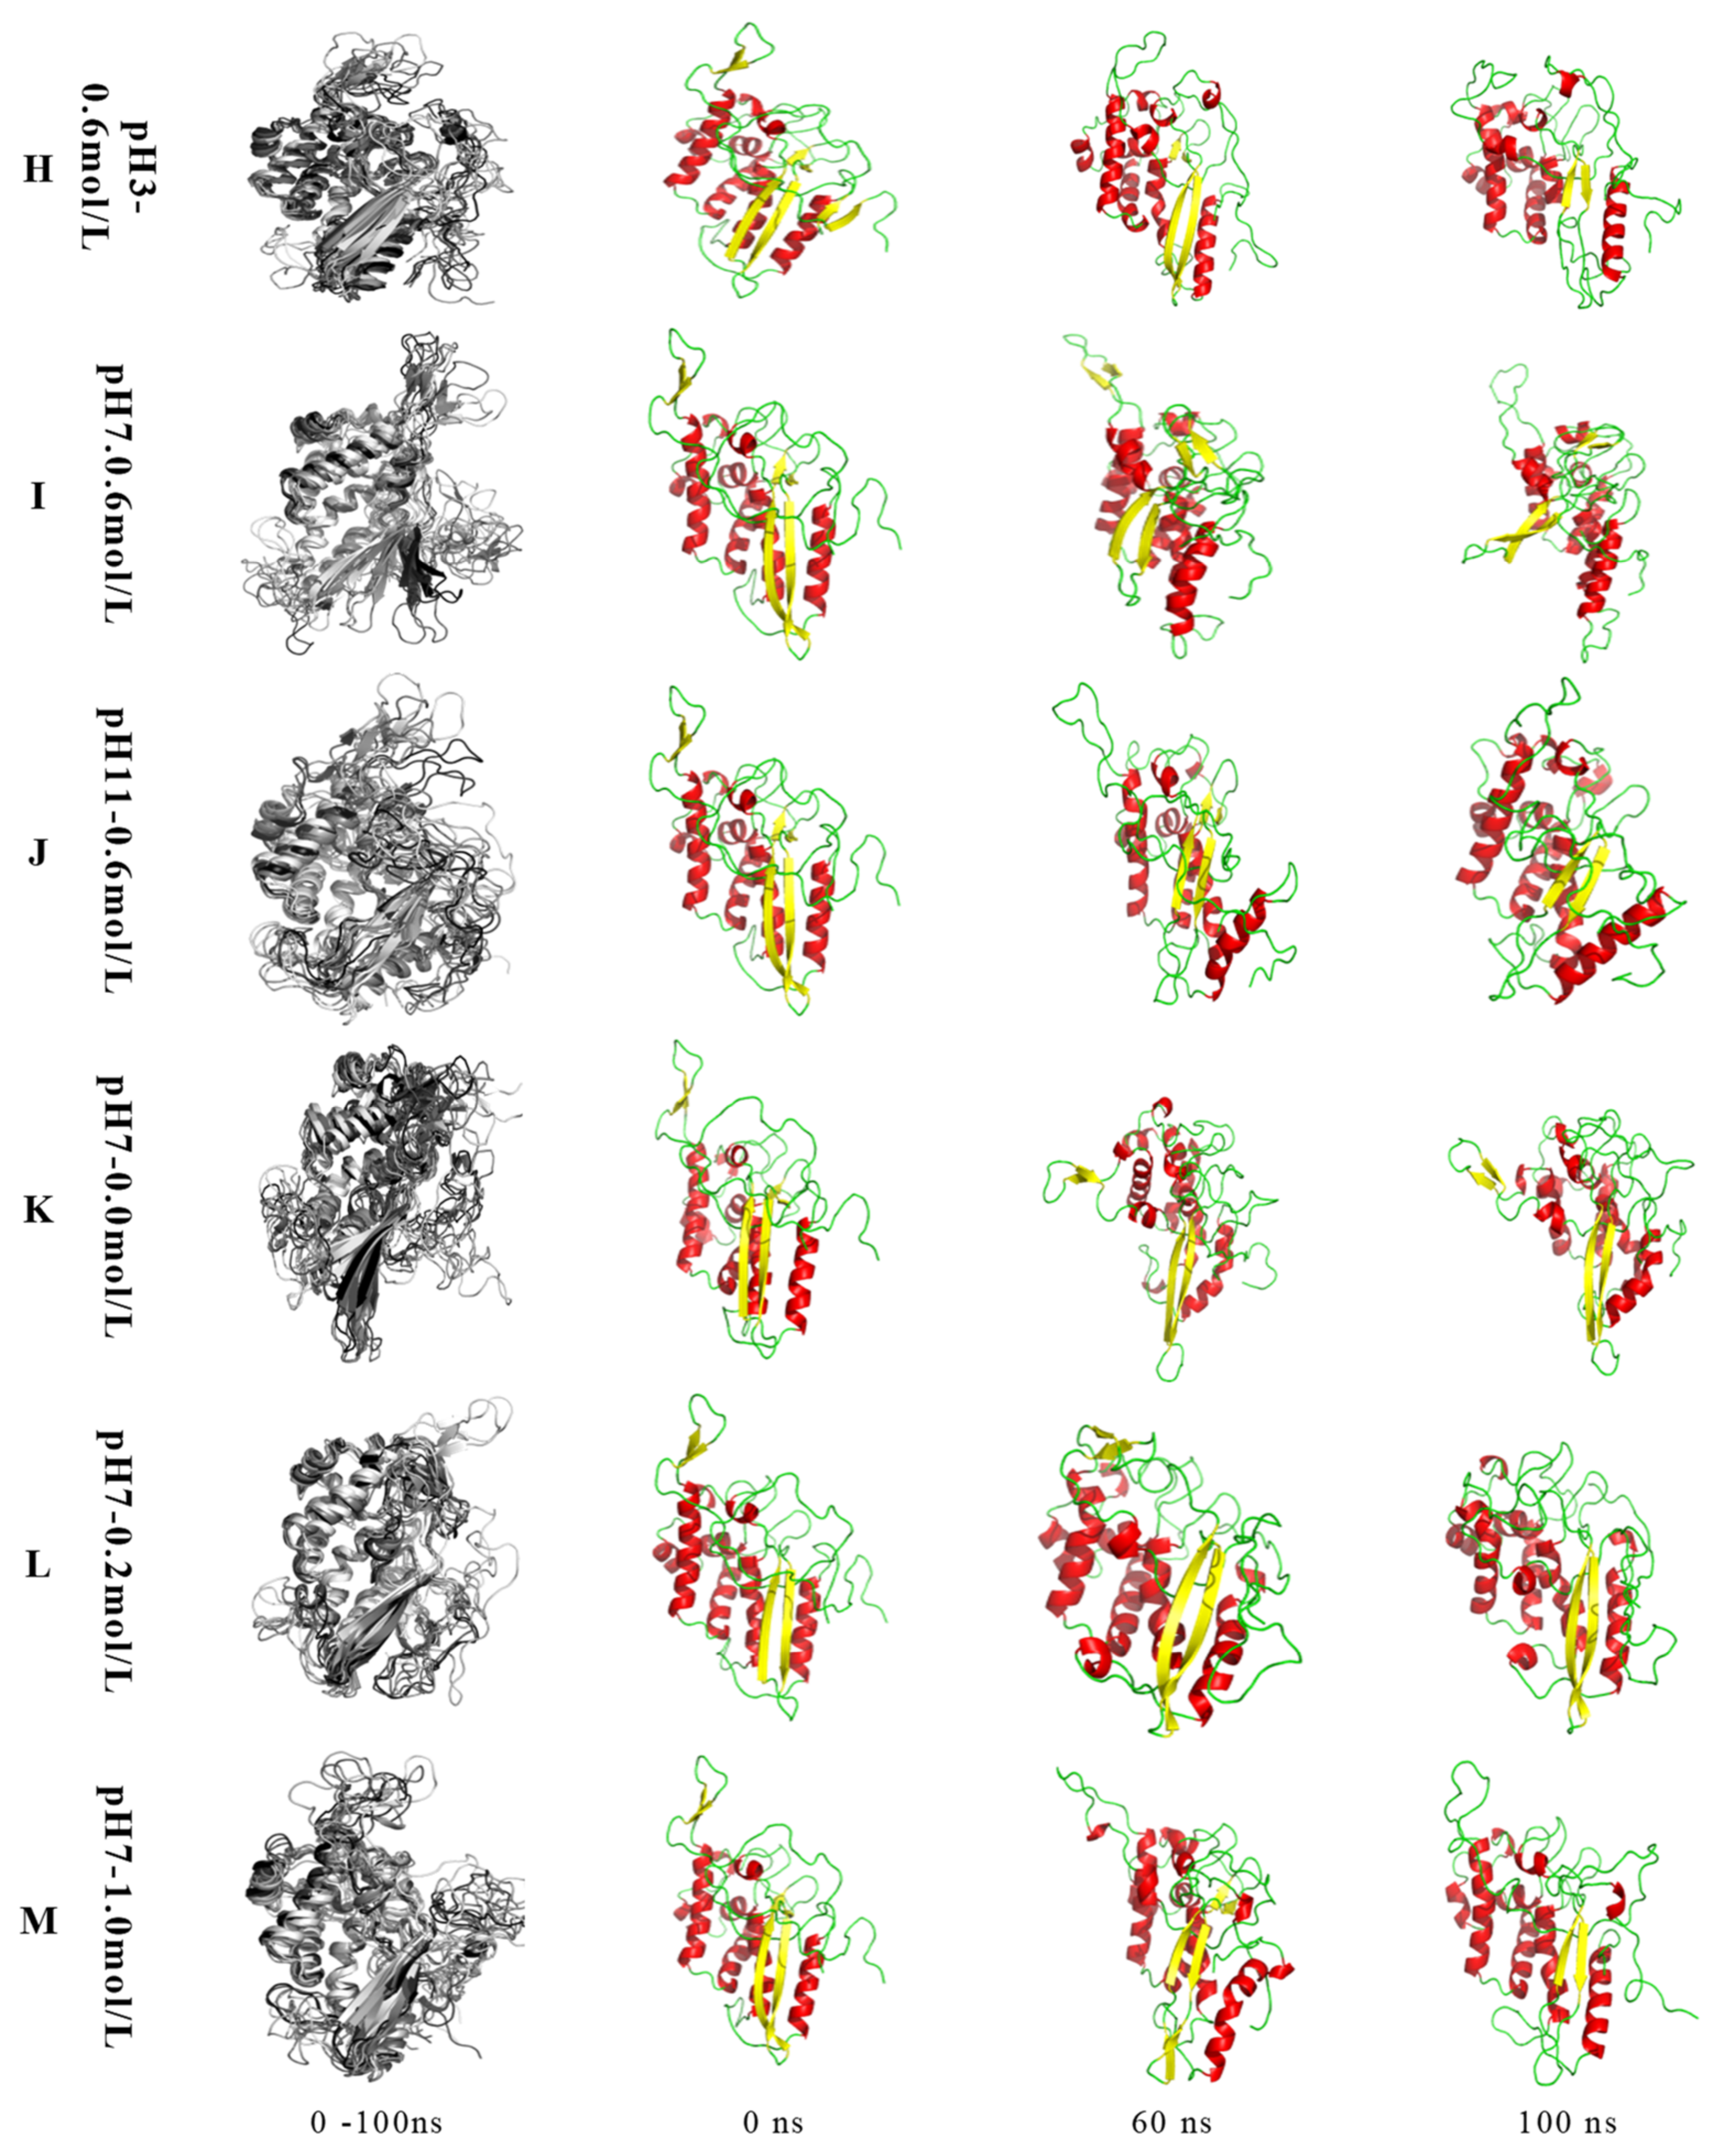
2.2.1. MP Conformation Changes
2.2.2. Changes in Protein Density
2.2.3. Fluctuation of Amino Acids Residues and Their Influence on Myosin Protein Size, Stability, and Structure
2.2.4. Swelling of Myosin
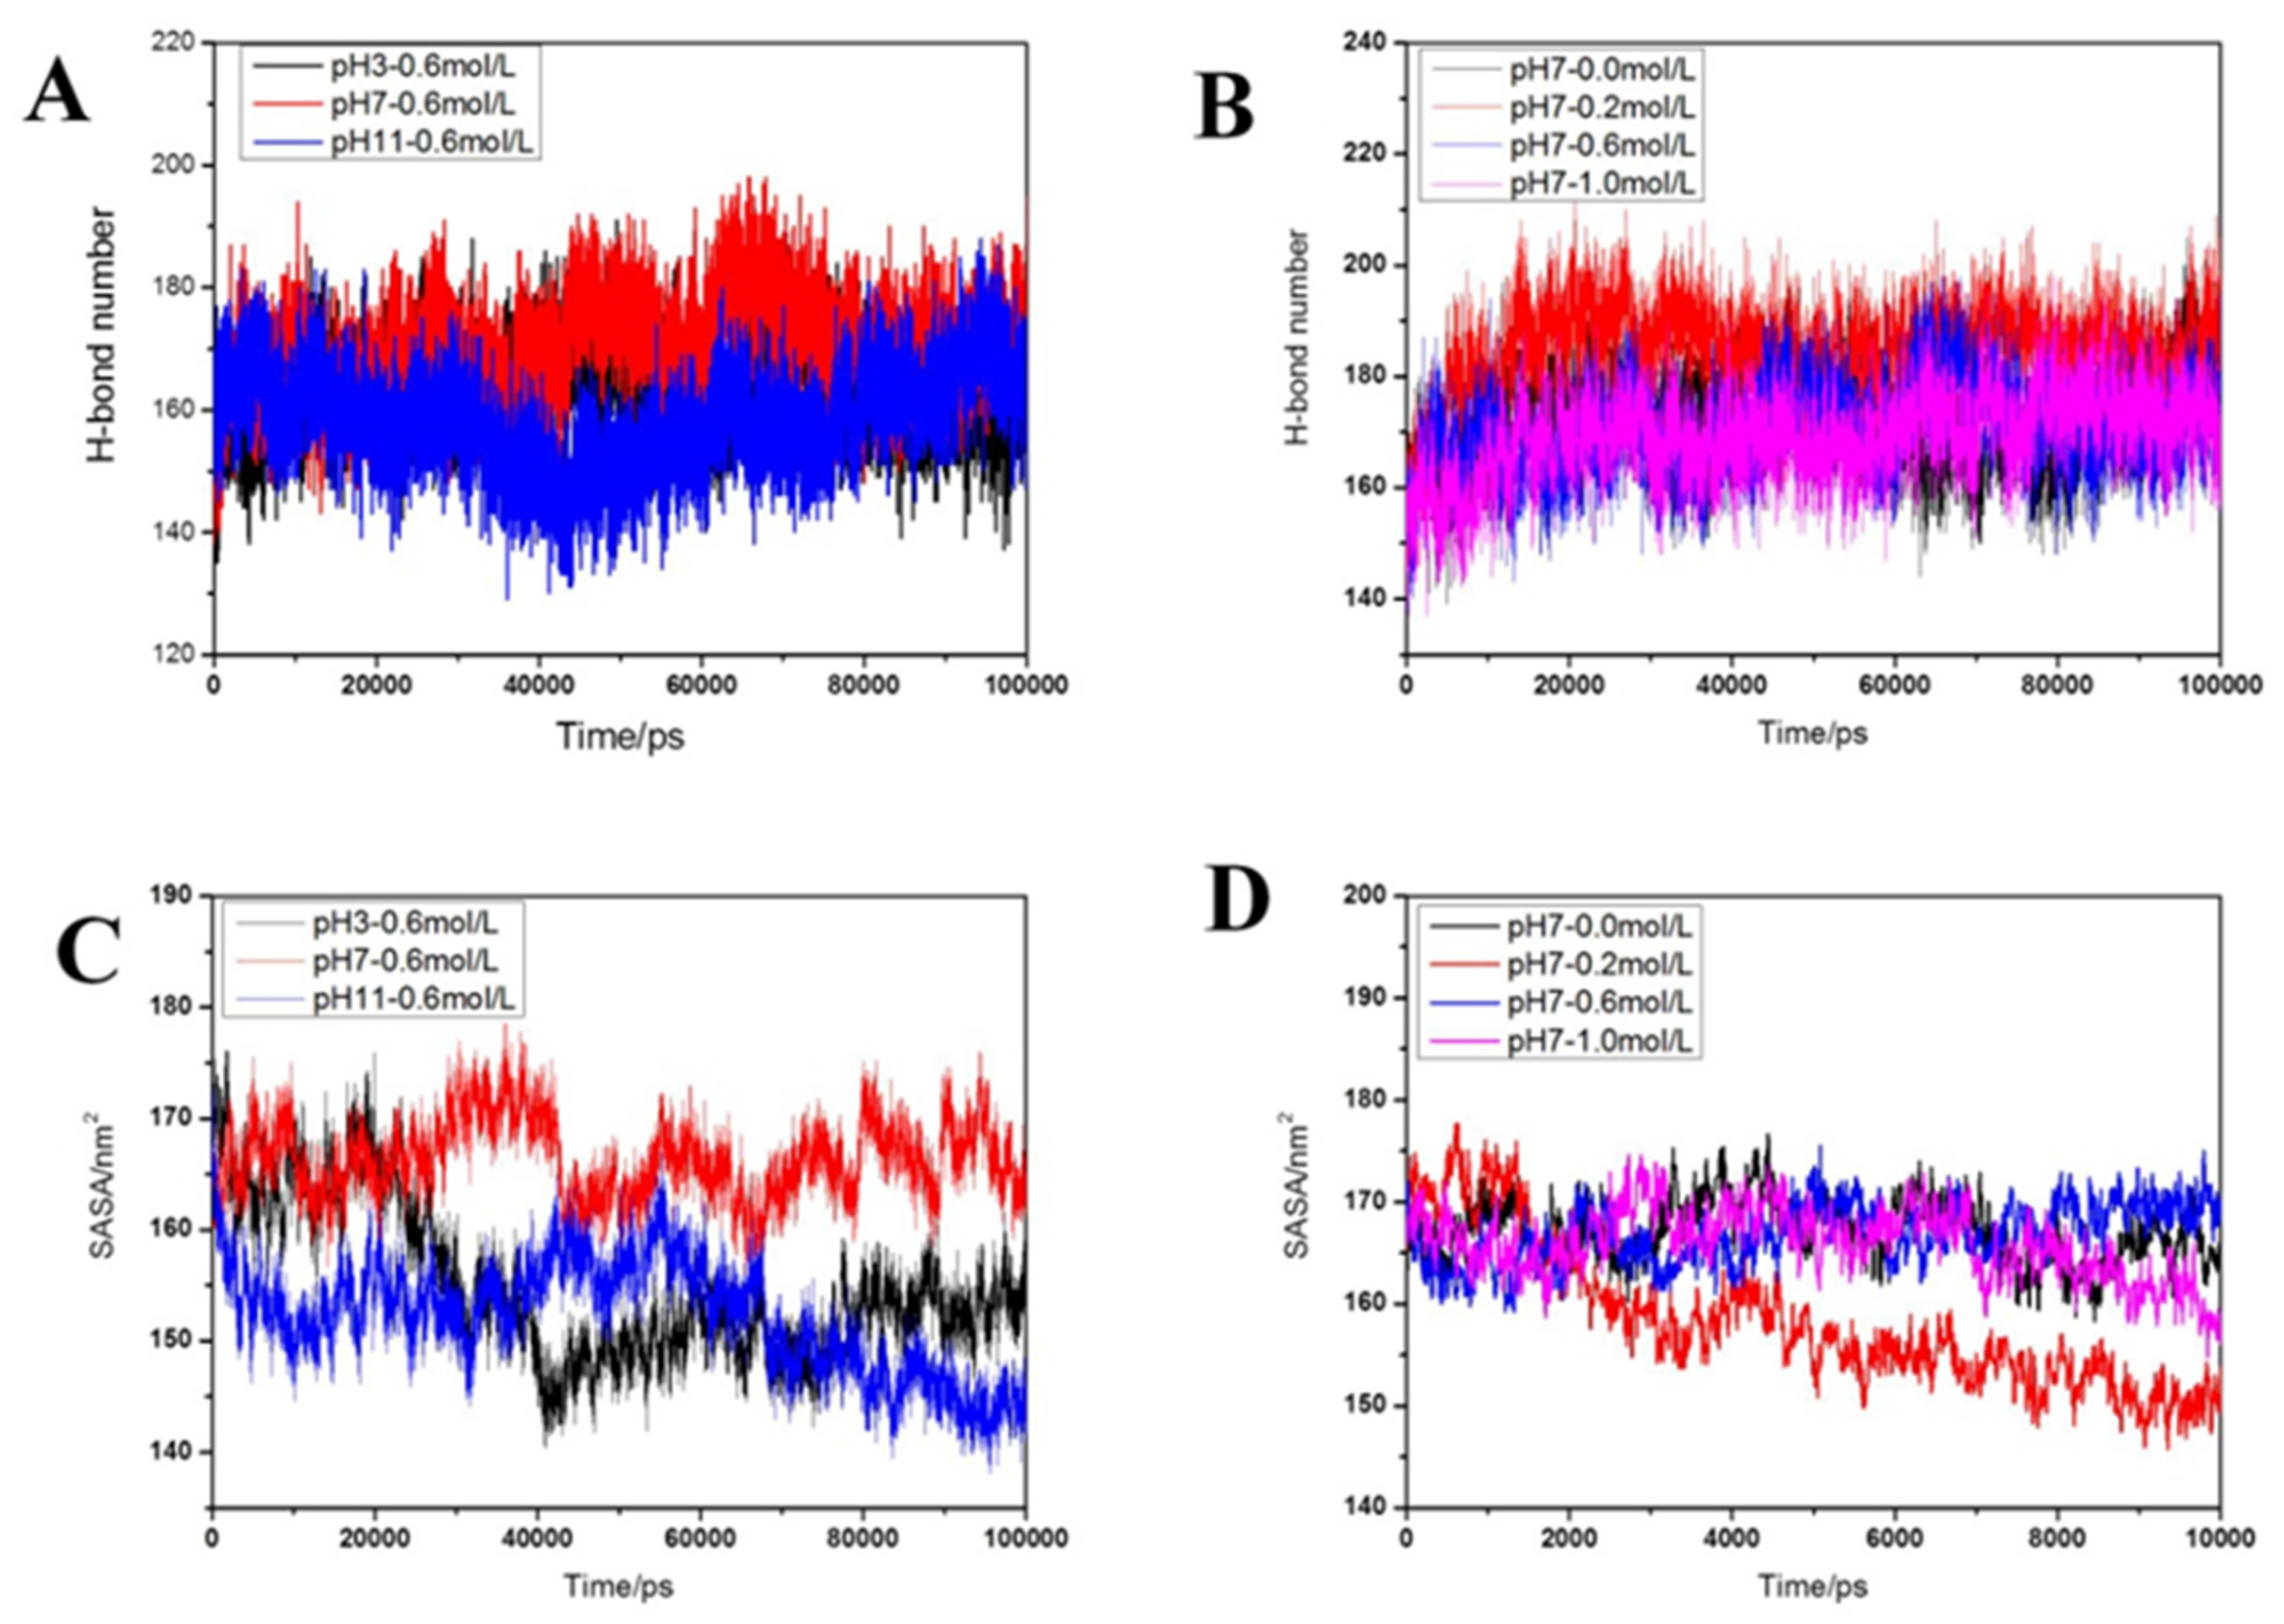
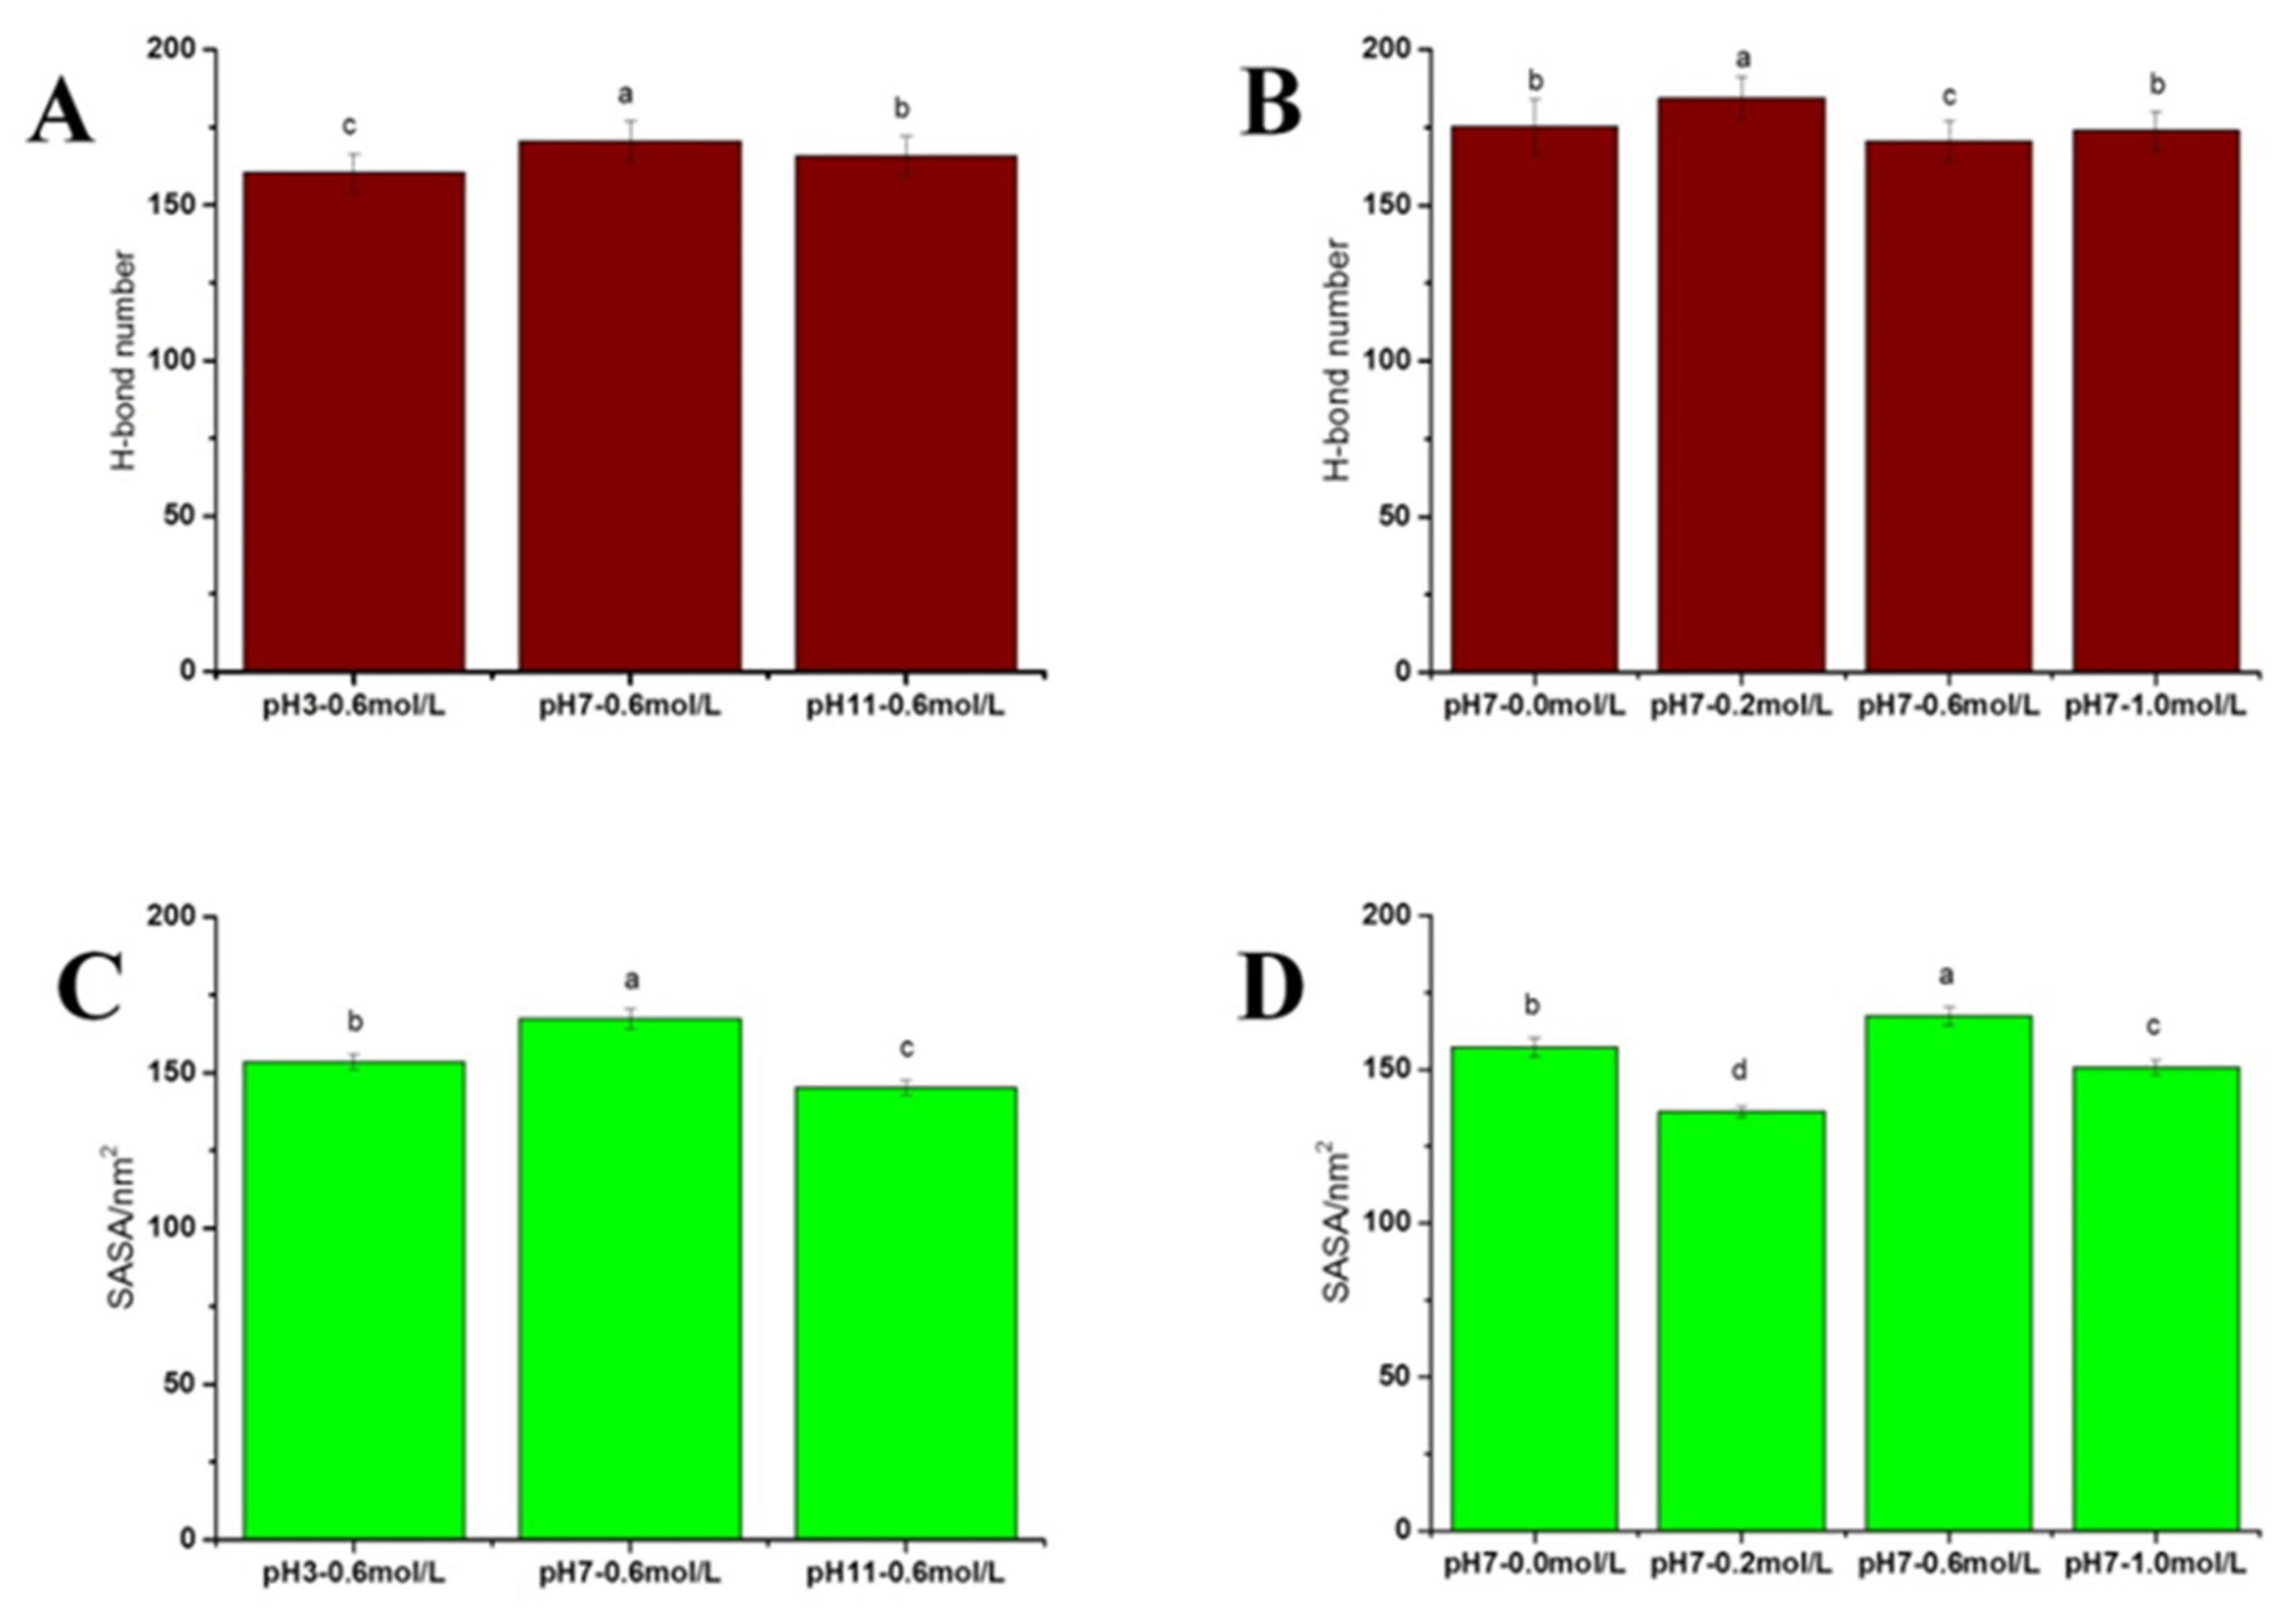
2.2.5. Distribution of Hydrogen Bonds
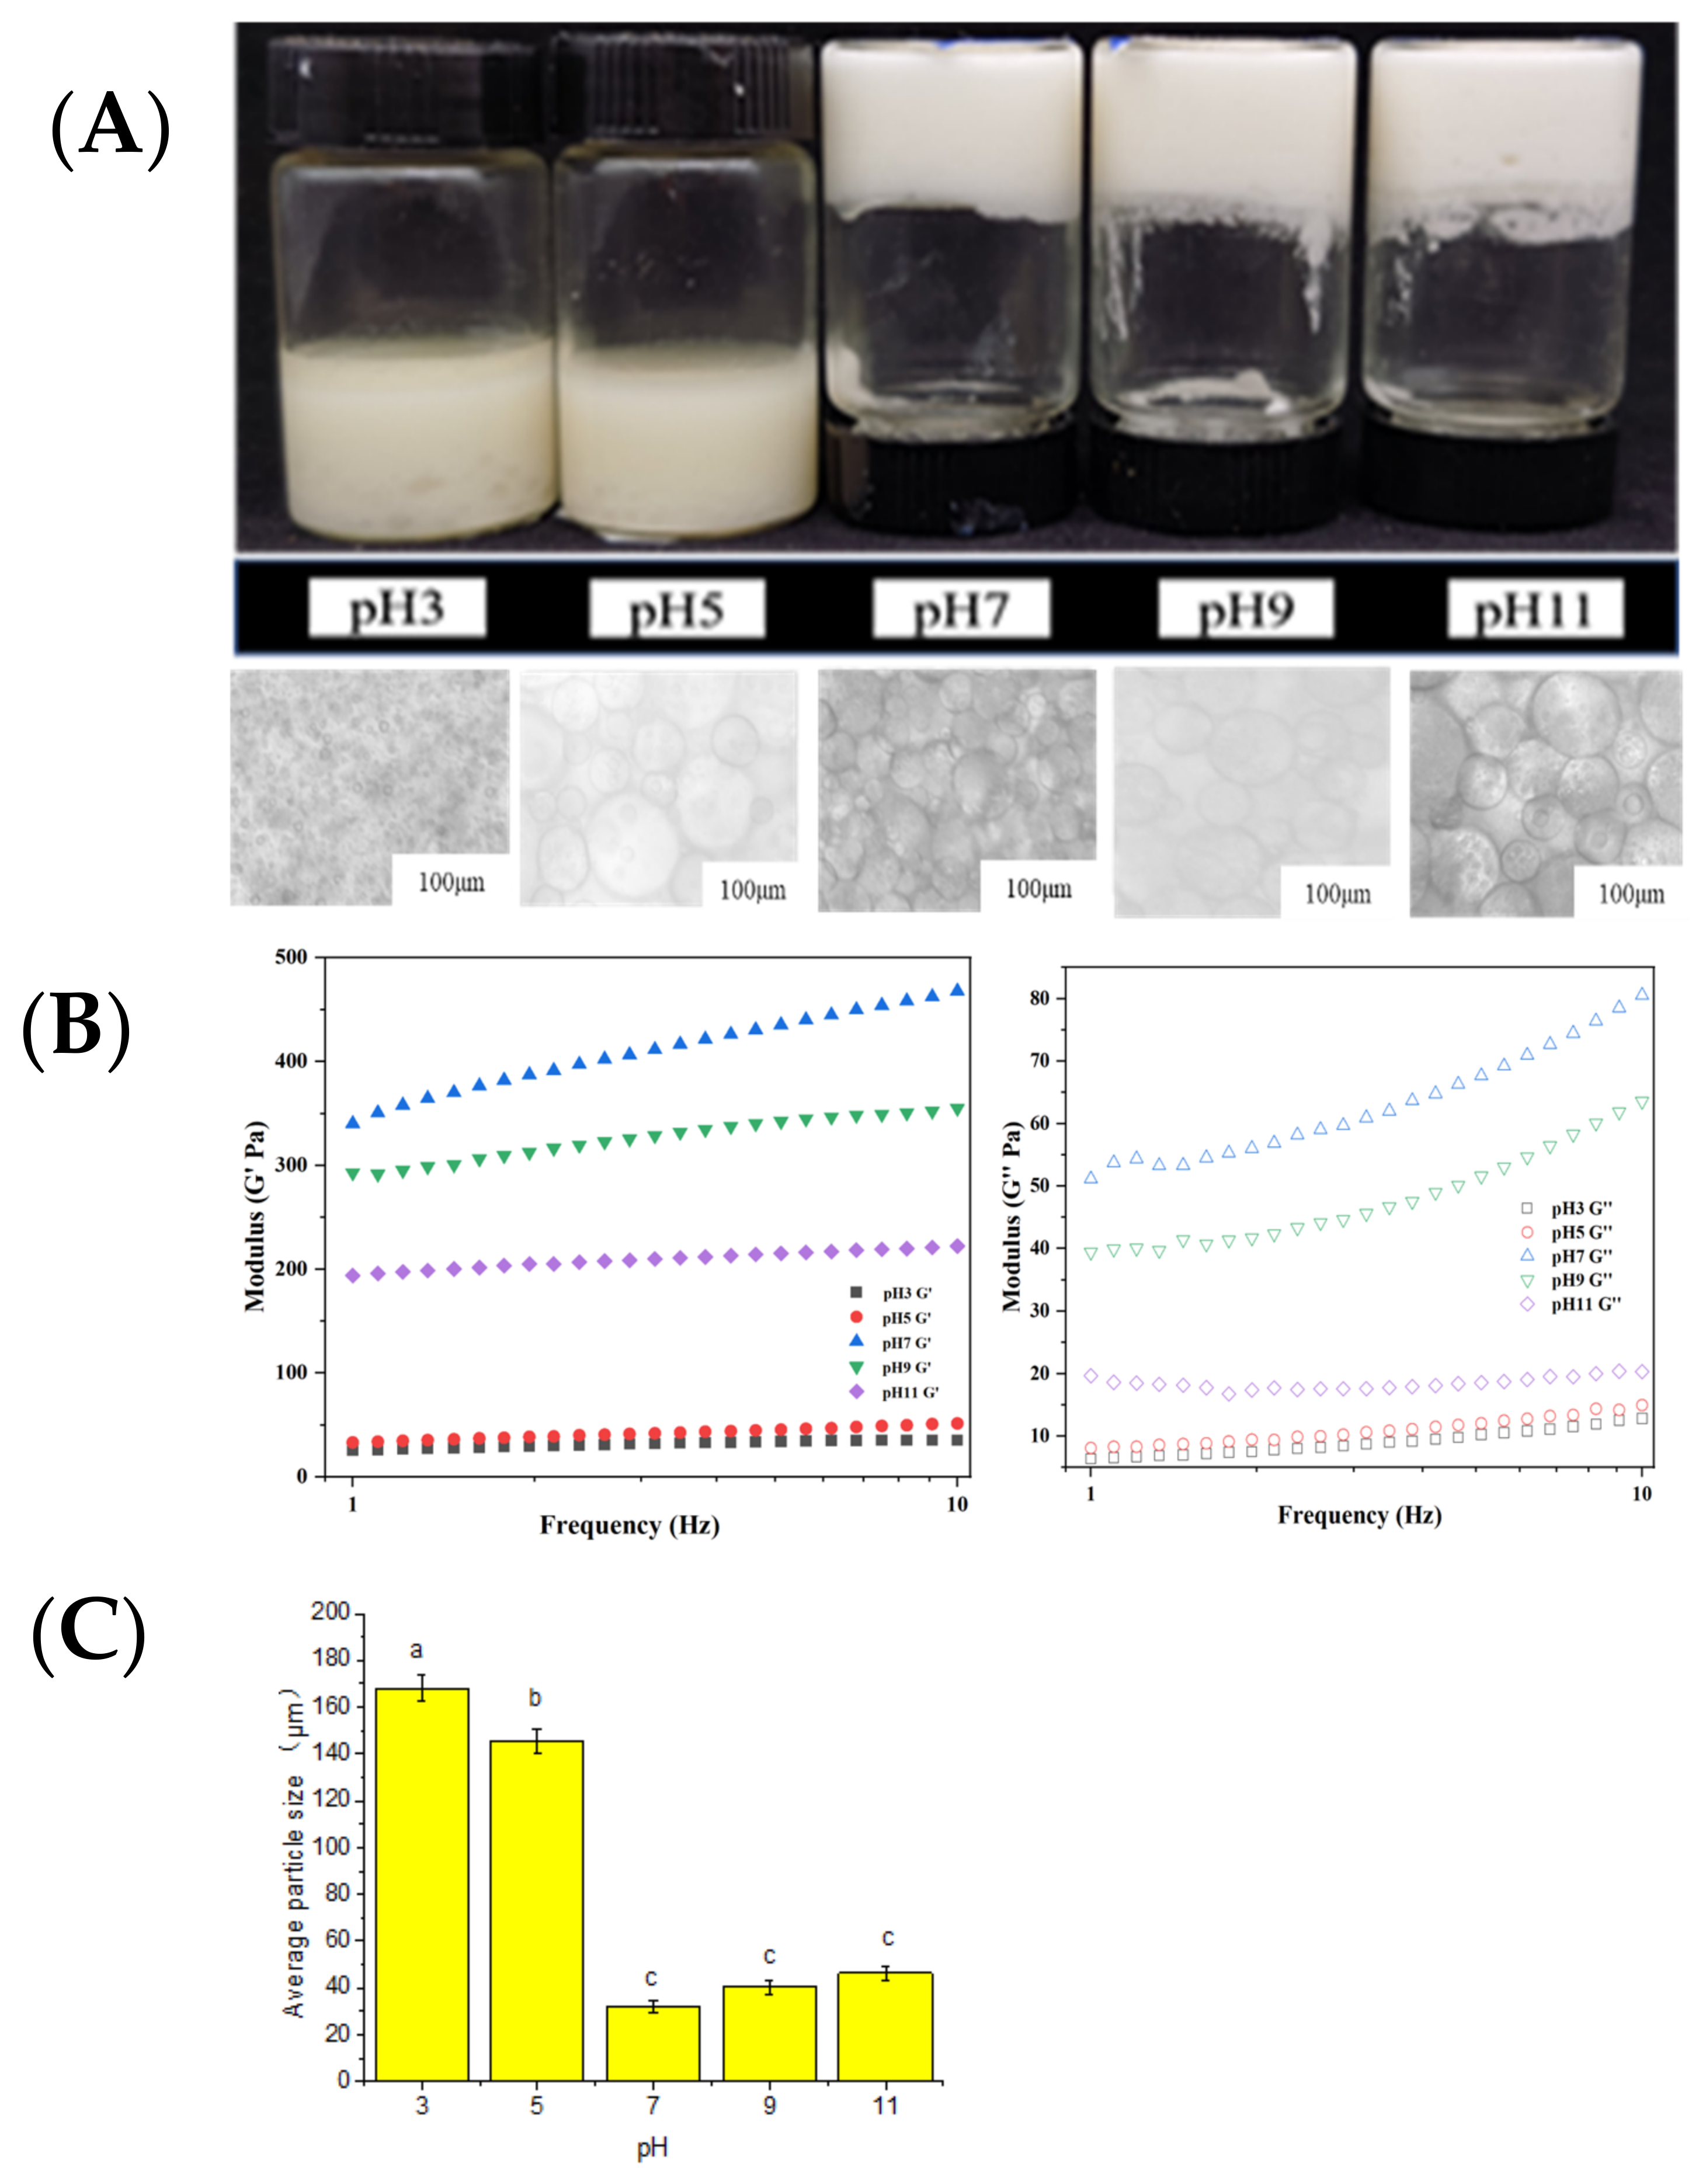
2.3. Influence of pH Value on Emulsion Gel System
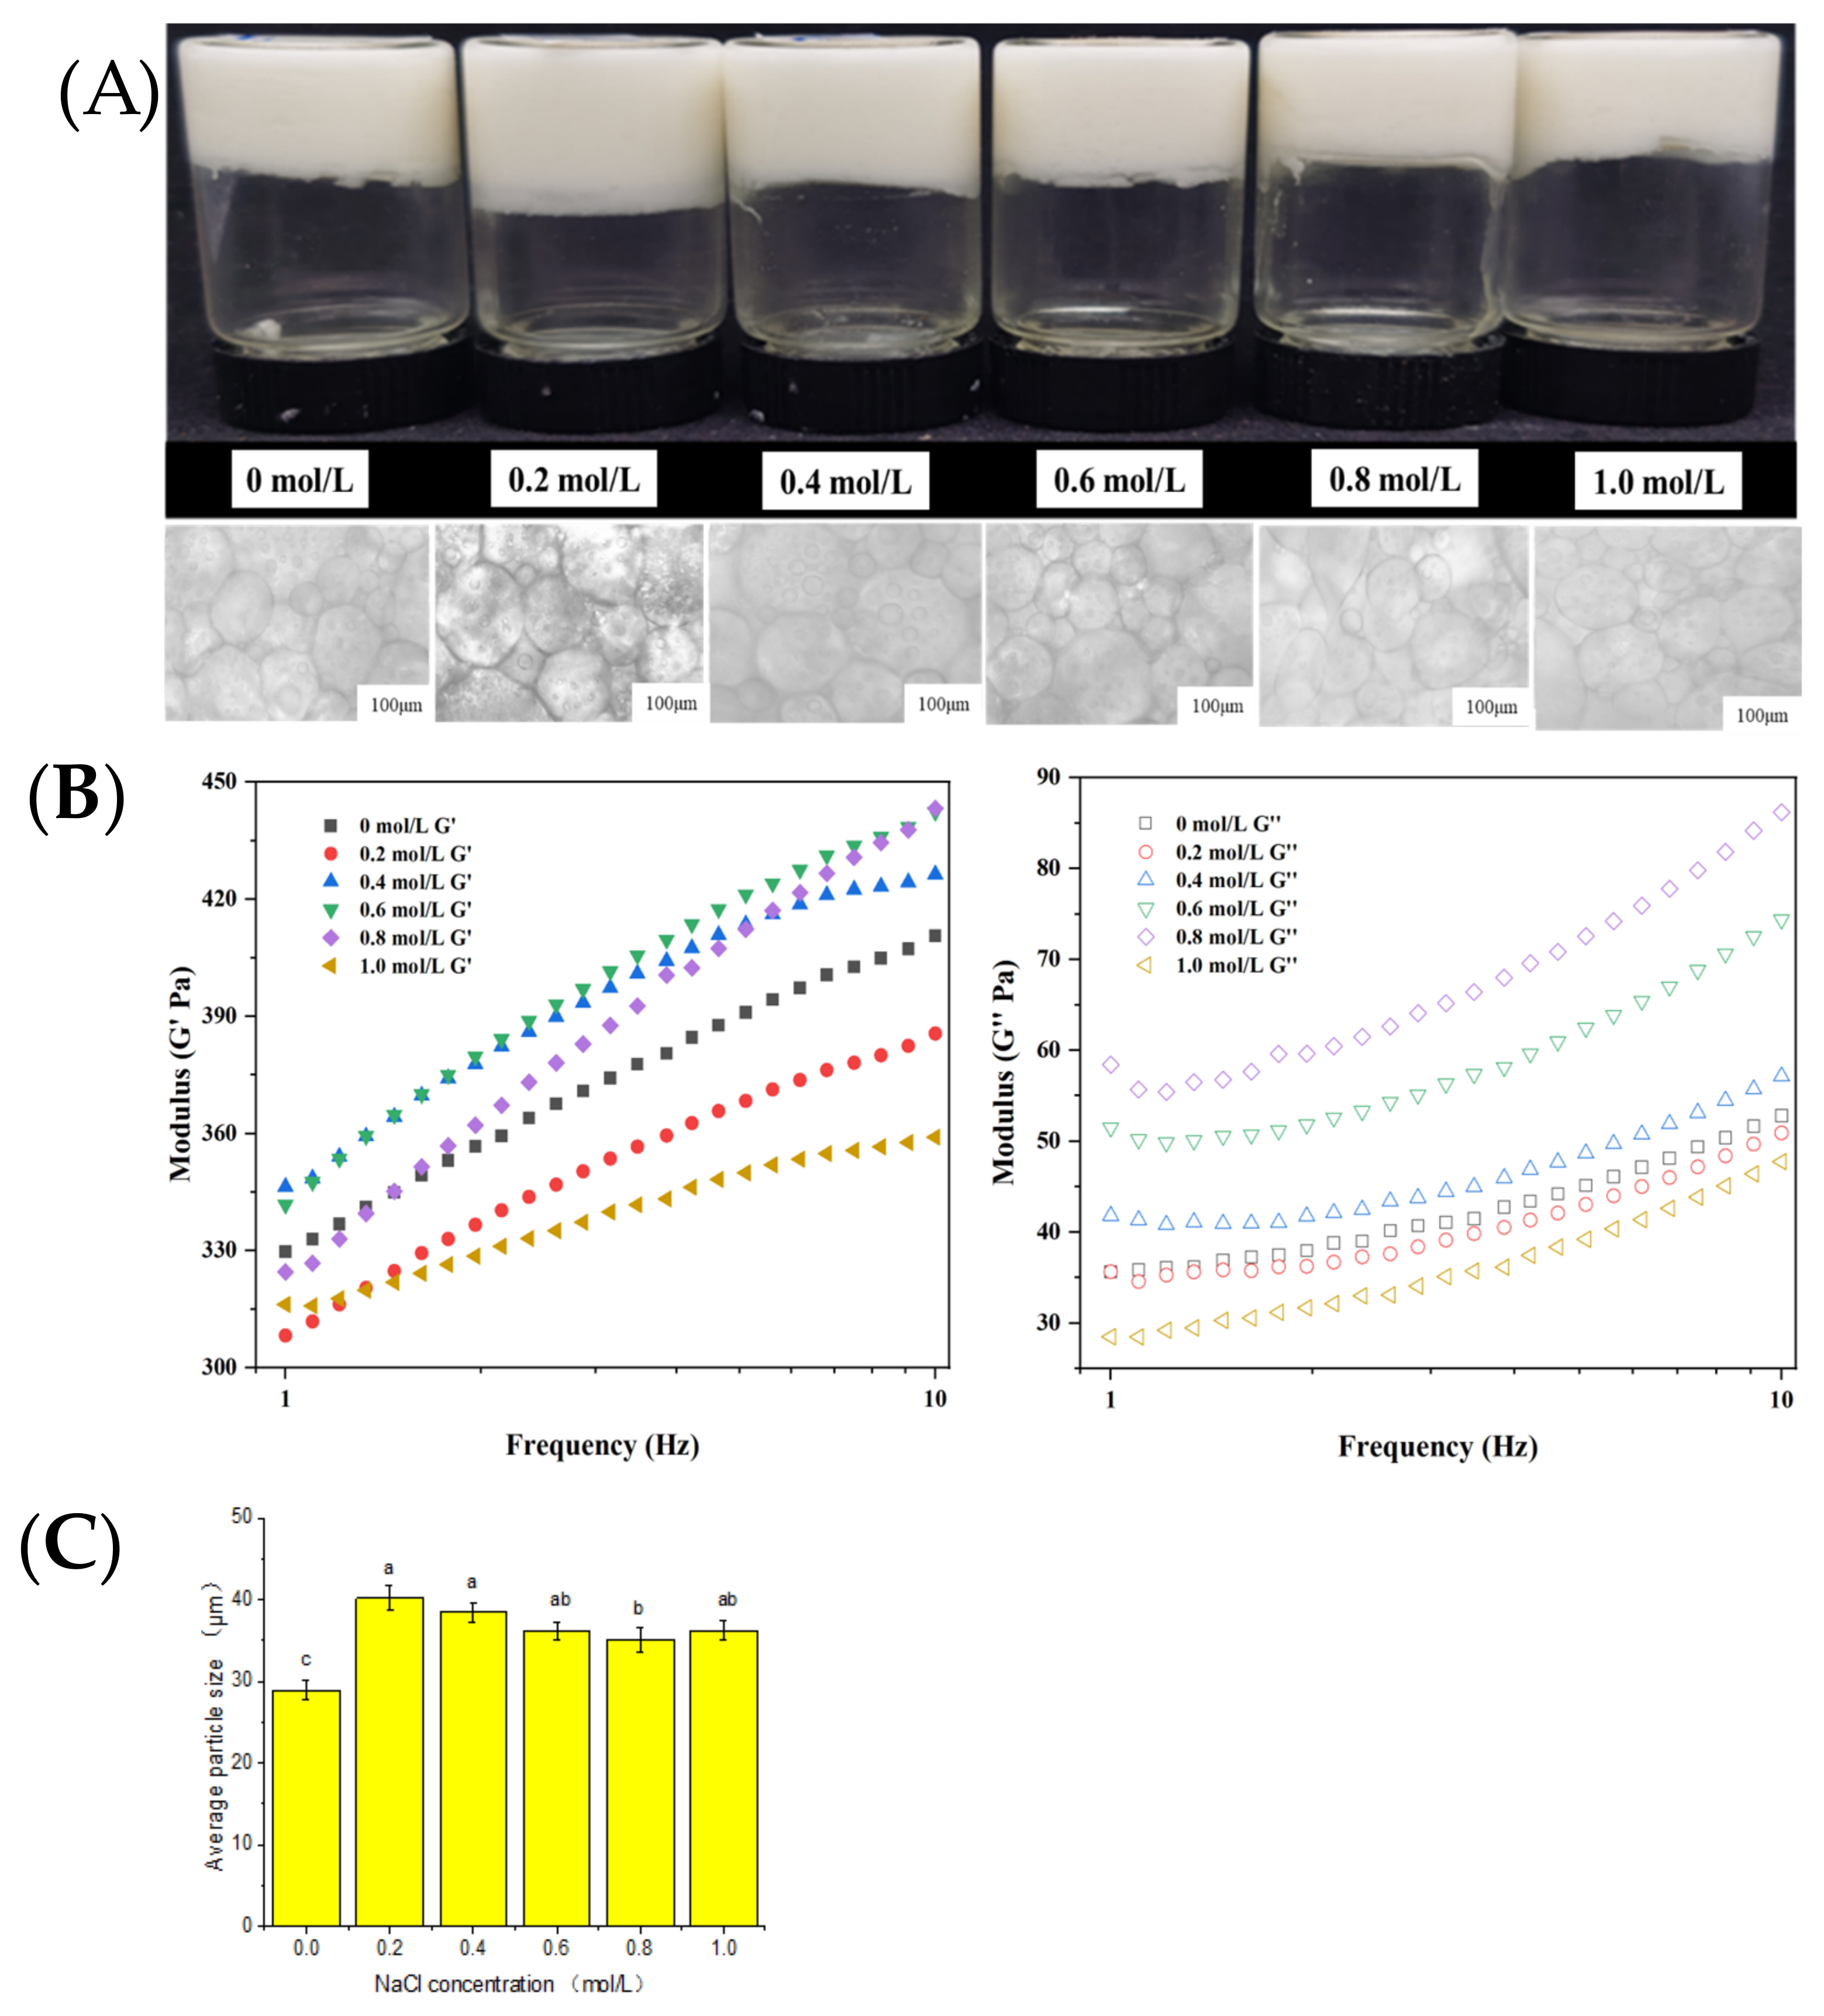
2.4. Influence of Ionic Strength on Emulsion Gel
3. Conclusions
4. Materials and Methods
4.1. Materials
4.2. Preparation of Golden Pompano Myofibrillar Protein
4.3. pH and Salt Treatments on the Microstructure of Myofibrillar Protein
4.4. Molecular Dynamics (MD)—The Effects of pH and NaCl on Myosin
4.5. The Effects of pH and NaCl on Myofibrillar Protein Emulsion Gel System
4.6. Characterization of MP Emulsion Gel
4.6.1. Microstructure of Emulsion Gel
4.6.2. Particle Size Measurements
4.6.3. Dynamic Rheological Properties Analysis
4.7. Statistical Analyses
Supplementary Materials
Author Contributions
Funding
Data Availability Statement
Conflicts of Interest
References
- Yin, L. 2020 Statistics on Fisheries in China. Ocean Fish. 2020, 314, 12–13. [Google Scholar]
- Wang, Y.Q.; Wang, H.F.; Wu, Y.Y.; Xiang, H.; Zhao, Y.Q.; Chen, S.J.; Qi, B.; Li, L.H. Insights into lipid oxidation and free fatty acid profiles to the development of volatile organic compounds in traditional fermented golden pomfret based on multivariate analysis. LWT Food Sci. Technol. 2022, 171, 114112. [Google Scholar] [CrossRef]
- Qiu, C.; Xia, W.; Jiang, Q. Effect of high hydrostatic pressure (HHP) on myofibril-bound serine proteinases and myofibrillar protein in silver carp (Hypophthalmichthys molitrix). Food Res. Int. 2013, 52, 199–205. [Google Scholar] [CrossRef]
- Phillips, L.; Yang, S.T.; Kinsella, J.E. Neutral Salt Effects on Stability of Whey Protein Isolate Foams. J. Food Sci. 1991, 56, 588–589. [Google Scholar] [CrossRef]
- Ochiai, Y.; Ozawa, H. Biochemical and physicochemical characteristics of the major muscle proteins from fish and shellfish. Fish. Sci. 2020, 86, 729–740. [Google Scholar] [CrossRef]
- Wu, C.; Na, X.; Ma, W.; Ren, C.; Zhong, Q.; Wang, T.; Du, M. Strong, elastic, and tough high internal phase emulsions stabilized solely by cod myofibers for multidisciplinary applications. Chem. Eng. J. 2021, 412, 128724. [Google Scholar] [CrossRef]
- Li, R.; He, Q.; Guo, M.; Yuan, J.; Wu, Y.; Wang, S.; Rong, L.; Li, J. Universal and simple method for facile fabrication of sustainable high internal phase emulsions solely using meat protein particles with various pH values. Food Hydrocoll. 2020, 100, 105444. [Google Scholar] [CrossRef]
- Sun, S.; Li, S.H.; Yan, H.J.; Zou, H.N.; Yu, C.P. The conformation and physico-chemical properties of pH-treated golden pompano protein on the oil/water interfacial properties and emulsion stability. Int. J. Food Sci. Technol. 2021, 57, 5611–5620. [Google Scholar] [CrossRef]
- Sun, S.; Zhang, C.H.; Li, S.H.; Yan, H.J.; Zou, H.A.; Yu, C.P. Improving emulsifying properties using mixed natural emulsifiers: Tea saponin and golden pompano protein. Colloid Surf. A 2023, 656, 130311. [Google Scholar] [CrossRef]
- Liu, Y.; Sun, Q.X.; Wei, S.; Xia, Q.Y.; Pan, Y.M.; Ji, H.W.; Deng, C.J.; Hao, J.M.; Liu, S.C. Insight into the correlations among rheological behaviour, protein molecular structure and 3D printability during the processing of surimi from golden pompano (Trachinotus ovatus). Food Chem. 2022, 371, 131046. [Google Scholar] [CrossRef]
- Bos, M.A.; van Vliet, T. Interfacial rheological properties of adsorbed protein layers and surfactants: A review. Adv. Colloid Interface Sci. 2001, 91, 437–471. [Google Scholar] [CrossRef]
- Wang, S.; Yang, J.; Shao, G.; Liu, J.; Wang, J.; Yang, L.; Li, J.; Liu, H.; Zhu, D.; Li, Y.; et al. pH-induced conformational changes and interfacial dilatational rheology of soy protein isolated/soy hull polysaccharide complex and its effects on emulsion stabilization. Food Hydrocoll. 2020, 109, 106075. [Google Scholar] [CrossRef]
- Murray, B.S. Interfacial rheology of food emulsifiers and proteins. Curr. Opin. Colloid Interface Sci. 2002, 7, 426–431. [Google Scholar] [CrossRef]
- Huang, Y.; Zhang, D.; Zhang, Y.; Fang, H.; Zhou, C. Role of ultrasound and l-lysine/l-argnine in improving the physical stability of myosin-soybean oil emulsion. Food Hydrocoll. 2021, 111, 106367. [Google Scholar] [CrossRef]
- Xiong, Y.L. Chemical and Physical Characteristics of Meat|Protein Functionality. In Encyclopedia of Meat Sciences, 2nd ed.; Dikeman, M., Devine, C., Eds.; Academic Press: Oxford, UK, 2014; pp. 267–273. [Google Scholar]
- Shi, T.; Liu, H.; Song, T.; Xiong, Z.; Yuan, L.; McClements, D.J.; Jin, W.; Sun, Q.; Gao, R. Use of l-arginine-assisted ultrasonic treatment to change the molecular and interfacial characteristics of fish myosin and enhance the physical stability of the emulsion. Food Chem. 2021, 342, 128314. [Google Scholar] [CrossRef]
- Gao, R.; Shi, T.; Sun, Q.; Li, X.; McClements, D.J.; Yuan, L. Effects of l-arginine and l-histidine on heat-induced aggregation of fish myosin: Bighead carp (Aristichthys nobilis). Food Chem. 2019, 295, 320–326. [Google Scholar] [CrossRef]
- Sun, L.-C.; Lin, Y.-C.; Liu, W.-F.; Qiu, X.-J.; Cao, K.-Y.; Liu, G.-M.; Cao, M.-J. Effect of pH shifting on conformation and gelation properties of myosin from skeletal muscle of blue round scads (Decapterus maruadsi). Food Hydrocoll. 2019, 93, 137–145. [Google Scholar] [CrossRef]
- Wu, X.; Xu, L.Y.; Li, E.M.; Dong, G. Application of molecular dynamics simulation in biomedicine. Chem. Biol. Drug Des. 2022, 99, 789–800. [Google Scholar] [CrossRef]
- Filipe, H.A.L.; Loura, L.M.S. Molecular Dynamics Simulations: Advances and Applications. Molecules 2022, 27, 2105. [Google Scholar] [CrossRef]
- Mészáros, B.; Tompa, P.; Simon, I.; Dosztányi, Z. Molecular Principles of the Interactions of Disordered Proteins. J. Mol. Biol. 2007, 372, 549–561. [Google Scholar] [CrossRef]
- Zhou, H.X.; Pang, X. Electrostatic Interactions in Protein Structure, Folding, Binding, and Condensation. Chem. Rev. 2018, 118, 1691–1741. [Google Scholar] [CrossRef] [PubMed]
- Dey, T. Fennema’s Food Chemistry (4th ed.), Srinivasan Damodaran, Kirk L. Parkin, Owen R. Fennema (Eds.), CRC Press, 2007. Food Chem. 2012, 135, 146–149. [Google Scholar] [CrossRef]
- Zhu, N.; Zang, M.; Wang, S.; Zhang, S.; Zhao, B.; Liu, M.; Li, S.; Wu, Q.; Liu, B.; Zhao, Y.; et al. Modulating the structure of lamb myofibrillar protein gel influenced by psyllium husk powder at different NaCl concentrations: Effect of intermolecular interactions. Food Chem. 2022, 397, 133852. [Google Scholar] [CrossRef]
- Zhang, X.; Chen, X.; Gong, Y.; Li, Z.; Guo, Y.; Yu, D.; Pan, M. Emulsion gels stabilized by soybean protein isolate and pectin: Effects of high intensity ultrasound on the gel properties, stability and β-carotene digestive characteristics. Ultrason Sonochem. 2021, 79, 105756. [Google Scholar] [CrossRef]
- Zhu, L.; Song, X.; Pan, F.; Tuersuntuoheti, T.; Zheng, F.; Li, Q.; Hu, S.; Zhao, F.; Sun, J.; Sun, B. Interaction mechanism of kafirin with ferulic acid and tetramethyl pyrazine: Multiple spectroscopic and molecular modeling studies. Food Chem. 2021, 363, 130298. [Google Scholar] [CrossRef]
- De Oliveira, T.V.; Polêto, M.D.; Barbosa, S.V.; Coimbra, J.; De Oliveira, E.B. Impacts of Ca2+ cation and temperature on bovine α-lactalbumin secondary structures and foamability—Insights from computational molecular dynamics. Food Chem. 2022, 367, 130733. [Google Scholar] [CrossRef]
- Ali, S.A.; Hassan, M.I.; Islam, A.; Ahmad, F. A review of methods available to estimate solvent-accessible surface areas of soluble proteins in the folded and unfolded states. Curr. Protein Pept. Sci. 2014, 15, 456–476. [Google Scholar] [CrossRef] [PubMed]
- Parrinello, M.; Rahman, A. Polymorphic transitions in single crystals: A new molecular dynamics method. J. Appl. Phys. 1981, 52, 7182. [Google Scholar] [CrossRef]
- Chen, X.; Zou, Y.; Han, M.; Pan, L.; Xing, T.; Xu, X.; Zhou, G. Solubilisation of myosin in a solution of low ionic strength l-histidine: Significance of the imidazole ring. Food Chem. 2016, 196, 42–49. [Google Scholar] [CrossRef]
- Wang, M.; Chen, L.; Han, B.; Wang, R.; Liu, Y.; Fan, X.; Lv, X.; Huang, F.; Han, M.; Kang, Z.; et al. Effects of NaCl on the interactions between neomethyl hesperidin dihydrochalcone and pork myofibrillar protein: Their relevance to gelation properties. Food Res. Int. 2022, 162, 111983. [Google Scholar] [CrossRef]
- Dai, H.; Sun, Y.; Xia, W.; Ma, L.; Li, L.; Wang, Q.; Zhang, Y. Effect of phospholipids on the physicochemical properties of myofibrillar proteins solution mediated by NaCl concentration. LWT 2021, 141, 110895. [Google Scholar] [CrossRef]
- Jarpa-Parra, M.; Bamdad, F.; Tian, Z.; Zeng, H.; Temelli, F.; Chen, L. Impact of pH on molecular structure and surface properties of lentil legumin-like protein and its application as foam stabilizer. Colloids Surf B Biointerfaces 2015, 132, 45–53. [Google Scholar] [CrossRef] [PubMed]
- Müller-Späth, S.; Soranno, A.; Hirschfeld, V.; Hofmann, H.; Rüegger, S.; Reymond, L.; Nettels, D.; Schuler, B. From the Cover: Charge interactions can dominate the dimensions of intrinsically disordered proteins. Proc. Natl. Acad. Sci. USA 2010, 107, 14609–14614. [Google Scholar] [CrossRef]
- Sizemore, S.M.; Cope, S.M.; Roy, A.; Ghirlanda, G.; Vaiana, S.M. Slow Internal Dynamics and Charge Expansion in the Disordered Protein CGRP: A Comparison with Amylin. Biophys. J. 2015, 109, 1038–1048. [Google Scholar] [CrossRef]
- Bakry, A.M.; Huang, J.; Zhai, Y.; Huang, Q. Myofibrillar protein with κ- or λ-carrageenans as novel shell materials for microencapsulation of tuna oil through complex coacervation. Food Hydrocoll. 2019, 96, 43–53. [Google Scholar] [CrossRef]
- Schäffer, A.A.; Aravind, L.; Madden, T.L.; Shavirin, S.; Spouge, J.L.; Wolf, Y.I.; Koonin, E.V.; Altschul, S.F. Improving the accuracy of PSI-BLAST protein database searches with composition-based statistics and other refinements. Nucleic Acids Res. 2001, 29, 2994–3005. [Google Scholar] [CrossRef]
- Webb, B.; Sali, A. Comparative Protein Structure Modeling Using MODELLER. Curr. Protoc. Bioinform. 2016, 54, 5.6.1–5.6.37. [Google Scholar] [CrossRef]
- Martí-Renom, M.A.; Stuart, A.C.; Fiser, A.; Sánchez, R.; Melo, F.; Sali, A. Comparative protein structure modeling of genes and genomes. Annu. Rev. Biophys. Biomol. Struct. 2000, 29, 291–325. [Google Scholar] [CrossRef]
- Søndergaard, C.R.; Olsson, M.H.; Rostkowski, M.; Jensen, J.H. Improved Treatment of Ligands and Coupling Effects in Empirical Calculation and Rationalization of pKa Values. J. Chem. Theory Comput. 2011, 7, 2284–2295. [Google Scholar] [CrossRef]
- Olsson, M.H.; Søndergaard, C.R.; Rostkowski, M.; Jensen, J.H. PROPKA3: Consistent Treatment of Internal and Surface Residues in Empirical pKa Predictions. J. Chem. Theory Comput. 2011, 7, 525–537. [Google Scholar] [CrossRef]
- Maier, J.A.; Martinez, C.; Kasavajhala, K.; Wickstrom, L.; Hauser, K.E.; Simmerling, C. ff14SB: Improving the Accuracy of Protein Side Chain and Backbone Parameters from ff99SB. J. Chem. Theory Comput. 2015, 11, 3696–3713. [Google Scholar] [CrossRef]
- Pan, F.; Zhao, L.; Cai, S.; Tang, X.; Mehmood, A.; Alnadari, F.; Tuersuntuoheti, T.; Zhou, N.; Ai, X. Prediction and evaluation of the 3D structure of Macadamia integrifolia antimicrobial protein 2 (MiAMP2) and its interaction with palmitoleic acid or oleic acid: An integrated computational approach. Food Chem. 2022, 367, 130677. [Google Scholar] [CrossRef] [PubMed]
- Hess, B. P-LINCS: A Parallel Linear Constraint Solver for Molecular Simulation. J. Chem. Theory Comput. 2008, 4, 116–122. [Google Scholar] [CrossRef] [PubMed]
- Berendsen, H.J.C.; Postma, J.P.M.; van Gunsteren, W.F.; DiNola, A.; Haak, J.R. Molecular dynamics with coupling to an external bath. J. Chem. Phys. 1984, 81, 3684. [Google Scholar] [CrossRef]
- Darden, T.; York, D.; Pedersen, L. Particle mesh Ewald: AnN⋅log(N) method for Ewald sums in large systems. J. Chem. Phys. 1993, 98, 10089. [Google Scholar] [CrossRef]
- Kabsch, W.; Sander, C. Dictionary of protein secondary structure: Pattern recognition of hydrogen-bonded and geometrical features. Biopolymers 1983, 22, 2577–2637. [Google Scholar] [CrossRef]
- Humphrey, W.; Dalke, A.; Schulten, K. VMD: Visual molecular dynamics. J. Mol. Graph. 1996, 14, 33–38. [Google Scholar] [CrossRef]


Disclaimer/Publisher’s Note: The statements, opinions and data contained in all publications are solely those of the individual author(s) and contributor(s) and not of MDPI and/or the editor(s). MDPI and/or the editor(s) disclaim responsibility for any injury to people or property resulting from any ideas, methods, instructions or products referred to in the content. |
© 2023 by the authors. Licensee MDPI, Basel, Switzerland. This article is an open access article distributed under the terms and conditions of the Creative Commons Attribution (CC BY) license (https://creativecommons.org/licenses/by/4.0/).
Share and Cite
Xue, C.; Pei, Z.; Wen, P.; Chin, Y.; Hu, Y. Effects of pH and NaCl on the Spatial Structure and Conformation of Myofibrillar Proteins and the Emulsion Gel System—Insights from Computational Molecular Dynamics on Myosin of Golden Pompano. Gels 2023, 9, 270. https://doi.org/10.3390/gels9040270
Xue C, Pei Z, Wen P, Chin Y, Hu Y. Effects of pH and NaCl on the Spatial Structure and Conformation of Myofibrillar Proteins and the Emulsion Gel System—Insights from Computational Molecular Dynamics on Myosin of Golden Pompano. Gels. 2023; 9(4):270. https://doi.org/10.3390/gels9040270
Chicago/Turabian StyleXue, Changfeng, Zhisheng Pei, Pan Wen, Yaoxian Chin, and Yaqin Hu. 2023. "Effects of pH and NaCl on the Spatial Structure and Conformation of Myofibrillar Proteins and the Emulsion Gel System—Insights from Computational Molecular Dynamics on Myosin of Golden Pompano" Gels 9, no. 4: 270. https://doi.org/10.3390/gels9040270
APA StyleXue, C., Pei, Z., Wen, P., Chin, Y., & Hu, Y. (2023). Effects of pH and NaCl on the Spatial Structure and Conformation of Myofibrillar Proteins and the Emulsion Gel System—Insights from Computational Molecular Dynamics on Myosin of Golden Pompano. Gels, 9(4), 270. https://doi.org/10.3390/gels9040270