3.1. Structural Analysis
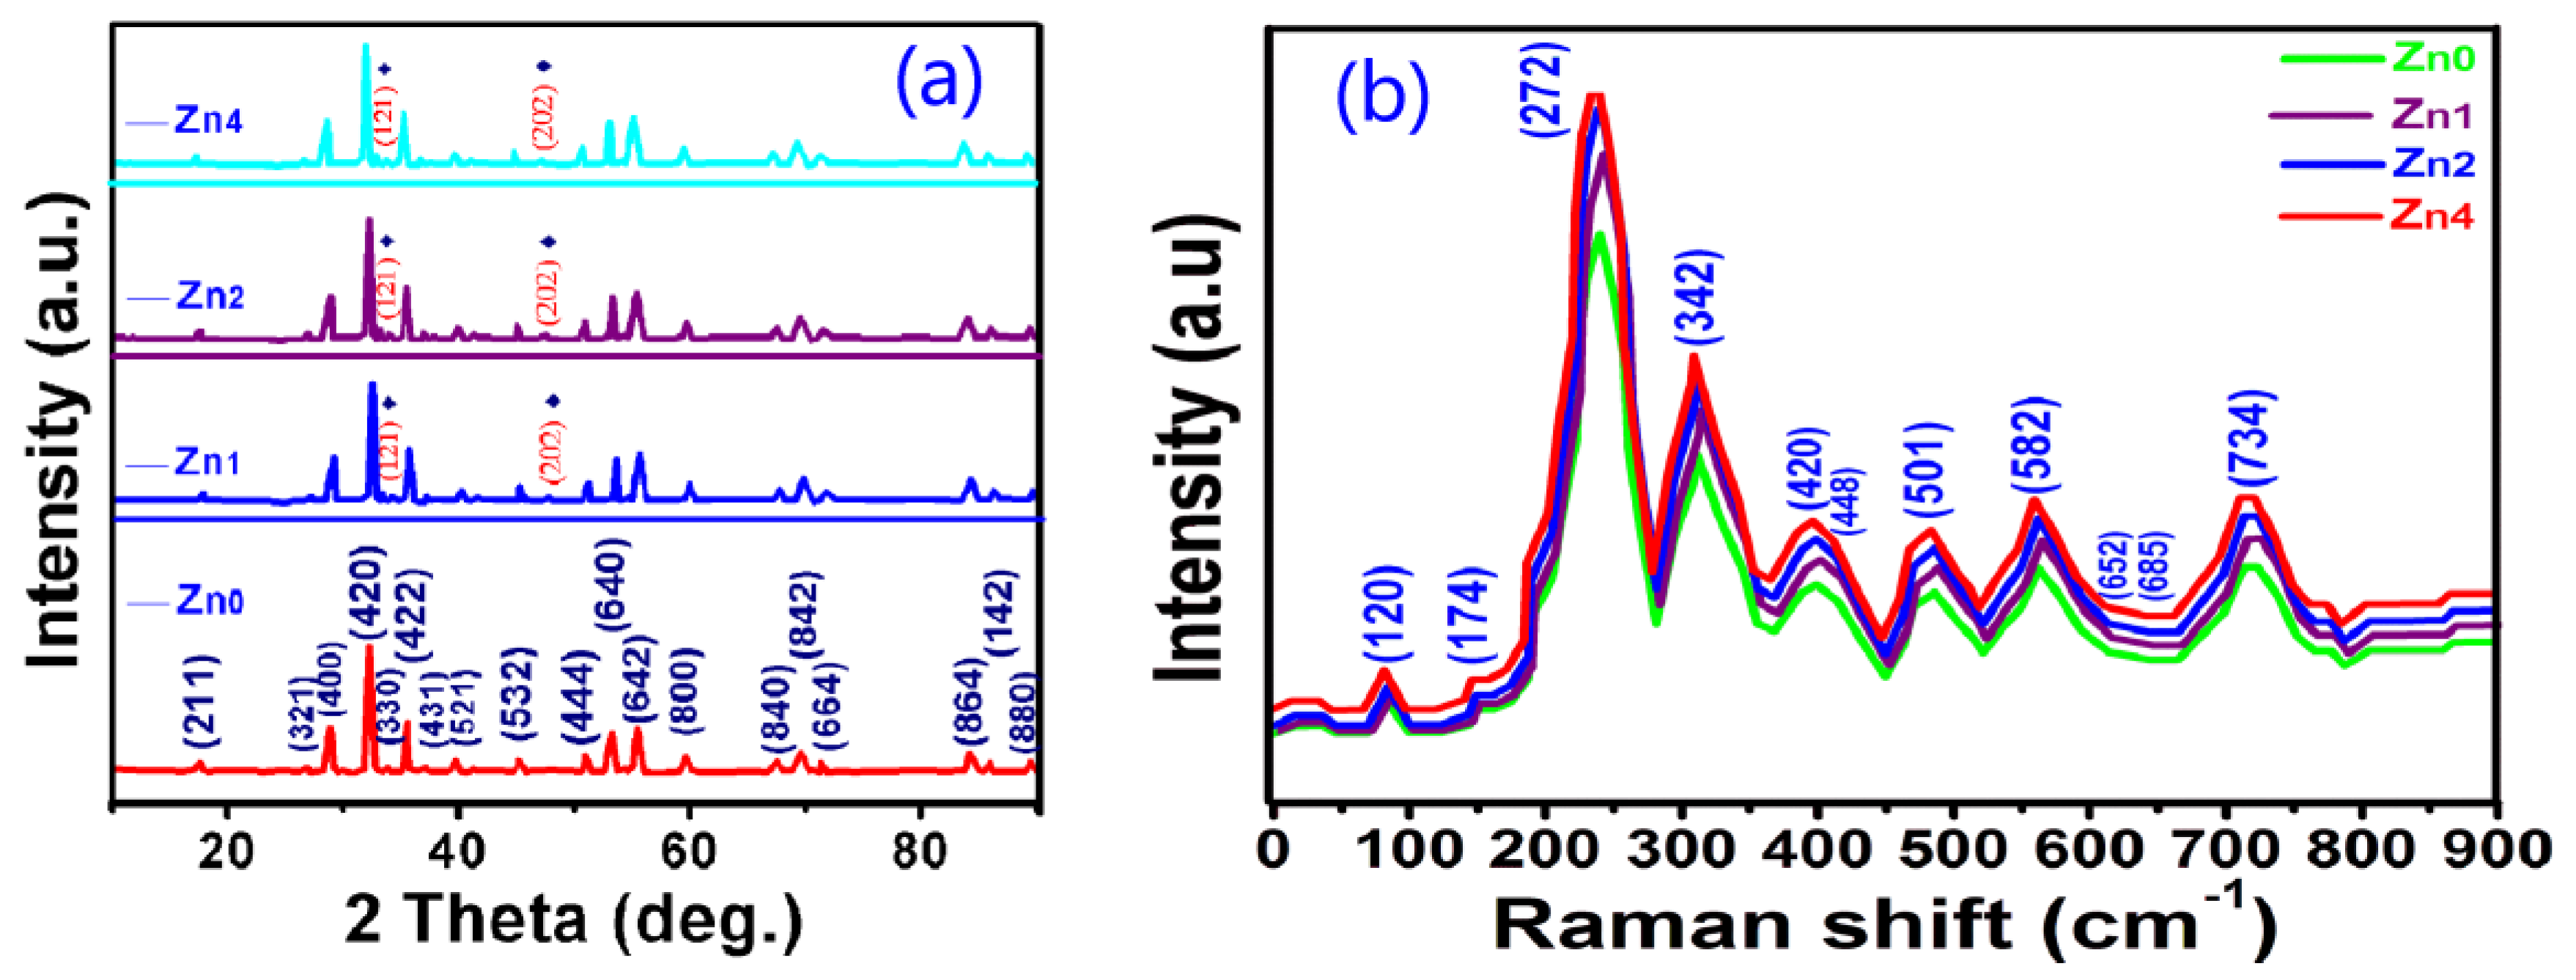
Figure 1a depicts the XRD patterns of Zn-YIG nanoparticles prepared by the sol-gel method with different contents of zinc (0, 0.01, 0.02 and 0.04 wt.%), corresponding to Zn
0, Zn
1, Zn
2 and Zn
4). It can be seen that no impurity phase was observed in the samples, except for small amount of orthoferrite phase (CoD 96-210-1387), marked by ♦.
To supply the XRD results and confirm the occupied sites of Zn ion, Raman spectroscopy measurements were carried out.
Figure 1b shows the Raman spectra of the Zn-YIG samples measured in the normal condition. In a typical garnet crystal structure, according to group theory, it is predicted that the first-order Raman spectrum contains 14T
2g + 3A
1g + 8E
g modes, while a 17T
1umode should appear in the infrared spectrum. However, only 11 of the above-mentioned 25 theoretically predicted Raman modes were detected in the Zn-YIG samples. This may be due to two factors: one is that the intensity of some modes are too weak to be observed, and the other is that there is an accidental degeneracy factor of several vibrational modes at room pressure. The degeneracy of these modes is derived from two aspects: (1) the small wave vectors with every mode splitting into a singly optical degenerate longitudinal vibration and (2) the double optical degenerate transverse vibration under the influence of long-range electrostatic forces. From
Figure 1b, it can be seen that the curves of all samples are roughly the same, except for the relative peak intensities. The Raman peaks corresponding to the 120, 174 and 272 sites were derived from the cation translationalmotions. For pure garnet at the 272 site, the T
2g mode stems from the characteristic translational vibration mode of a cation in the dodecahedral and tetrahedral sites, and the sharp feature of the T
2g mode is derived from the Franck Condon principle. For Zn-YIG samples, vibration mode frequency changes little, but peak intensity changes slightly, which may be due to the influence of larger zinc ion doping. In addition, by analyzing the Raman spectrum, we can also obtain these results: (1) the peaks at the 685 and 420 sites come from the combination of modes T
2g and E
g, (2) the peaks at the 448 and 341 sites belong to the combination of modes A
1g + T
2g and modes A
1g + E
g, (3) the peaks at the 120, 174 and 582 sites result from mode T
2g, and (4) the peak at the 652 site stems from phonon mode E
g.
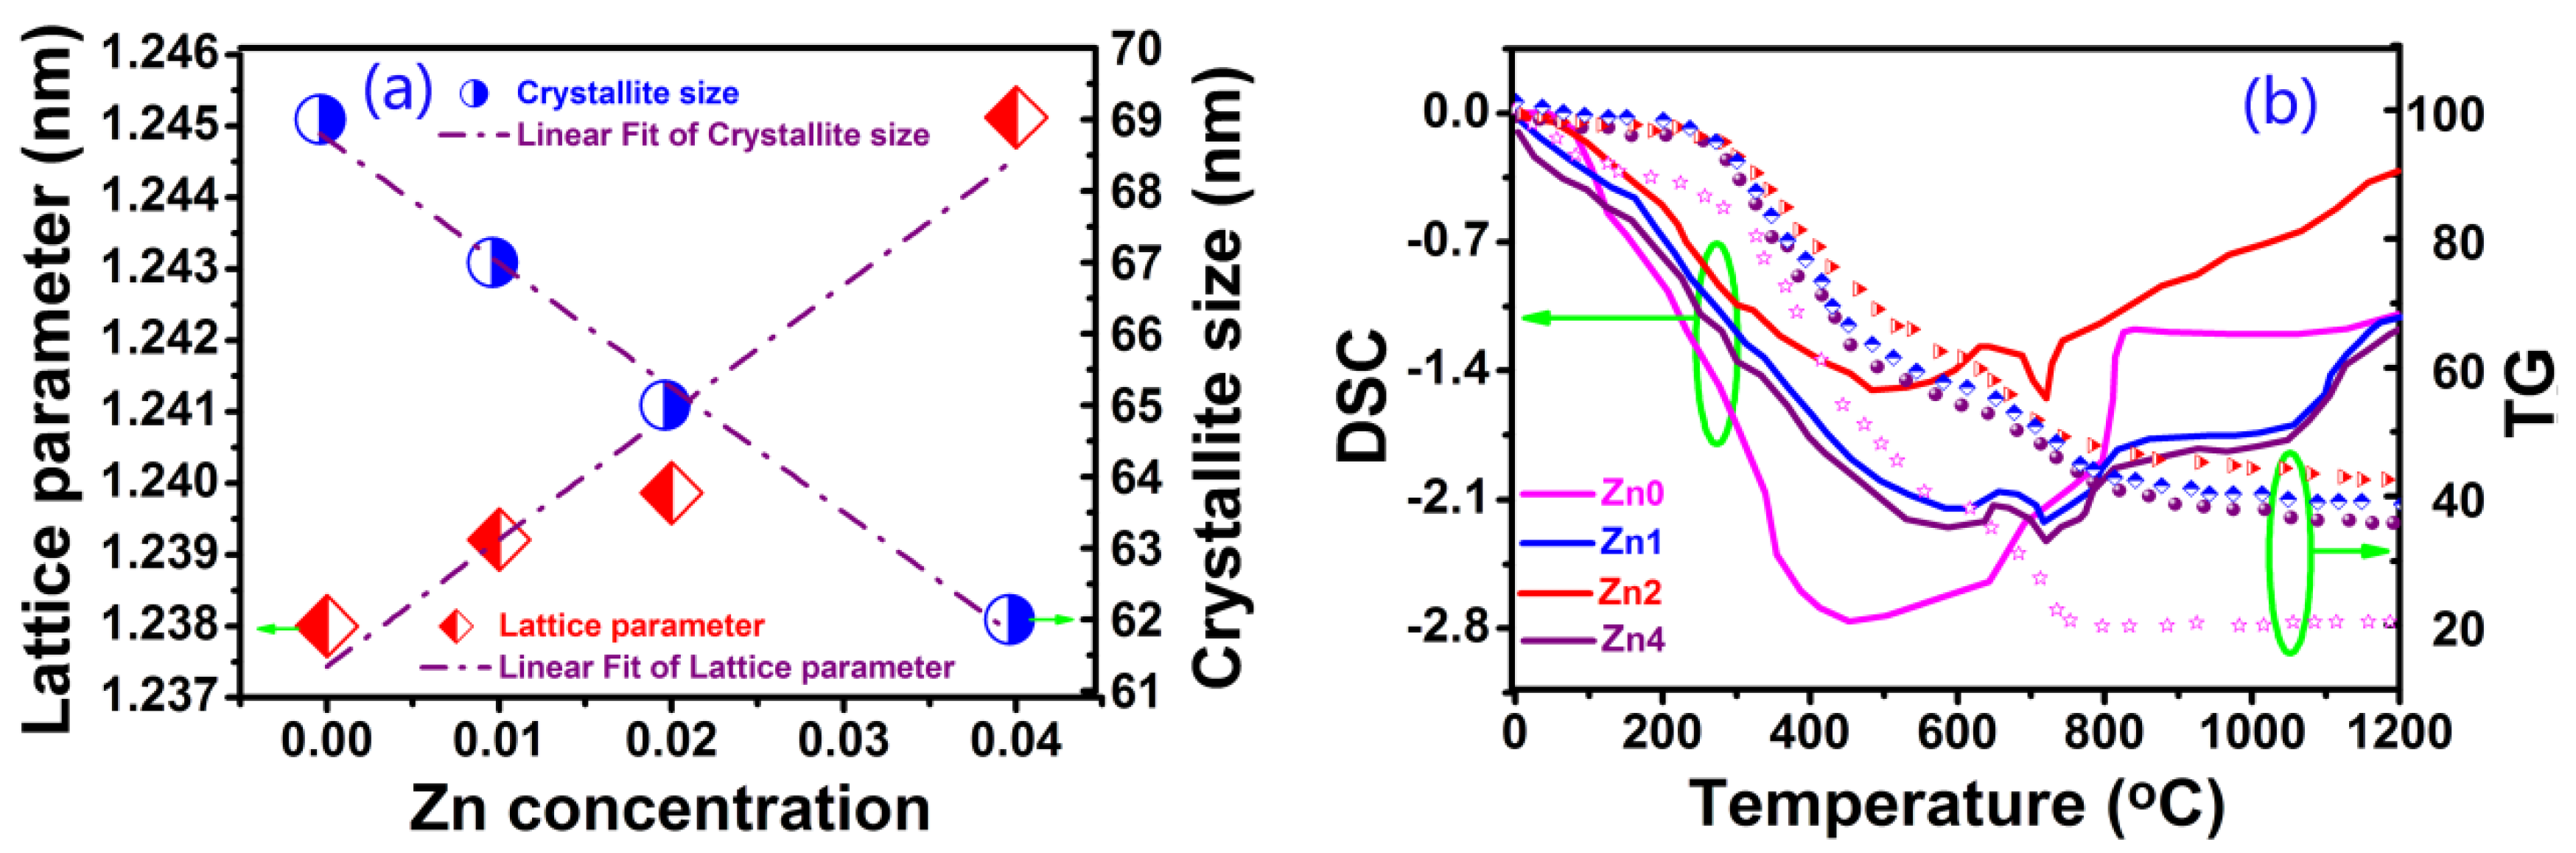
Figure 2a shows the variations in the crystallite sizes and lattice constant of YIG nanoparticles. It can be observed from
Figure 2a that lattice constant shows a linear increase from 1.23800 to 1.24512 nm with the increase in Zn content from
x = 0 to 0.04. The reason may be that the doping of a larger zinc ion causes crystal expansion. With the increase in Zn content, more and more Zn ion doping induced internal stress and strain, which hindered crystallite growth. As a result, the crystallite sizes of samples showed a tendency to decrease from 69 to 61nm when the Zn content increases from
x = 0 to 0.04, which is in agreement with the size calculated by the Scherrer equation (D = Kλ/βcosθ, where D is the average grain size, K is the grain shape factor, λ is the X-ray wavelength, β is the intrinsic increased width, and θ is the Bragg angle).
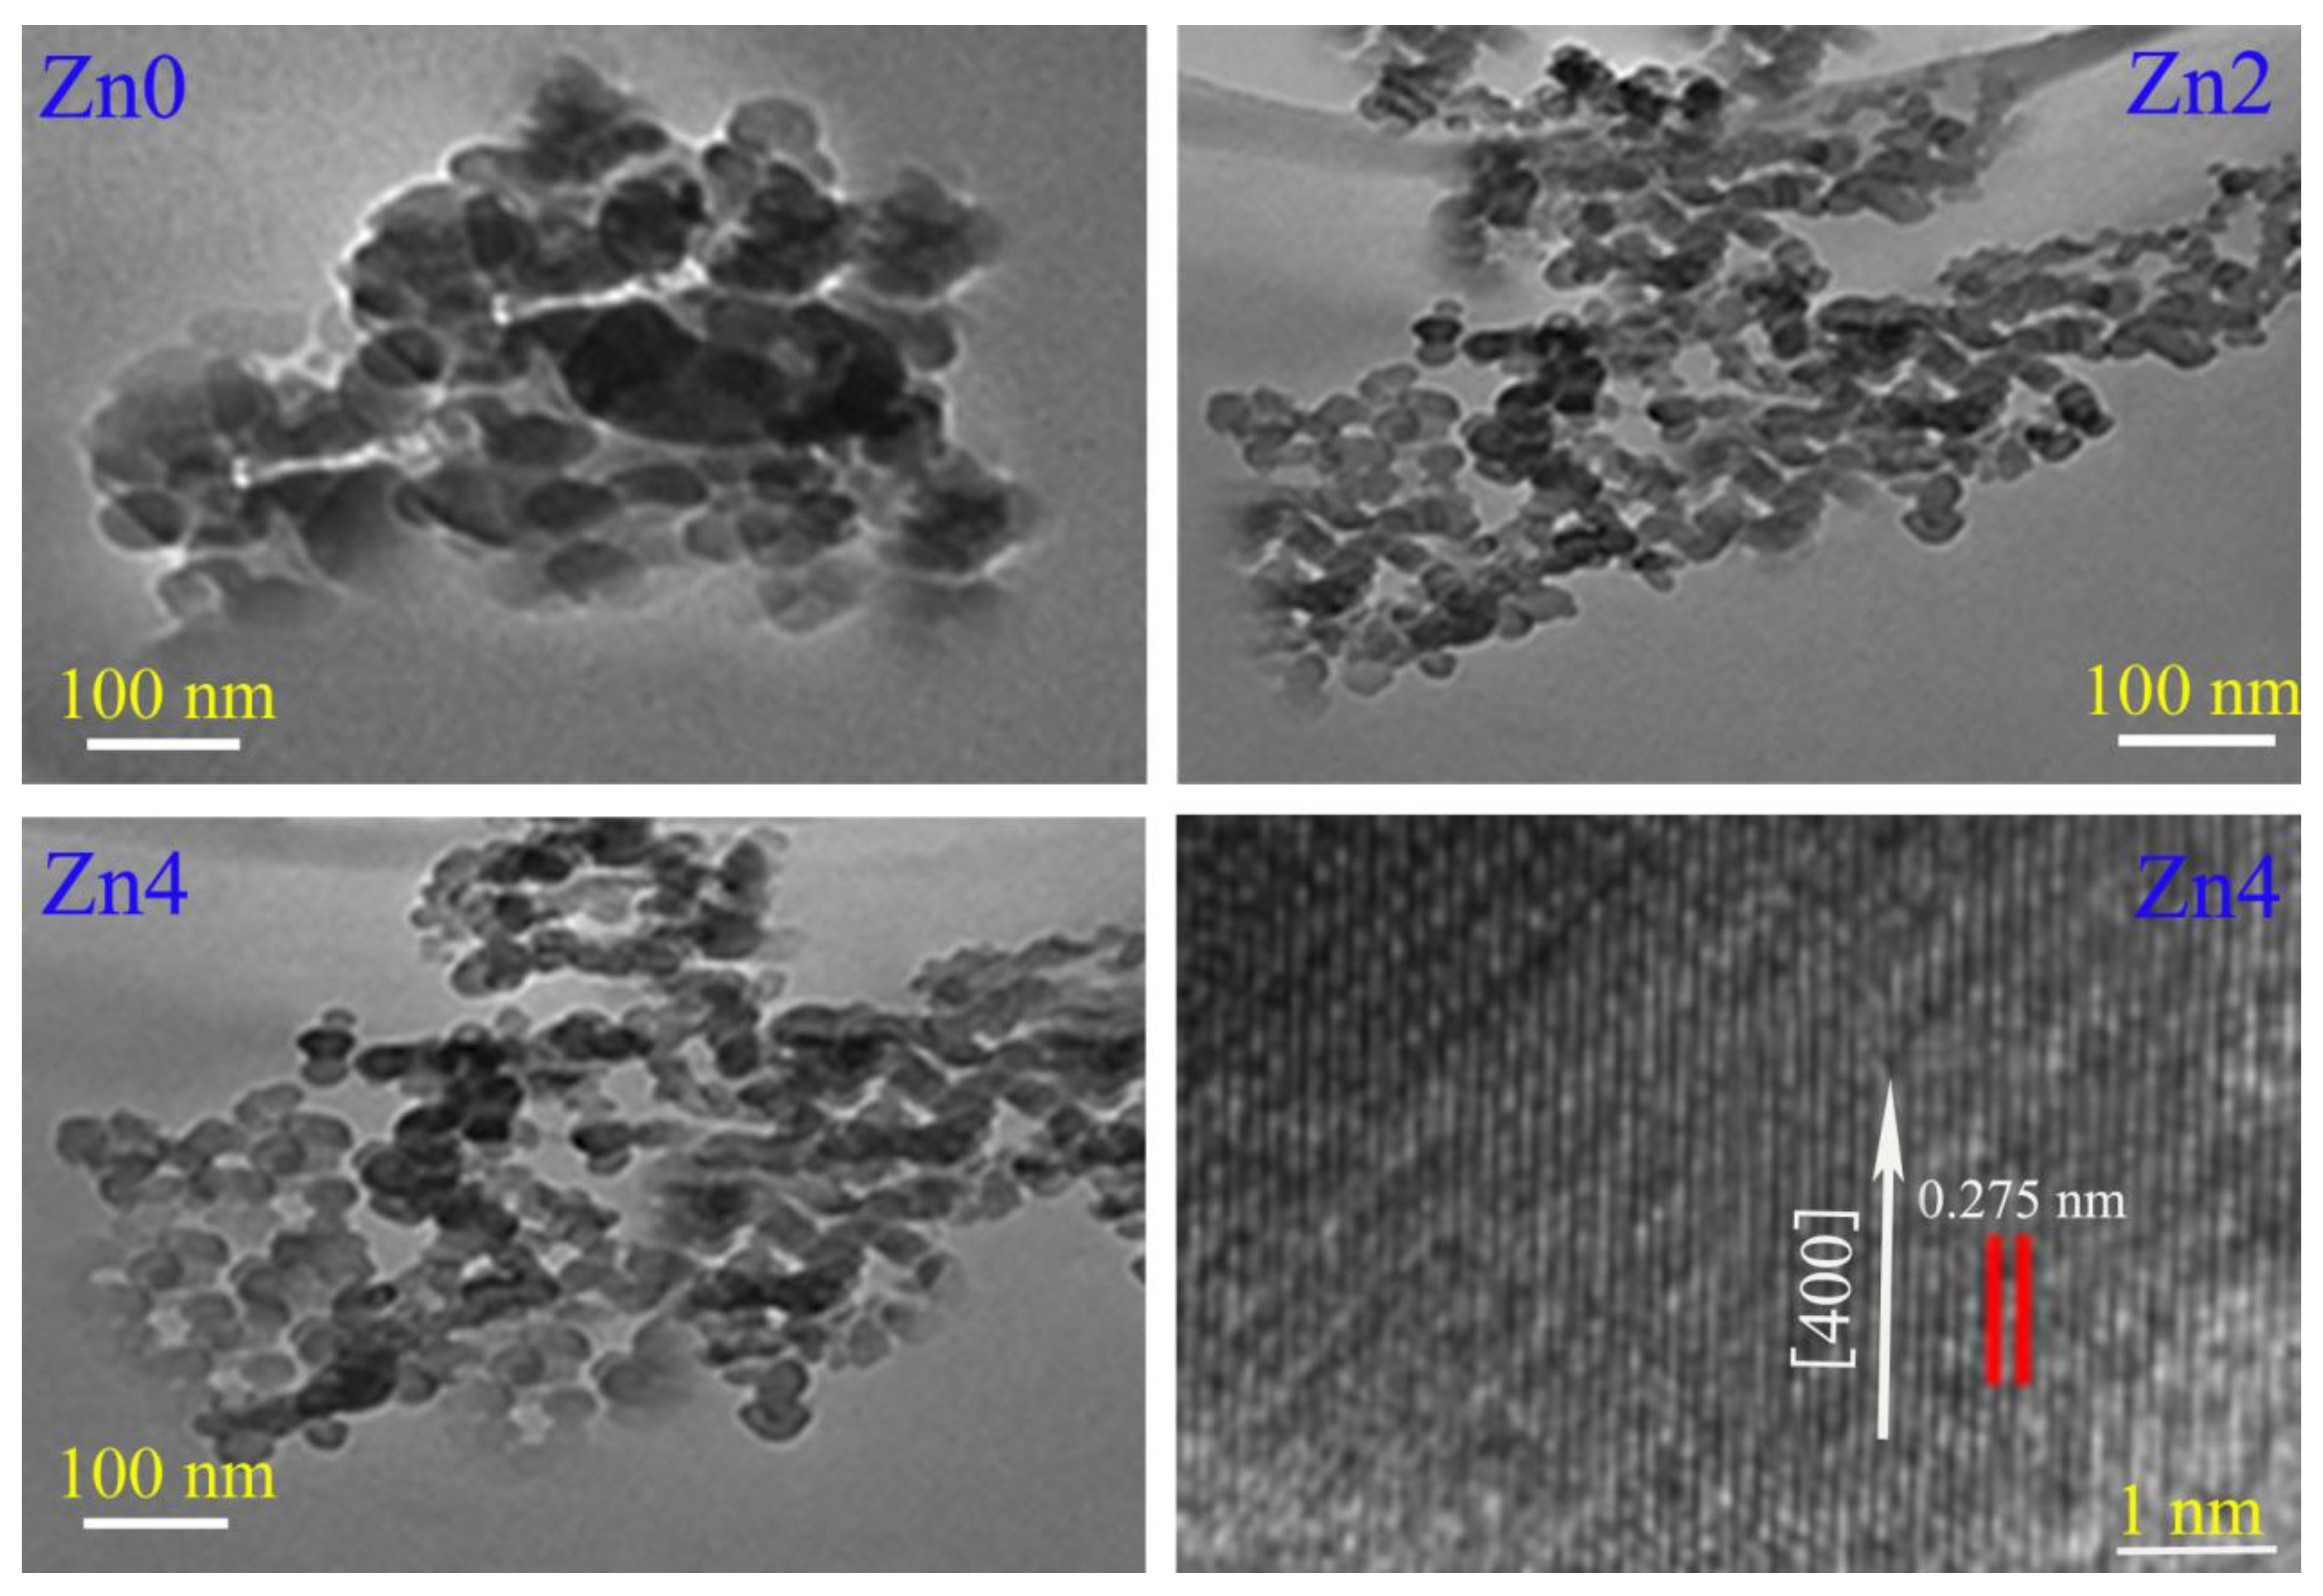
Figure 3 shows TEM and HRTEM images of Zn
0, Zn
2 and Zn
4 samples. It is easy to discern from
Figure 3 that all particles were roughly spherical with a particle size distribution in the range of 60~70 nm, which is in good agreement with the values calculated by the Scherer equation. Compared with sample Zn
0, samples Zn
2–4 had smaller particle sizes and more serious agglomeration. This is because with the increase in zinc content more and more zinc ion doping caused internal stress and strain, impeding the growth of crystals and reducing the grain size of samples from 69 nm to 61 nm, which is consistent with the previous analysis. The interplanar distance calculated from HRTEM was 0.275 nm, which is consistent with the interplanar spacing of the (400) crystal plane. Although the spherical particles in
Figure 3 were treated by an ultrasonic, the agglomeration phenomenon was still serious, which may have been caused by alloying and cold welding between particles during the milling process, especially high-speed ball milling to particles. These agglomeration phenomena may have been derived from four aspects: (1) due to the large surface area and high surface energy of nanoparticles, particles were in an unstable energy state, which eventually lead to particle agglomeration to reach a relatively stable state; (2) when particles were refined to a nanometer scale, a large number of positive and negative charges accumulated on the surface of particles, and nanoparticle shape was generally irregular, which made articles extremely unstable, leading to particle agglomeration due to the accumulation of surface charges; (3) because the distance between nanoparticles was very short, the VanDer Walls force between particles was much larger than their own gravity, so particles were easy to attract to each other and cause agglomeration; and (4) the interaction of a large number of hydrogen bonds and chemical bonds on the surface of nanoparticles also easily caused adsorption phenomenon between particles, which eventually lead to particle agglomeration.
The thermogravimetry (TG) and differential scanning calorimetry (DSC) measures were performed for all samples, and
Figure 2b shows the phase evolution and thermal analysis curves (DSC-TG) of dried gel. The TG curves may be divided into four regions: (a) In the 0~250 °C region, the dried gelslostabout 5% of their weight in the gel dehydration process; (b) In the 250~700 °C region, the average mass loss reached 40%, stemming from organic material burning from reactions and citrate molecule rupture; (c) In the 700~800 °C region, the mean mass loss was about 14% due to the formation of orthoferrite YIG crystals and the subsequently major cubic YIG; (d) In the 800~1200 °C region, samples showed different mass loss behaviors. For the Zn
0 sample, mass loss reached 20% at 800 °C without any mass loss from 800 to 1200 °C, but samples Zn
1, Zn
2 and Zn
4 showed a tendency to slow the decline in mass loss from 800 to 1200 °C. The reason is that the incorporation of Zn
2+ in the YIG structure leads to a new phase formation. The crystal chemical environment of YIG is changed to adapt to new chemical bonds and lattice deformation due to zinc ion doping, so it results in different mass losses for different Zn-doped samples. To verify the formation of a new phase from 800 to 1300 °C, we performed DSC measurements for all samples, and the results show apparent new phase formation above 1100 °C, especially for the samples with higher Zn contents. Further research can prove that this is due to the formation of a ZnFe
2O
4 phase.
Figure 3 shows TEM and HRTEM images of Zn
0, Zn
2 and Zn
4 samples. It is easy to discern from
Figure 3 that all particles were roughly spherical with a particle size distribution in the range of 60~70 nm, which is in good agreement with the values calculated by the Scherer equation. Compared with sample Zn
0, samples Zn
2–4 had smaller particle sizes and more serious agglomeration. This is because with the increase in zinc content more and more zinc ion doping caused internal stress and strain, impeding the growth of crystals and reducing the grain size of samples from 69 nm to 61nm, which is consistent with the previous analysis. The interplanar distance calculated from HRTEM was 0.275 nm, which is consistent with the interplanar spacing of the (400) crystal plane. Although the spherical particles in
Figure 3 were treated by an ultrasonic, the agglomeration phenomenon was still serious, which may have been caused by alloying and cold welding between particles during the milling process, especially high-speed ball milling to particles. These agglomeration phenomena may have been derived from four aspects: (1) due to the large surface area and high surface energy of nanoparticles, particles were in an unstable energy state, which eventually lead to particle agglomeration to reach a relatively stable state; (2) when particles were refined to a nanometer scale, a large number of positive and negative charges accumulated on the surface of particles, and nanoparticle shape was generally irregular, which made articles extremely unstable, leading to particle agglomeration due to the accumulation of surface charges; (3) because the distance between nanoparticles was very short, the VanDer Walls force between particles was much larger than their own gravity, so particles were easy to attract to each other and cause agglomeration; and (4) the interaction of a large number of hydrogen bonds and chemical bonds on the surface of nanoparticles also easily caused adsorption phenomenon between particles, which eventually lead to particle agglomeration.
3.2. Magnetic Properties
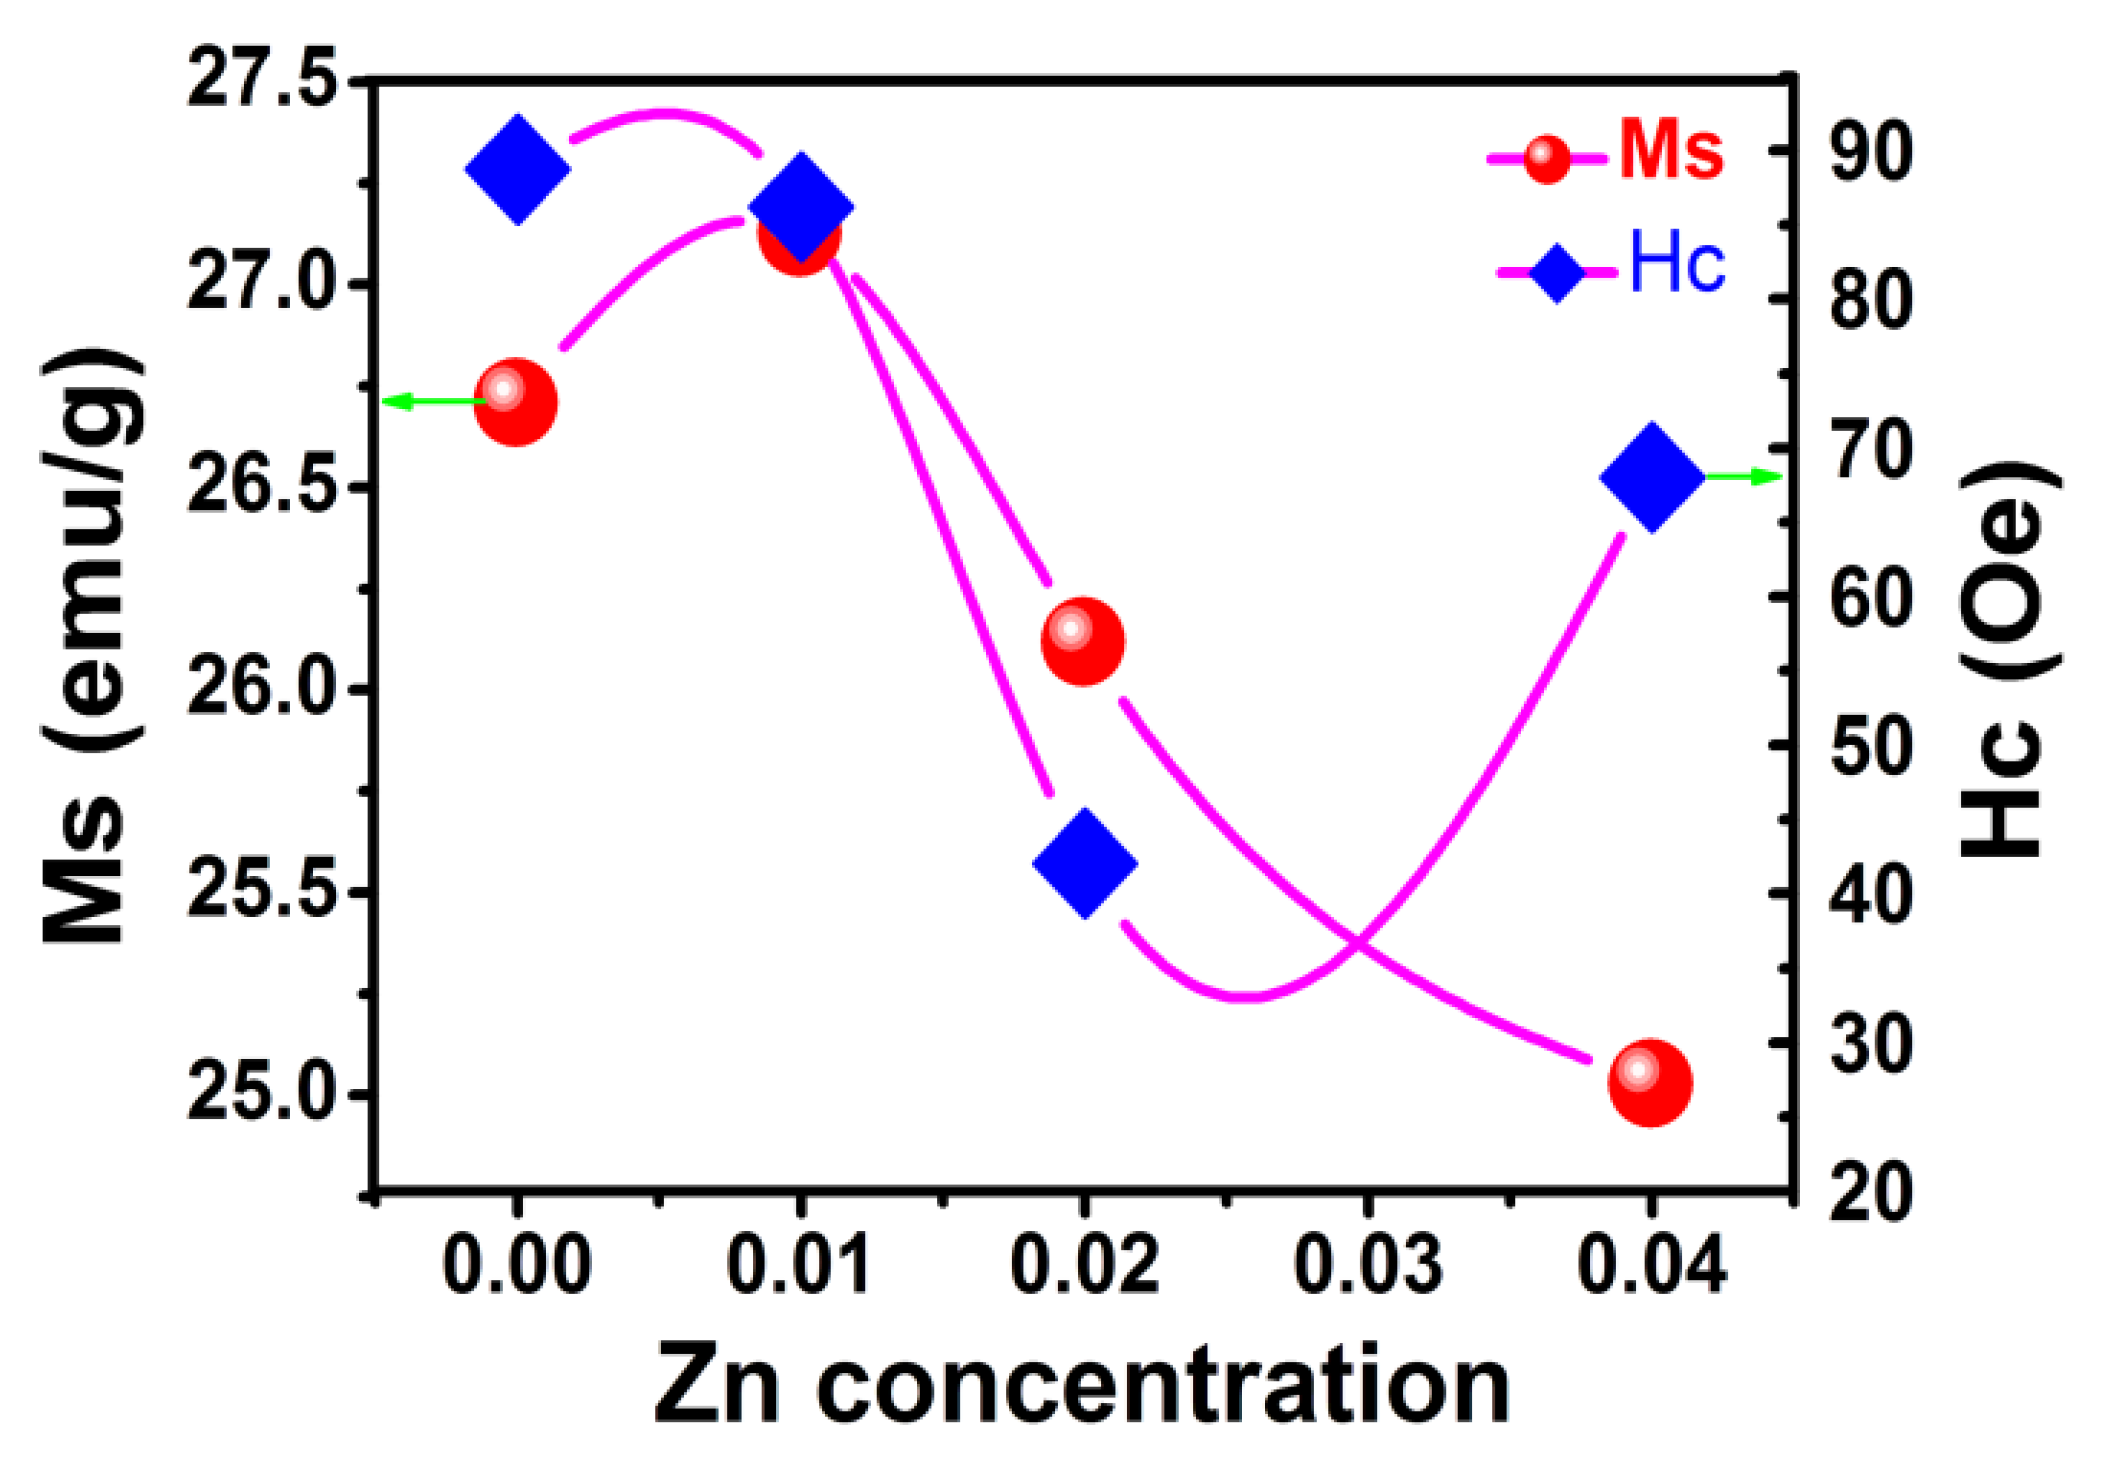
Figure 4 shows the variation of saturation magnetization (
Ms) and coercivity (
Hc) with zinc content in Zn-YIG. Except for Zn
2, coercivity presents a general declining trend for samples Zn
0, Zn
1 and Zn
4. This is because zinc ion doping reduces antiferromagnetic coupling of iron ions in an octahedral lattice, forming a new pinning mechanism and changing the local exchange coupling constant, which opens a new way for the magnetization reversal of doped samples. Consequently, coercivity must be modified. In addition to the pinning mechanism of the magnetic moment, coercivity is related to particle size, stomata, shape and formation. The coercivity of sample Zn
2 was obviously lower than that of other samples. It may have been because the Zn
2 sample presented more agglomeration than samples Zn
0, Zn
1 and Zn
4, which changed the particle distribution, formation and morphology, and ultimately lead to a significant decrease in coercivity.
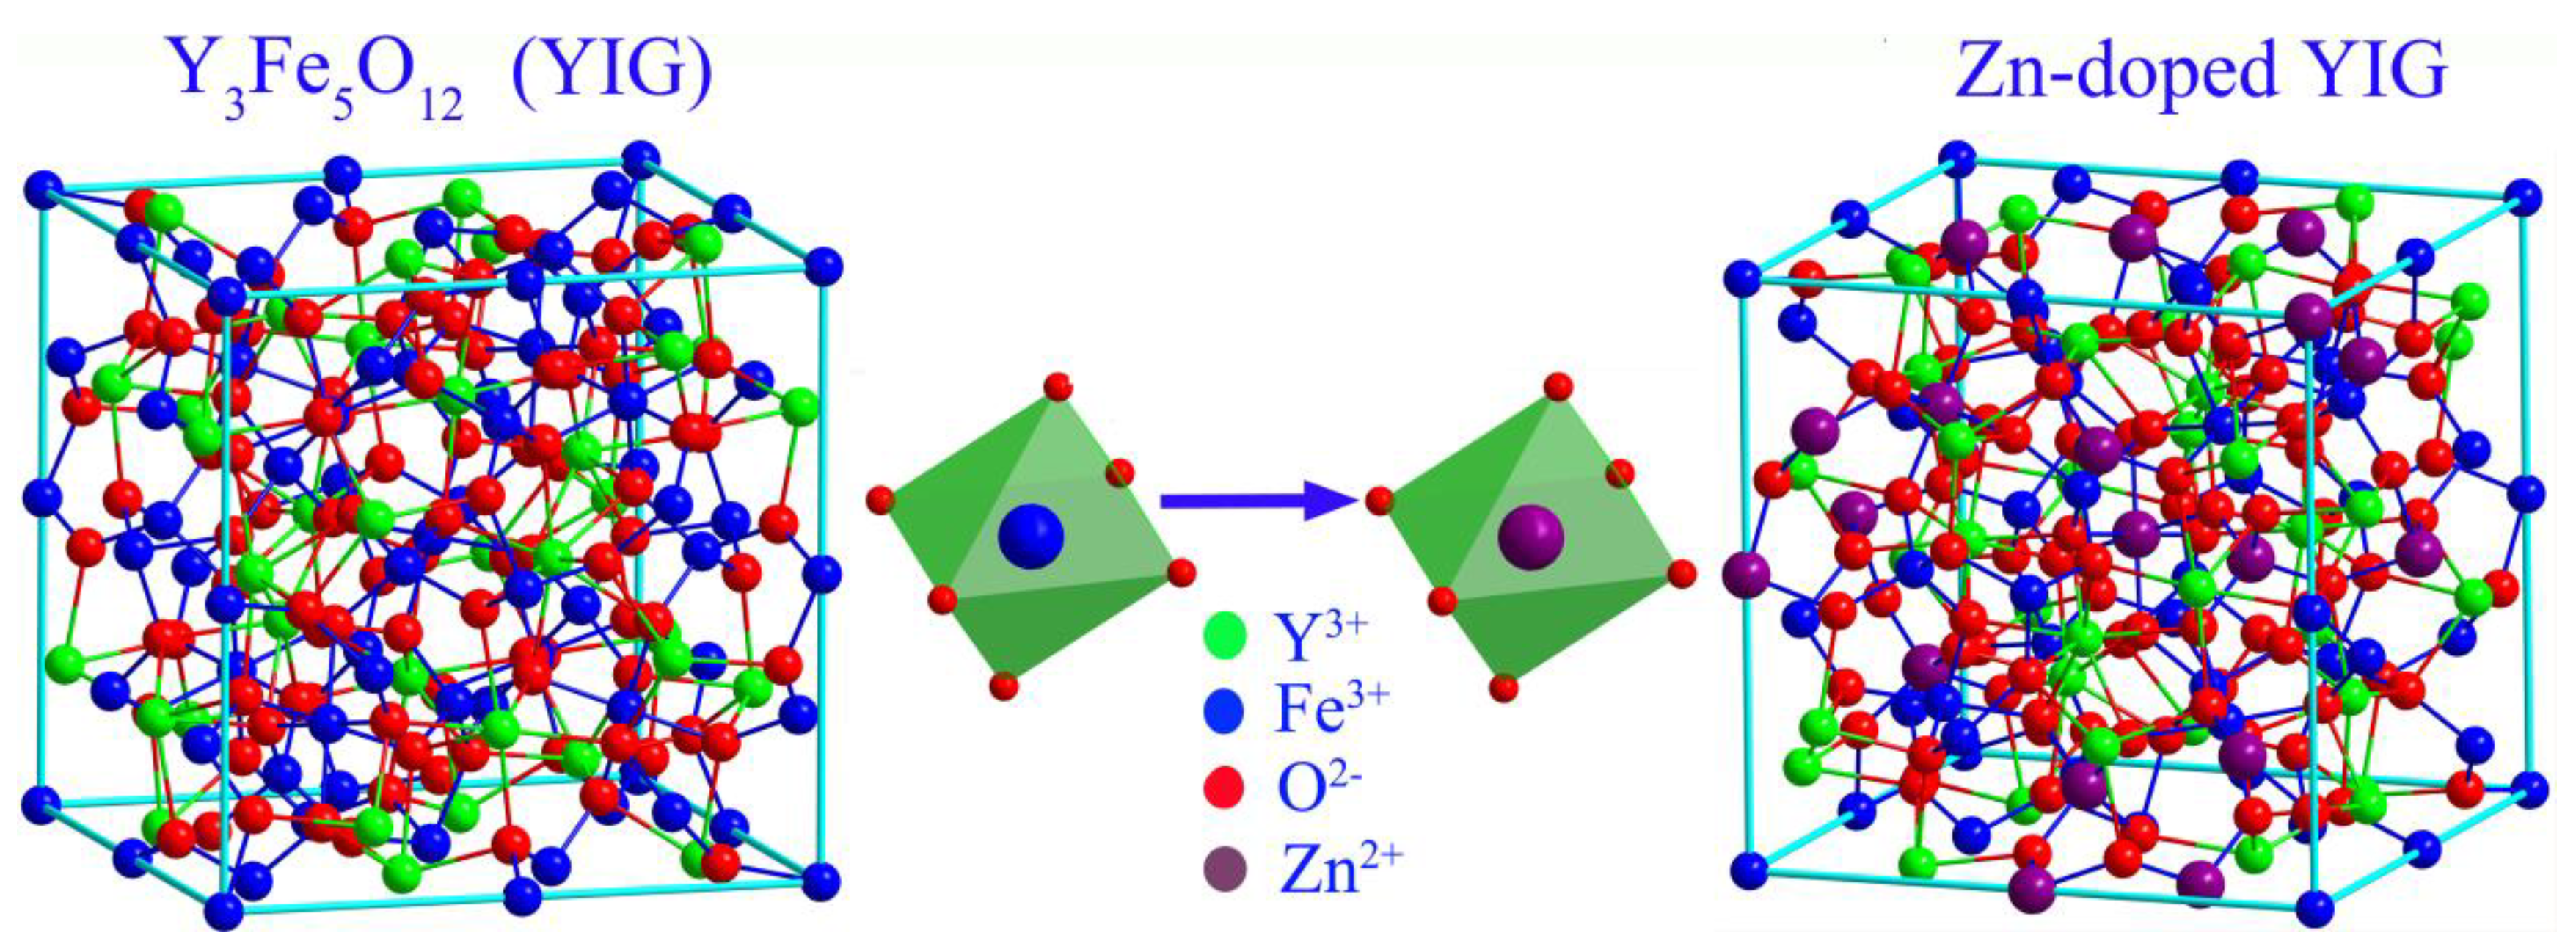
As can be seen in
Figure 4, due to the influence of Zn(II) doping and thermal effect, the saturation magnetization curve experienced a trend from small to large and then slowly decreased, which can be explained in combination with a crystal structure evolution model shown in
Figure 5. For YIG material, magnetic ordering originates from the super-exchange interaction between tetrahedral sites (occupied by a nonmagnetic Y ion) and octahedral sites (occupied by an Fe ion). Due to the doping of the larger zinc ion, antiferromagnetic coupling was reduced, resulting in an increase in net magnetic moment and magnetization. Therefore, saturation magnetization (
Ms) of sample Zn
1 was higher than for sample Zn
0. However, with a further increase in Zn content, saturation magnetization showed a tendency to slowly decline due to the weakening of magnetic coupling between two sub-lattices. For YIG material, the total magnetic moment relies on the coupling effect between two magnetic sub-lattices (octahedral and tetrahedral). Due to the dual influences of the thermal effect and increased zinc content, magnetic coupling between sub-lattices is greatly diminished, which must lead to a decrease in net magnetic moments and total magnetic moments. Hence, saturation magnetization showed a decreasing trend with the increase in Zn content. To further explore the influence of the thermal effect on
Ms, the temperature dependence of the magnetic saturation measurement was evaluated.
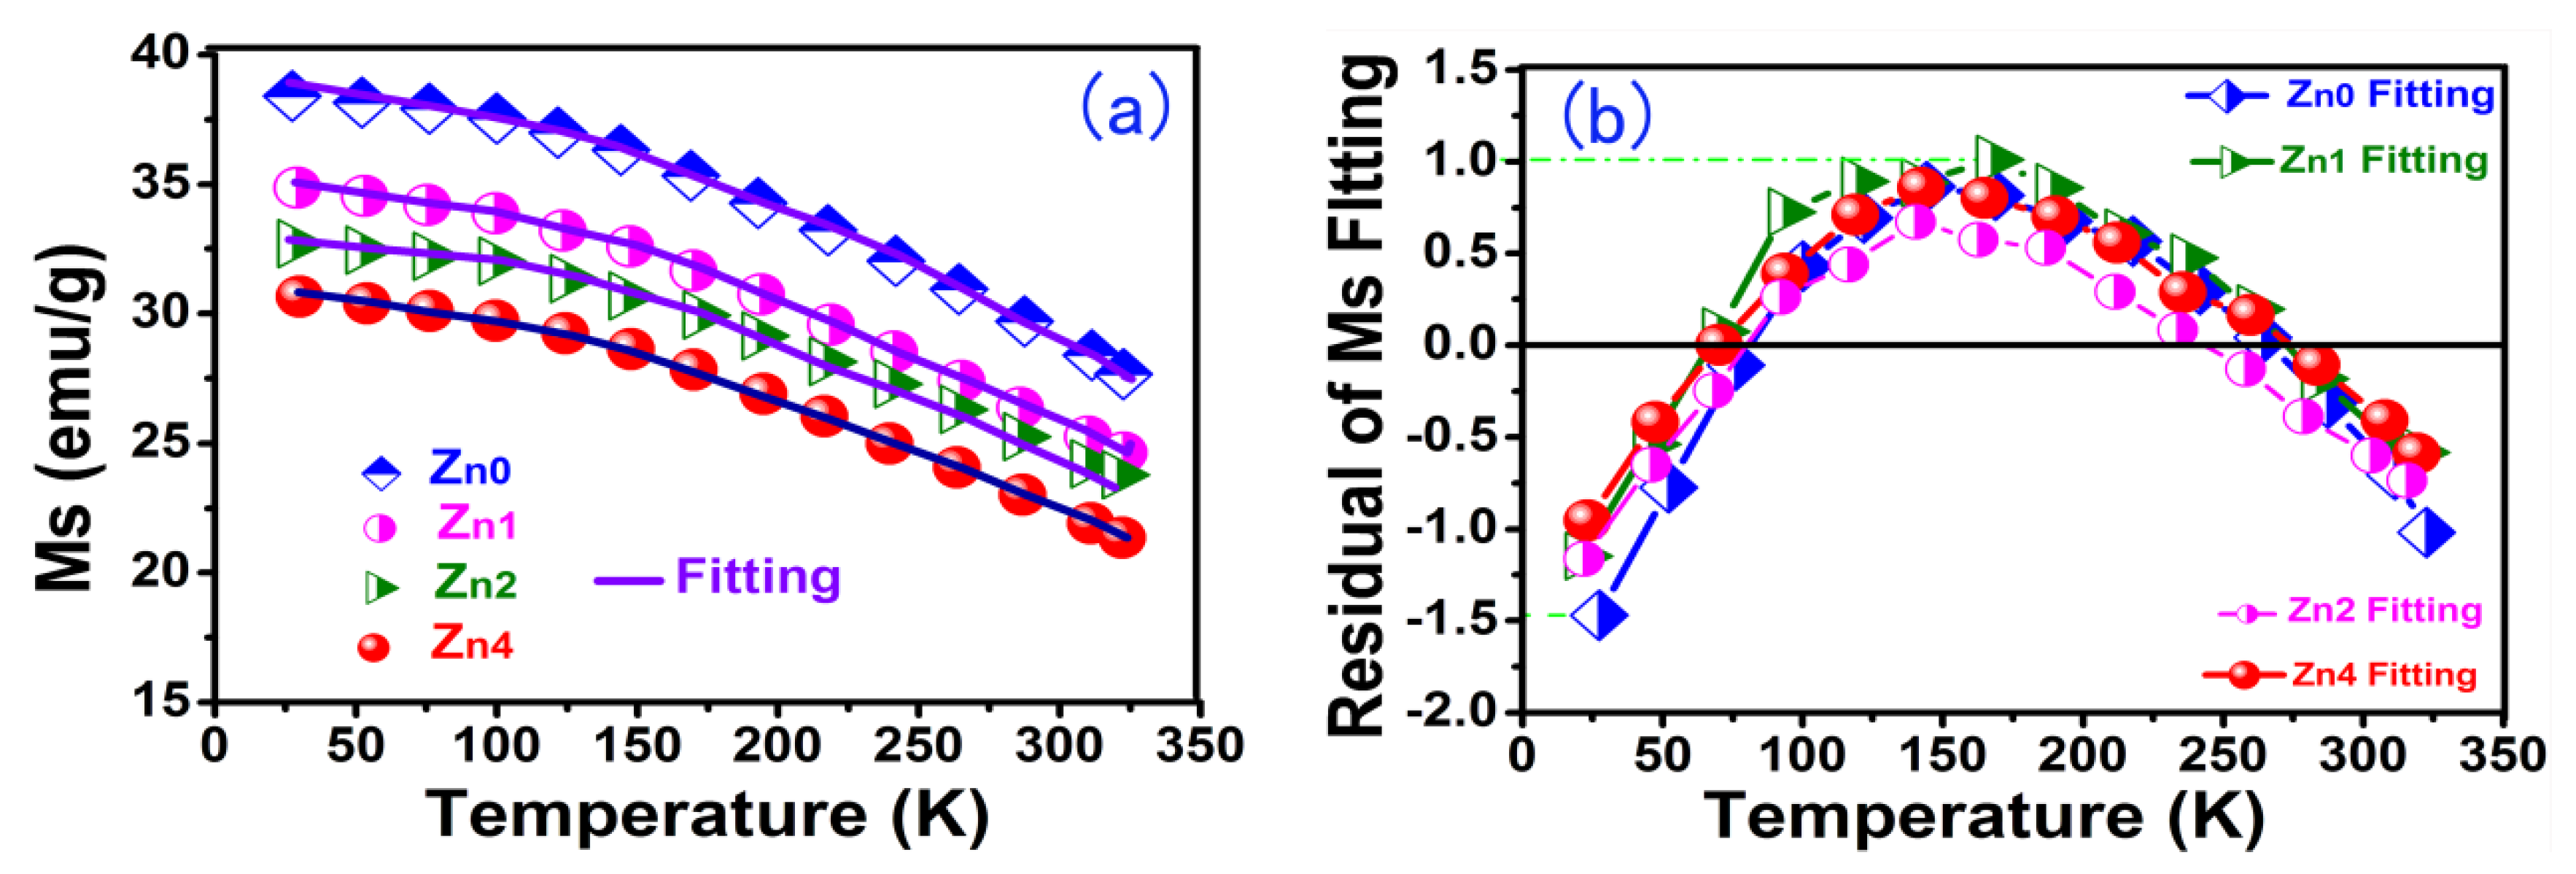
Figure 6a shows the temperature dependence of magnetic saturation for the Zn-YIG samples. With the decrease in temperature, the saturation magnetization curves showed an increasing tendency. When temperature was relatively high, magnetic moments were randomly arranged, resulting in a decrease in the total magnetic moment, which inevitably lead to a decrease in saturation magnetization. As temperaturedecreased, the randomization degree of the magnetic moment in relation to the applied magnetic field was reduced due to the weakened thermal vibration, which gave rise to a decrease in the total magnetic moment, so
Ms was enhanced as the temperature dropped. The relationship between temperature and
Ms can be described by the Bloch law (1):
where
b, n and
TC are the Bloch’s constant, Bloch exponent and Curie temperature, respectively.
MS(0) is the magnetic saturation of 0 K, and
MS(T) is dominated by the spin wave fluctuation.
We fit Equation (1) using the test data of
Figure 6a, and the fitting parameters are listed in
Table 1. In
Table 1 it may be seen that Adj.R-Square fluctuates between 0.973 and 0.991, which is approximately equal to 1. The regular residual value fluctuates between +1.012 and −1.487, as shown in
Figure 6b. Therefore, the experimental result is highly consistent with the Bloch law theoretical analysis, which fully demonstrates the influence of the thermal effect on
Ms. Furthermore, as expected, the saturation magnetization (
Ms) in
Table 1 shows a downward trend with increasing Zn content, which is due to the decrease inthe net magnetic moment caused by the non-magnetic Zn(II) ion.


