
Enhanced Antioxidant Activity of Fresh Fruits through Salicylic Acid/β-CD Hydroalcoholic Gels


Abstract
:1. Introduction
2. Results and Discussion
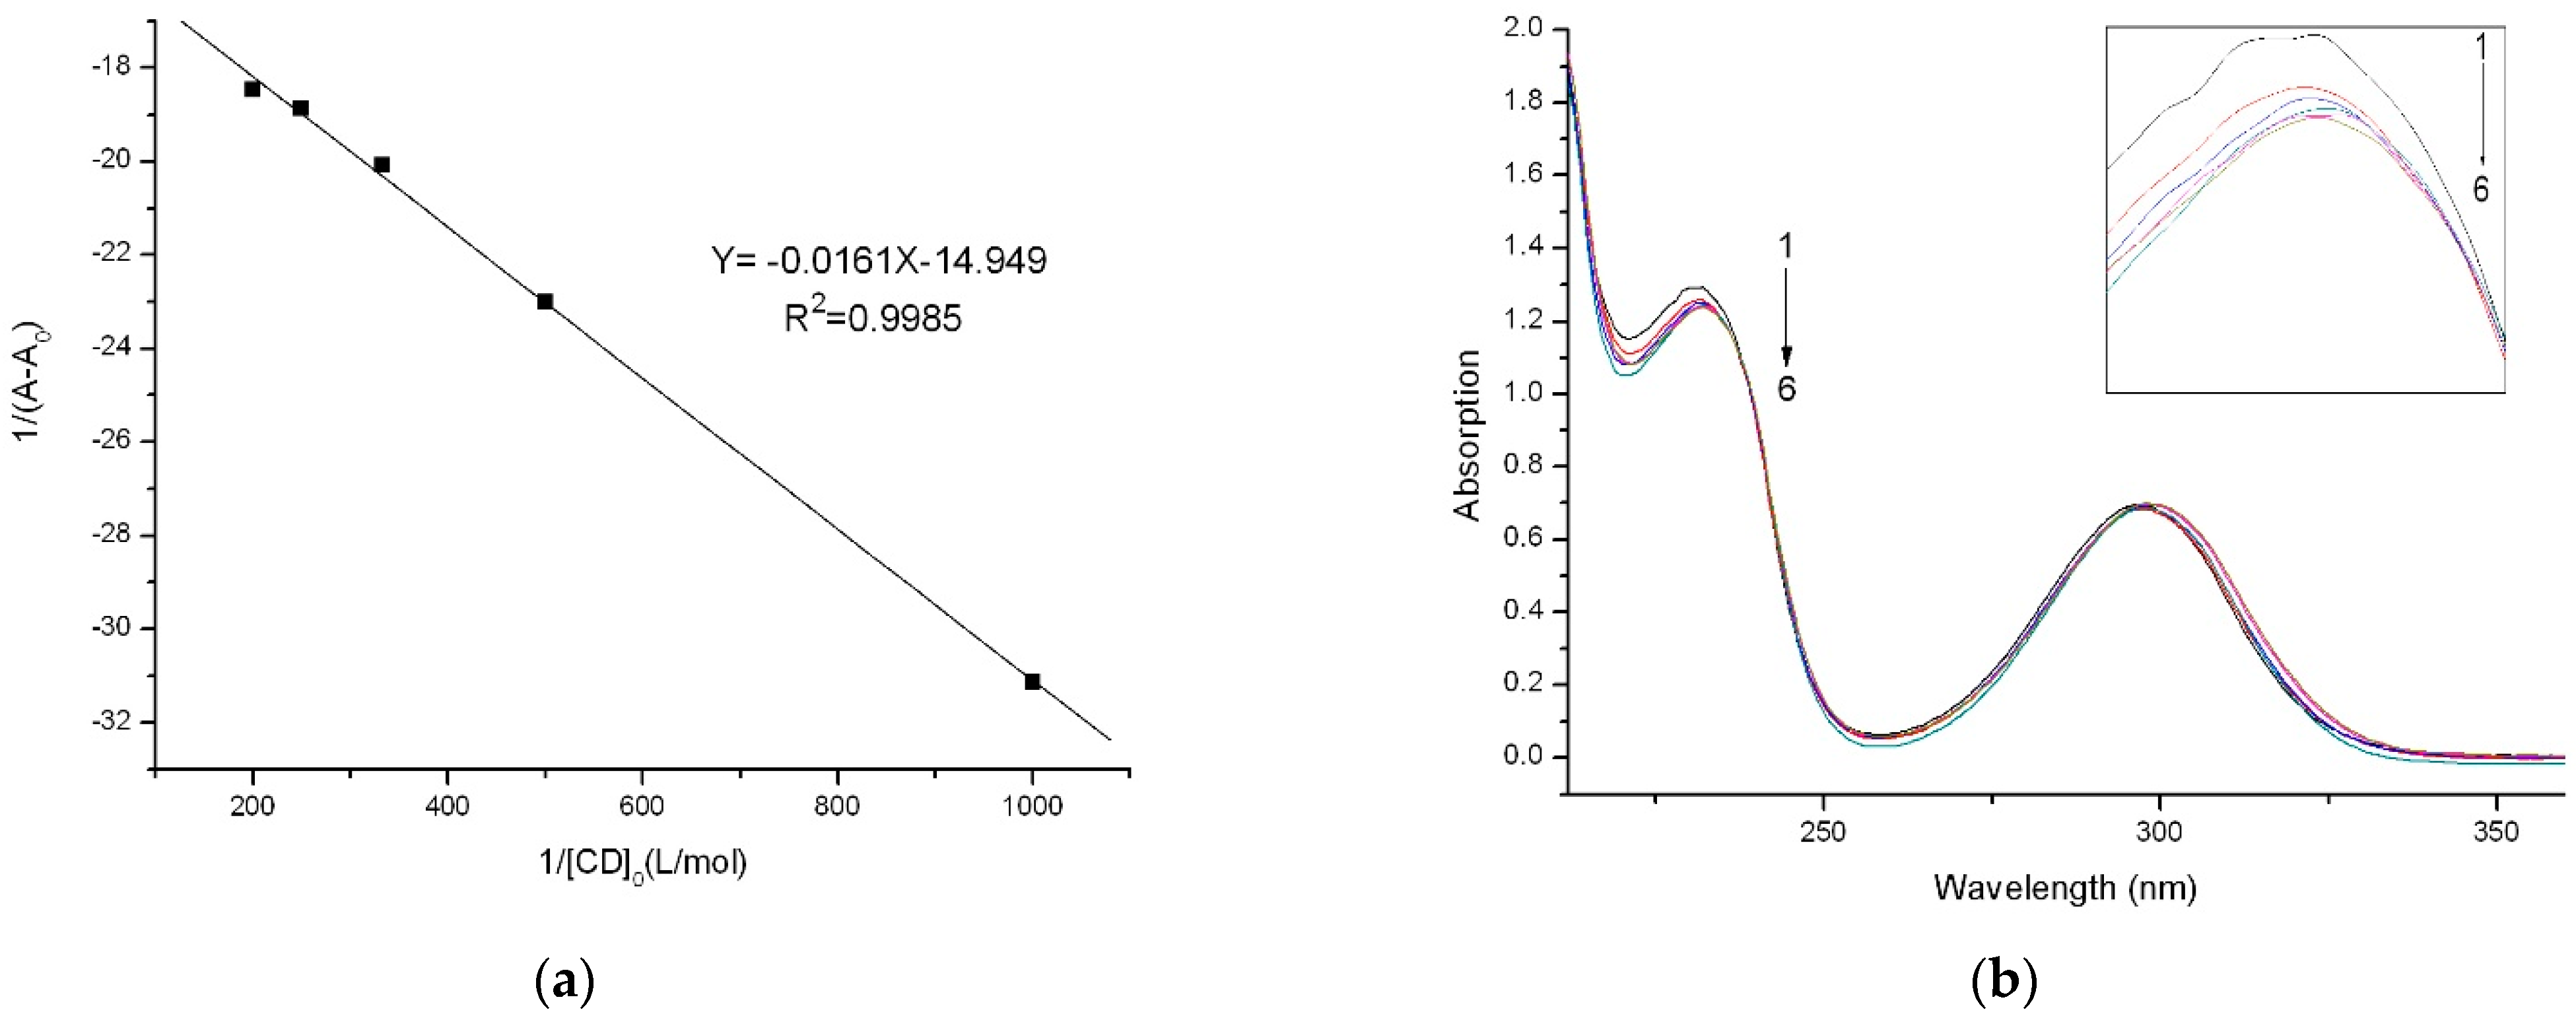
2.1. LC and EE of SA/β-CD Inclusion Complex
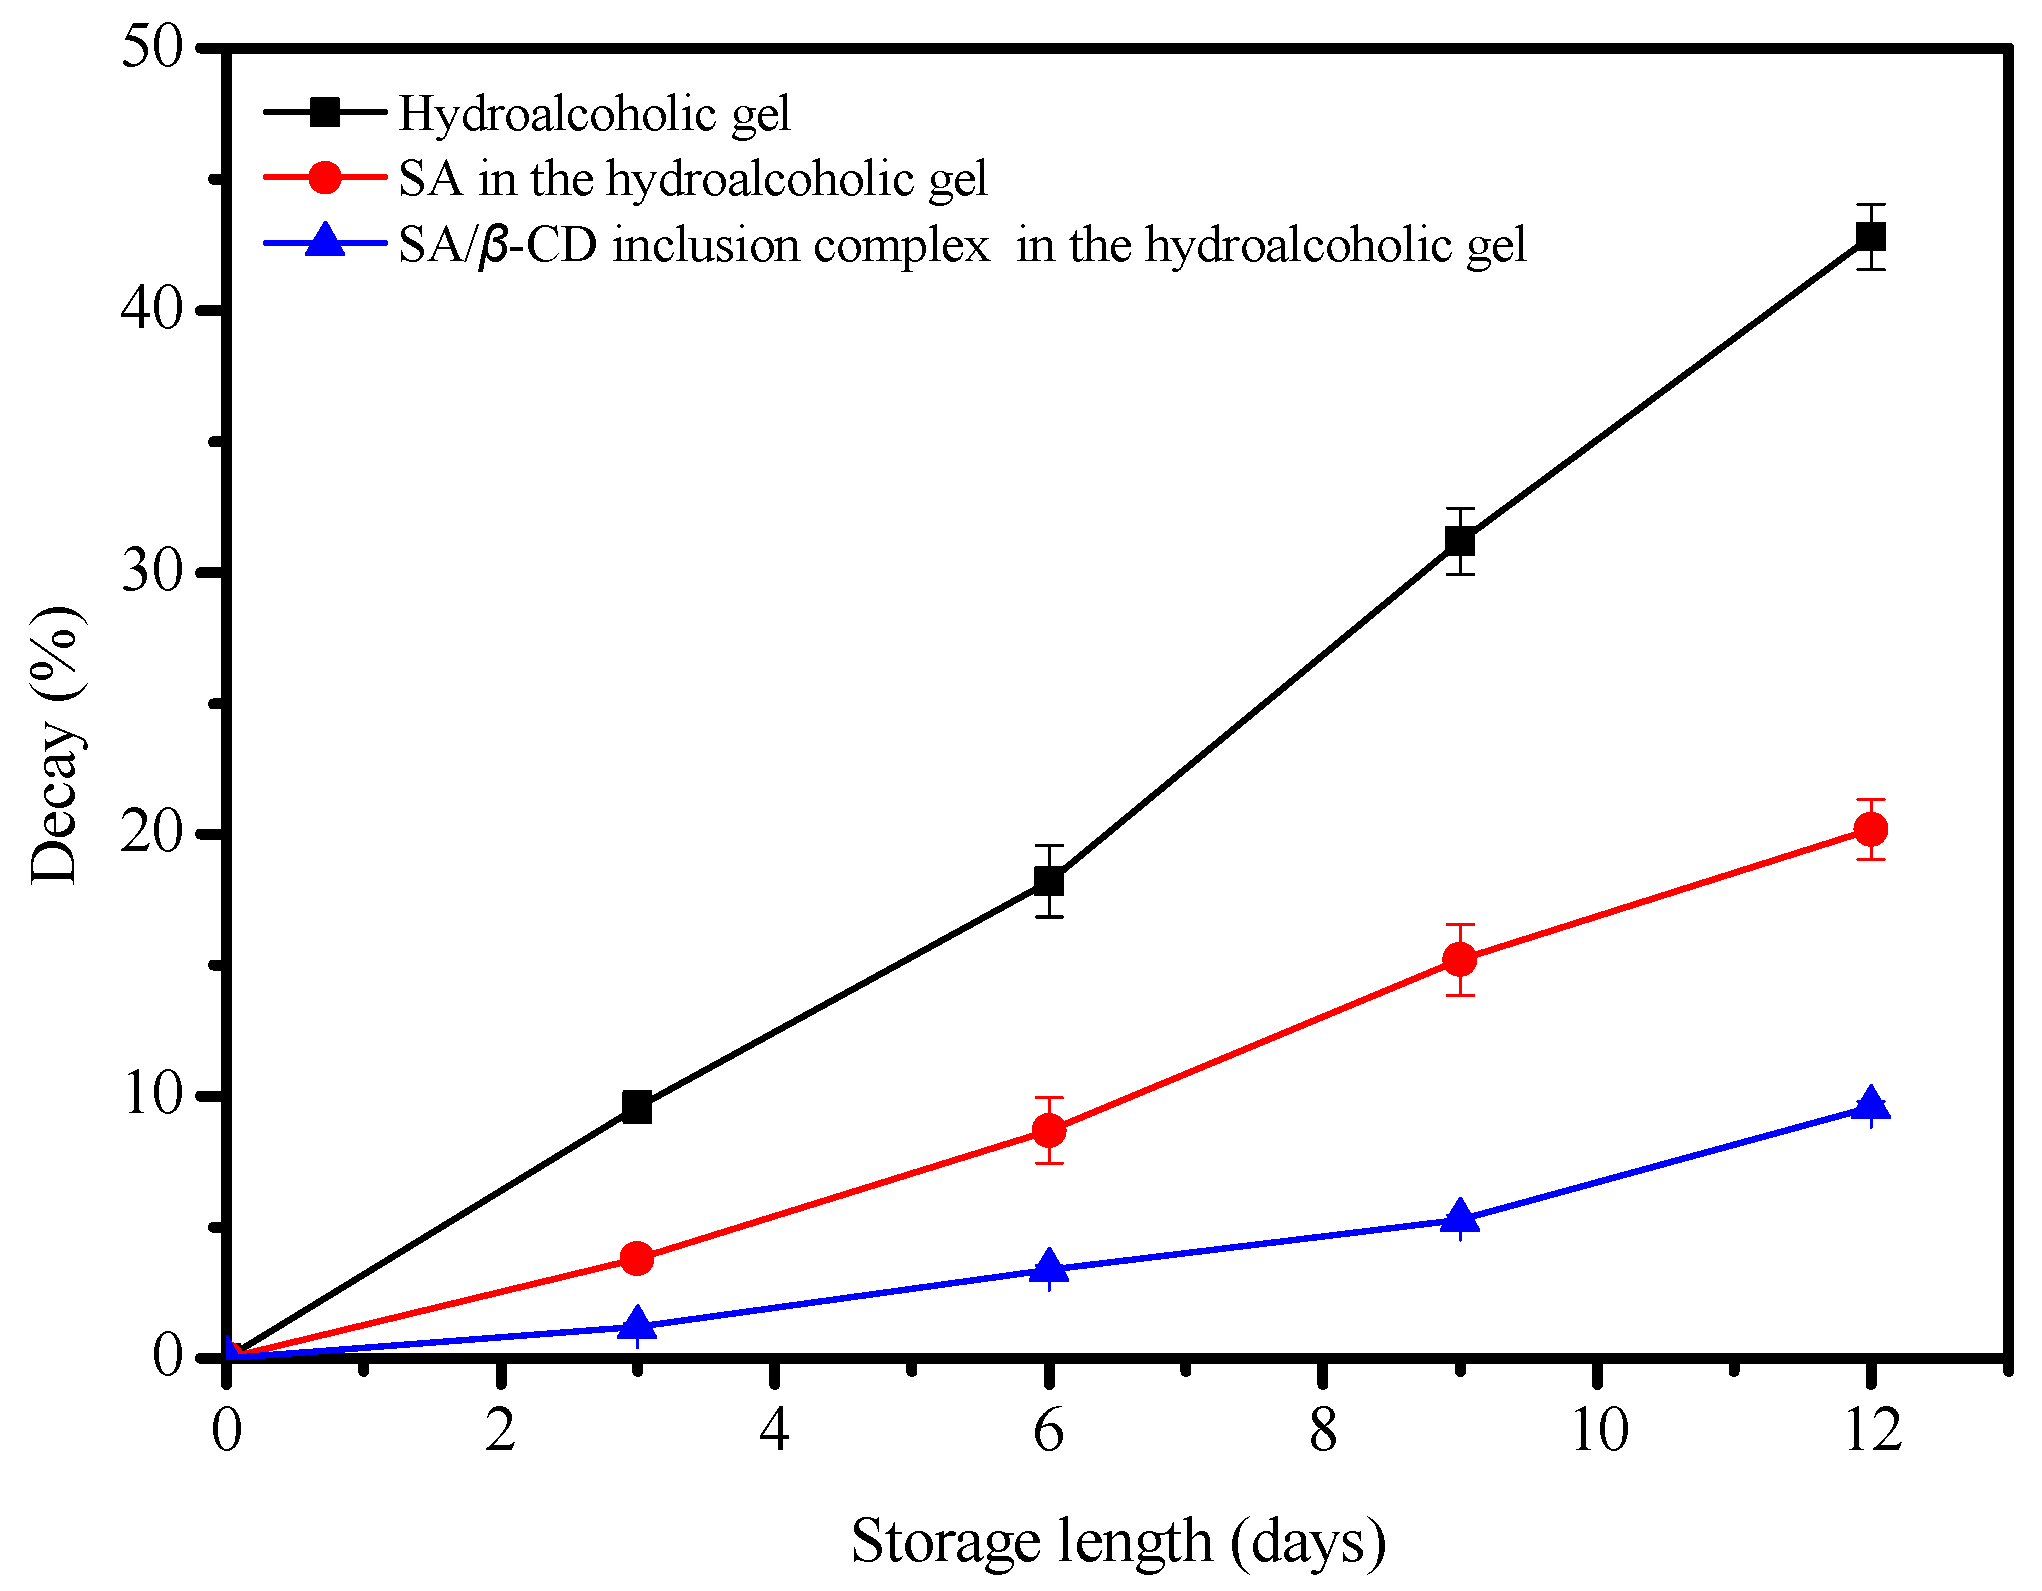
2.2. Banana Decay Test
2.3. Antioxidant Activity
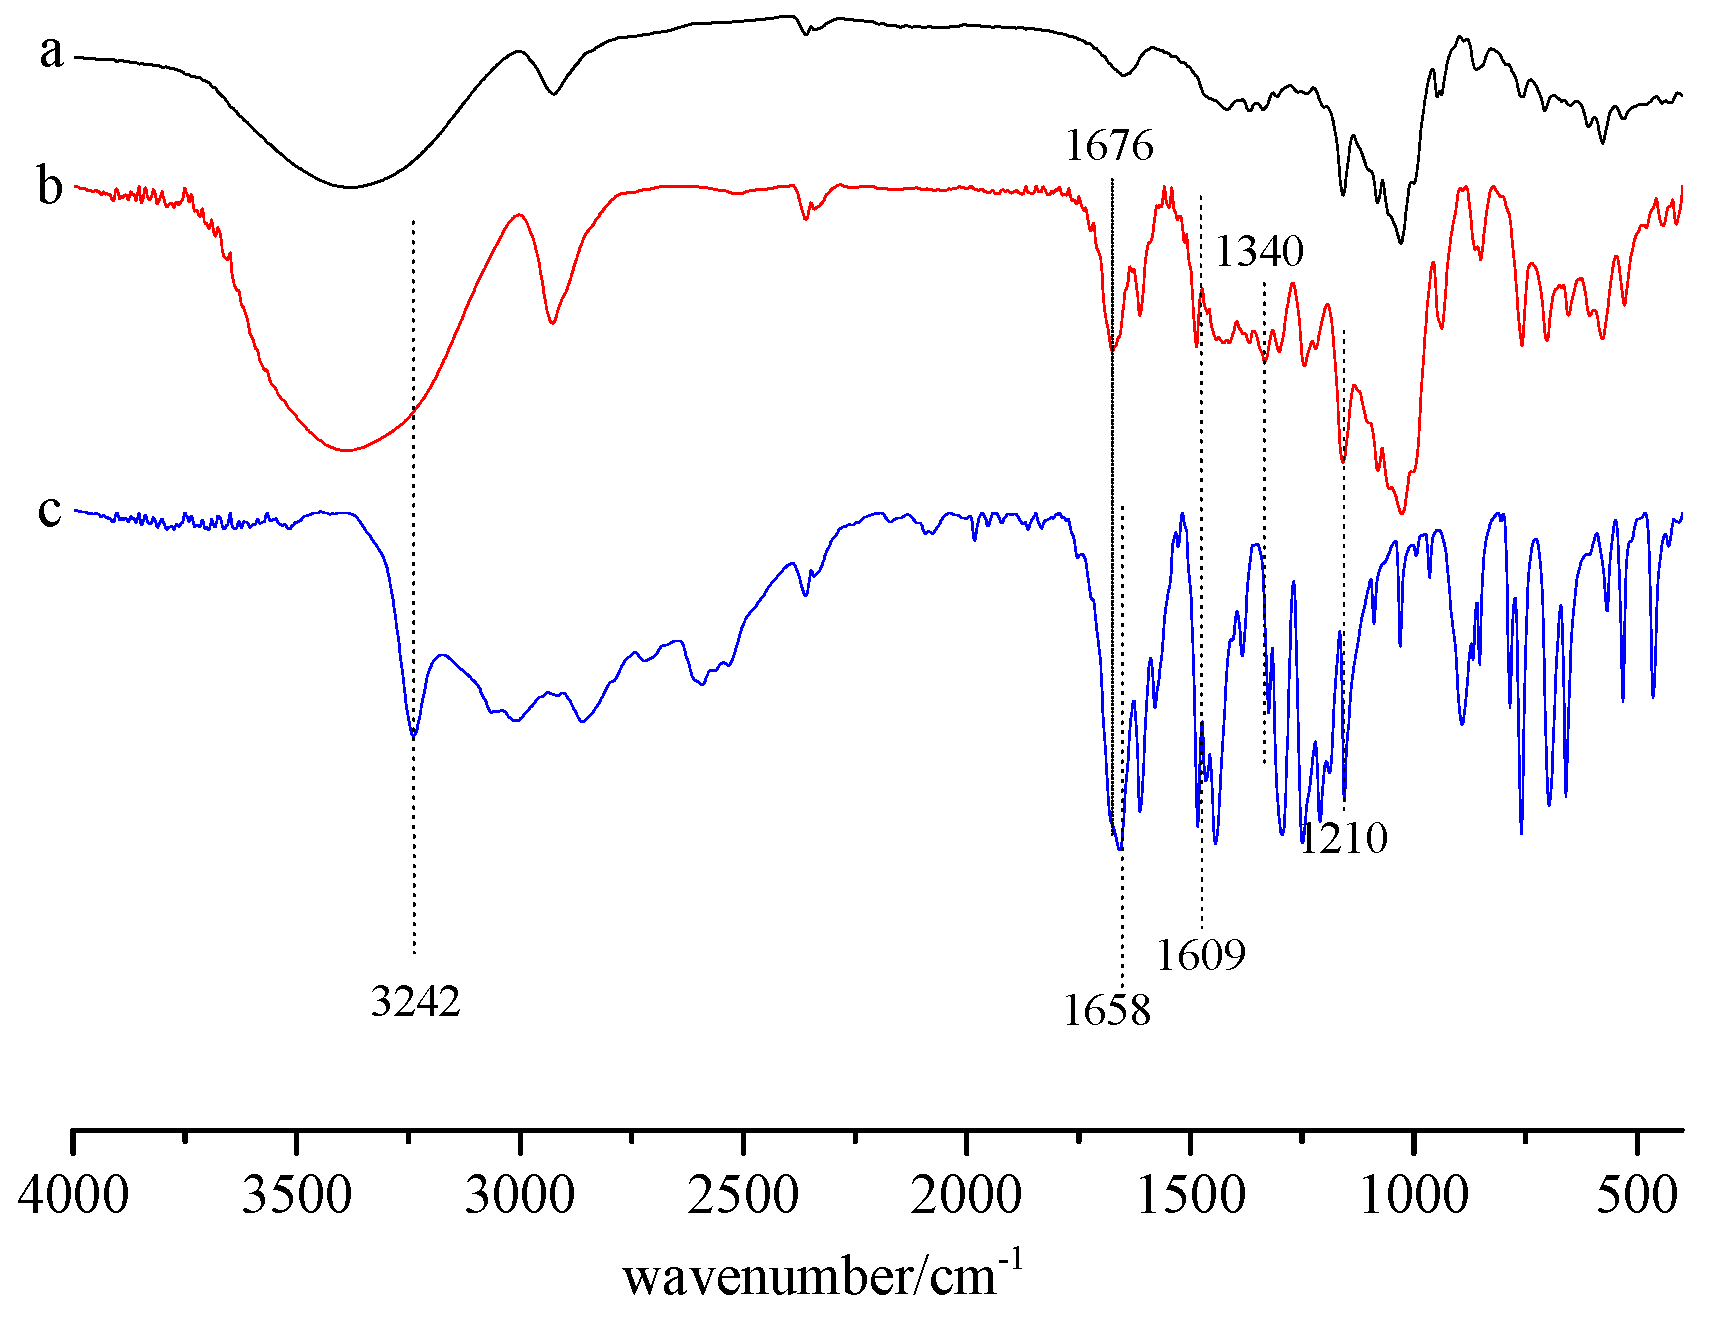
2.4. FTIR Analysis
2.5. UV–Vis Analysis
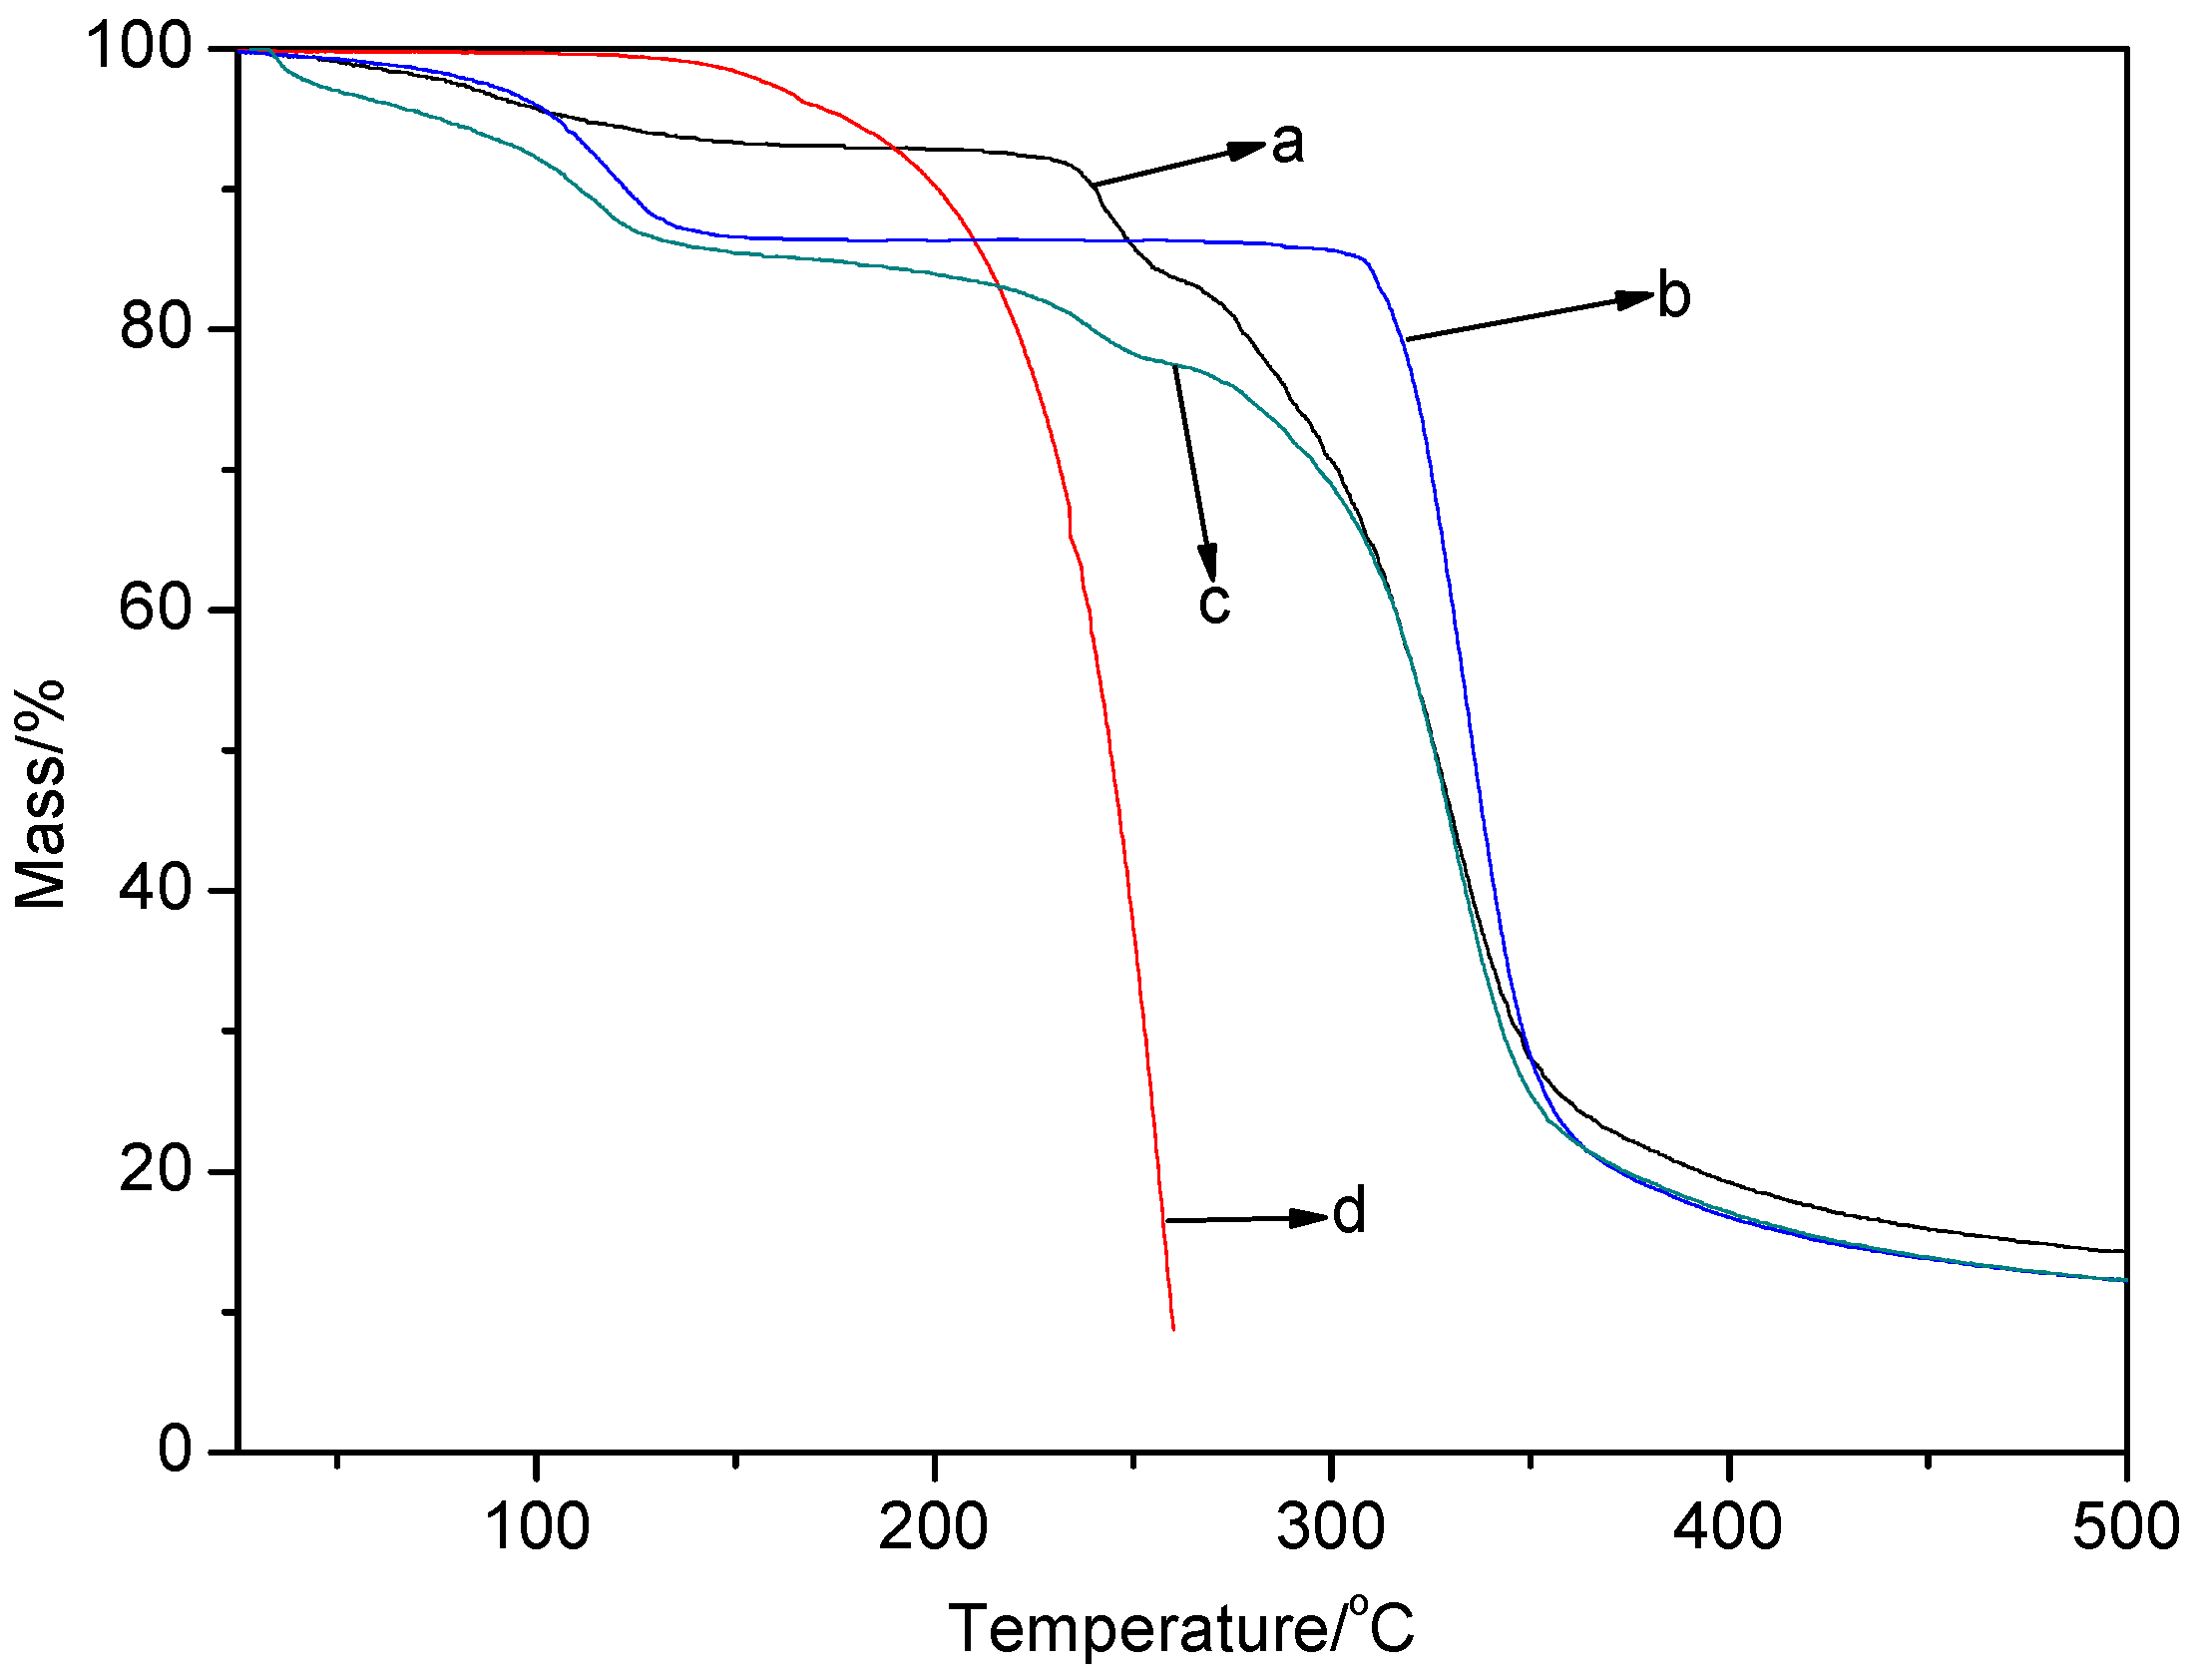
2.6. TGA Analysis
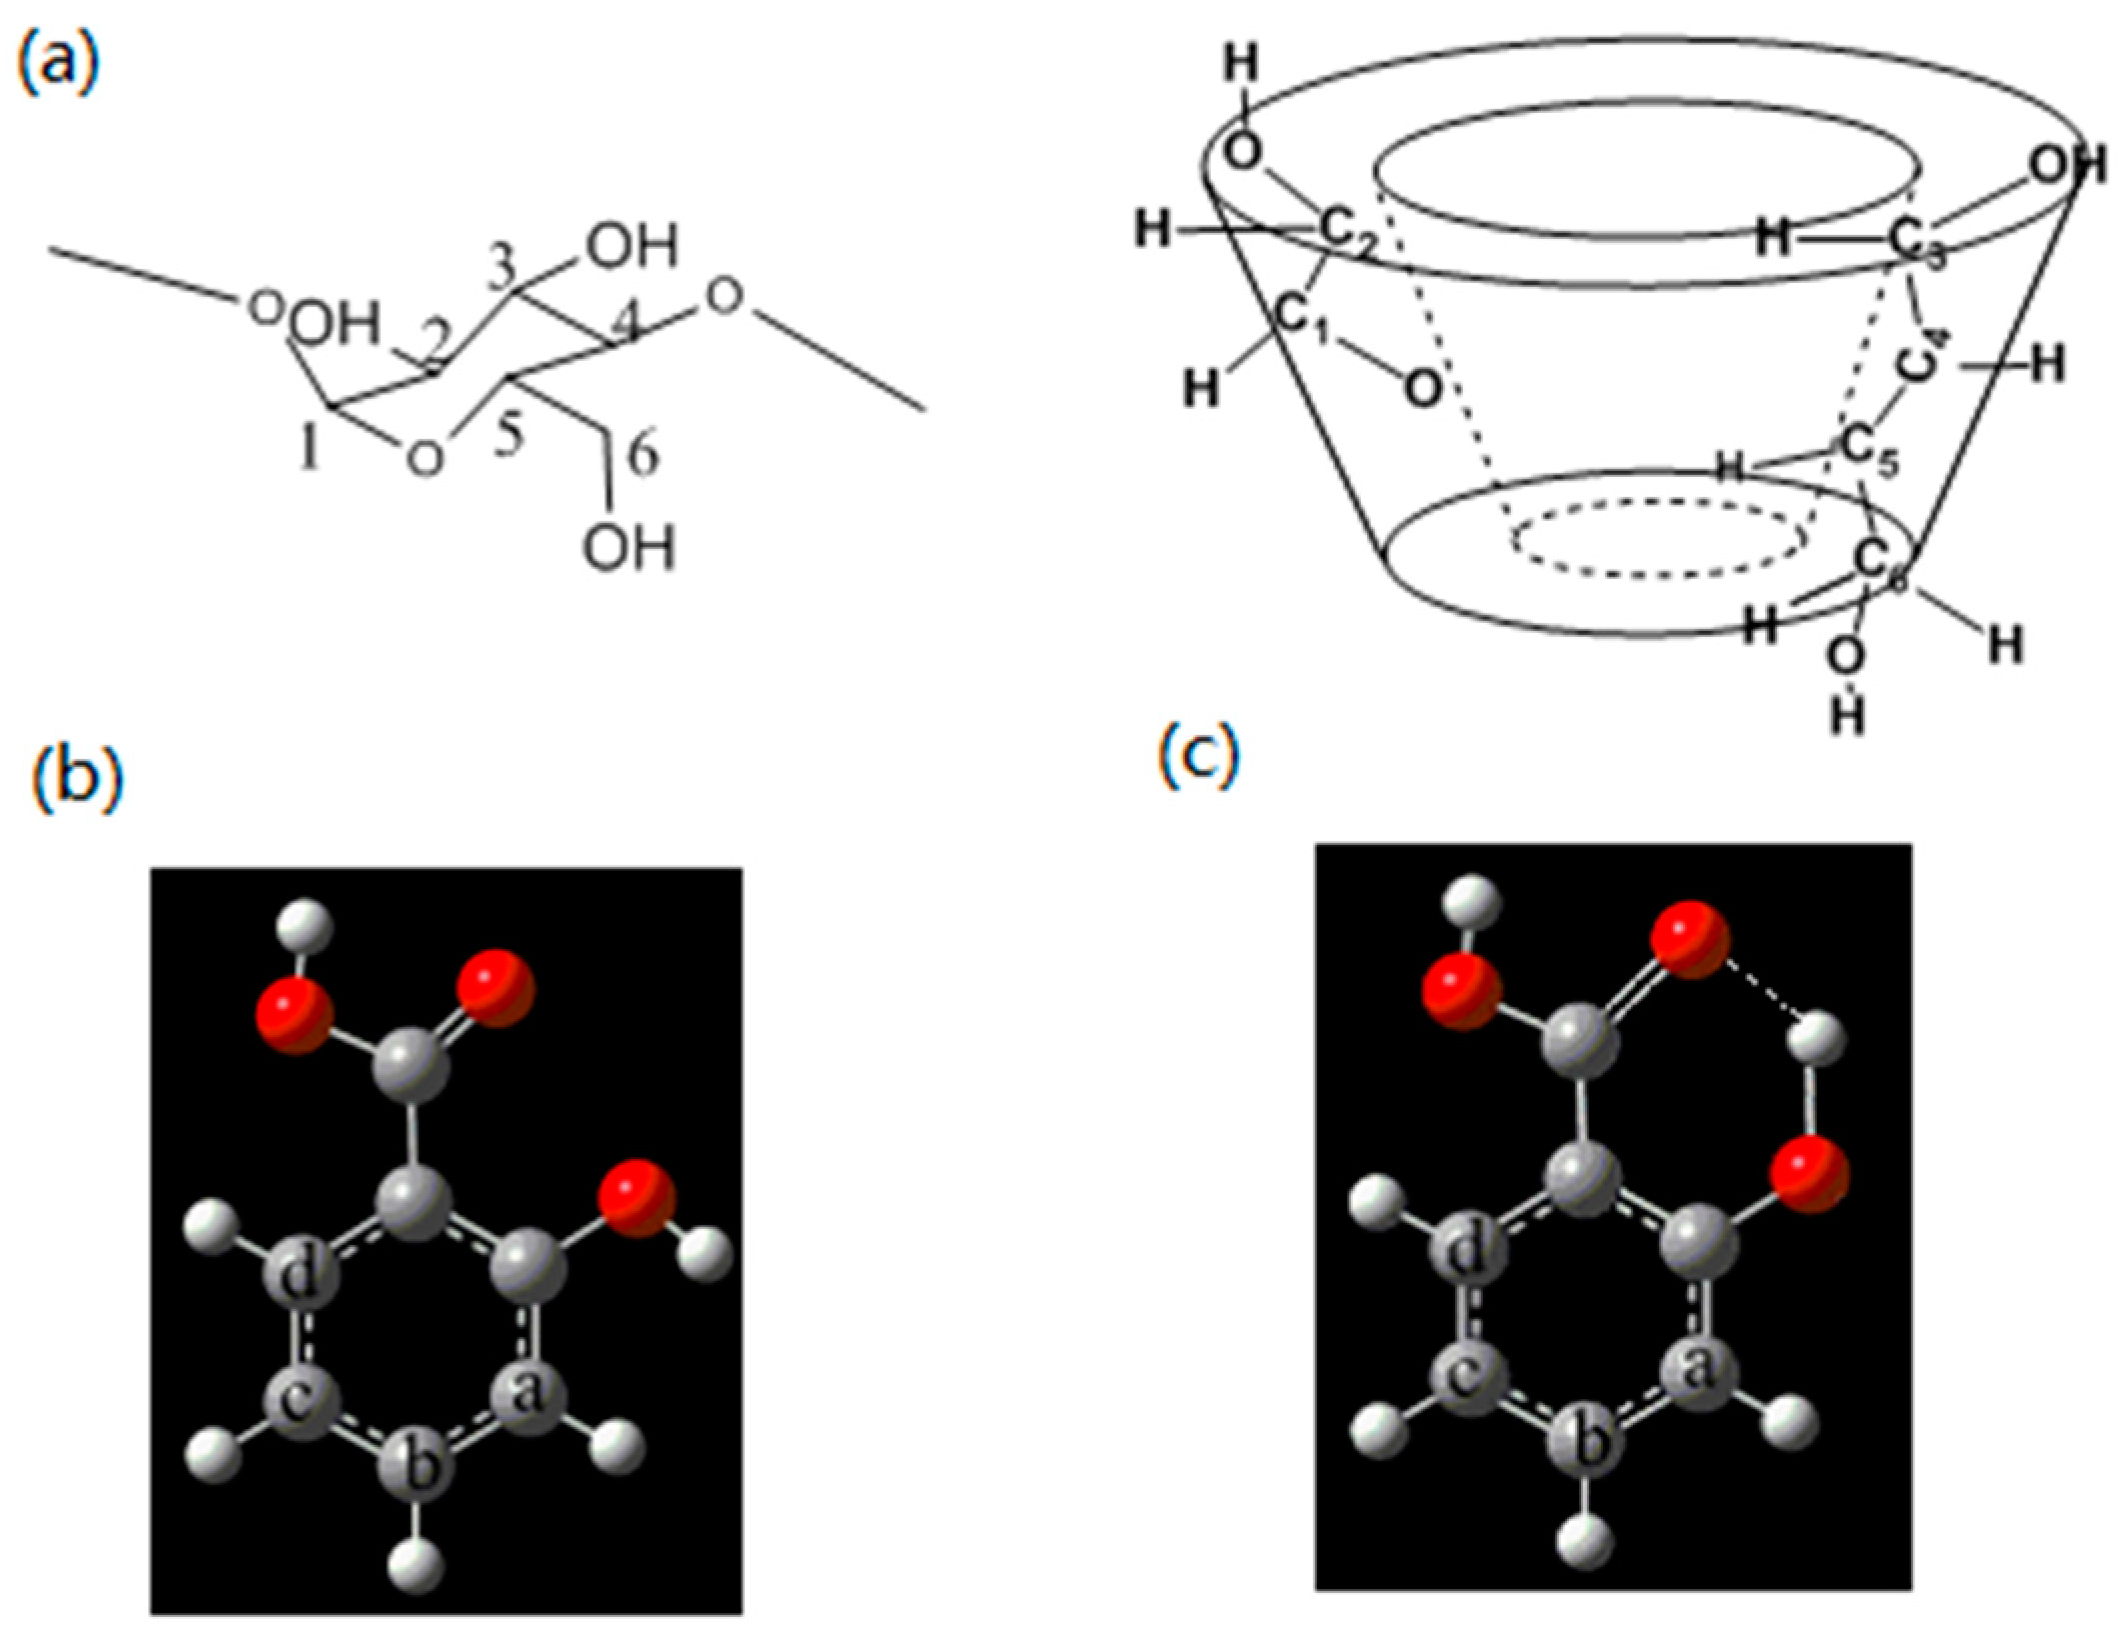
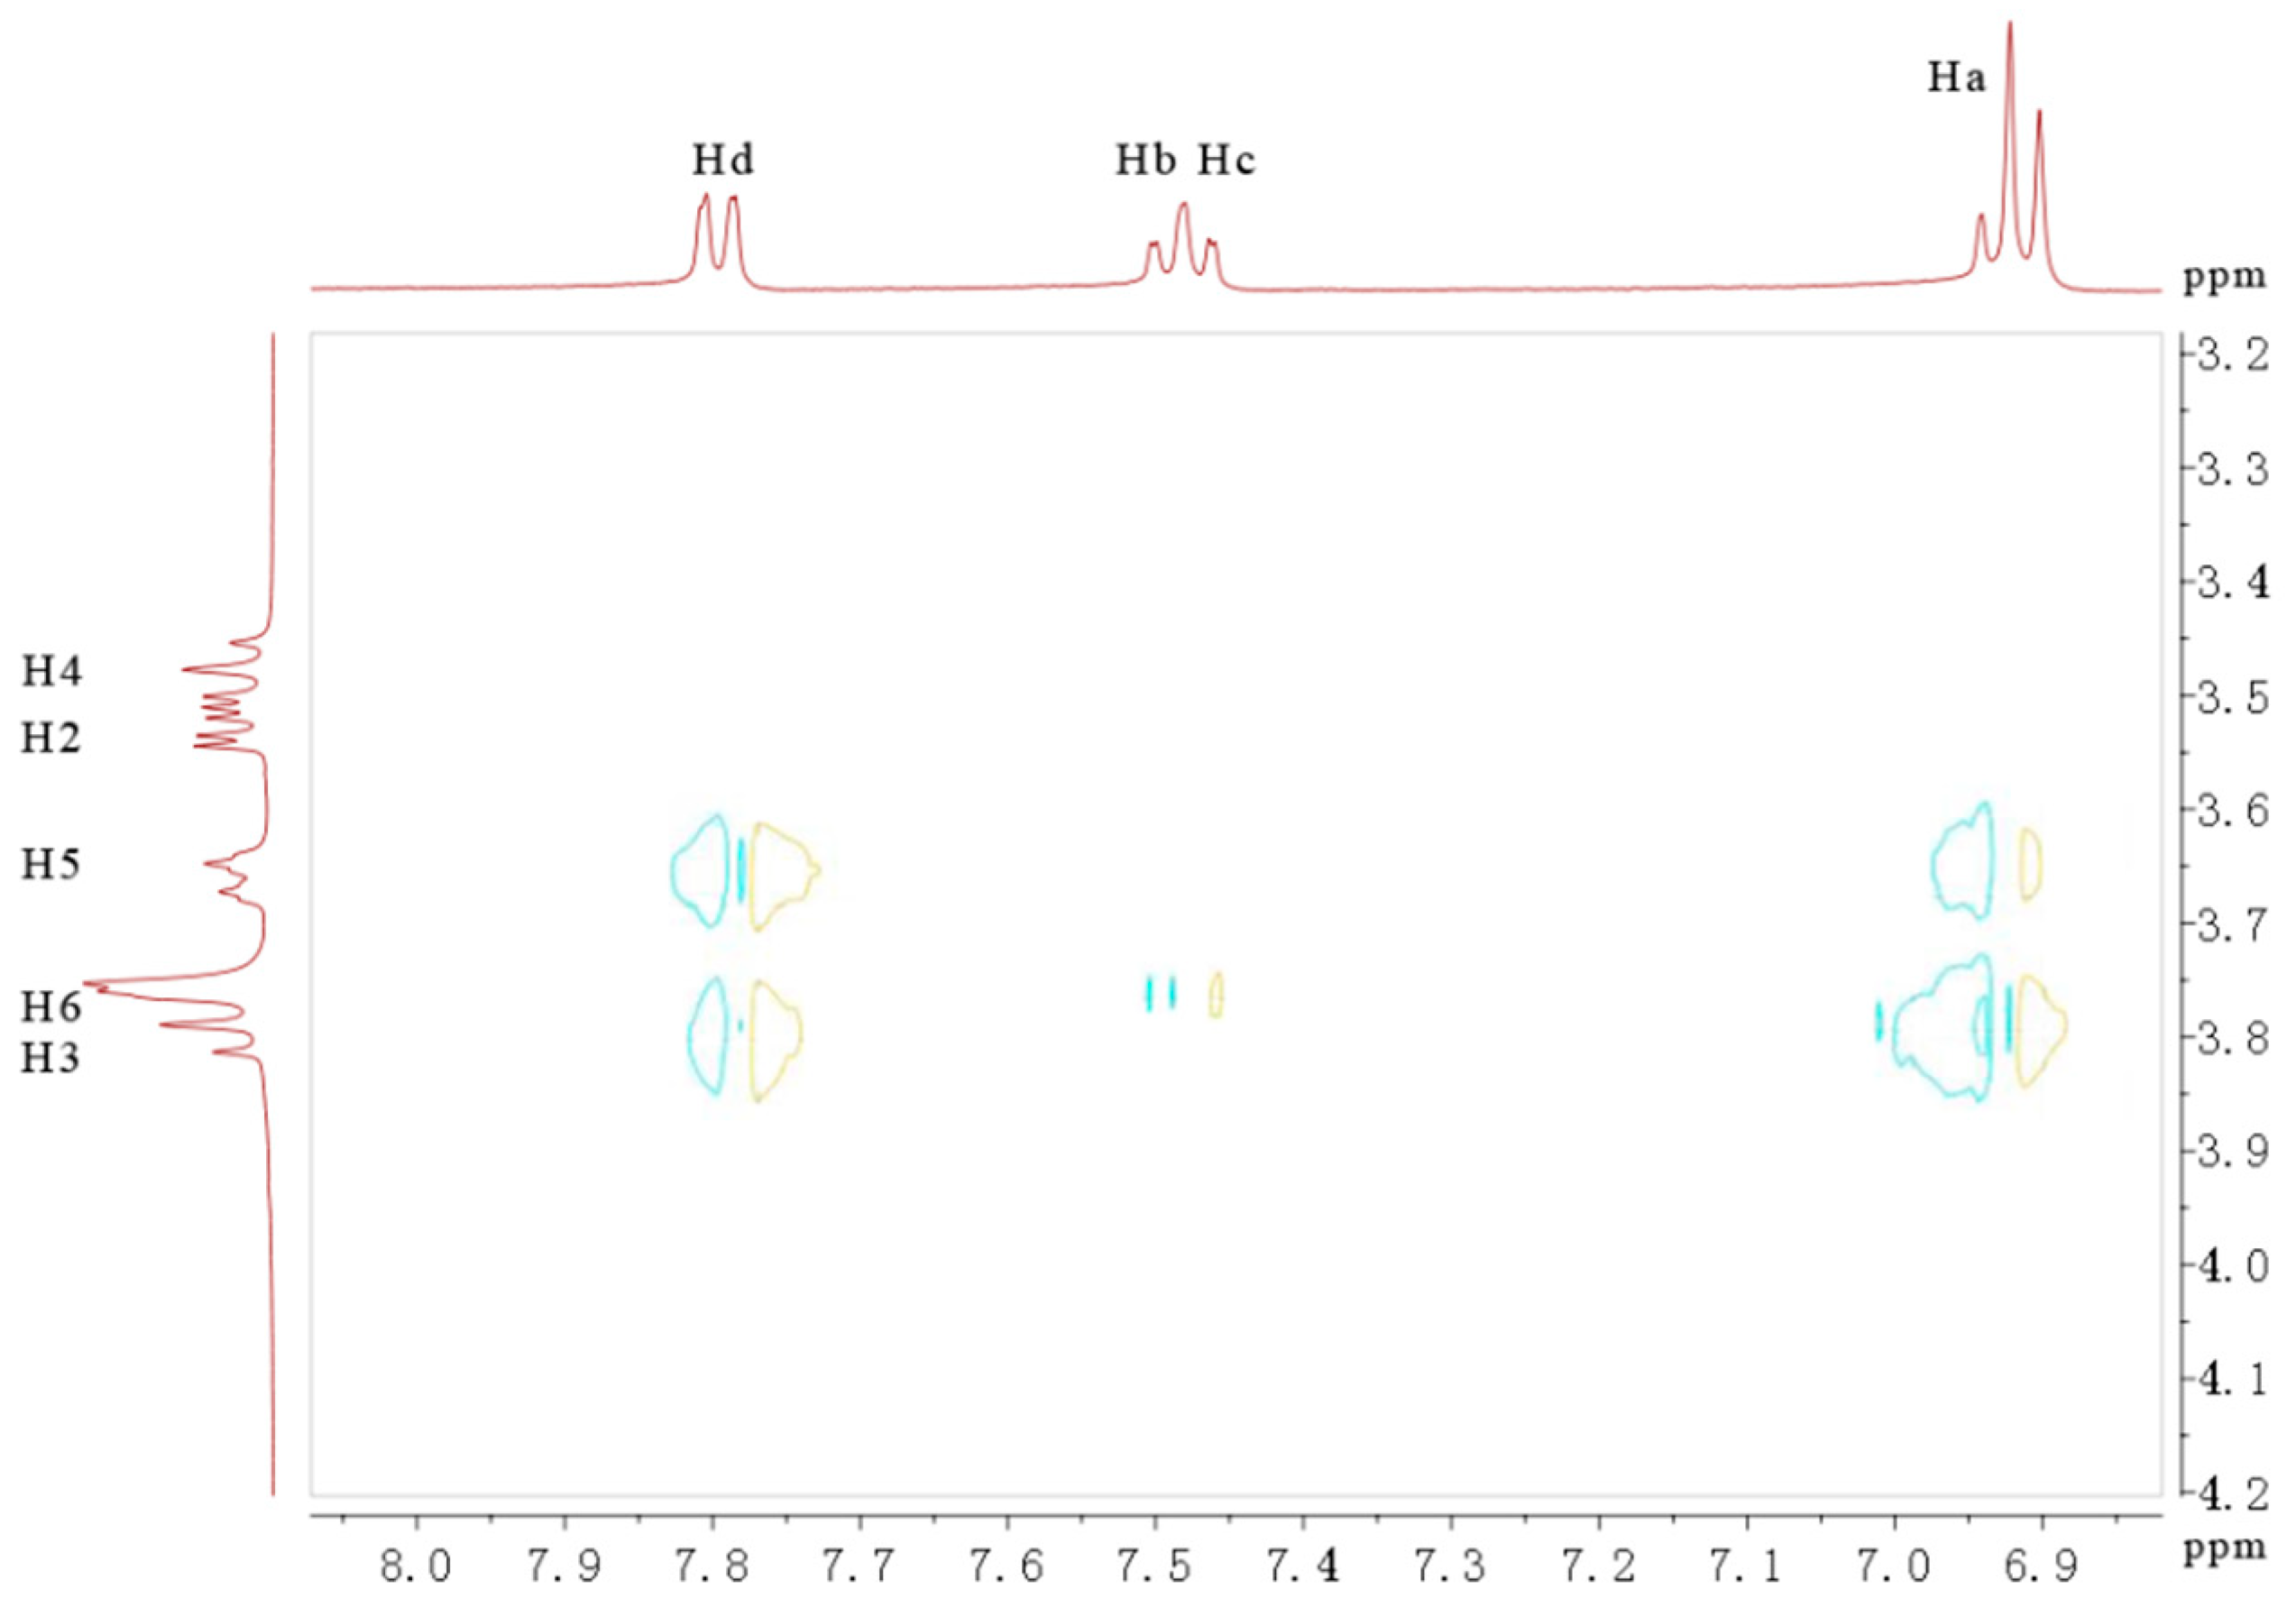
2.7. NMR Analysis
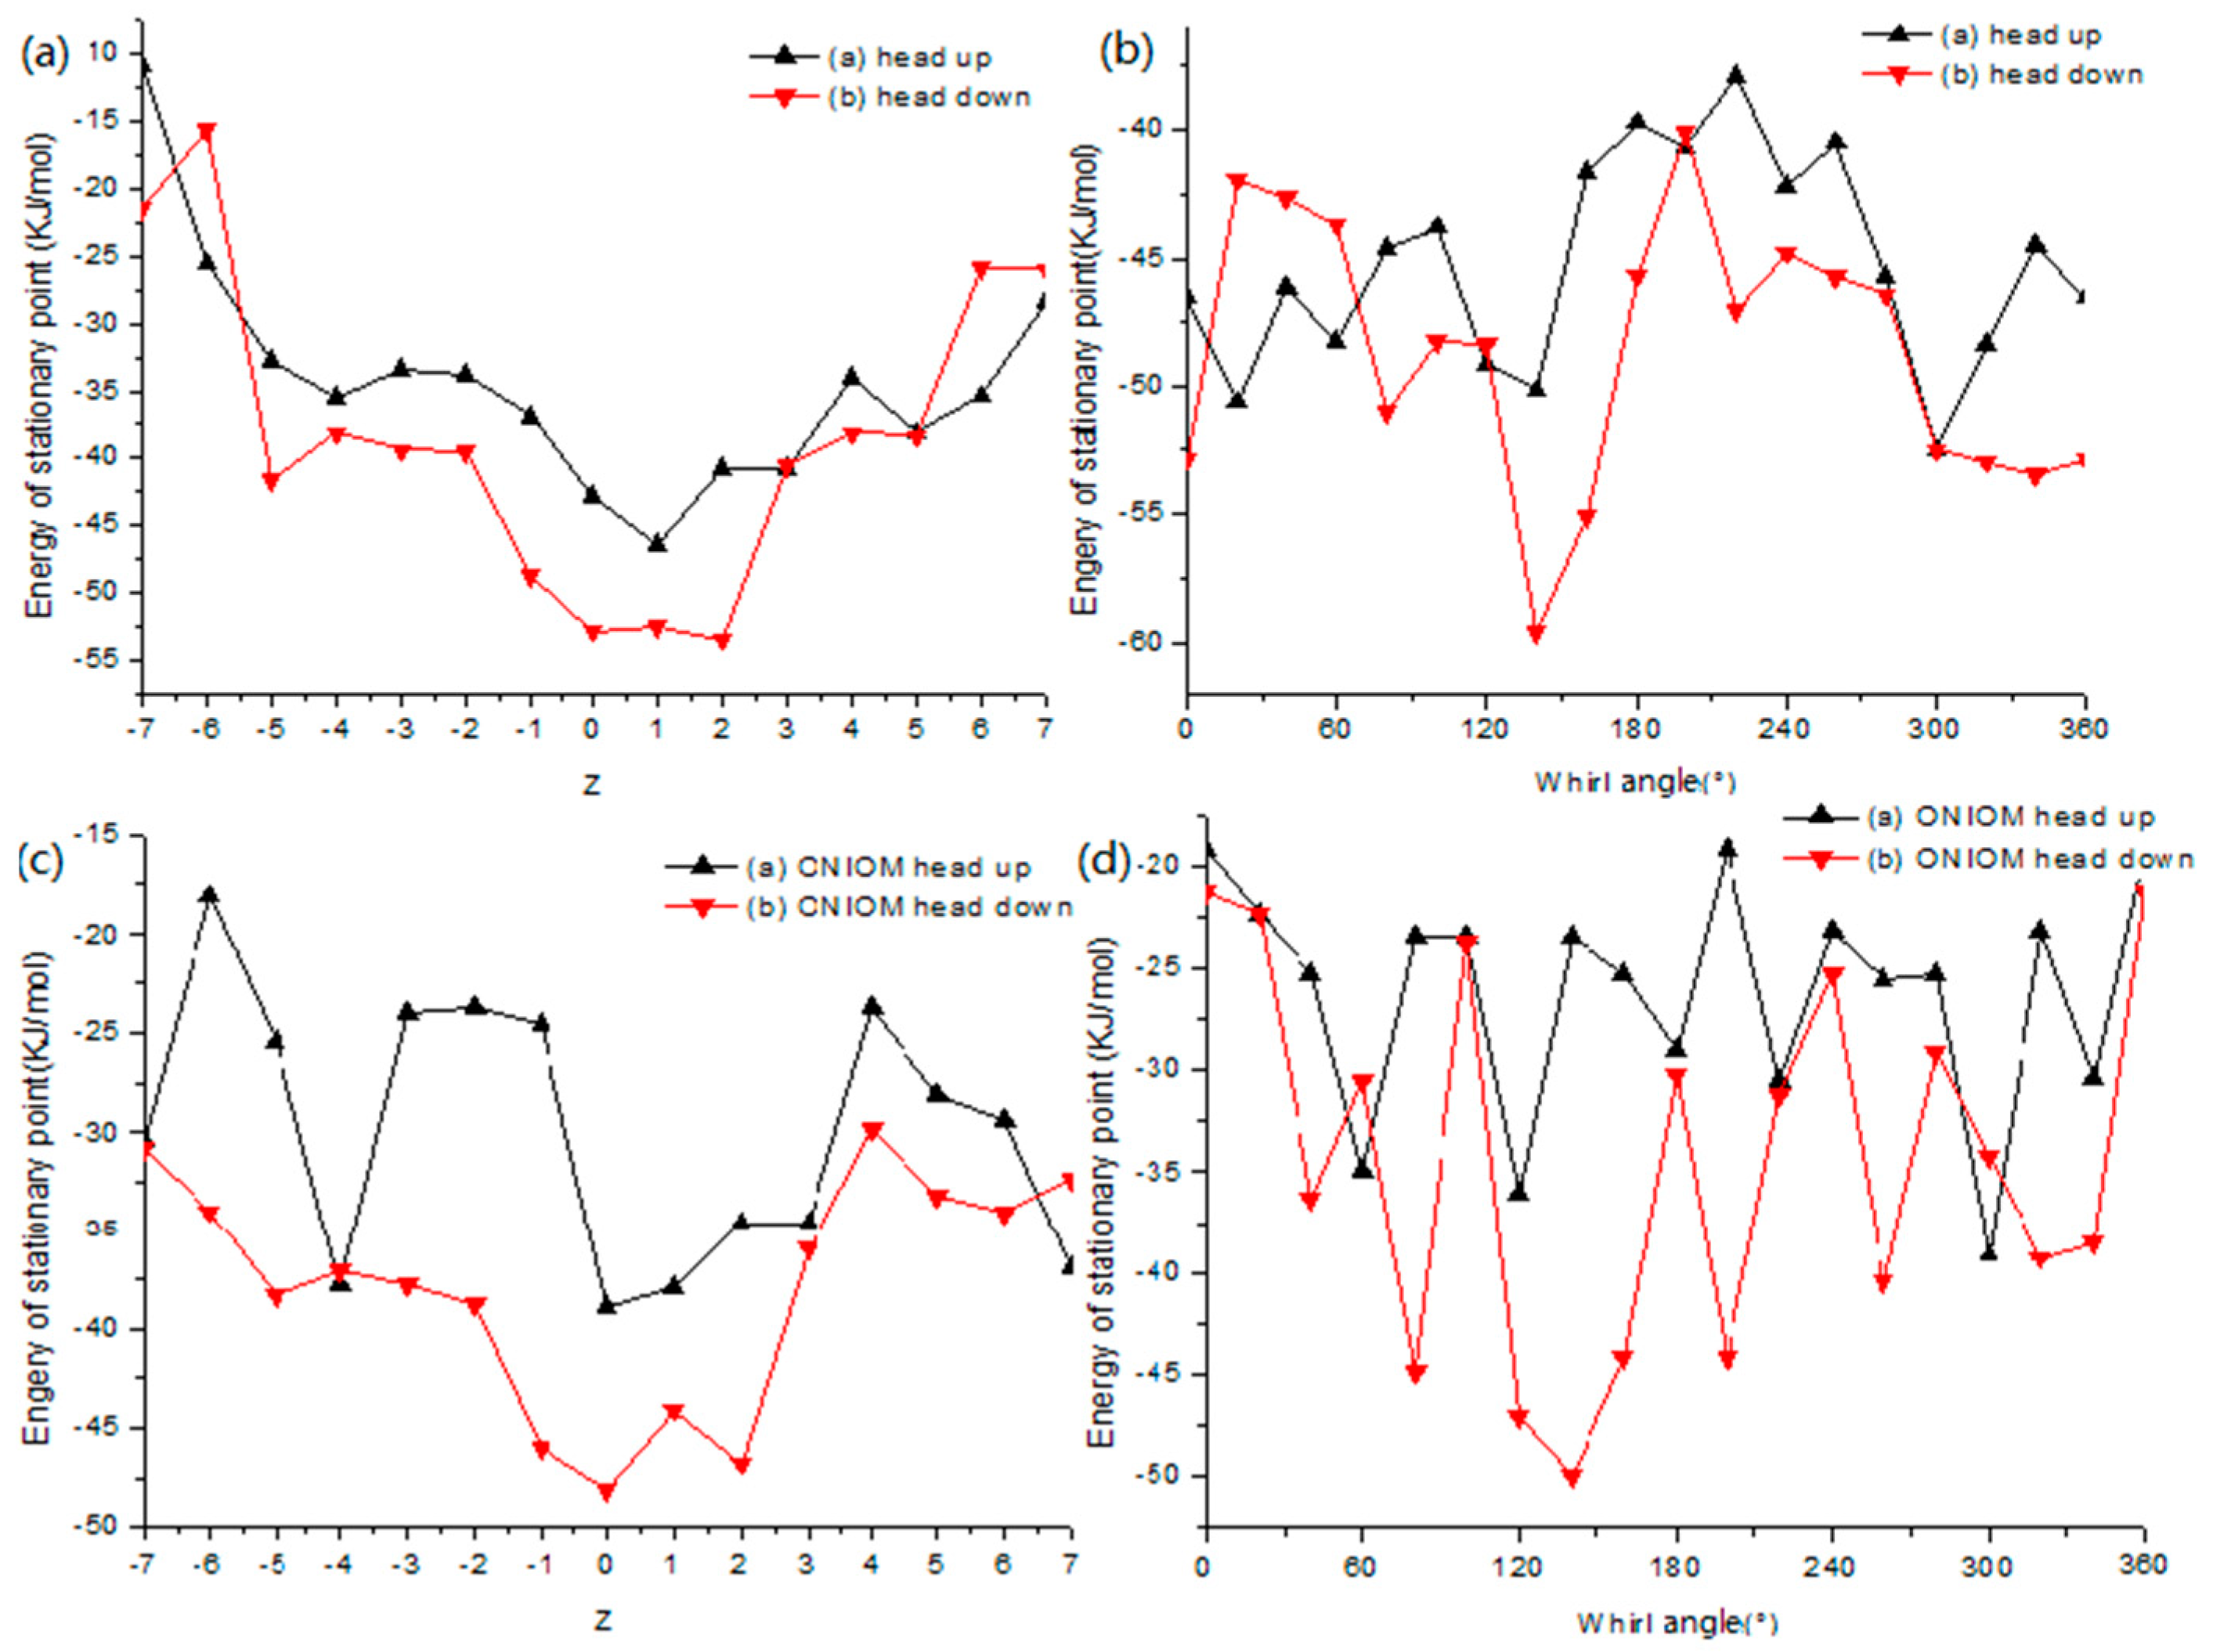
2.8. Theoretical Investigation
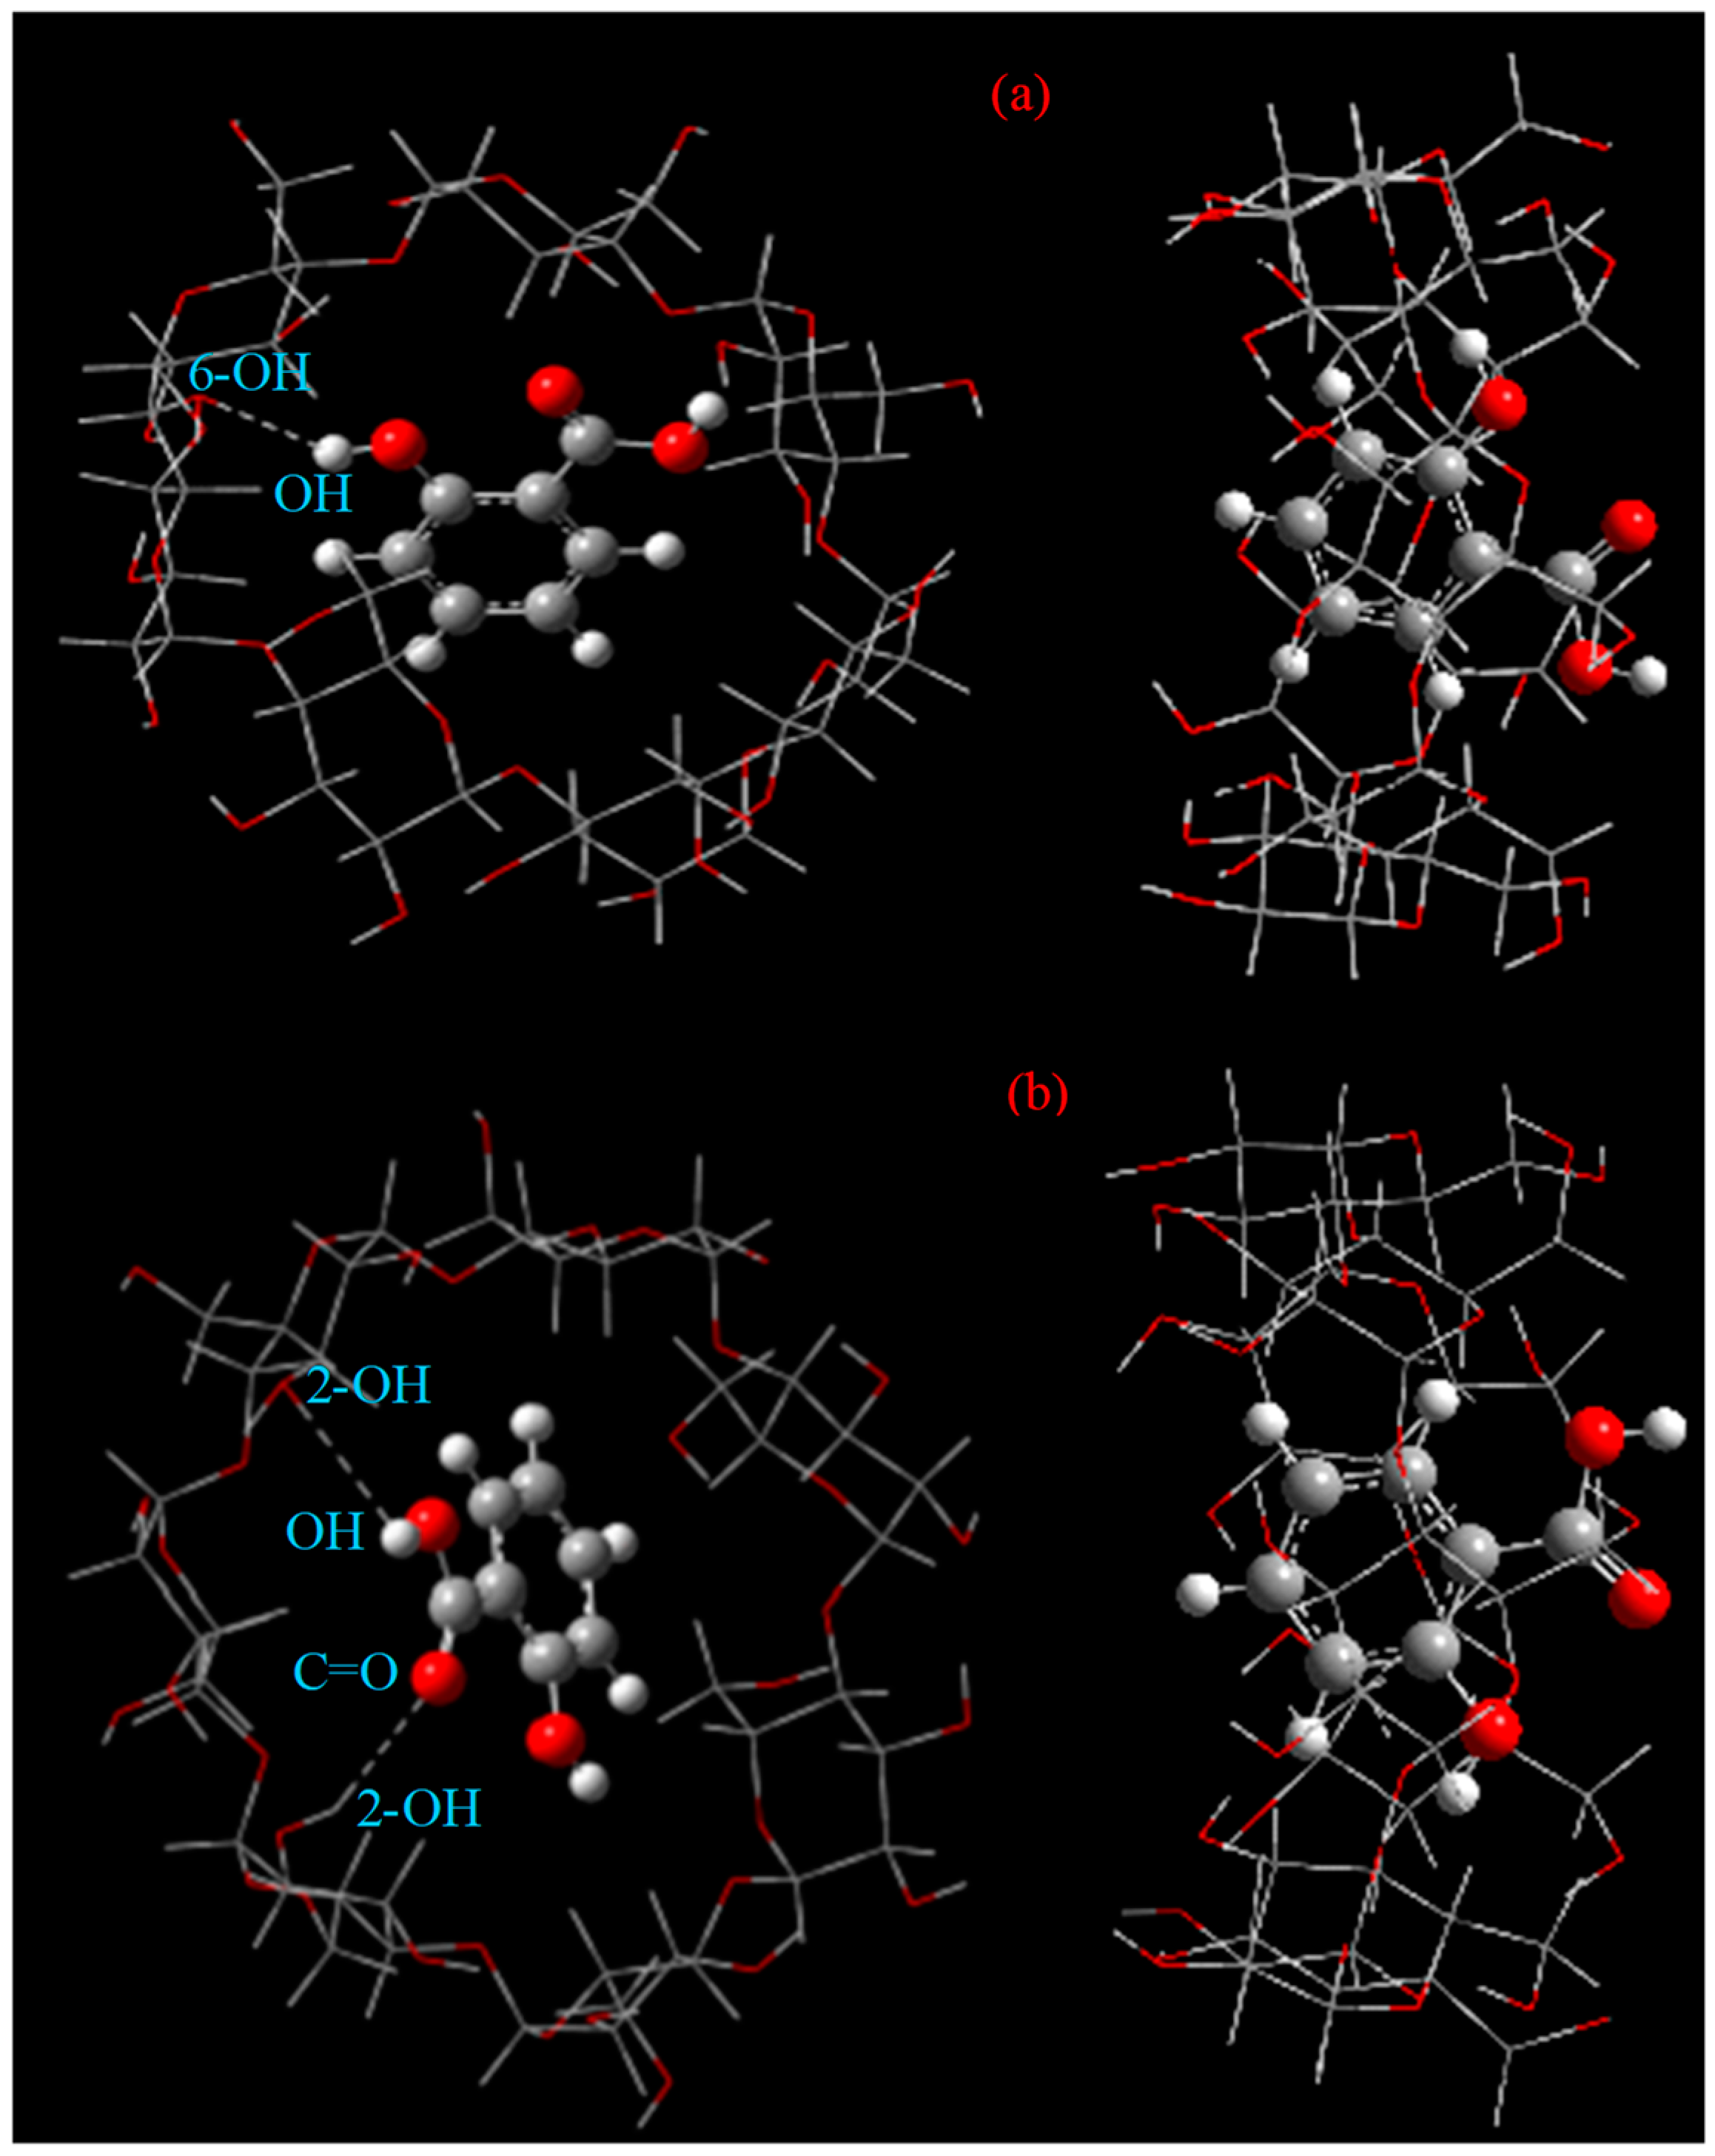
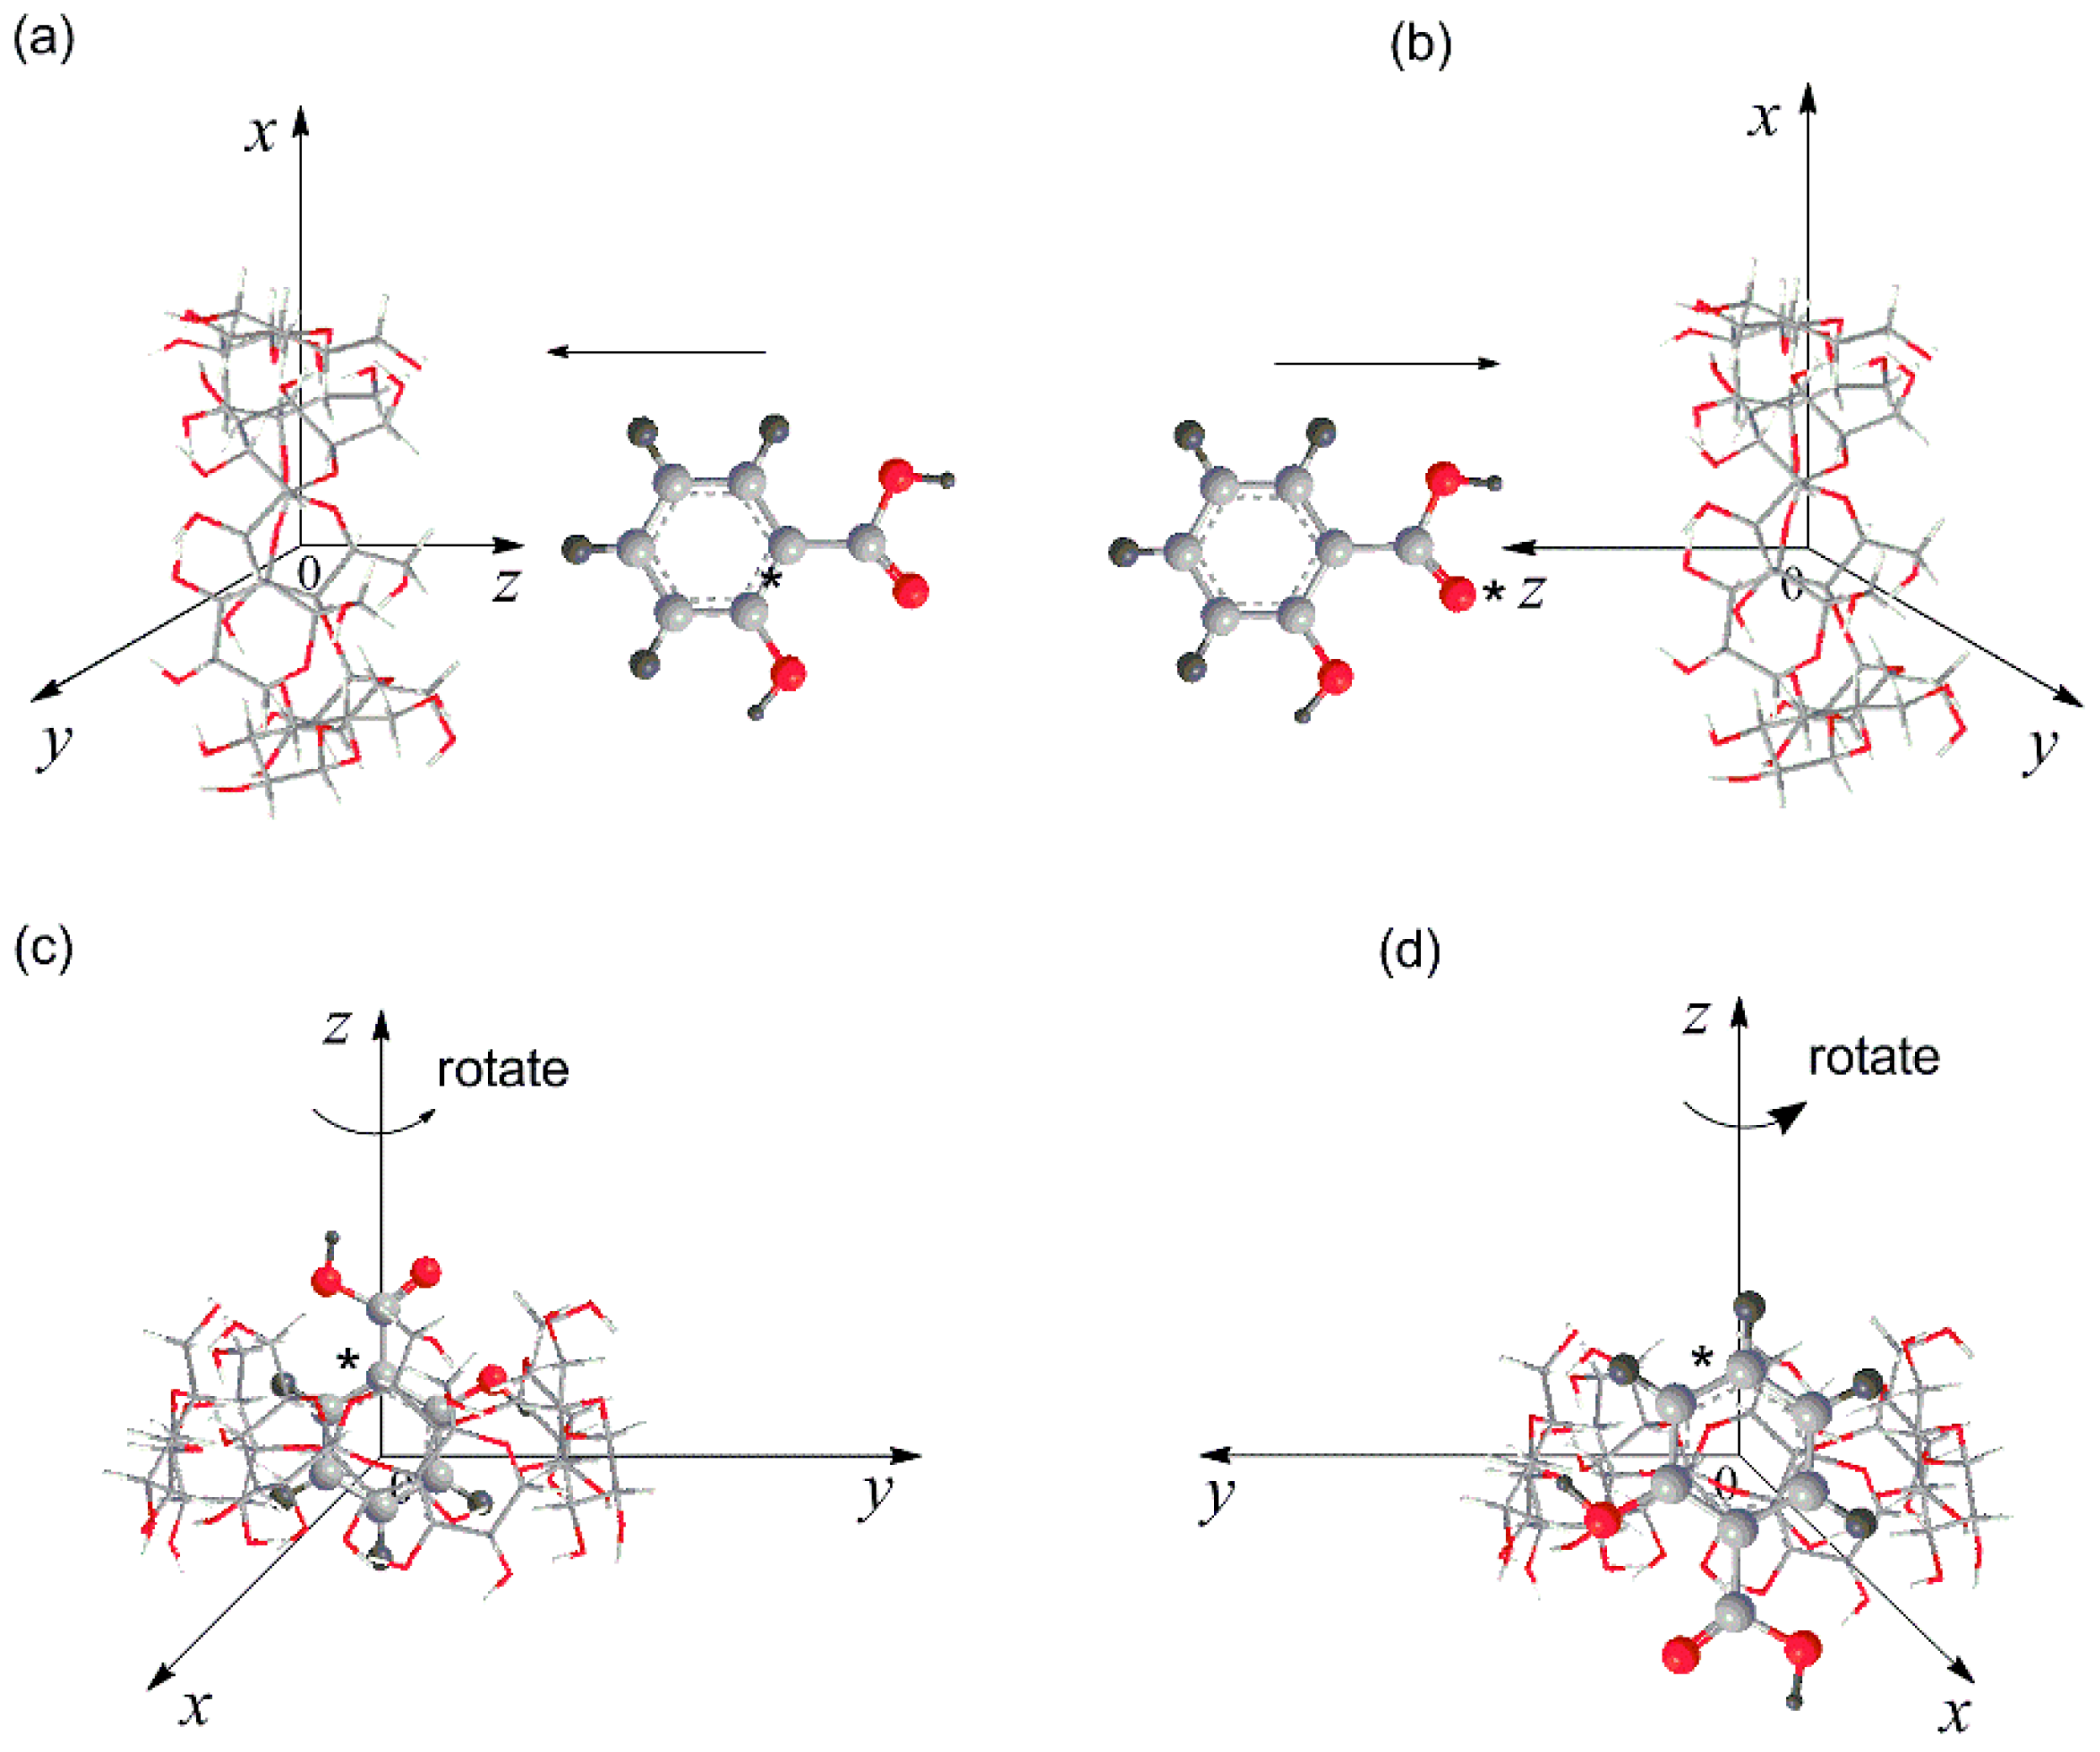
2.9. Optimized Structures of the Inclusion Complex
3. Materials and Methods
3.1. Chemicals
3.2. Preparation of SA Inclusion Complex with β-CD
3.3. Content of SA in the Complex
3.4. Treatment of Banana Fruits and Their Decay Rates
3.5. Antioxidant Activity of SA and Its Inclusion Complex
3.6. Determination of Stability Constant
3.7. Characterization of the Inclusion Complex
3.8. Computational Methods
4. Conclusions
Author Contributions
Funding
Institutional Review Board Statement
Informed Consent Statement
Data Availability Statement
Conflicts of Interest
References
- Wang, Z.; Erasmus, S.W.; Dekker, P.; Guo, B.; Stoorvogel, J.J.; van Ruth, S.M. Linking growing conditions to stable isotope ratios and elemental compositions of Costa Rican bananas (Musa spp.). Food Res. Int. 2020, 129, 108882. [Google Scholar] [CrossRef]
- Murmu, S.B.; Mishra, H.N. Post-harvest shelf-life of banana and guava: Mechanisms of common degradation problems and emerging counteracting strategies. Innov. Food Sci. Emerg. Technol. 2018, 49, 20–30. [Google Scholar] [CrossRef]
- Chen, J.; Li, F.; Li, Y.; Wang, Y.; Wang, C.; Yuan, D.; Jiang, Y. Exogenous procyanidin treatment delays senescence of harvested banana fruit by enhancing antioxidant responses and in vivo procyanidin content. Postharvest Biol. Technol. 2019, 158, 110999. [Google Scholar] [CrossRef]
- Costa, T.J.; Barros, P.R.; Arce, C.; Santos, J.D.; da Silva-Neto, J.; Egea, G.; Dantas, A.P.; Tostes, R.C.; Jiménez-Altayó, F. The homeostatic role of hydrogen peroxide, superoxide anion and nitric oxide in the vasculature. Free Radic. Biol. Med. 2021, 162, 615–635. [Google Scholar] [CrossRef]
- Gill, S.S.; Tuteja, N. Reactive oxygen species and antioxidant machinery in abiotic stress tolerance in crop plants. Plant Physiol. Biochem. 2010, 48, 909–930. [Google Scholar] [CrossRef] [PubMed]
- Khan, M.I.R.; Ashfaque, F.; Chhillar, H.; Irfan, M.; Khan, N.A. The intricacy of silicon, plant growth regulators and other signaling molecules for abiotic stress tolerance: An entrancing crosstalk between stress alleviators. Plant Physiol. Biochem. 2021, 162, 36–47. [Google Scholar] [CrossRef] [PubMed]
- Gao, F.-K.; Ren, C.-G.; Dai, C.-C. Signaling effects of nitric oxide, salicylic acid, and reactive oxygen species on isoeuphpekinensin accumulation in euphorbia pekinensis suspension cells induced by an endophytic fungal elicitor. J. Plant Growth Regul. 2012, 31, 490–497. [Google Scholar] [CrossRef]
- Xu, E.; Brosché, M. Salicylic acid signaling inhibits apoplastic reactive oxygen species signaling. BMC Plant Biol. 2014, 14, 155. [Google Scholar] [CrossRef] [Green Version]
- Huang, R.-H.; Liu, J.-H.; Lu, Y.-M.; Xia, R.-X. Effect of salicylic acid on the antioxidant system in the pulp of ‘Cara cara’ navel orange (Citrus sinensis L. Osbeck) at different storage temperatures. Postharvest Biol. Technol. 2008, 47, 168–175. [Google Scholar] [CrossRef]
- Maheshwari, S.; Chowdhury, A.; Sathyamurthy, N.; Mishra, H.; Tripathi, H.B.; Panda, M.; Chandrasekhar, J. Ground and excited state intramolecular proton transfer in salicylic acid: An Ab initio electronic structure investigation. J. Phys. Chem. A 1999, 103, 6257–6262. [Google Scholar] [CrossRef]
- Xiao, Z.; Zhang, Y.; Niu, Y.; Ke, Q.; Kou, X. Cyclodextrins as carriers for volatile aroma compounds: A review. Carbohyd. Polym. 2021, 269, 118292. [Google Scholar] [CrossRef]
- Connors, K.A. The stability of cyclodextrin complexes in solution. Chem. Rev. 1997, 97, 1325–1358. [Google Scholar] [CrossRef] [PubMed]
- Periasamy, R.; Kothainayaki, S.; Sivakumar, K. Host-guest inclusion complex of β-cyclodextrin and 4,4-(1,4-phenylenediisopropylidene)bisaniline: Spectral, structural and molecular modeling studies. J. Mol. Struct. 2021, 1224, 129050. [Google Scholar] [CrossRef]
- Kfoury, M.; Geagea, C.; Ruellan, S.; Greige-Gerges, H.; Fourmentin, S. Effect of cyclodextrin and cosolvent on the solubility and antioxidant activity of caffeic acid. Food Chem. 2019, 278, 163–169. [Google Scholar] [CrossRef]
- Mamusa, M.; Resta, C.; Sofroniou, C.; Baglioni, P. Encapsulation of volatile compounds in liquid media: Fragrances, flavors, and essential oils in commercial formulations. Adv. Colloid Interface Sci. 2021, 298, 102544. [Google Scholar] [CrossRef] [PubMed]
- Jansook, P.; Ogawa, N.; Loftsson, T. Cyclodextrins: Structure, physicochemical properties and pharmaceutical applications. Int. J. Pharm. 2018, 535, 272–284. [Google Scholar] [CrossRef] [PubMed]
- Liu, Y.; Sameen, D.E.; Ahmed, S.; Wang, Y.; Lu, R.; Dai, J.; Li, S.; Qin, W. Recent advances in cyclodextrin-based films for food packaging. Food Chem. 2022, 370, 131026. [Google Scholar] [CrossRef]
- Lin, Y.; Huang, R.; Sun, X.; Yu, X.; Xiao, Y.; Wang, L.; Hu, W.; Zhong, T. The p-Anisaldehyde/β-cyclodextrin inclusion complexes as a sustained release agent: Characterization, storage stability, antibacterial and antioxidant activity. Food Control 2022, 132, 108561. [Google Scholar] [CrossRef]
- Liu, G.; Zhu, W.; Zhang, J.; Song, D.; Zhuang, L.; Ma, Q.; Yang, X.; Liu, X.; Zhang, J.; Zhang, H.; et al. Antioxidant capacity of phenolic compounds separated from tea seed oil in vitro and in vivo. Food Chem. 2022, 371, 131122. [Google Scholar] [CrossRef]
- Ge, X.; Jing, L.; Zhao, K.; Su, C.; Zhang, B.; Zhang, Q.; Han, L.; Yu, X.; Li, W. The phenolic compounds profile, quantitative analysis and antioxidant activity of four naked barley grains with different color. Food Chem. 2021, 335, 127655. [Google Scholar] [CrossRef] [PubMed]
- Alizadeh, N.; Nazari, F. Thymol essential oil/β-cyclodextrin inclusion complex into chitosan nanoparticles: Improvement of thymol properties in vitro studies. J. Mol. Liq. 2022, 346, 118250. [Google Scholar] [CrossRef]
- Yang, Z.; Chai, K.; Ji, H. Selective inclusion and separation of cinnamaldehyde and benzaldehyde by insoluble β-cyclodextrin polymer. Sep. Purif. Technol. 2011, 80, 209–216. [Google Scholar] [CrossRef]
- Lateh, L.; Kaewnopparat, N.; Yuenyongsawad, S.; Panichayupakaranant, P. Enhancing the water-solubility of curcuminoids-rich extract using a ternary inclusion complex system: Preparation, characterization, and anti-cancer activity. Food Chem. 2022, 368, 130827. [Google Scholar] [CrossRef]
- Kayaci, F.; Uyar, T. Solid inclusion complexes of vanillin with cyclodextrins: Their formation, characterization, and high-temperature stability. J. Agric. Food Chem. 2011, 59, 11772–11778. [Google Scholar] [CrossRef]
- Benesi, H.A.; Hildebrand, J.H. A Spectrophotometric Investigation of the Interaction of Iodine with Aromatic Hydrocarbons. J. Am. Chem. Soc. 1949, 71, 2703–2707. [Google Scholar] [CrossRef]
- Jahed, V.; Zarrabi, A.; Bordbar, A.-k.; Hafezi, M.S. NMR (1H, ROESY) spectroscopic and molecular modelling investigations of supramolecular complex of β-cyclodextrin and curcumin. Food Chem. 2014, 165, 241–246. [Google Scholar] [CrossRef]
- Srinivasan, K.; Stalin, T. Study of inclusion complex between 2,6-dinitrobenzoic acid and β-cyclodextrin by 1H NMR, 2D 1H NMR (ROESY), FT-IR, XRD, SEM and photophysical methods. Spectrochim. Acta Part A Mol. Biomol. Spectrosc. 2014, 130, 105–115. [Google Scholar] [CrossRef] [PubMed]
- Barillaro, V.; Dive, G.; Ziémons, E.; Bertholet, P.; Evrard, B.; Delattre, L.; Piel, G. Theoretical and experimental vibrational study of miconazole and its dimers with organic acids: Application to the IR characterization of its inclusion complexes with cyclodextrins. Int. J. Pharm. 2008, 350, 155–165. [Google Scholar] [CrossRef]
- Ji, H.B.; Long, Q.P.; Chen, H.Y.; Zhou, X.T.; Hu, X.F. β-Cyclodextrin inclusive interaction driven separation of organic compounds. AICHE J. 2011, 57, 2341–2352. [Google Scholar] [CrossRef]
- Jeffrey, G.A.; Saenger, W. Hydrogen Bonding in Biological Structures; Springer: Berlin, Germany, 1991. [Google Scholar]
- Friedman, M.; Kozukue, N.; Harden, L.A. Cinnamaldehyde content in foods determined by Gas Chromatography-Mass Spectrometry. J. Agric. Food Chem. 2000, 48, 5702–5709. [Google Scholar] [CrossRef] [PubMed]
- Pérez-Tortosa, V.; López-Orenes, A.; Martínez-Pérez, A.; Ferrer, M.A.; Calderón, A.A. Antioxidant activity and rosmarinic acid changes in salicylic acid-treated Thymus membranaceus shoots. Food Chem. 2012, 130, 362–369. [Google Scholar] [CrossRef]
- Stražišar, M.; Andrenšek, S.; Šmidovnik, A. Effect of β-cyclodextrin on antioxidant activity of coumaric acids. Food Chem. 2008, 110, 636–642. [Google Scholar] [CrossRef]
- Chen, H.; Ji, H. Alkaline hydrolysis of cinnamaldehyde to benzaldehyde in the presence of β-cyclodextrin. AICHE J. 2010, 56, 466–476. [Google Scholar] [CrossRef]
- Liu, L.; Li, X.-S.; Song, K.-S.; Guo, Q.-X. PM3 studies on the complexation of α-cyclodextrin with benzaldehyde and acetophenone. J. Mol. Struct. 2000, 531, 127–134. [Google Scholar] [CrossRef]
- Yang, E.-C.; Zhao, X.-J.; Hua, F.; Hao, J.-K. Semi-empirical PM3 study upon the complexation of β-cyclodextrin with 4,4′-benzidine and o-tolidine. J. Mol. Struct. 2004, 712, 75–79. [Google Scholar] [CrossRef]
- Attoui Yahia, O.; Khatmi, D.E. Theoretical study of the inclusion processes of Venlafaxine with β-cyclodextrin. J. Mol. Struct. 2009, 912, 38–43. [Google Scholar] [CrossRef]
- Fatiha, M.; Khatmi, D.E.; Largate, L. Theoretical approach in the study of the inclusion processes of sulconazole with β-cyclodextrin. J. Mol. Liq. 2010, 154, 1–5. [Google Scholar] [CrossRef]


| Samples | DPPH-Scavenging Activity (%) |
|---|---|
| SA | 7.33 ± 0.52 |
| SA/β-CD | 27.83 ± 0.74 |
| H1 | H2 | H3 | H4 | H5 | H6 | |
|---|---|---|---|---|---|---|
| δβ-CD (ppm) | 5.123 | 3.751 | 4.021 | 3.640 | 3.911 | 3.934 |
| δinclusion (ppm) | 5.102 | 3.684 | 3.900 | 3.637 | 3.788 | 3.923 |
| Δδ (ppm) a | 0.001 | 0.006 | 0.121 | 0.003 | 0.123 | 0.011 |
| Ha (~6.92 ppm) | - | - | + | - | + | + |
| Hb (~7.50 ppm) | - | - | - | - | - | + |
| Hc (~7.46 ppm) | - | - | - | - | - | + |
| Hd (~7.78 ppm) | - | - | + | - | + | + |
| BE/(KJ·mol−1) | ZC*/Å | θ/° | |
|---|---|---|---|
| Head up | −52.53 | 1 | 300 |
| Head down | −59.58 | 0 | 140 |
| BE/(KJ·mol−1) | ZC*/Å | θ/° | |
|---|---|---|---|
| Head up | −39.10 | 1 | 300 |
| Head down | −50.03 | 0 | 140 |
| SA/β-CD | Type | R (Å) | A (°) | θ/° |
|---|---|---|---|---|
| head up | O58-H136···O (156) | 2.549 | 147.272 | 300 |
| head down | O157-H163···O (62) | 2.583 | 118.587 | 140 |
Publisher’s Note: MDPI stays neutral with regard to jurisdictional claims in published maps and institutional affiliations. |
© 2022 by the authors. Licensee MDPI, Basel, Switzerland. This article is an open access article distributed under the terms and conditions of the Creative Commons Attribution (CC BY) license (https://creativecommons.org/licenses/by/4.0/).
Share and Cite
Yang, Z.; Guan, Y.; Ji, H. Enhanced Antioxidant Activity of Fresh Fruits through Salicylic Acid/β-CD Hydroalcoholic Gels. Gels 2022, 8, 61. https://doi.org/10.3390/gels8010061
Yang Z, Guan Y, Ji H. Enhanced Antioxidant Activity of Fresh Fruits through Salicylic Acid/β-CD Hydroalcoholic Gels. Gels. 2022; 8(1):61. https://doi.org/10.3390/gels8010061
Chicago/Turabian StyleYang, Zujin, Youliang Guan, and Hongbing Ji. 2022. "Enhanced Antioxidant Activity of Fresh Fruits through Salicylic Acid/β-CD Hydroalcoholic Gels" Gels 8, no. 1: 61. https://doi.org/10.3390/gels8010061
APA StyleYang, Z., Guan, Y., & Ji, H. (2022). Enhanced Antioxidant Activity of Fresh Fruits through Salicylic Acid/β-CD Hydroalcoholic Gels. Gels, 8(1), 61. https://doi.org/10.3390/gels8010061