
Structural and Chemical Properties of Geopolymer Gels Incorporated with Neodymium and Samarium

 ,
,  ,
,  ,
,  , ,
, , 
Abstract
:
1. Introduction
2. Results and Discussion
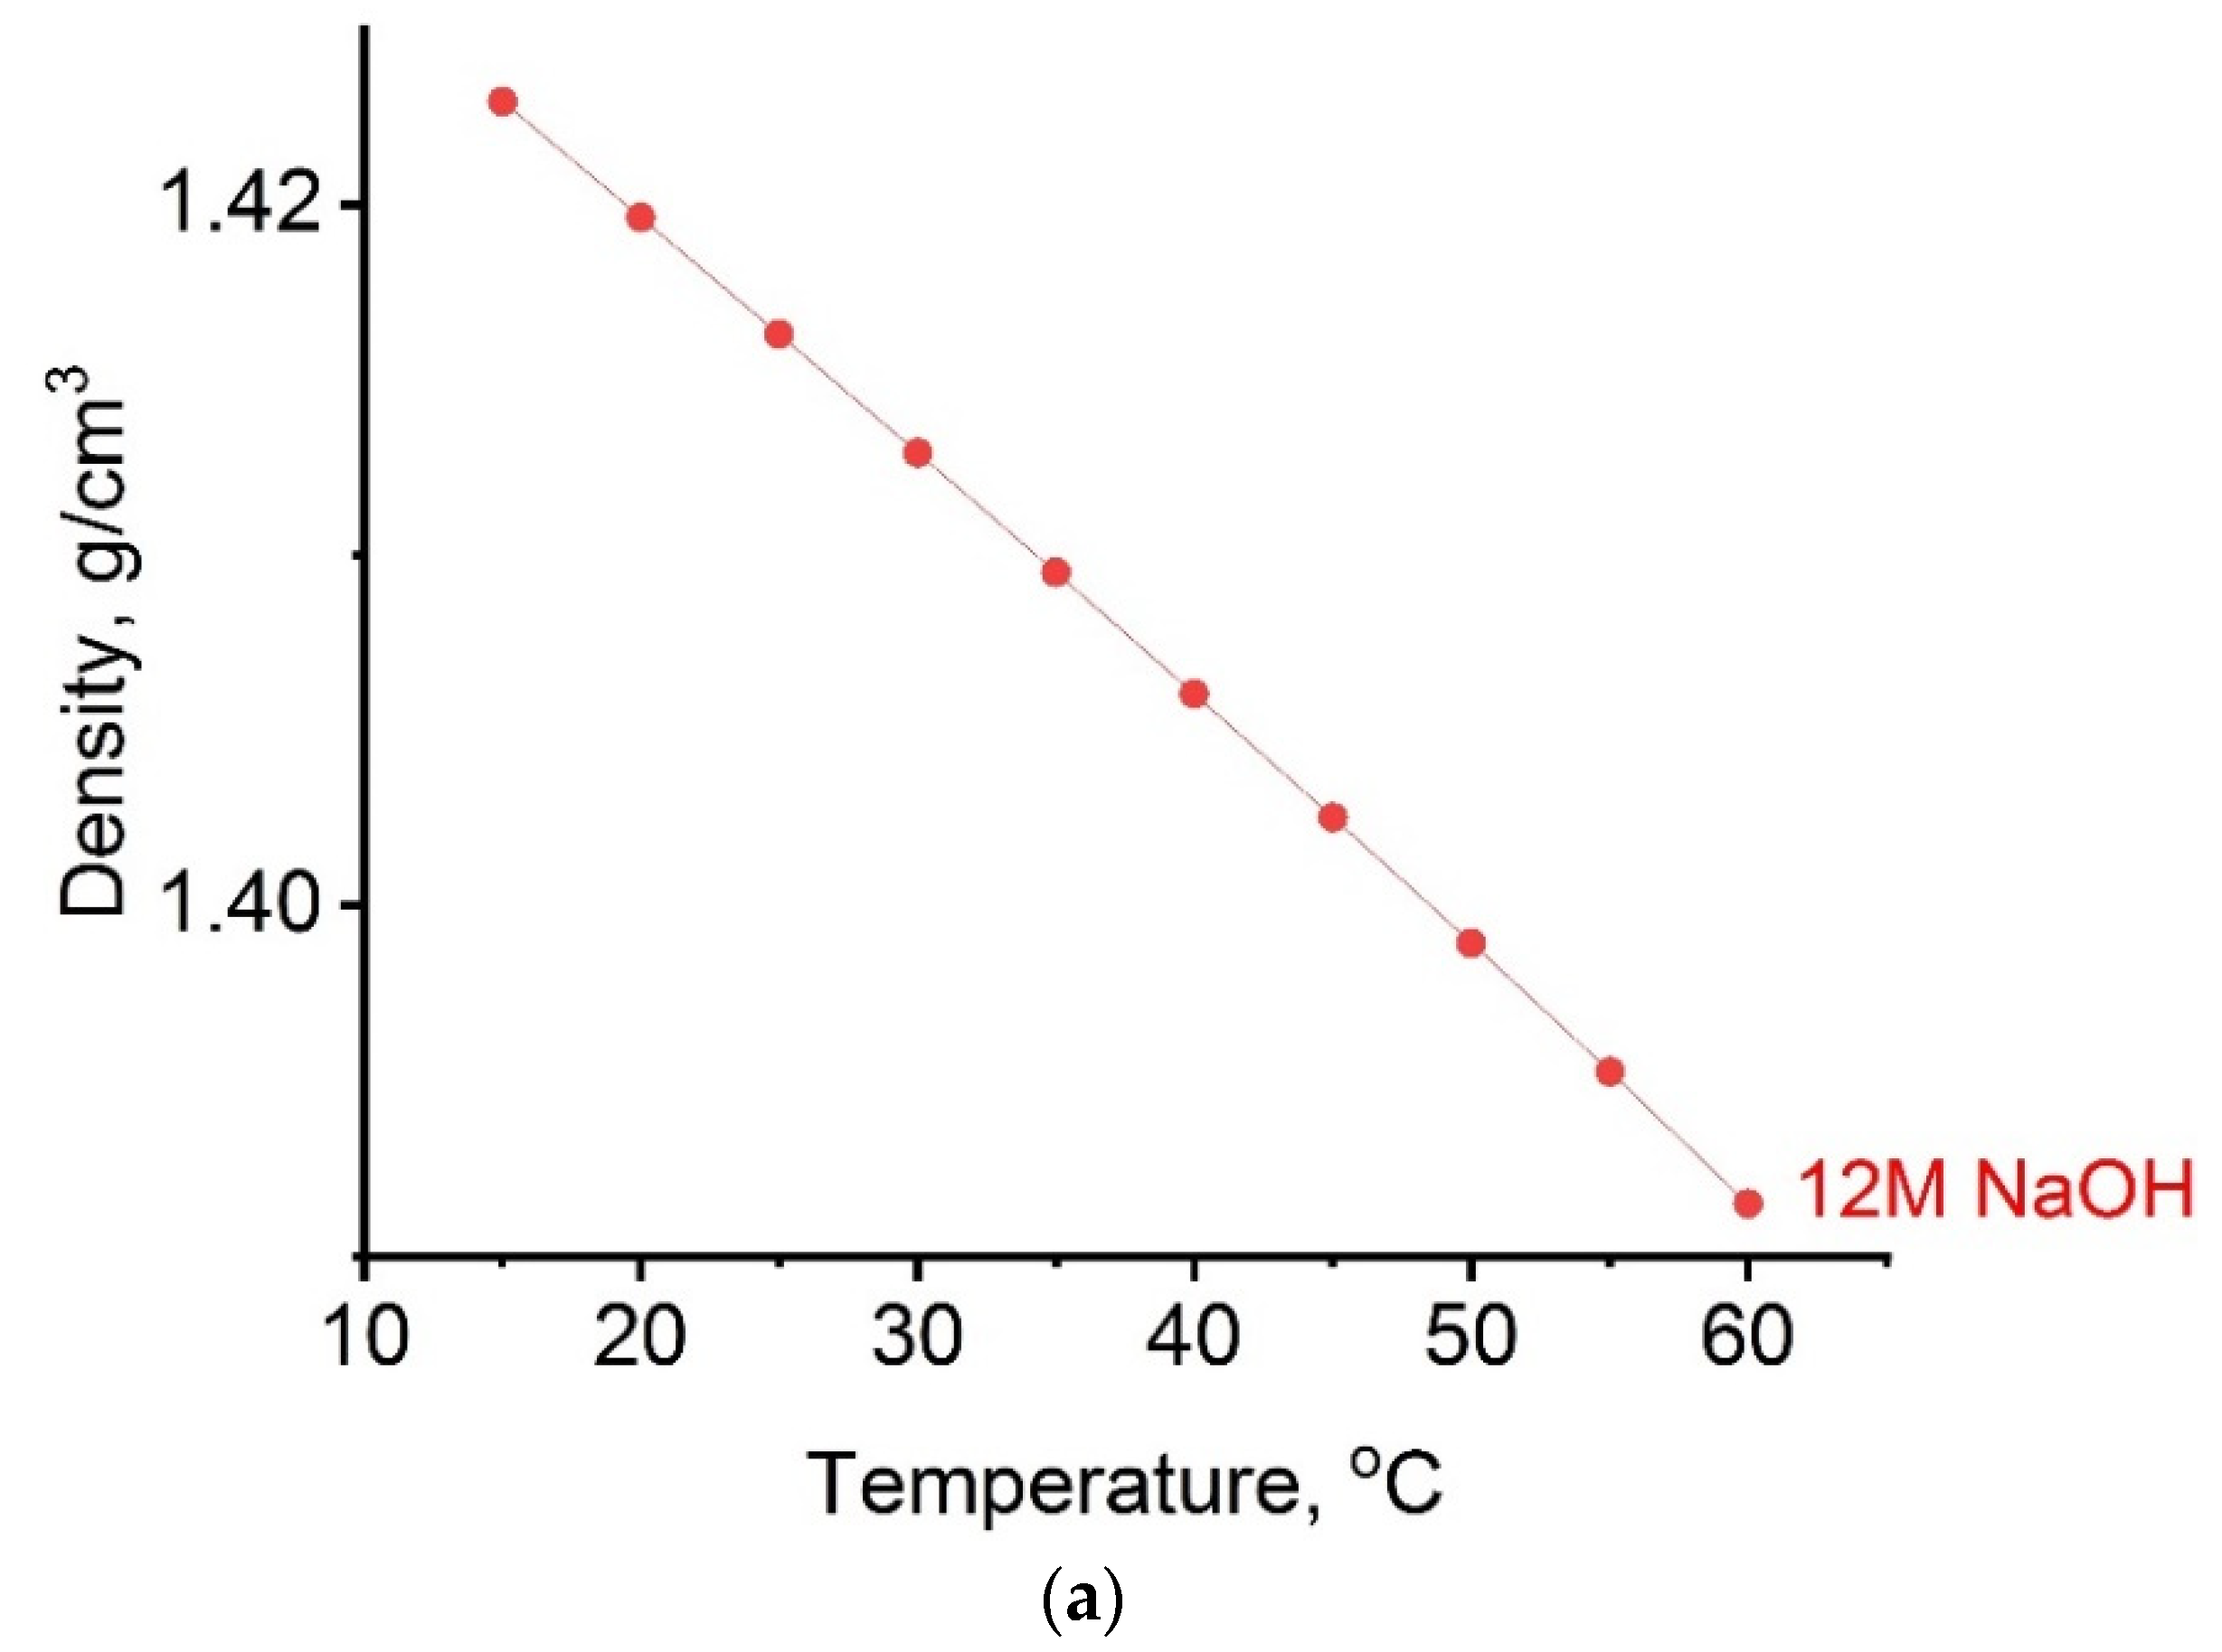
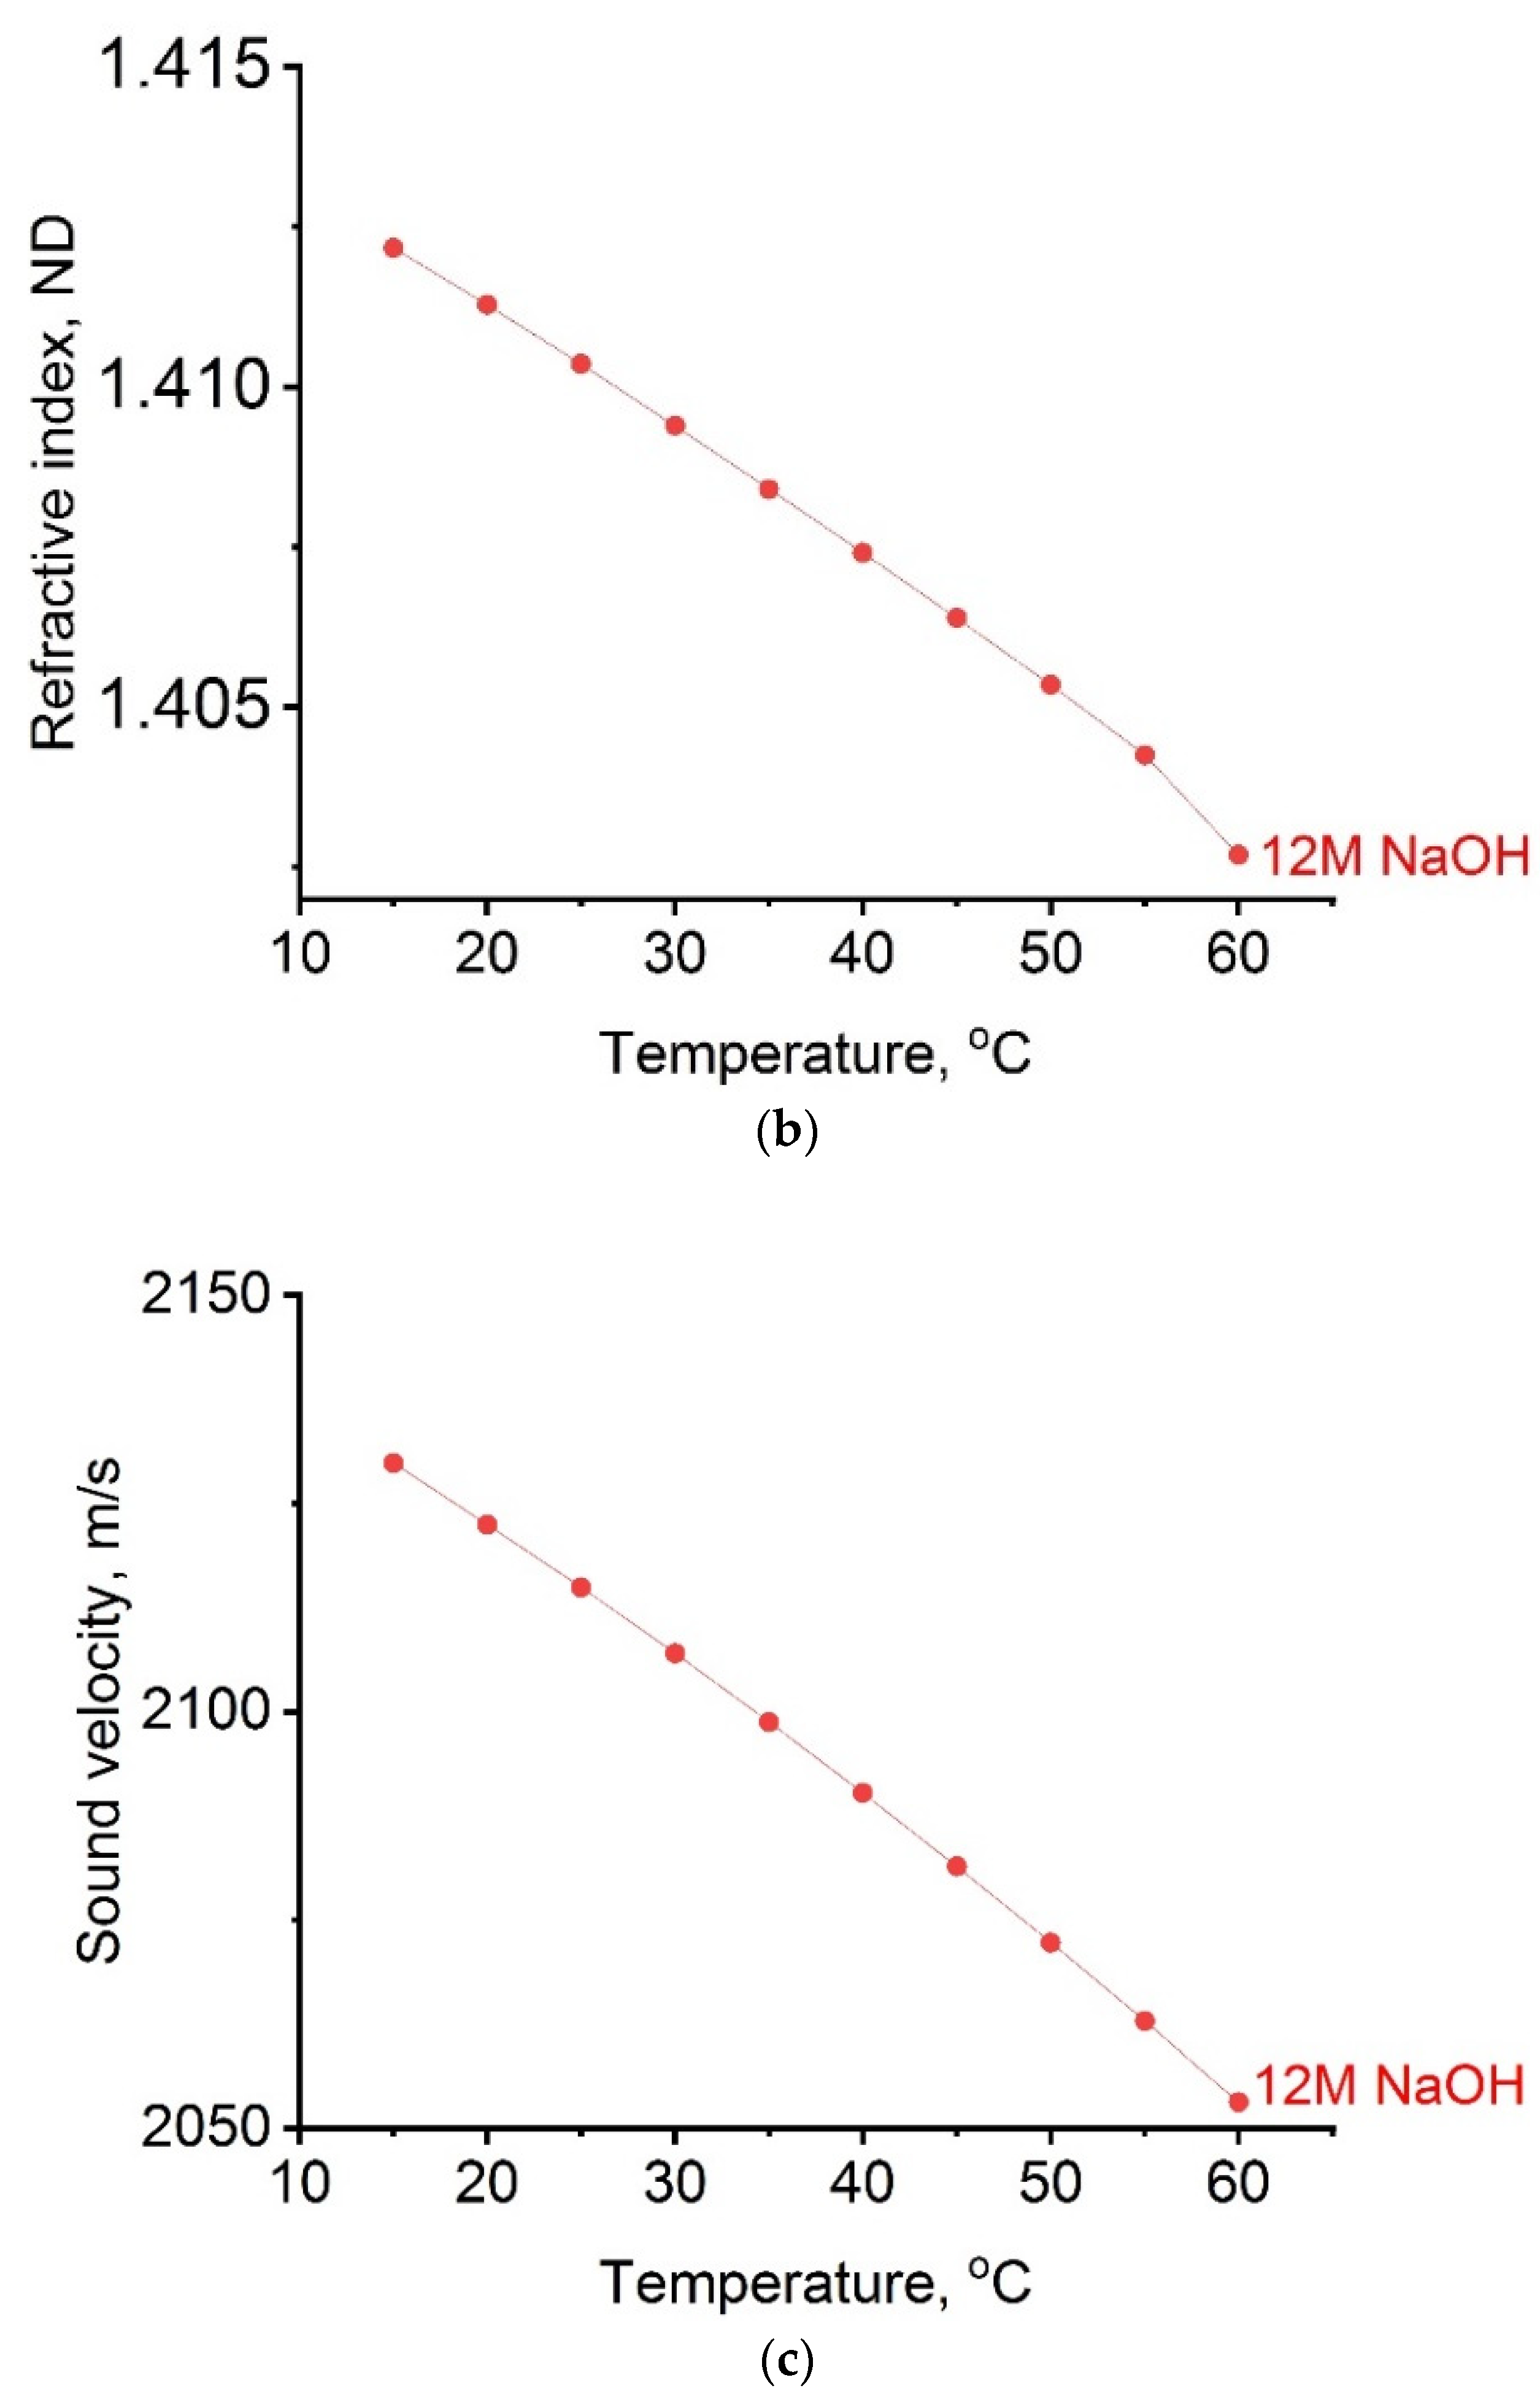
2.1. Thermodynamic Parameters of Alkaline Activator
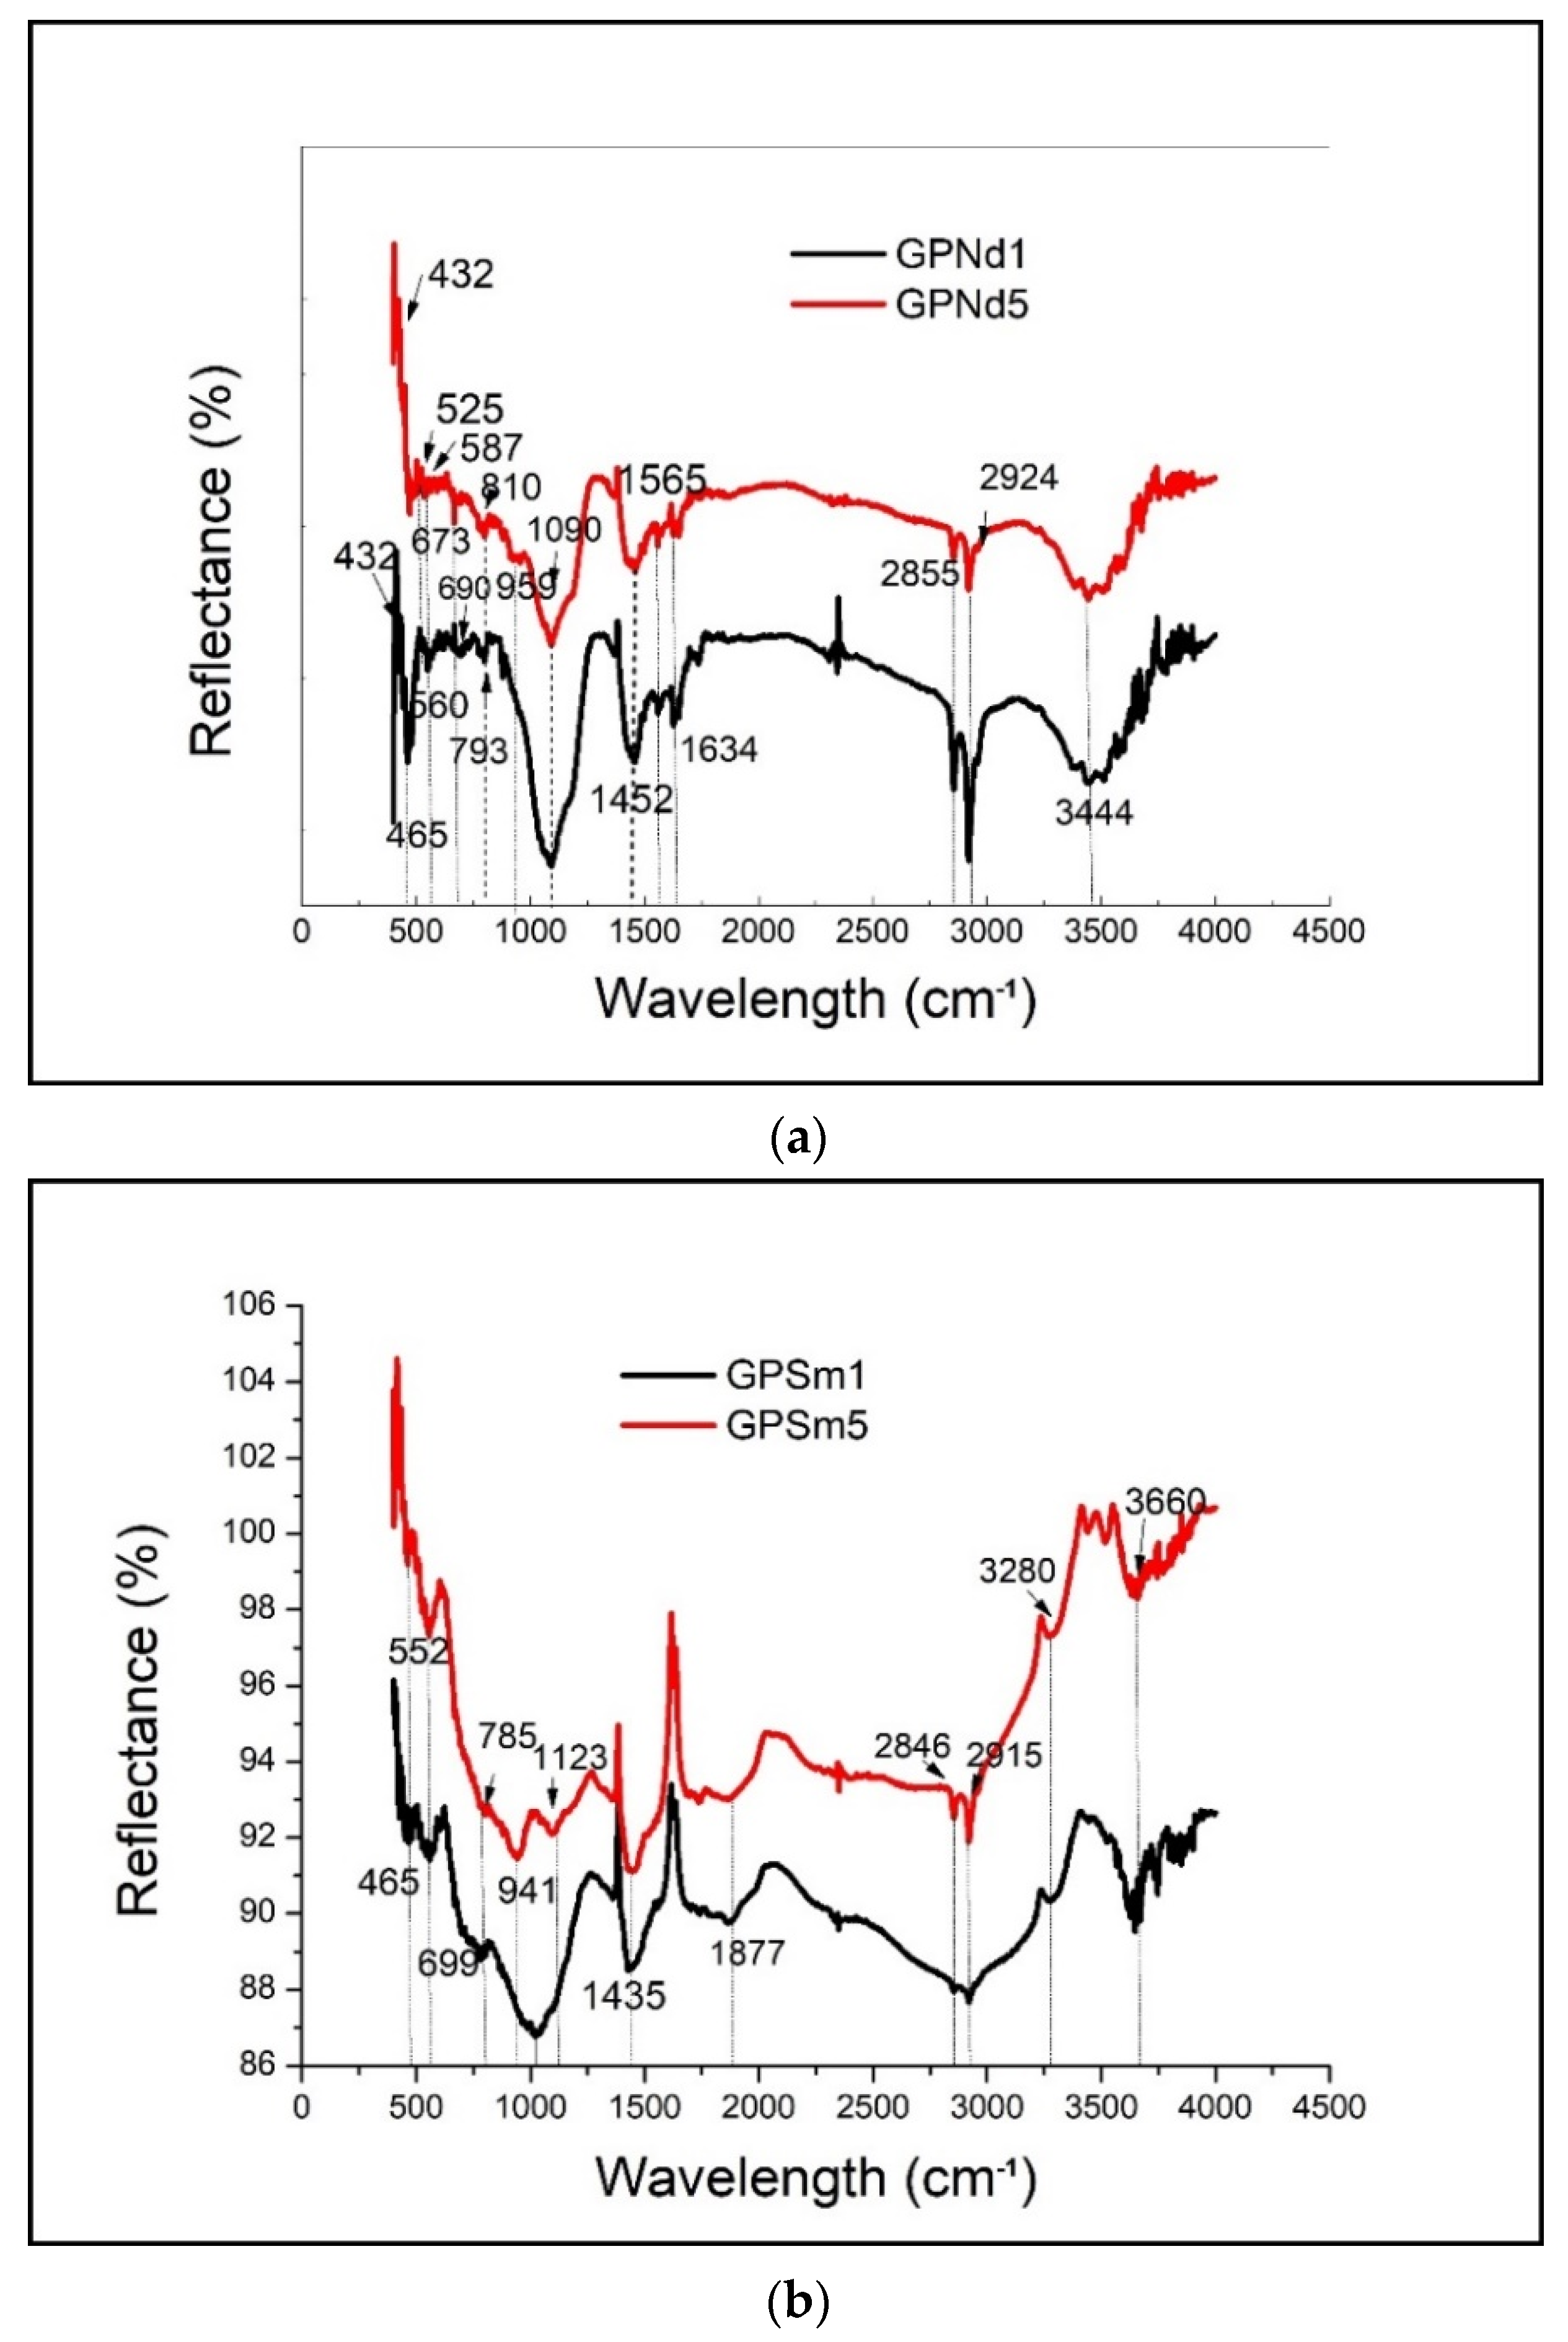
2.2. Structural Analysis
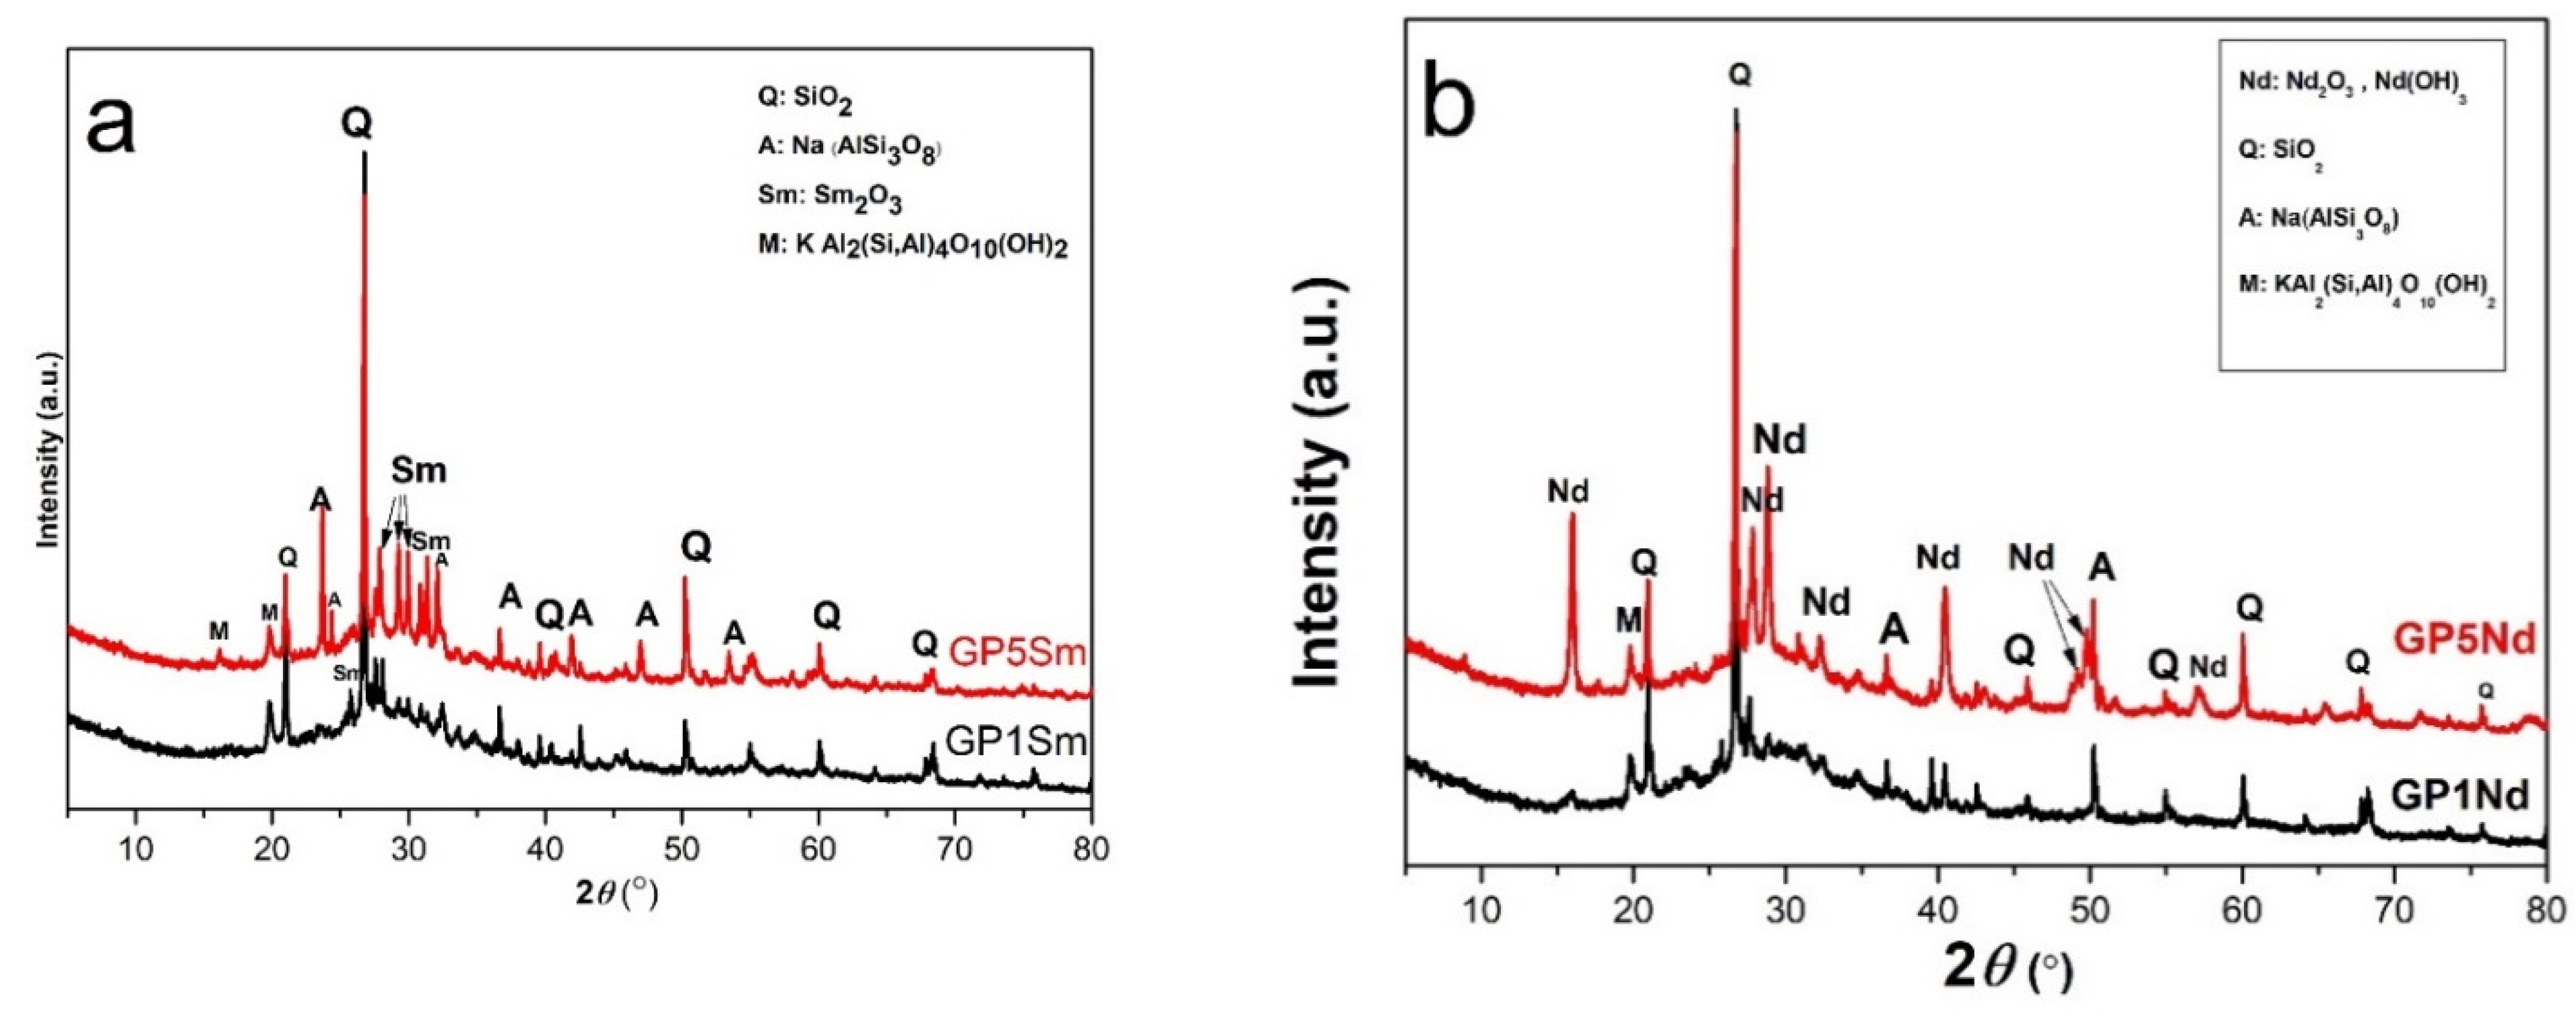
2.3. XRD Analysis
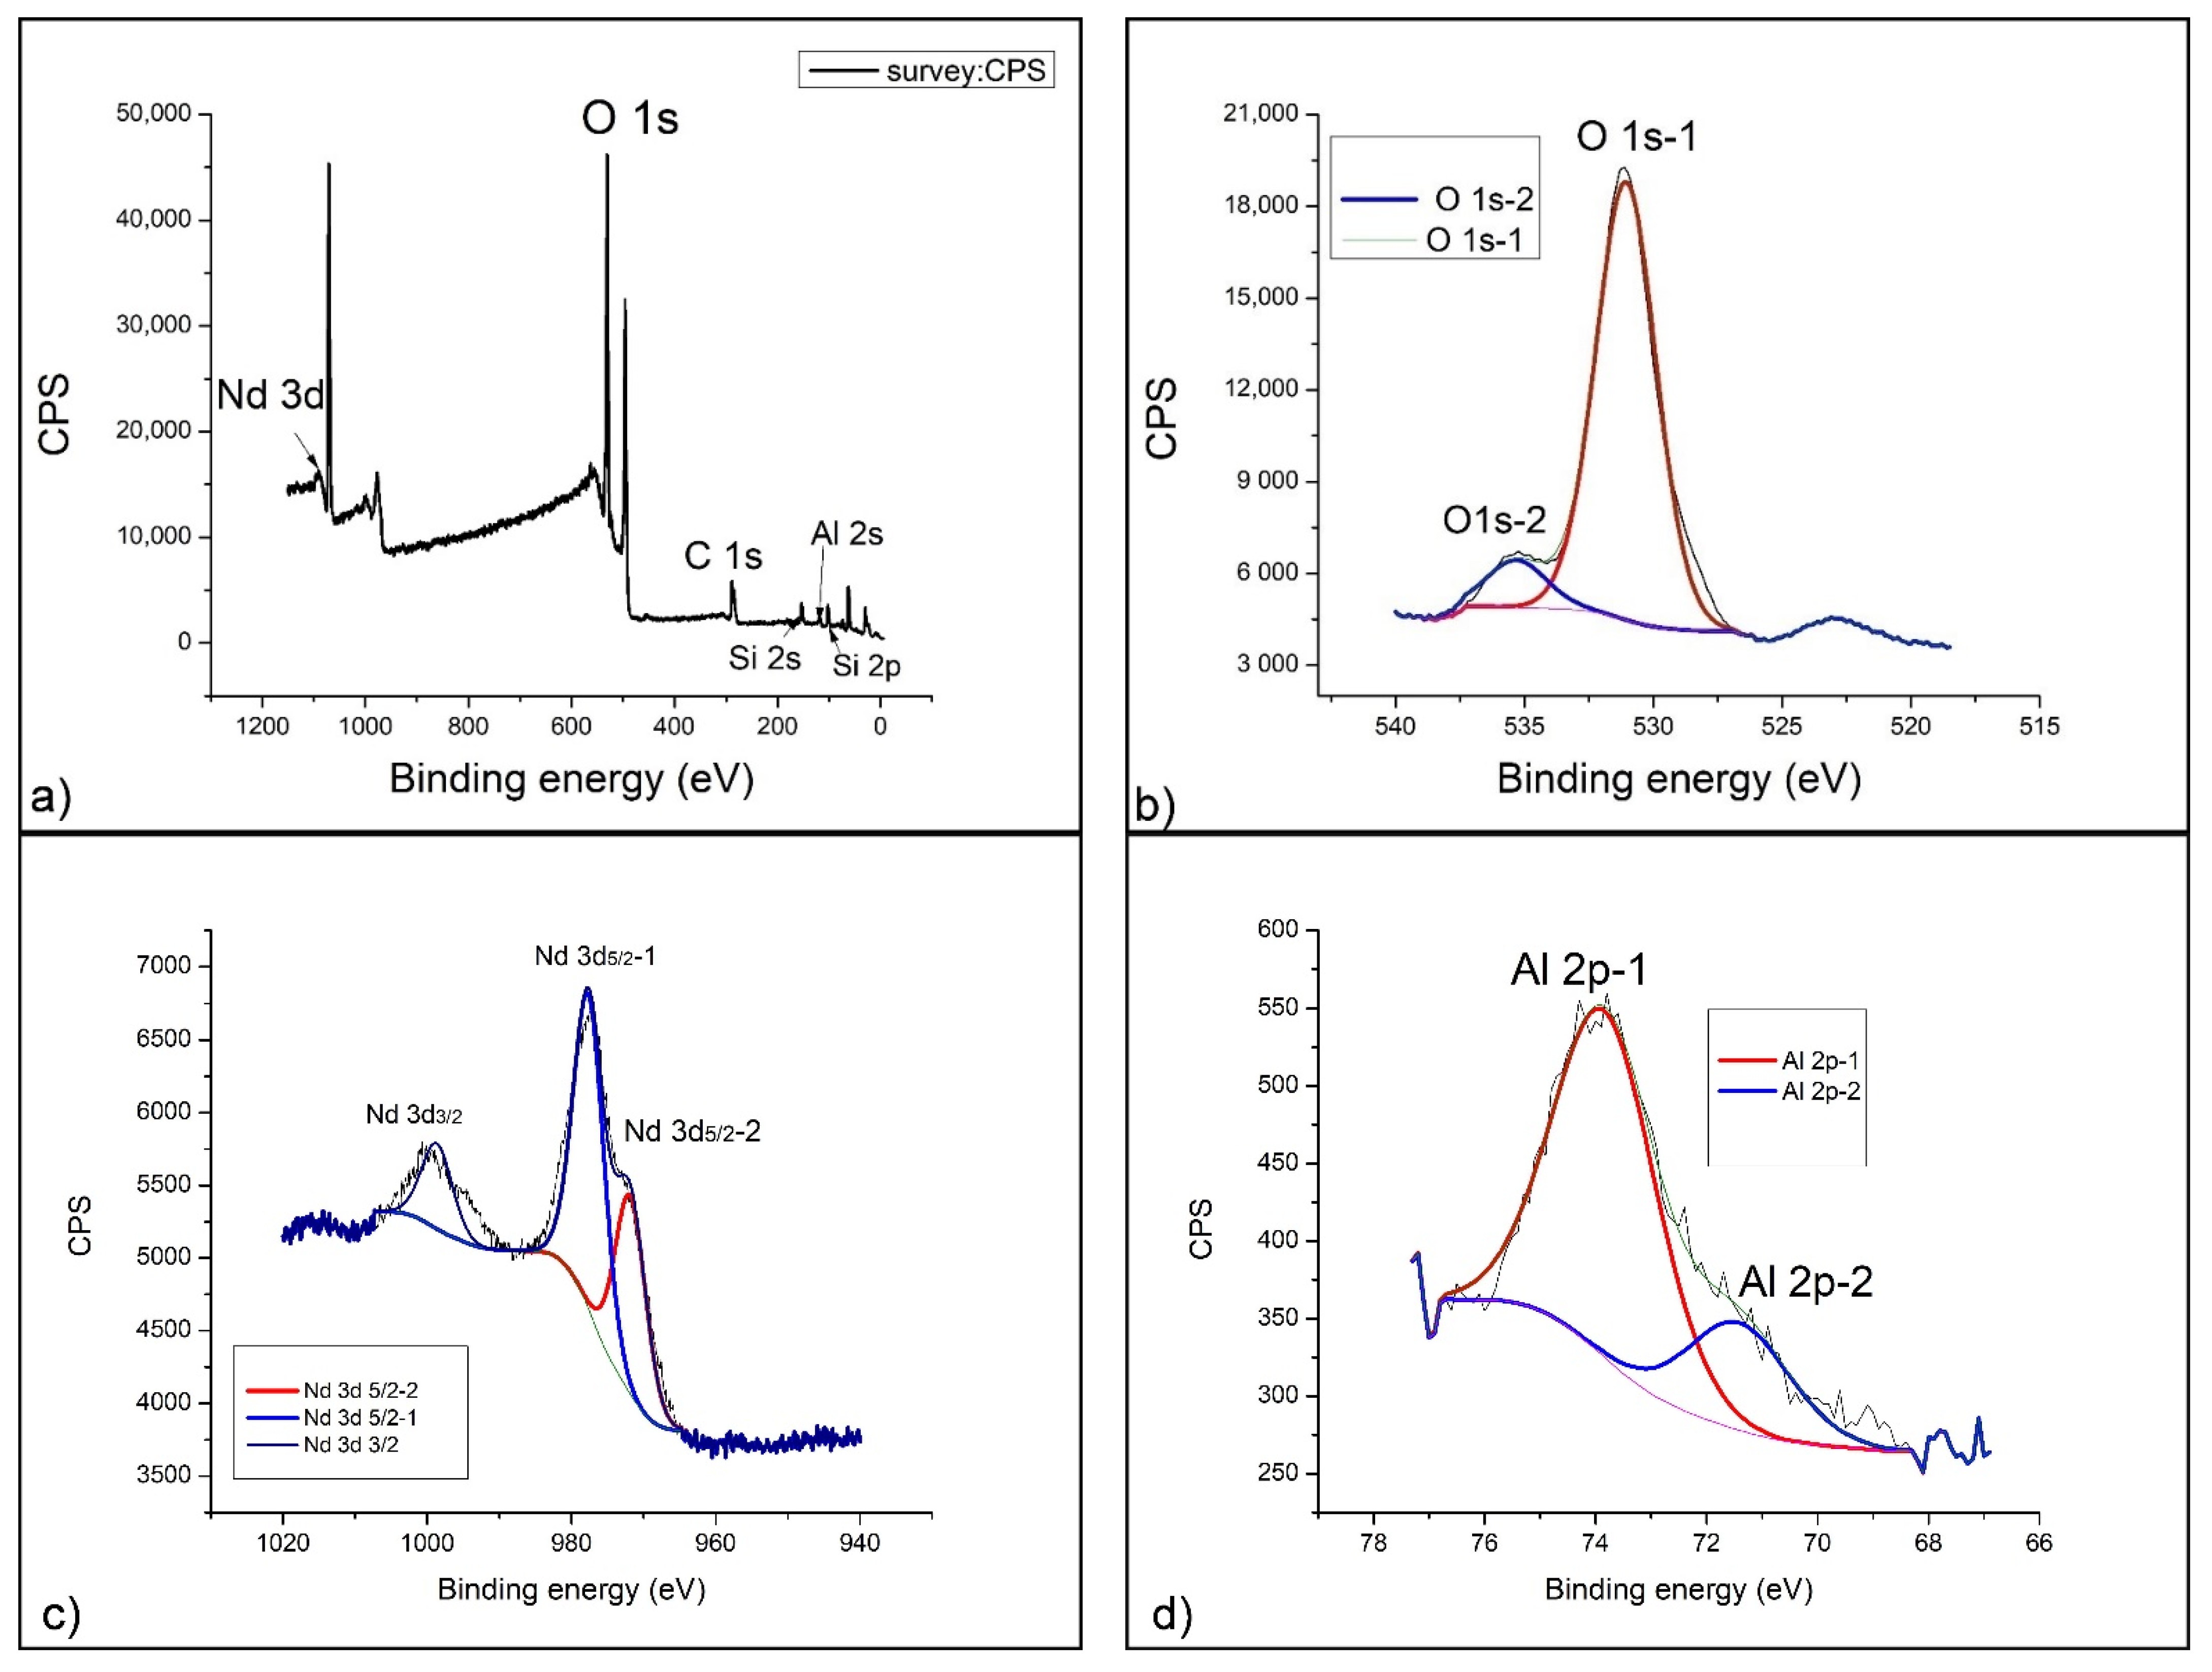
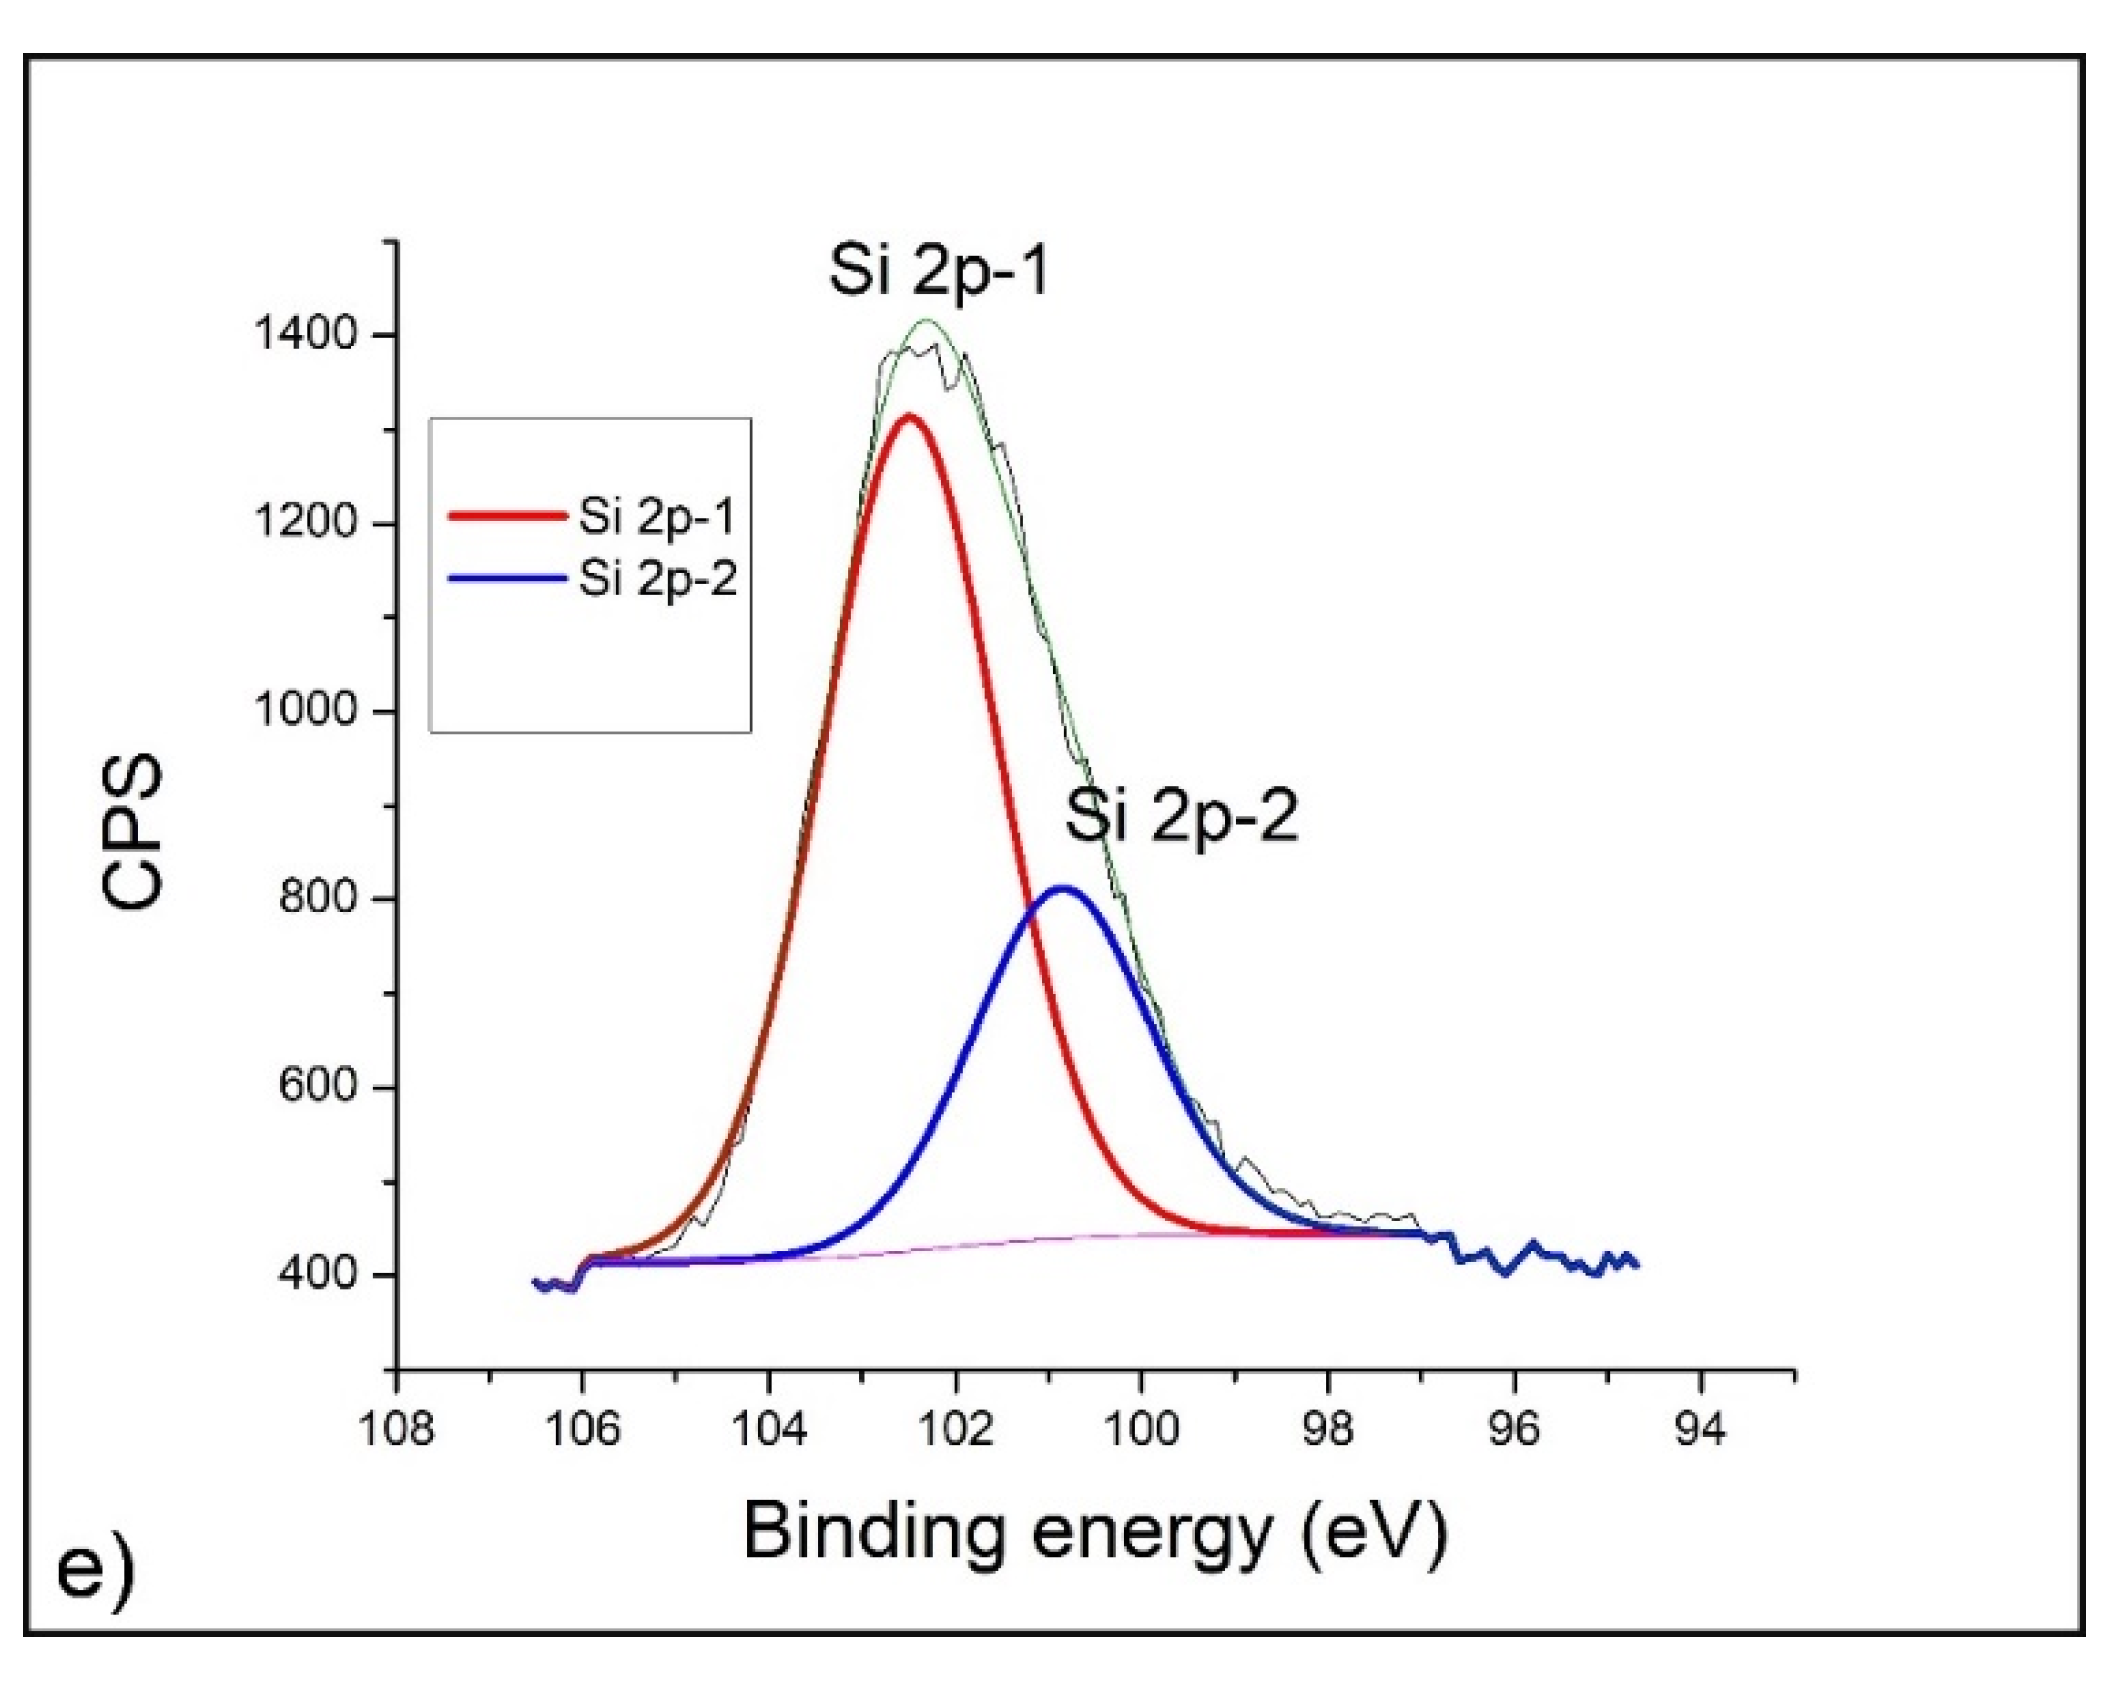
2.4. XPS Analysis
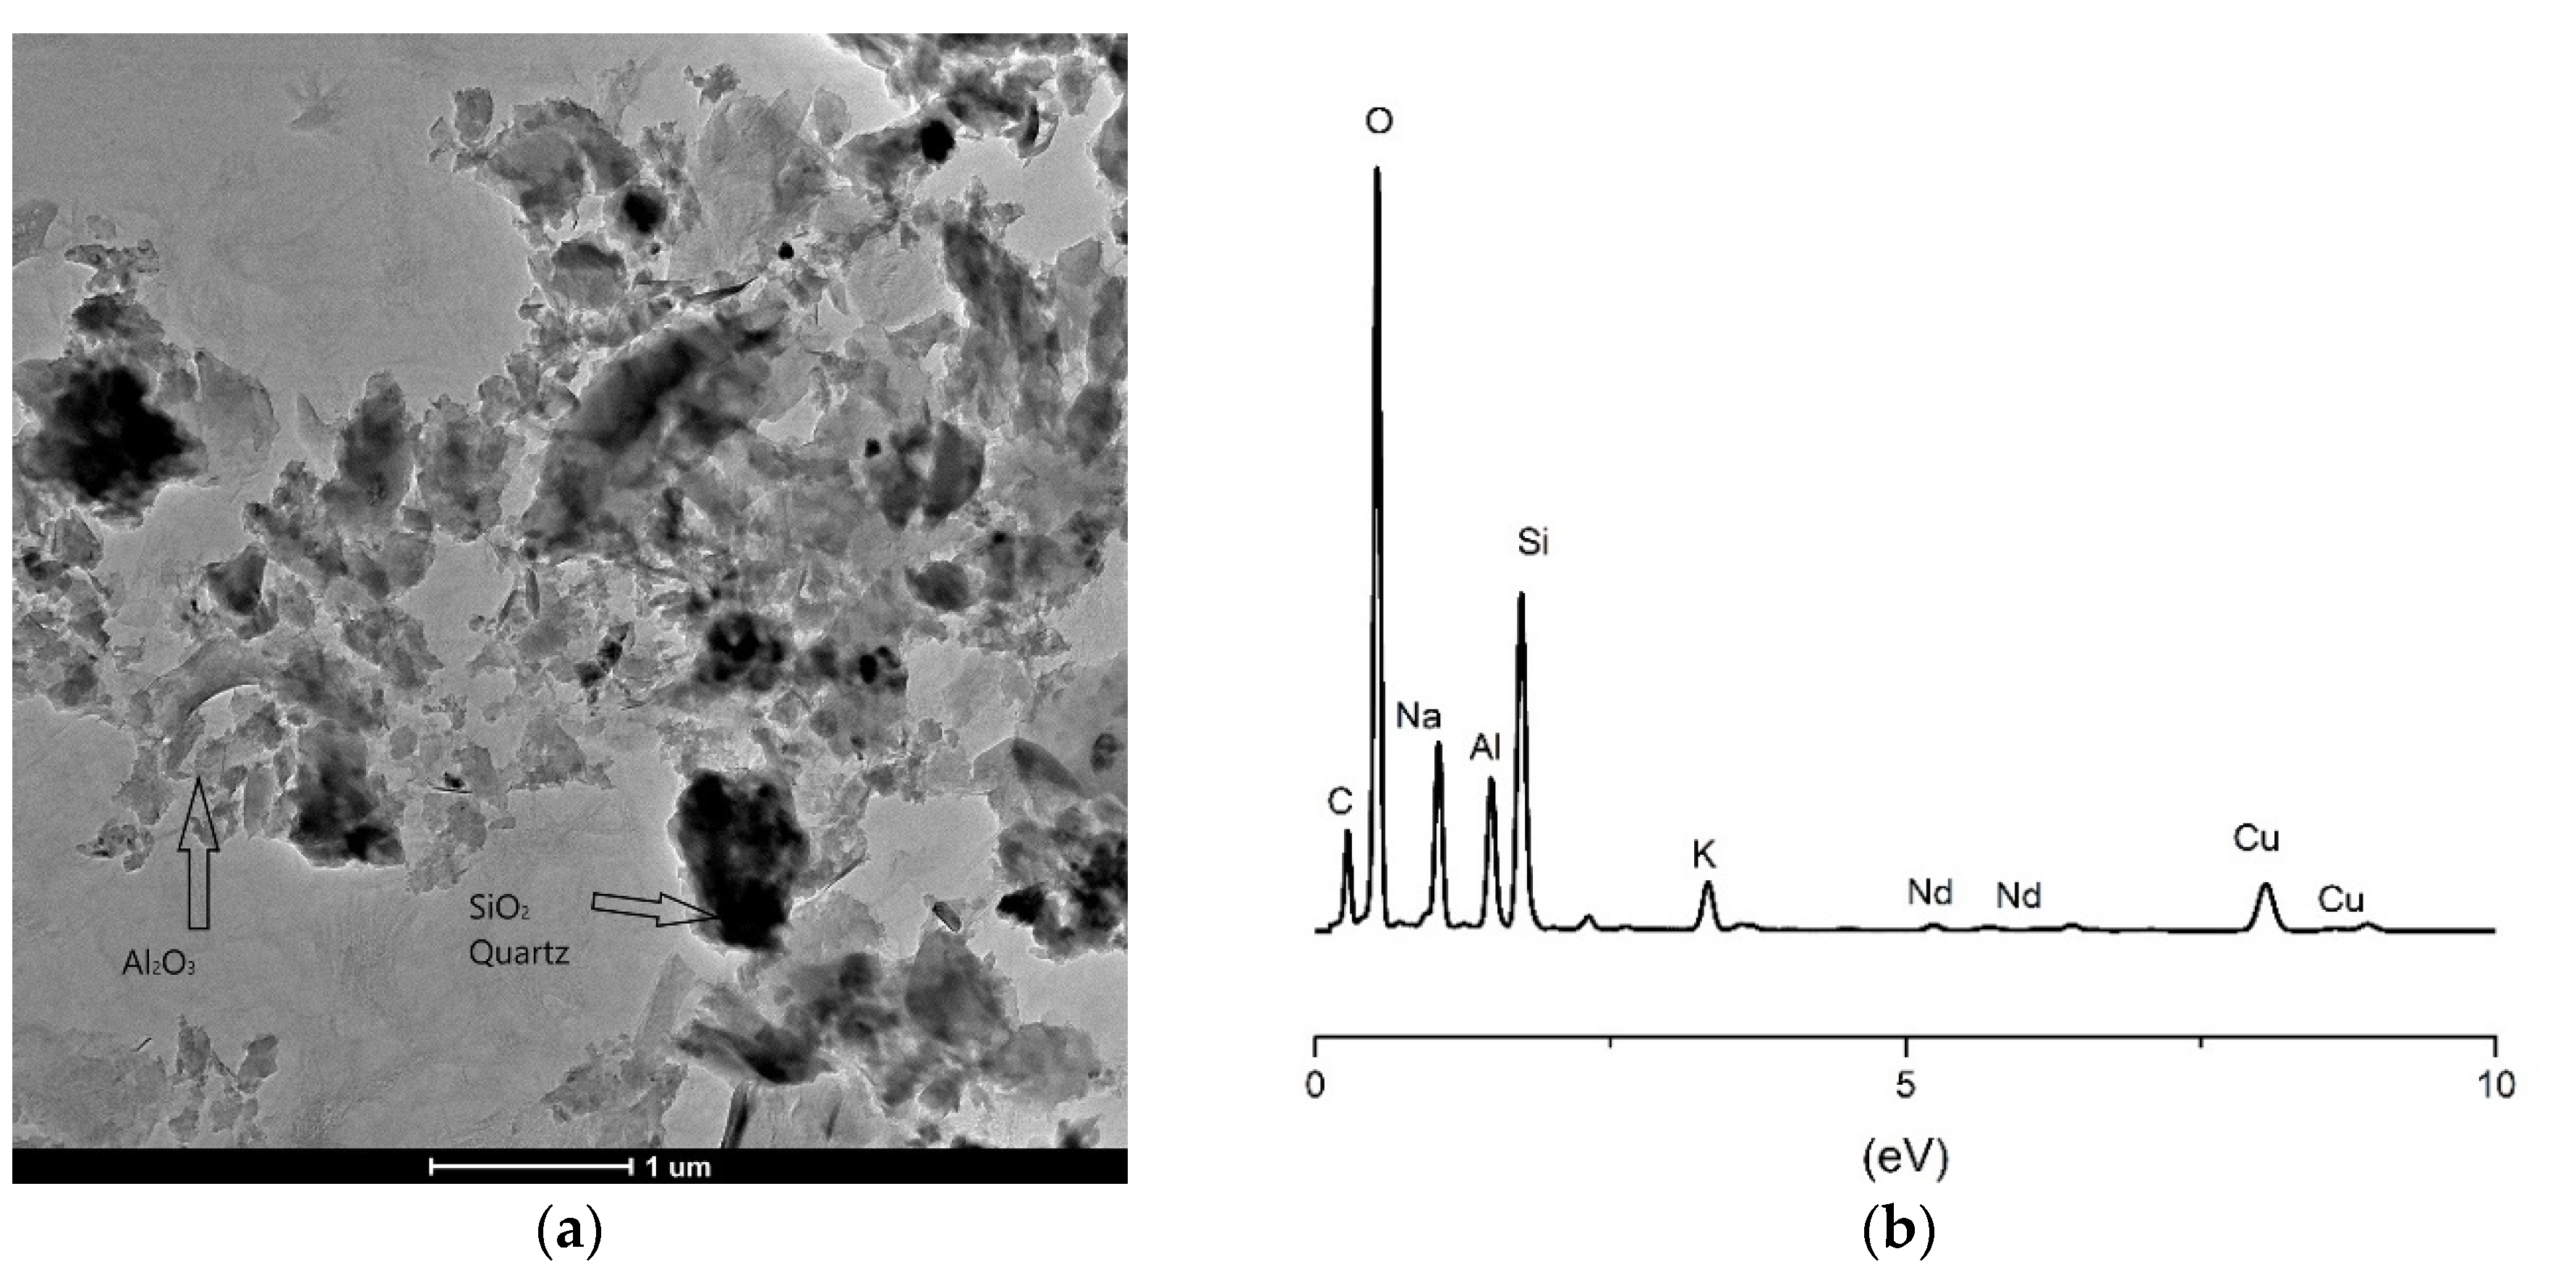
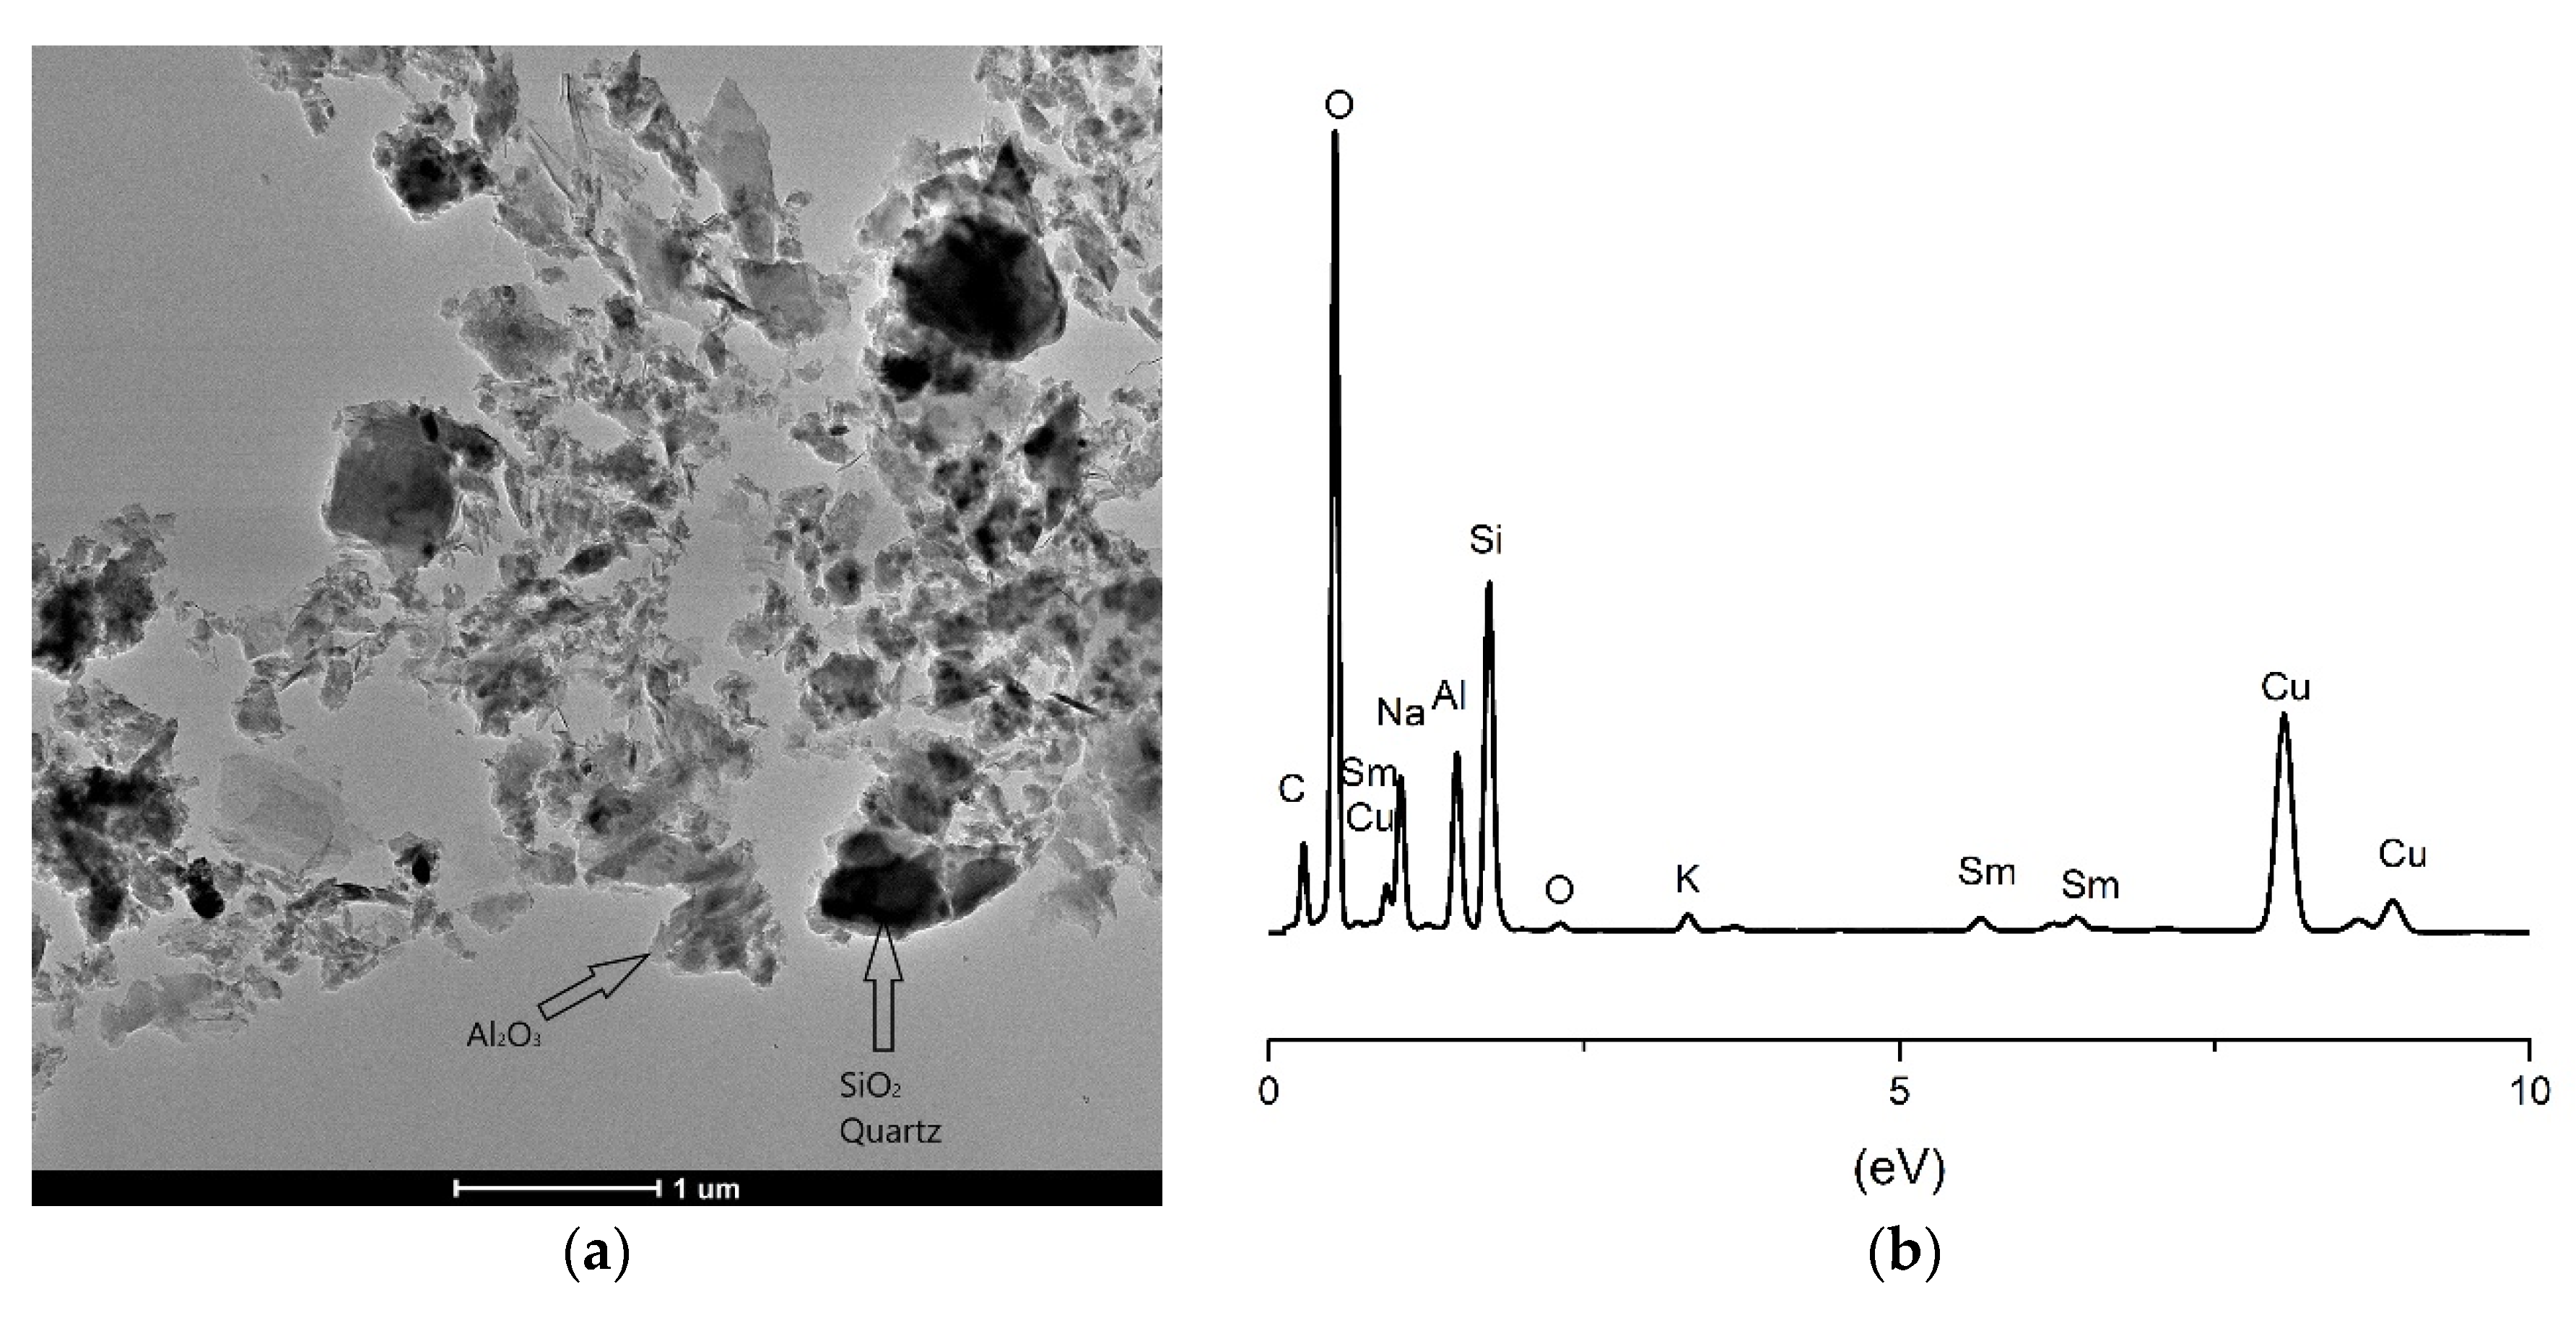
2.5. TEM Analysis
3. Conclusions
4. Materials and Methods
4.1. Materials
4.2. Methods and Characterization
- Thermodynamic parameters of activating solution were examined. Using the Anton Paar DSA 5000 M digital densitometer, the density as well as the speed of sound were measured. The range of density measurements on this device is from 0 to 3 × 10⁻³ kgm−3, and the speed of sound is from 1000 to 2000 m s−1. Experimental measurement of refractive index was performed on an automatic refractometer (model Anton Paar RXA 156), which operates at a wavelength of 589 nm. The device has a built-in thermostat with an accuracy of ±0.03 K by which the temperature of the samples is kept constant during the measurement. The measurement range of the refractive index is from 1.32 to 1.56. For all thermodynamics parameters, all measurements were performed in the temperature range from 288.15 K to 333.15 K.
- Diffuse reflectance infrared Fourier transform spectroscopy (DRIFTS) is a cheap, fast and nondestructive way of evaluating clay minerals and their products [25]. Drift spectra were obtained using the Perkin–Elmer FTIR spectrometer. Approximately 5% samples were dispersed in oven-dried spectroscopic grade KBr with the refractive index of 1.559 and particle size of 5–20 µm.
- XRD measurements were conducted at room temperature using Ultima IV Rigaku diffractometer, equipped with CuKα1,2 radiation, using a generator voltage (40.0 kV) and a generator current (40.0 mA). The range of 5–80° 2θ was used for all powders in a continuous scan mode with a scanning step size of 0.02° and at a scan rate of 5°/min using D/TeX Ultrahigh-speed detector. Samples were crushed in the in a porcelain mortar to the fineness of a fine powder. Si–monocrystalline sample carrier was used. The PDXL2 (Ver. 2.8.4.0) software was used to evaluate the phase identification and microstructure properties of material [62,63]. All obtained powders were identified using the ICDD data base [64]. For phase identification, selected PDF card numbers were used: Quartz (SiO2; 01-079-6237), Albite (Na(AlSi3O8); 01-084-0982), Muscovite (KAl2(Si,Al)4 O10(OH)2; 00-058-2036), Samarium Oxide (Sm2O3; 00-042-1464), Neodymium Hydroxide Nd (OH)3, 01-070-0214) and Neodymium oxide (Nd2O3, 00-006-0408).
- XPS analysis was performed using a SPECS instrument for detailed chemical composition characterization using X-ray-induced photoelectron spectroscopy. More detailed explanation can be found in Nenadovic et al., 2017 [31] and Ivanovic et al., 2020 [33]. Photoelectron emission was excited by monochromatic Al Kα line with photon energy of 1486.67 eV. Detailed spectra of the main photoelectron lines were taken in the fixed analyzer transmission mode with a pass energy of 20 eV (FAT 20), an energy step of 0.1 eV and a dwell time of 2 s. Charging compensation was performed using an electron flood gun and the constant current and voltage. The binding energy axis was adjusted according to the position of the carbon C 1s line. The survey spectra were performed according to the characteristic spectral line intensities. Specific atomic sensitivity factors for each analyzed element were used to eliminate the background lines, provided by the manufacturer. The photoelectron lines were fitted to peaks using appropriate software package.
- Characterization and investigation of the micronano samples structure was carried out by TEM, using a FEI Talos F200X microscope operating at 200 keV. A CCD camera with a resolution of 4096 × 4096 pixels was used for acquiring micrographs using the User Interface software package. The geopolymer samples were also further analyzed using scanning transmission (STEM) mode with energy dispersive spectrometry (EDS). The EDS detection system was used to determine the presence of doping species of Nd and Sm in geopolymer matrix. High-angle annular dark-field (HAADF) imaging was used in nanoprobe–TEM mode with a camera length of ~200 nm using the standard annular dark-field detector. The powder samples were prepared by standard rinsing and diluting in ethanol to a sufficient concentration to trap the geopolymer powder on the TEM grid, dried in air and then transferred to microscope.
Author Contributions
Funding
Institutional Review Board Statement
Informed Consent Statement
Data Availability Statement
Acknowledgments
Conflicts of Interest
References
- Song, H.; Wei, L.; Ji, Y.; Cao, L.; Cheng, F. Heavy metal fixing and heat resistance abilities of coal fly ash-waste glass based geopolymers by hydrothermal hot pressing. Adv. Powder Technol. 2018, 29, 1487–1492. [Google Scholar] [CrossRef]
- Siyal, A.A.; Shamsuddin, M.R.; Khan, M.I.; Rabat, N.E.; Zulfiqar, M.; Man, Z.; Siame, J.; Azizli, K.A. A review on geopolymers as emerging materials for the adsorption of heavy metals and dyes. J. Environ. Manag. 2018, 224, 327–339. [Google Scholar] [CrossRef]
- Fernández-Jiménez, A.; Palomo, A.; Macphee, D.E.; Lachowski, E.E. Fixing Arsenic in Alkali-Activated Cementitious Matrices. J. Am. Ceram. Soc. 2005, 88, 1122–1126. [Google Scholar] [CrossRef]
- Van Jaarsveld, J.G.S.; Van Deventer, J.S.J.; Schwartzman, A. The potential use of geopolymeric materials to immobilise toxic metals: Part II. Material and leaching characteristics. Miner. Eng. 1999, 12, 75–91. [Google Scholar] [CrossRef]
- Singh, N.B.; Middendorf, B. Geopolymers as an alternative to Portland cement: An overview. Constr. Build. Mater. 2020, 237, 117455. [Google Scholar] [CrossRef]
- Palomo, A.; López dela Fuente, J.I. Alkali-activated cementitous materials: Alternative matrices for the immobilisation of hazardous wastes: Part I. Stabilisation of boron. Cem. Concr. Res. 2003, 33, 281–288. [Google Scholar] [CrossRef]
- Bankowski, P.; Zou, L.; Hodges, R. Reduction of metal leaching in brown coal fly ash using geopolymers. J. Hazard. Mater. 2004, 114, 59–67. [Google Scholar] [CrossRef] [PubMed]
- Fernandez-Jimenez, A.; Macphee, D.E.; Lachowski, E.E.; Palomo, A. Immobilization of cesium in alkaline activated fly ash matrix. J. Nucl. Mater. 2005, 346, 185–193. [Google Scholar] [CrossRef]
- Mladenović, N.; Kljajević, L.; Nenadović, S.; Ivanović, M.; Čalija, B.; Gulicovski, J.; Trivunac, K. The Applications of New Inorganic Polymer for Adsorption Cadmium from Waste Water. J. Inorg. Organomet. Polym. Mater. 2020, 30, 554–563. [Google Scholar] [CrossRef]
- Yu, L.; Fang, L.; Zhang, P.; Zhao, S.; Jiao, B.; Li, D. The Utilization of Alkali-Activated Lead–Zinc Smelting Slag for Chromite Ore Processing Residue Solidification/Stabilization. Int. J. Environ. Res. Public Health 2021, 18, 9960. [Google Scholar] [CrossRef]
- Narasimharao, K.; Ali, T.T. Influence of synthesis conditions on physico-chemical and photocatalytic properties of rare earth (Ho, Nd and Sm) oxides. J. Mater. Res. Technol. 2020, 9, 1819–1830. [Google Scholar] [CrossRef]
- Trivunac, K.; Ljiljana, K.; Snežana, N.; Jelena, G.; Miljana, M.; Biljana, B.; Slavica, S. Microstructural characterization and adsorption properties of alkali-activated materials based on metakaolin. Sci. Sinter. 2016, 48, 209–220. [Google Scholar] [CrossRef]
- Volokh, A.A.; Gorbunov, A.V.; Gundorina, S.F.; Revich, B.A.; Frontasyeva, M.V.; Pal, C.S. Phosphorus fertilizer production as a source of rare-earth elements pollution of the environment. Sci. Total Environ. 1990, 95, 141–148. [Google Scholar] [CrossRef]
- Parnicka, P.; Mazierski, P.; Grzyb, T.; Lisowski, W.; Kowalska, E.; Ohtani, B.; Zaleska-Medynska, A.; Nadolna, J. Influence of the preparation method on the photocatalytic activity of Nd—Modified TiO2. Beilstein J. Nanotechnol. 2018, 9, 447–459. [Google Scholar] [CrossRef] [Green Version]
- Reszczyńska, J.; Grzyb, T.; Sobczak, J.W.; Lisowski, W.; Gazda, M.; Ohtani, B.; Zaleska, A. Visible light activity of rare earth metal doped (Er3+, Yb3+ or Er3+/Yb3+) titania photocatalysts. Appl. Catal. B Environ. 2015, 163, 40–49. [Google Scholar] [CrossRef]
- Bachvarova-Nedelcheva, A.; Yordanov, S.; Iordanova, R.; Stambolova, I.; Stoyanova, A.; Georgieva, N.; Nemska, V. The Influence of Nd and Sm on the Structure and Properties of Sol-Gel-Derived TiO2 Powders. Molecules 2021, 26, 3824. [Google Scholar] [CrossRef] [PubMed]
- Stengl, V.; Bakardjieva, S.; Murafa, N. Preparation and photocatalytic activity of rare earth-doped TiO2 nanoparticles. Mater. Chem. Phys. 2009, 114, 217–226. [Google Scholar] [CrossRef]
- Dinkar, A.V.; Shridhar, J.S.; Madhukar, E.N.; Anil, A.; Nitin, K. Sm-Doped TiO2 Nanoparticles with High Photocatalytic Activity For ARS Dye Under Visible Light Synthesized by Ultrasonic Assisted Sol-Gel Method. Orient. J. Chem. 2016, 32, 933–940. [Google Scholar] [CrossRef] [Green Version]
- Khade, G.V.; Suwarnkar, M.B.; Gavade, N.L.; Garadkar, K.M. Sol-gel microwave assisted synthesis of Sm-doped TiO2 nanoparticles and their photocatalytic activity for the degradation of Methyl Orange under sunlight. J. Mater. Sci. Mater. Electr. 2016, 27, 6425–6432. [Google Scholar] [CrossRef]
- Shehata, N.; Meehan, K. Potential applications of samarium as a dopant element. In Samarium: Chemical Properties, Occurrence and Potential Applications; Kaitlyn, R., Ed.; Danford Nova Publisher: New York, NY, USA, 2014; pp. 111–136. [Google Scholar]
- Kirdsiri, K.; Rajaramakrishnab, R.; Damdeea, B.; Kimc, H.J.; Kimc, H.J.; Horphathumd, M.; Kaewkhao, J. Influence of alkaline earth oxides on Eu3+ doped lithium borate glasses for photonic, laser and radiation detection material applications. Solid State Sci. 2019, 89, 57–66. [Google Scholar] [CrossRef]
- Gaafara, M.S.; Marzouk, S.Y.; Mahmouda, I.S.; Henda, M.B.; Afifi, M.; Ahmed, M.; El-Aziz, A.M.A.; Alhabradi, M. Role of Neodymium on Some Acoustic and PhysicalProperties of Bi2O3- B2O3- SrO Glasses. J. Mater. Res. 2020, 9, 7252–7261. [Google Scholar]
- Thomas, P.J.; Carpenter, D.; Boutin, C.; Allison, J.E. Rare earth elements (REEs): Effects on germination and growth of selected crop and native plant species. Chemosphere 2014, 96, 57–66. [Google Scholar] [CrossRef] [Green Version]
- Yang, Q.; Wang, L.; Zhou, Q.; Huang, X. Toxic effects of heavy metal terbium ion on the composition and functions of cell membrane in horseradish roots. Ecotoxicol. Environ. Saf. 2015, 111, 48–58. [Google Scholar] [CrossRef] [PubMed]
- Sneller, F.E.C.; Kalf, D.F.; Weltje, L.; Van Wezel, A.P. Maximum Permissible Concentrations and Negligible Concentrations for Rare Earth Elements (REEs))., RIVM Report 601501 011; National Institute of Public Health and the Environment: Amsterdam, The Netherlands, 2000; p. 44. [Google Scholar]
- Slooff, W.; Bont, P.F.H.; van den Hoop, M.A.G.T.; Janus, A.; Annema, J.A. Exploratory Report: Rare Earth Metals and Their Compounds; National Institute of Public Health and Environmental Protection: Bilthoven, The Netherlands, 1993. [Google Scholar]
- Pickard, B.G. Comparison of Calcium and Lanthanon Ions in the Avena-Coleoptile Growth Test. Planta 1970, 91, 314–320. [Google Scholar] [CrossRef]
- Hu, Z.; Richter, H.; Sparovek, G.; Schnug, E. Physiological and Biochemical Effects of Rare Earth Elements on Plants and Their Agricultural Significance: A Review. J. Plant Nutr. 2004, 27, 183–220. [Google Scholar] [CrossRef]
- Xiaoqing, L.; Hao, H.; Chao, L.; Min, Z.; Fashui, H. Physico-chemical property of rare earths-effects on the energy regulation of photosystem II in Arabidopsis thaliana. Biol. Trace Elem. Res. 2009, 130, 141–151. [Google Scholar] [CrossRef]
- Ivanović, M.; Nenadović, S.; Pavlović, V.P.; Radović, I.; Kijevčanin, M.; Pavlović, V.B.; Kljajević, L. The influence of thermodynamic parameters on alkaline activators of geopolymers and the structure of geopolymers. Maced. J. Chem. Chem. Eng. 2021, 40, 107–117. [Google Scholar] [CrossRef]
- Nenadović, S.S.; Kljajević, L.M.; Nešić, M.A.; Petković, M.Z.; Trivunac, K.V.; Pavlović, V.B. Structure analysis of geopolymers synthesized from clay originated from Serbia. Environ. Earth Sci. 2017, 76, 79. [Google Scholar] [CrossRef]
- Kljajević, L.M.; Nenadović, S.S.; Nenadović, M.T.; Bundaleski, N.K.; Todorović, B.Ž.; Pavlović, V.B.; Rakočević, Z.L. Structural and chemical properties of thermally treated geopolymer samples. Ceram. Int. 2017, 43, 6700–6708. [Google Scholar] [CrossRef]
- Ivanović, M.; Ljiljana, K.; Jelena, G.; Marijana, P.; Ivona, J.-C.; Dušan, B.; Snežana, N. The Effect of the Concentration of Alkaline Activator and Aging Time on the Structure of Metakaolin Based Geopolymer. Sci. Sinter. 2020, 52, 219–229. [Google Scholar] [CrossRef]
- Hajimohammadi, H.; Provis, J.L.; van Deventer, J.S.J. The effect of silica availability on the mechanism of geopolymerisation. Cem. Concr. Res. 2011, 41, 210–216. [Google Scholar] [CrossRef]
- Provis, J.L.; Bernal, S.A. Geopolymers and Related Alkali-Activated Materials. Annu. Rev. Mater. Res. 2014, 44, 299–327. [Google Scholar] [CrossRef]
- Perumal, P.; Kiventerä, J.; Illikainen, M. Influence of alkali source on properties of alkali activated silicate tailings. Mater. Chem. Phys. 2021, 271, 124932. [Google Scholar] [CrossRef]
- Nenadovic, M.; Ferone, C.; Kljajević, L.; Miljana, M.; Todorović, B.; Vukanac, I.; Nenadović, S. Alkali Activation of Different type of ash as a production of combustion proces. Nucl. Technol. Radiat. Prot. 2021, 36, 66–73. [Google Scholar] [CrossRef]
- Kljajević, L.M.; Melichová, Z.; Kisić, D.; Nenadović, M.; Todorović, B.Ž.; Pavlović, V.B.; Nenadović, S. The influence of alumino-silicate matrix composition on surface hydrophobic properties. Sci. Sinter. 2019, 51, 163–173. [Google Scholar] [CrossRef] [Green Version]
- Lee, W.K.W.; van Deventer, J.S.J. Use of Infrared Spectroscopy to Study Geopolymerization of Heterogeneous Amorphous Aluminosilicates. Langmuir 2003, 19, 8726–8734. [Google Scholar] [CrossRef]
- Rees, C.A.; Provis, J.L.; Lukey, G.C.; van Deventer, J.S.J. Attenuated Total Reflectance Fourier Transform Infrared Analysis of Fly Ash Geopolymer Gel Aging. Langmuir 2007, 23, 8170–8179. [Google Scholar] [CrossRef]
- Nenadovic, S.; Kljajević, L.; Marković, S.; Omerašević, M.; Jovanovic, U.; Andric, V.; Vukanac, I. Natural diatomite (Rudovci, Seria) as adsorbent for removal Cs from radioactivite waste liquids. Sci. Sinter. 2015, 47, 299–309. [Google Scholar] [CrossRef]
- Nenadović, S.; Nenadović, M.; Vukanac, I.; Đorđević, A.; Dragićević, S.; Lješević, M. Vertical distribution of 137Cs in cultivated and undisturbed areas. Nucl. Technol. Radiat. Prot. 2010, 25, 30–36. [Google Scholar] [CrossRef]
- Zhao, Y.; Kang, S.; Qin, L.; Wang, W.; Zhang, T.; Song, S.; Komarneni, S. Self-assembled gels of Fe-chitosan/montmorillonite nanosheets: Dye degradation by the synergistic effect of adsorption and photo-Fenton reaction. Chem. Eng. J. 2020, 379. [Google Scholar] [CrossRef]
- Gulicovski, J.; Nenadovic, S.; Kljajevic, L.; Mirkovic, M.; Nisavic, M.; Kragovic, M.; Stojmenovic, M. Geopolymer/CeO2 as solid electrolity for IT-SOFC. Polymers 2020, 12, 248. [Google Scholar] [CrossRef] [Green Version]
- Wang, W.; Zhao, Y.; Bai, H.; Zhang, T.; Ibarra-Galvan, V.; Song, S. Methylene blue removal from water using the hydrogel beads of poly(vinyl alcohol)-sodium alginate-chitosan-montmorillonite. Carbohydr. Polym. 2018, 198, 518–528. [Google Scholar] [CrossRef]
- Peyne, J.; Gautron, J.; Doudeau, J.; Joussein, E.; Rossignol, S. Influence of calcium addition on calcined brick clay based geopolymers: A thermal and FTIR spectroscopy study. Constr. Build. Mater. 2017, 152, 794–803. [Google Scholar] [CrossRef]
- Zhang, T.; Zhao, Y.; Kang, S.; Li, Y.; Zhang, Q. Formation of active Fe(OH)3 in situ for enhancing arsenic removal from water by the oxidation of Fe (II)in air with the presence of CaCO3. J. Clean. Prod. 2019, 227, 1–9. [Google Scholar] [CrossRef]
- Hu, H.; Zhang, Q. Mechanochemical Preparation of Mineral Based Adsorbent and Its Effective Purification Ability for Wastewater. KONA Powder Part. J. 2021, 38, 155–167. [Google Scholar] [CrossRef]
- Yuvakkumar, R.; Hong, S.I. Nd2O3: Novel synthesis and characterization. J. Sol-Gel Sci. Technol. 2015, 73, 511–517. [Google Scholar] [CrossRef]
- Suzuki, S.; Saito, H.; Yubuta, K.; Oishi, S.; Teshima, K. Growth of Millimeter-sized Platy Single Crystals of NaTaO3 from Na2MoO4 Flux. Cryst. Growth Des. 2019, 19, 3607–3611. [Google Scholar] [CrossRef]
- Hu, S.; Zhong, L.; Yang, X.; Bai, H.; Ren, B.; Zhao, Y.; Zhang, W.; Ju, X.; Wen, H.; Mao, S.; et al. Synthesis of rare earth tailing-based geopolymer for efficiently immobilizing heavy metals. Constr. Build. Mater. 2020, 254, 119273. [Google Scholar] [CrossRef]
- Deepa, A.V.; Priya, M.; Suresh, S.R. Influence of Samarium Oxide ions on structural and optical properties of borate glasses. Sci. Res. Essays 2016, 11, 57–63. [Google Scholar] [CrossRef] [Green Version]
- Sarma, D.D.; Rao, C.N.R. XPES studies of oxides of second- and third-row transition metals including rare earths. J. Electron Spectrosc. Relat. Phenom. 1980, 20, 25–45. [Google Scholar] [CrossRef]
- Turner, N.H.; Single, A.M. Determination of peak positions and areas from wide-scan XPS spectra. Surf. Interface Anal. 1990, 15, 215–222. [Google Scholar] [CrossRef]
- Aarnink, W.A.M.; Weishaupt, A.; van Silfhout, A. Angle-resolved X-ray photoelectron spectroscopy (ARXPS) and a modified Levenberg-Marquardt fit procedure: A new combination for modeling thin layers. Appl. Surf. Sci. 1990, 45, 37–48. [Google Scholar] [CrossRef] [Green Version]
- Uwamino, Y.; Ishizuka, T.; Yamatera, H. X-ray photoelectron spectroscopy of rare-earth compounds. J. Electron Spectrosc. Relat. Phenom. 1984, 34, 67–78. [Google Scholar] [CrossRef]
- Simonsen, M.E.; Sondebry, C.; Li., Z.; Sogard, E.G. XPS and FT-IR investigation of silicate polymers. J. Mater. 2009, 44, 2079–2088. [Google Scholar] [CrossRef] [Green Version]
- Jhang, J.H.; Boscoboinik, J.A.; Altman, E.I. Ambient pressure X-ray photoelectron spectroscopy study of water formation and adsortption under two-dimesional silica and aluminosilicate layers on Pd (III). J. Chem. Phys. 2020, 152, 084705. [Google Scholar] [CrossRef] [PubMed]
- Revathi, T.; Jeyalakshmi, R. XPS, 29Si, 27Al, 11B MAS -NMR, ATR-IR and FESEM characterization of geopolymer based on borax modified water glass activated Fly ash-GGBS blend. Mater. Res. Express 2019, 6, 085337. [Google Scholar] [CrossRef]
- Rigaku. PDXL Integrated X-ray Powder Diffraction Softvare, 2.8.3.0; Rigaku: Tokyo, Japan, 2011. [Google Scholar]
- Xiaohong, Z.; Chengying, B.; Yingjie, Q.; Xiadong, W.; Decland, J.; Hongqiang, L.; Paolo, C. Porous geopolymer composites A review. Compos. Part A 2021, 150, 106629. [Google Scholar] [CrossRef]
- Phair, J.W.; Schulz, J.C.; Aldridge, L.P.; Smith, J.D. Small-angle neutron scattering and rheological characterization of aluminosilicate hydrogels. J. Am. Ceram. Soc. 2004, 87, 129–137. [Google Scholar] [CrossRef]
- Sellami, M.; Barre, M.; Toumi, M. Synthesis, thermal properties and electrical conductivity of phosphoric acid-based geopolymer with metakaolin. Appl. Clay Sci. 2019, 180, 105192. [Google Scholar] [CrossRef]
- IC Database. N.S. 12 Campus Blvd; IC Database: Philadelphia, PA, USA, 2012; p. 19073. [Google Scholar]


Publisher’s Note: MDPI stays neutral with regard to jurisdictional claims in published maps and institutional affiliations. |
© 2021 by the authors. Licensee MDPI, Basel, Switzerland. This article is an open access article distributed under the terms and conditions of the Creative Commons Attribution (CC BY) license (https://creativecommons.org/licenses/by/4.0/).
Share and Cite
Nenadović, S.S.S.; Kljajević, L.M.; Ivanović, M.M.; Mirković, M.M.; Radmilović, N.; Rakočević, L.Z.; Nenadović, M.T. Structural and Chemical Properties of Geopolymer Gels Incorporated with Neodymium and Samarium. Gels 2021, 7, 195. https://doi.org/10.3390/gels7040195
Nenadović SSS, Kljajević LM, Ivanović MM, Mirković MM, Radmilović N, Rakočević LZ, Nenadović MT. Structural and Chemical Properties of Geopolymer Gels Incorporated with Neodymium and Samarium. Gels. 2021; 7(4):195. https://doi.org/10.3390/gels7040195
Chicago/Turabian StyleNenadović, Snežana S. S., Ljiljana M. Kljajević, Marija M. Ivanović, Miljana M. Mirković, Nadežda Radmilović, Lazar Z. Rakočević, and Miloš T. Nenadović. 2021. "Structural and Chemical Properties of Geopolymer Gels Incorporated with Neodymium and Samarium" Gels 7, no. 4: 195. https://doi.org/10.3390/gels7040195
APA StyleNenadović, S. S. S., Kljajević, L. M., Ivanović, M. M., Mirković, M. M., Radmilović, N., Rakočević, L. Z., & Nenadović, M. T. (2021). Structural and Chemical Properties of Geopolymer Gels Incorporated with Neodymium and Samarium. Gels, 7(4), 195. https://doi.org/10.3390/gels7040195