
Effect of Addition of Chokeberry Juice Concentrate and Foaming Agent on the Physical Properties of Agar Gel


Abstract
:
1. Introduction
2. Results and Discussion
2.1. Physical Properties of Gels with Chokeberry Juice Concentrate
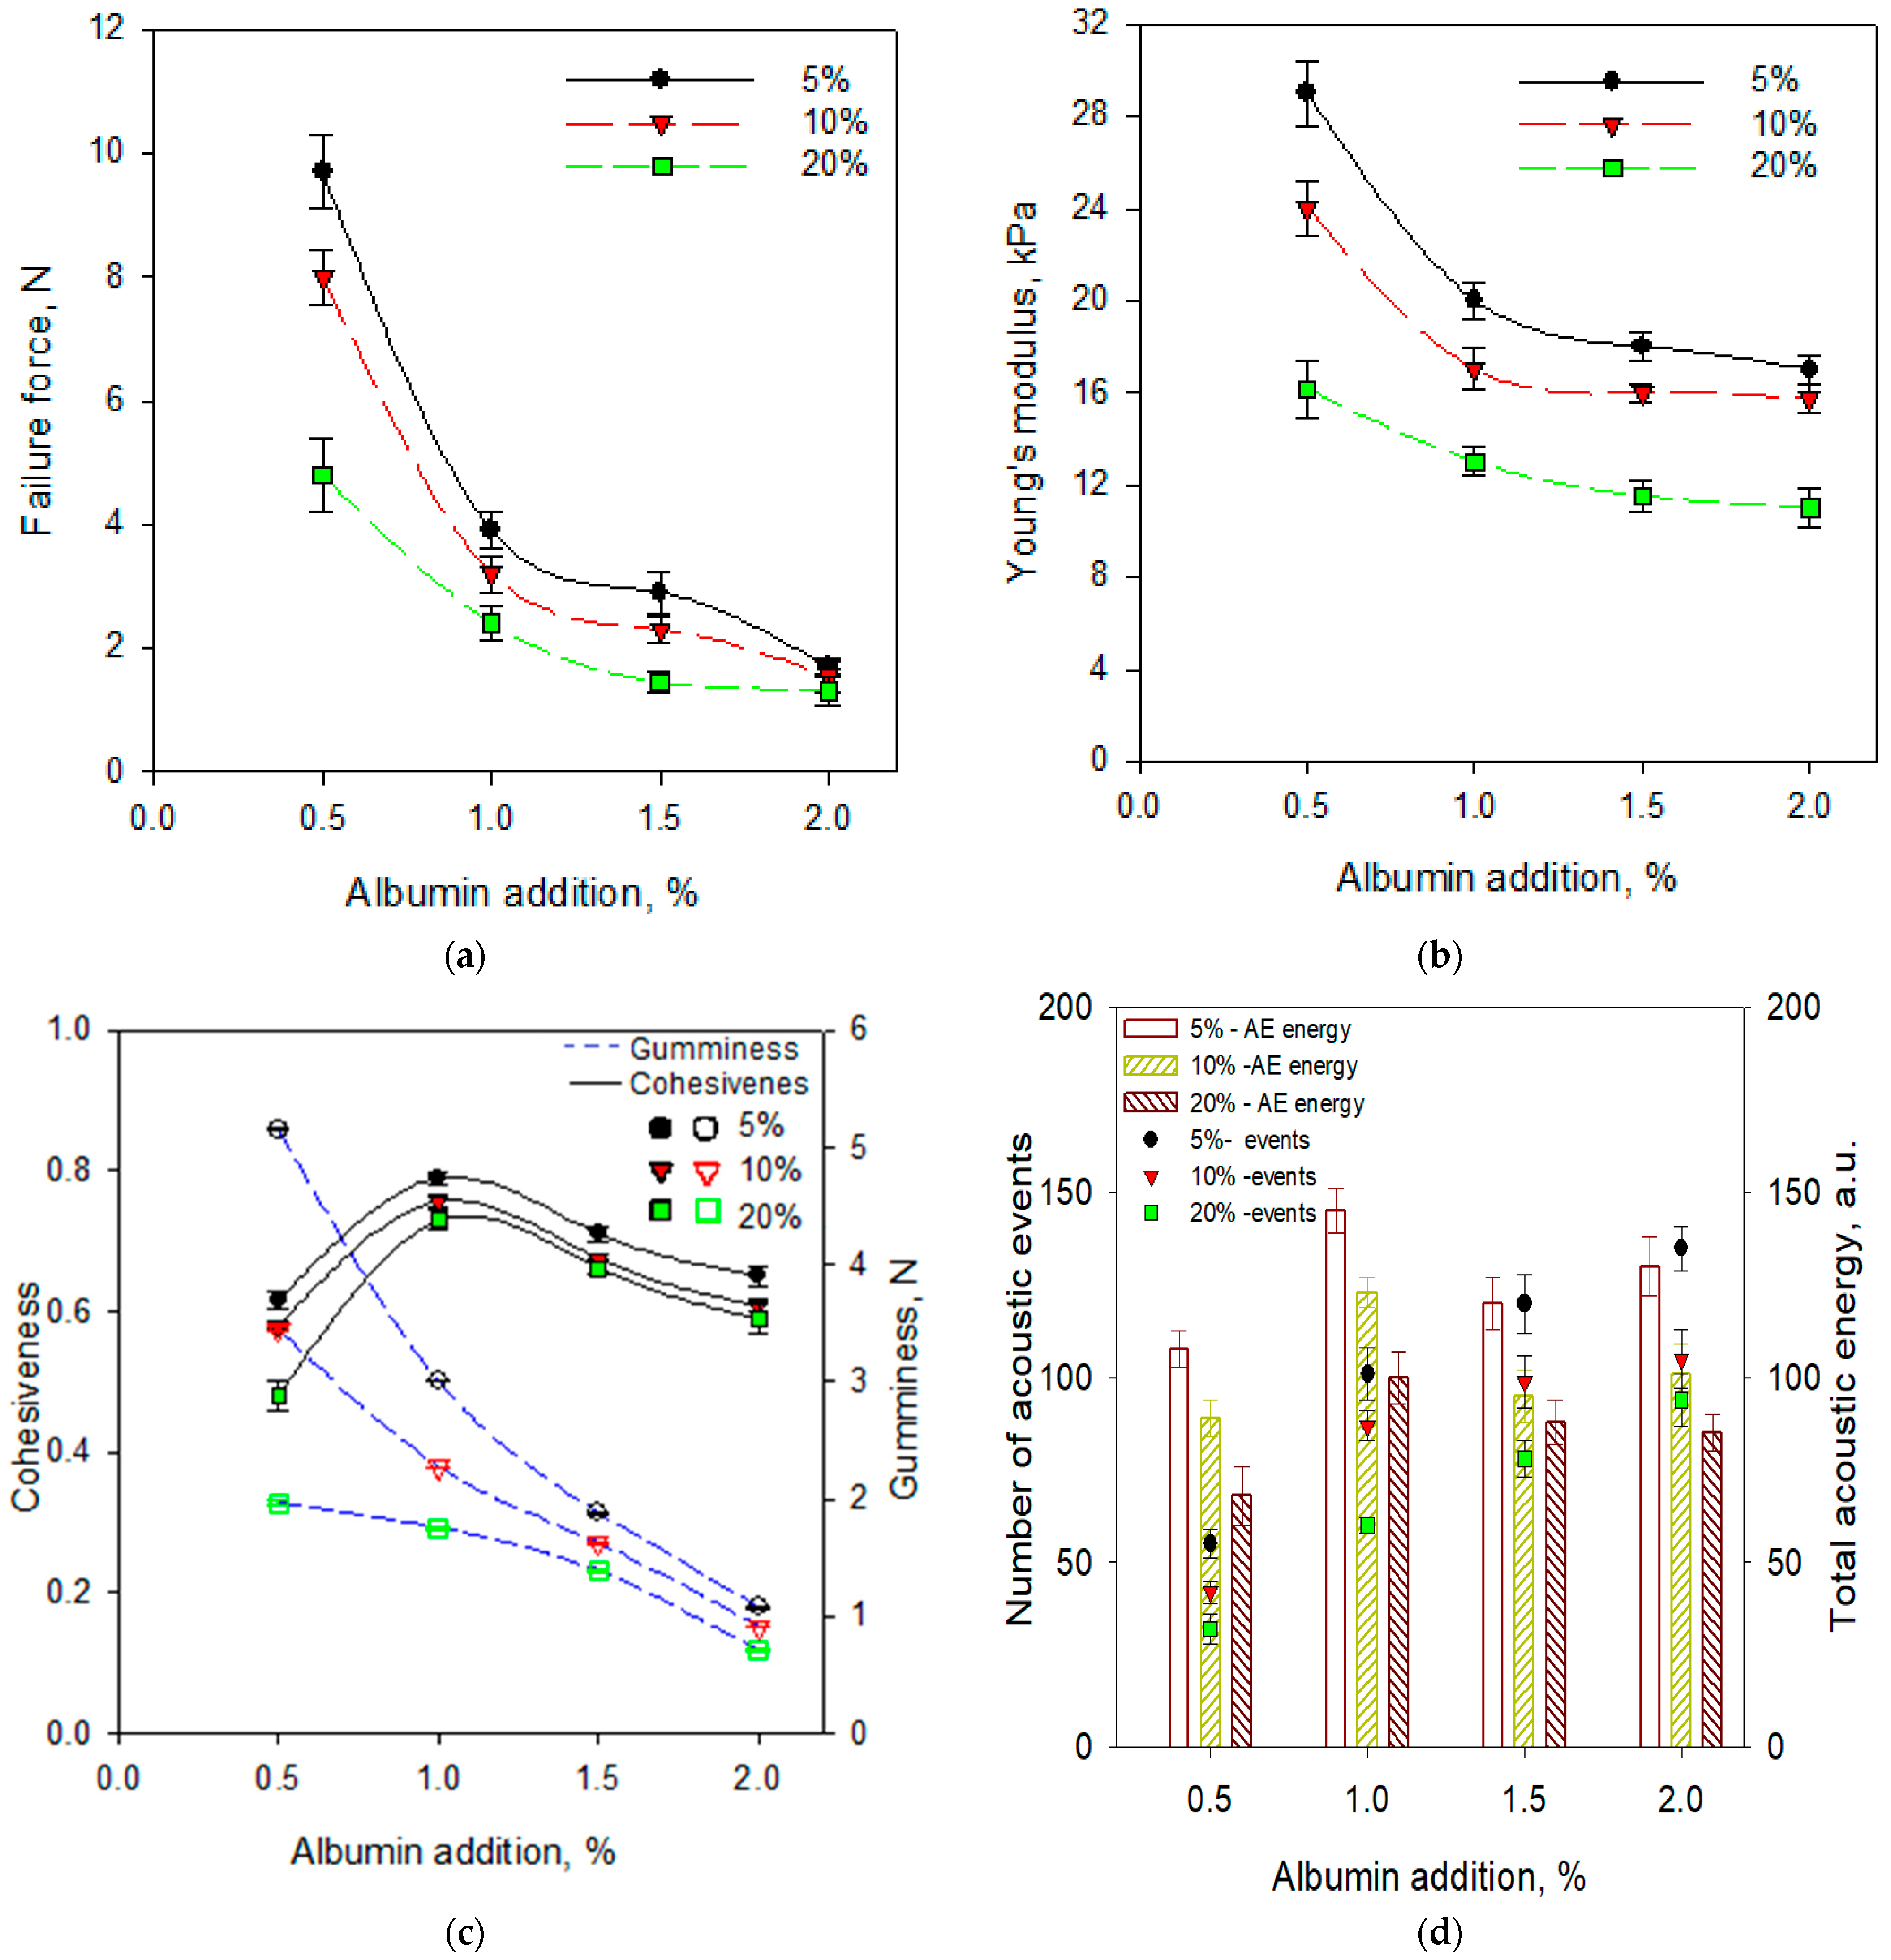
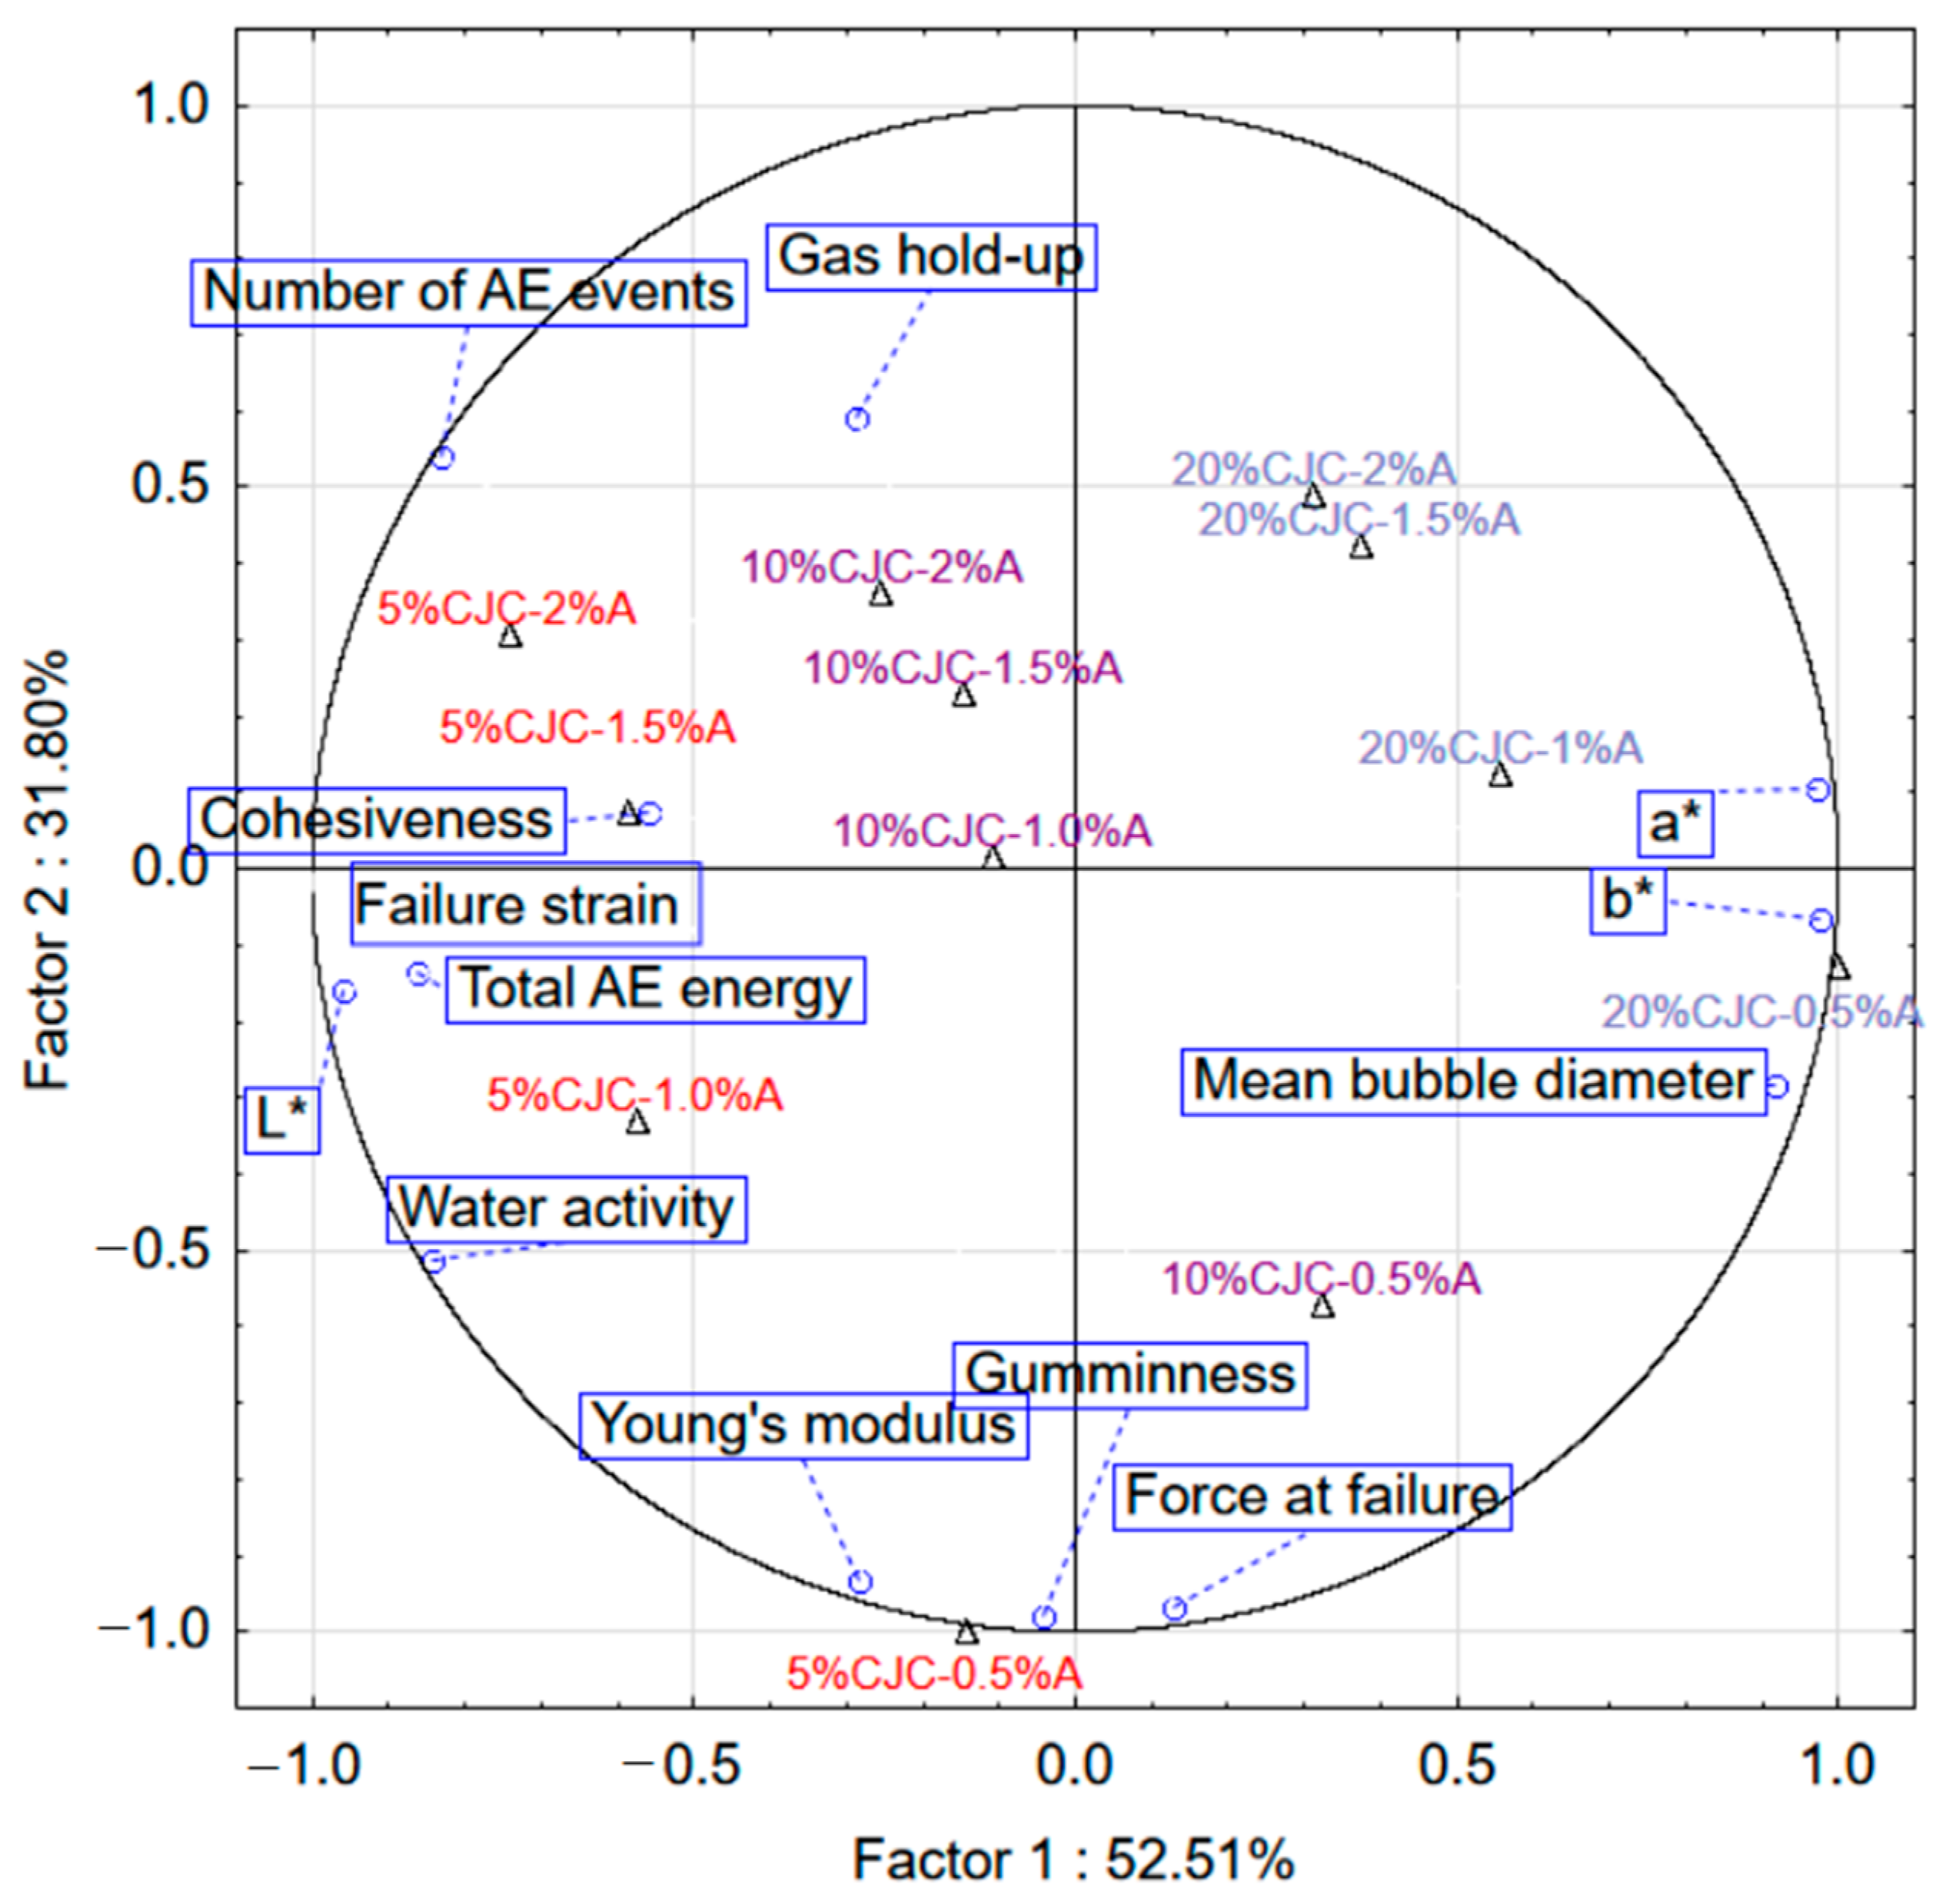
2.2. Selected Physical Properties of Gels with the Addition of Albumin and Chokeberry Juice Concentrate
3. Conclusions
4. Materials and Methods
Author Contributions
Funding
Institutional Review Board Statement
Informed Consent Statement
Data Availability Statement
Acknowledgments
Conflicts of Interest
References
- Dille, M.; Draget, K.; Hattrem, M. The effect of filler particles on the texture of food gels. In Modifying Food Texture; Chen, J., Rosenthal, A., Eds.; Elsevier/Woodhead Publishing: Amsterdam, The Netherlands, 2015; pp. 183–200. [Google Scholar]
- Periche, A.; Heredia, A.; Escriche, I.; Andrés, A.; Castelló, M.L. Potential use of isomaltulose to produce healthier marshmallows. LWT 2015, 62, 605–612. [Google Scholar] [CrossRef]
- Banerjee, S.; Ravi, R.; Bhattacharya, S. Textural characterisation of gellan and agar based fabricated gels with carrot juice. LWT 2013, 53, 255–261. [Google Scholar] [CrossRef]
- Tiwari, S.; Bhattacharya, S. Aeration of model gels: Rheological characteristics of gellan and agar gels. J. Food Eng. 2011, 107, 134–139. [Google Scholar] [CrossRef]
- López-Ramírez, A.M.; Duarte-Sierra, A. Avocado jelly: Formulation and optimization of an avocado gel using hydrocolloids. Int. J. Gastron. Food Sci. 2020, 21, 100234. [Google Scholar] [CrossRef]
- Campbell, G.M.; Mougeot, E. Creation and characterisation of aerated food products. Trends Food Sci. Technol. 1999, 10, 283–296. [Google Scholar] [CrossRef]
- Zuniga, R.N.; Aguilera, J.M. Aerated food gels: Fabrication and potential applications. Trends Food Sci. Technol. 2008, 19, 176–187. [Google Scholar] [CrossRef]
- Osterholt, K.M.; Roe, D.S.; Rolls, B.J. Incorporation of air into a snack food reduces energy intake. Appetite 2007, 48, 351–358. [Google Scholar] [CrossRef] [Green Version]
- Vernon-Carter, E.J.; Espinosa-Paredes, G.; Beristain, C.I.; Romero-Tehuitzil, H. Effect of foaming agents on the stability, rheological properties, drying kinetics and flavour retention of tamarind foam-mats. Int. Food Res. J. 2001, 34, 587–598. [Google Scholar] [CrossRef]
- Raharitsifa, N.; Genovese, D.B.; Ratti, C. Characterization of apple juice foams for foam-mat drying prepared with egg white protein and methylcellulose. J. Food Sci. 2006, 71, E142–E151. [Google Scholar] [CrossRef]
- Dickinson, E.; Powlowsky, K. Rheology as a probe of protein-polysaccharide interactions in oil-in-water emulsions. In Gums and Stabilisers for the Food Industry 8; Phillips, G.O., Williams, P.A., Wedlock, D.J., Eds.; IRL Press: Oxford, UK, 1996; pp. 181–191. [Google Scholar]
- Green, A.J.; Littlejohn, K.A.; Hooley, P.; Cox, P.W. Formation and stability of food foams and aerated emulsions: Hydrophobins as novel functional ingredients. Curr. Opin. Colloid Interface Sci. 2013, 18, 292–301. [Google Scholar] [CrossRef] [Green Version]
- Muthukumaran, A.; Ratti, C.; Raghavan, V.G. Foam-mat freeze drying of egg white and mathematical modeling Part I optimization of egg white foam stability. Dry. Technol. 2008, 26, 508–512. [Google Scholar] [CrossRef]
- Dickinson, E.; Stainsby, G. Progress in the formulation of food emulsions and foams. Food Technol. 1987, 41, 74–116. [Google Scholar]
- Dachmann, E.; Hengst, C.; Ozcelik, M.; Kulozik, U.; Dombrowski, J. Impact of hydrocolloids and homogenization treatment on the foaming properties of raspberry fruit puree. Food Bioproc.Technol. 2018, 11, 2253–2264. [Google Scholar] [CrossRef]
- Karim, A.A.; Wai, C.C. Foam-mat drying of starfruit (Averrhoa carambola L.) purée. Stability and air drying characteristics. Food Chem. 1999, 64, 337–343. [Google Scholar] [CrossRef]
- Tiwari, S.; Bhattacharya, S. Fabricated mango pulp-gellan gels: Effect of selected additives on rheological and sensory attributes. J. Food Qual. 2016, 39, 545–558. [Google Scholar] [CrossRef]
- Çoban, B.; Bilgin, B.; Yurt, B.; Kopuk, B.; Atik, D.S.; Palabiyik, I. Utilization of the barberry extract in the confectionery products. LWT 2021, 145, 111362. [Google Scholar] [CrossRef]
- Appel, K.; Meiser, P.; Millán, E.; Collado, J.A.; Rose, T.; Gras, C.C.; Carle, R.; Muñoz, E. Chokeberry (Aronia melanocarpa (Michx.) Elliot) concentrate inhibits NF-κB and synergizes with selenium to inhibit the release of pro-inflammatory mediators in macrophages. Fitoterapia 2015, 105, 73–82. [Google Scholar] [CrossRef] [PubMed]
- Oszmiański, J.; Wojdylo, A. Aronia melanocarpa phenolics and their antioxidant activity. Eur. Food Res. Technol. 2005, 221, 809–813. [Google Scholar] [CrossRef]
- Heinonen, I.M.; Meyer, A.S.; Frankel, E.N. Antioxidant activity of berry phenolics on human low-density lipoprotein and liposome oxidation. J Agric. Food Chem. 1998, 46, 4107–4112. [Google Scholar] [CrossRef]
- Matsumoto, M.; Hara, H.; Chiji, H.; Kasai, T. Gastroprotective effect of red pigments in black chokeberry fruit (Aronia melanocarpa Elliot) on acute gastric hemorrhagic lesions in rats. J. Agric. Food Chem. 2004, 52, 2226–2229. [Google Scholar] [CrossRef]
- Wu, X.; Gu, L.; Prior, R.L.; McKay, S. Characterization of anthocyanins and proanthocyanidins in some cultivars of Ribes, Aronia, and Sambucus and their antioxidant capacity. J. Agric. Food Chem. 2004, 52, 7846–7856. [Google Scholar] [CrossRef]
- Sueiro, L.; Yousef, G.; Seigler, D.; De Mejia, E.; Grace, M.; Lila, M. Chemopreventive potential of flavonoid extracts from plantation-bred and wild Aronia melanocarpa (black chokeberry) fruits. J. Food Sci. 2006, 71, C480–C488. [Google Scholar] [CrossRef]
- Tolić, M.-T.; Jurčević, I.L.; Krbavčić, I.P.; Marković, K.; Vahčić, N. Phenolic content, antioxidant capacity and quality of chokeberry (Aronia melanocarpa) products. Food Technol. Biotechnol. 2015, 53, 171–179. [Google Scholar] [CrossRef]
- Witczak, T.; Stepien, A.; Gumul, D.; Witczak, M.; Fiutak, G.; Zieba, T. The influence of the extrusion process on the nutritional composition, physical properties and storage stability of black chokeberry pomaces. Food Chem. 2021, 334, 127548. [Google Scholar] [CrossRef] [PubMed]
- vanVliet, T.; Walstra, P. Large deformation and fracture behaviour of gels. Faraday Discuss. 1995, 101, 359–370. [Google Scholar] [CrossRef]
- Peleg, M. On fundamental issues in texture evaluation and texturization—A view. Food Hydrocoll. 2006, 20, 405–414. [Google Scholar] [CrossRef]
- Barrangou, L.M.; Daubert, C.R.; Allen Foegeding, E. Textural properties of agarose gels. I. Rheological and fracture properties. Food Hydrocoll. 2006, 20, 184–195. [Google Scholar] [CrossRef]
- Jakubczyk, E.; Gondek, E.; Tryzno, E. Application of novel acoustic measurement techniques for texture analysis of co-extruded snacks. LWT 2017, 75, 582–589. [Google Scholar] [CrossRef]
- Jakubczyk, E.; Linde, M.; Gondek, E.; Kamińska-Dwórznicka, A.; Samborska, K.; Antoniuk, A. The effect of phytosterols addition on the textural properties of extruded crisp bread. J. Food Eng. 2015, 167, 156–161. [Google Scholar] [CrossRef]
- Ciurzyńska, A.; Marzec, A.; Mieszkowska, A.; Lenart, A. Structure influence on mechanical and acoustic properties of freeze-dried gels obtained with the use of hydrocolloids. J. Texture Stud. 2017, 48, 131–142. [Google Scholar] [CrossRef]
- Zdunek, A.; Konopacka, D.; Jesionkowska, K. Crispness and crunchiness judgment of apples based on contact acoustic emission. J. Texture Stud. 2010, 41, 75–91. [Google Scholar] [CrossRef]
- Erkinbaev, C.; Herremans, E.; Nguyen Do Trong, N.; Jakubczyk, E.; Verboven, P.; Nicolaï, B.; Saeys, W. Contactless and non-destructive differentiation of microstructures of sugar foams by hyperspectral scatter imaging. Innov. Food Sci. Emerg. Technol. 2014, 24, 131–137. [Google Scholar] [CrossRef]
- Herremans, E.; Bongaers, E.; Estrade, P.; Gondek, E.; Hertog, M.; Jakubczyk, E.; Nguyen Do Trong, N.; Rizzolo, A.; Saeys, W.; Spinelli, L.; et al. Microstructure–texture relationships of aerated sugar gels: Novel measurement techniques for analysis and control. Innov. Food Sci. Emerg. Technol. 2013, 18, 202–211. [Google Scholar] [CrossRef]
- Sidor, A.; Gramza-Michałowska, A. Black chokeberry Aronia Melanocarpa L.—A qualitative composition, phenolic profile and antioxidant potential. Molecules 2019, 24, 3710. [Google Scholar] [CrossRef] [PubMed] [Green Version]
- Jakubczyk, E.; Gondek, E.; Kamińska-Dwórznicka, A.; Samborska, K.; Wiktor, A.; Królikowski, K. A complex approach to assessing properties of aerated agar-fructose gels: Application of acoustic emission technique. Food Hydrocoll. 2019, 91, 66–75. [Google Scholar] [CrossRef]
- Ochmian, I.D.; Grajkowski, J.; Smolik, M. Comparison of some morphological features, quality and chemical content of four cultivars of chokeberry fruits (Aronia melanocarpa). Not. Bot. Horti Agrobot.Cluj. Napoca. 2012, 40, 253–260. [Google Scholar] [CrossRef] [Green Version]
- Horszwald, A.; Julien, H.; Andlauer, W. Characterisation of Aronia powders obtained by different drying processes. Food Chem. 2013, 141, 2858–2863. [Google Scholar] [CrossRef]
- Bourne, M.C. Texture profile of ripening pears. J. Food Sci. 1968, 33, 223–226. [Google Scholar] [CrossRef]
- Tan, J.M.; Lim, M.H. Effects of gelatine type and concentration on the shelf-life stability and quality of marshmallows. Int. J. Food Sci. Technol. 2008, 43, 1699–1704. [Google Scholar] [CrossRef]
- Ergun, R.; Lietha, R.; Hartel, R.W. Moisture and shelf life in sugar confections. Crit. Rev. Food Sci. Nutr. 2010, 50, 162–192. [Google Scholar] [CrossRef] [PubMed]
- Orrego, M.; Troncoso, E.; Zúñiga, R.N. Aerated whey protein gels as new food matrices: Effect of thermal treatment over microstructure and textural properties. J. Food Eng. 2015, 163, 37–44. [Google Scholar] [CrossRef]
- Zúñiga, R.; Aguilera, J. Structure–fracture relationships in gas-filled gelatin gels. Food Hydrocoll. 2009, 23, 1351–1357. [Google Scholar] [CrossRef]
- Abd Karim, A.; Wai, C.C. Characteristics of foam prepared from starfruit (Averrhoa carambola L.) puree by using methyl cellulose. Food Hydrocoll. 1999, 13, 203–210. [Google Scholar] [CrossRef]
- Hernandez, M.; Durán, L.; Costell, E. Influence of composition on mechanical properties of strawberry gels. Compression test and texture profile analysis. Food Sci. Technol. Int. 1999, 5, 79–87. [Google Scholar] [CrossRef]
- Lewicki, P.P.; Marzec, A.; Ranachowski, Z. Acoustic properties of foods. In Food Properties Handbook; Rahman, M.S., Ed.; CRC Press: Boca Raton, FL, USA, 2009; pp. 811–841. [Google Scholar]
- Saeleaw, M.; Schleining, G. A review: Crispness in dry foods and quality measurements based on acoustic–mechanical destructive techniques. J. Food Eng. 2011, 105, 387–399. [Google Scholar] [CrossRef]


| Addition of Chokeberry Juice Concentrate, % | Water Activity | Density kg∙m−3 | L* | a* | b* |
|---|---|---|---|---|---|
| 0 | 0.678 ± 0.009 a,† | 1298 ± 60 a | 96.0 ± 1.1 a | +2.0 ± 0.2 a | +18.0 ± 0.4 a |
| 5 | 0.659 ± 0.010 a | 1322 ± 29 a | 24.0 ± 0.8 b | +32.4 ± 0.9 b | +1.1 ± 0.2 b |
| 10 | 0.634 ± 0.011 b | 1345 ± 24 a | 12.4 ± 0.9 c | +35.0 ± 0.4 c | +0.6 ± 0.2 b |
| 20 | 0.611 ± 0.013 b | 1358 ± 45 a | 4.1 ± 0.4 d | +39.8 ± 0.3 d | −0.4 ± 0.1 c |
| Addition of Chokeberry Juice Concentrate, % | Fracture Force, N | Fracture Strain, % | Young’s Modulus, kPa | Cohesiveness | Gumminess, N |
|---|---|---|---|---|---|
| 0 | 48.3 ± 1.1 a,† | 59.6 ± 0.8 a | 63.2 ± 6.3 a | 0.74 ± 0.02 a | 11.7 ± 0.8 a |
| 5 | 37.4 ± 0.7 b | 53.7 ± 1.1 b | 52.6 ± 3.2 b | 0.58 ± 0.04 b | 4.9 ± 0.5 b |
| 10 | 21.2 ± 1.2 c | 47.2 ± 1.5 c | 39.0 ± 2.8 c | 0.61 ± 0.04 b | 3.7 ± 0.6 b |
| 20 | 7.8 ± 0.6 d | 39.2 ± 0.6 d | 18.8 ± 1.4 d | 0.44 ± 0.06 c | 1.9 ± 0.3 c |
| Addition of Chokeberry Juice Concentrate, % | Total Acoustic Energy, a.u. | Number of Acoustic Events |
|---|---|---|
| 0 | 259.4 ± 28.7 a,† | 101 ± 9 a |
| 5 | 194.4 ± 18.1 b | 55 ± 5 b |
| 10 | 148.1 ± 12.1 c | 32 ± 4 c |
| 20 | 3.2 ± 0.8 d | 13 ± 1 d |
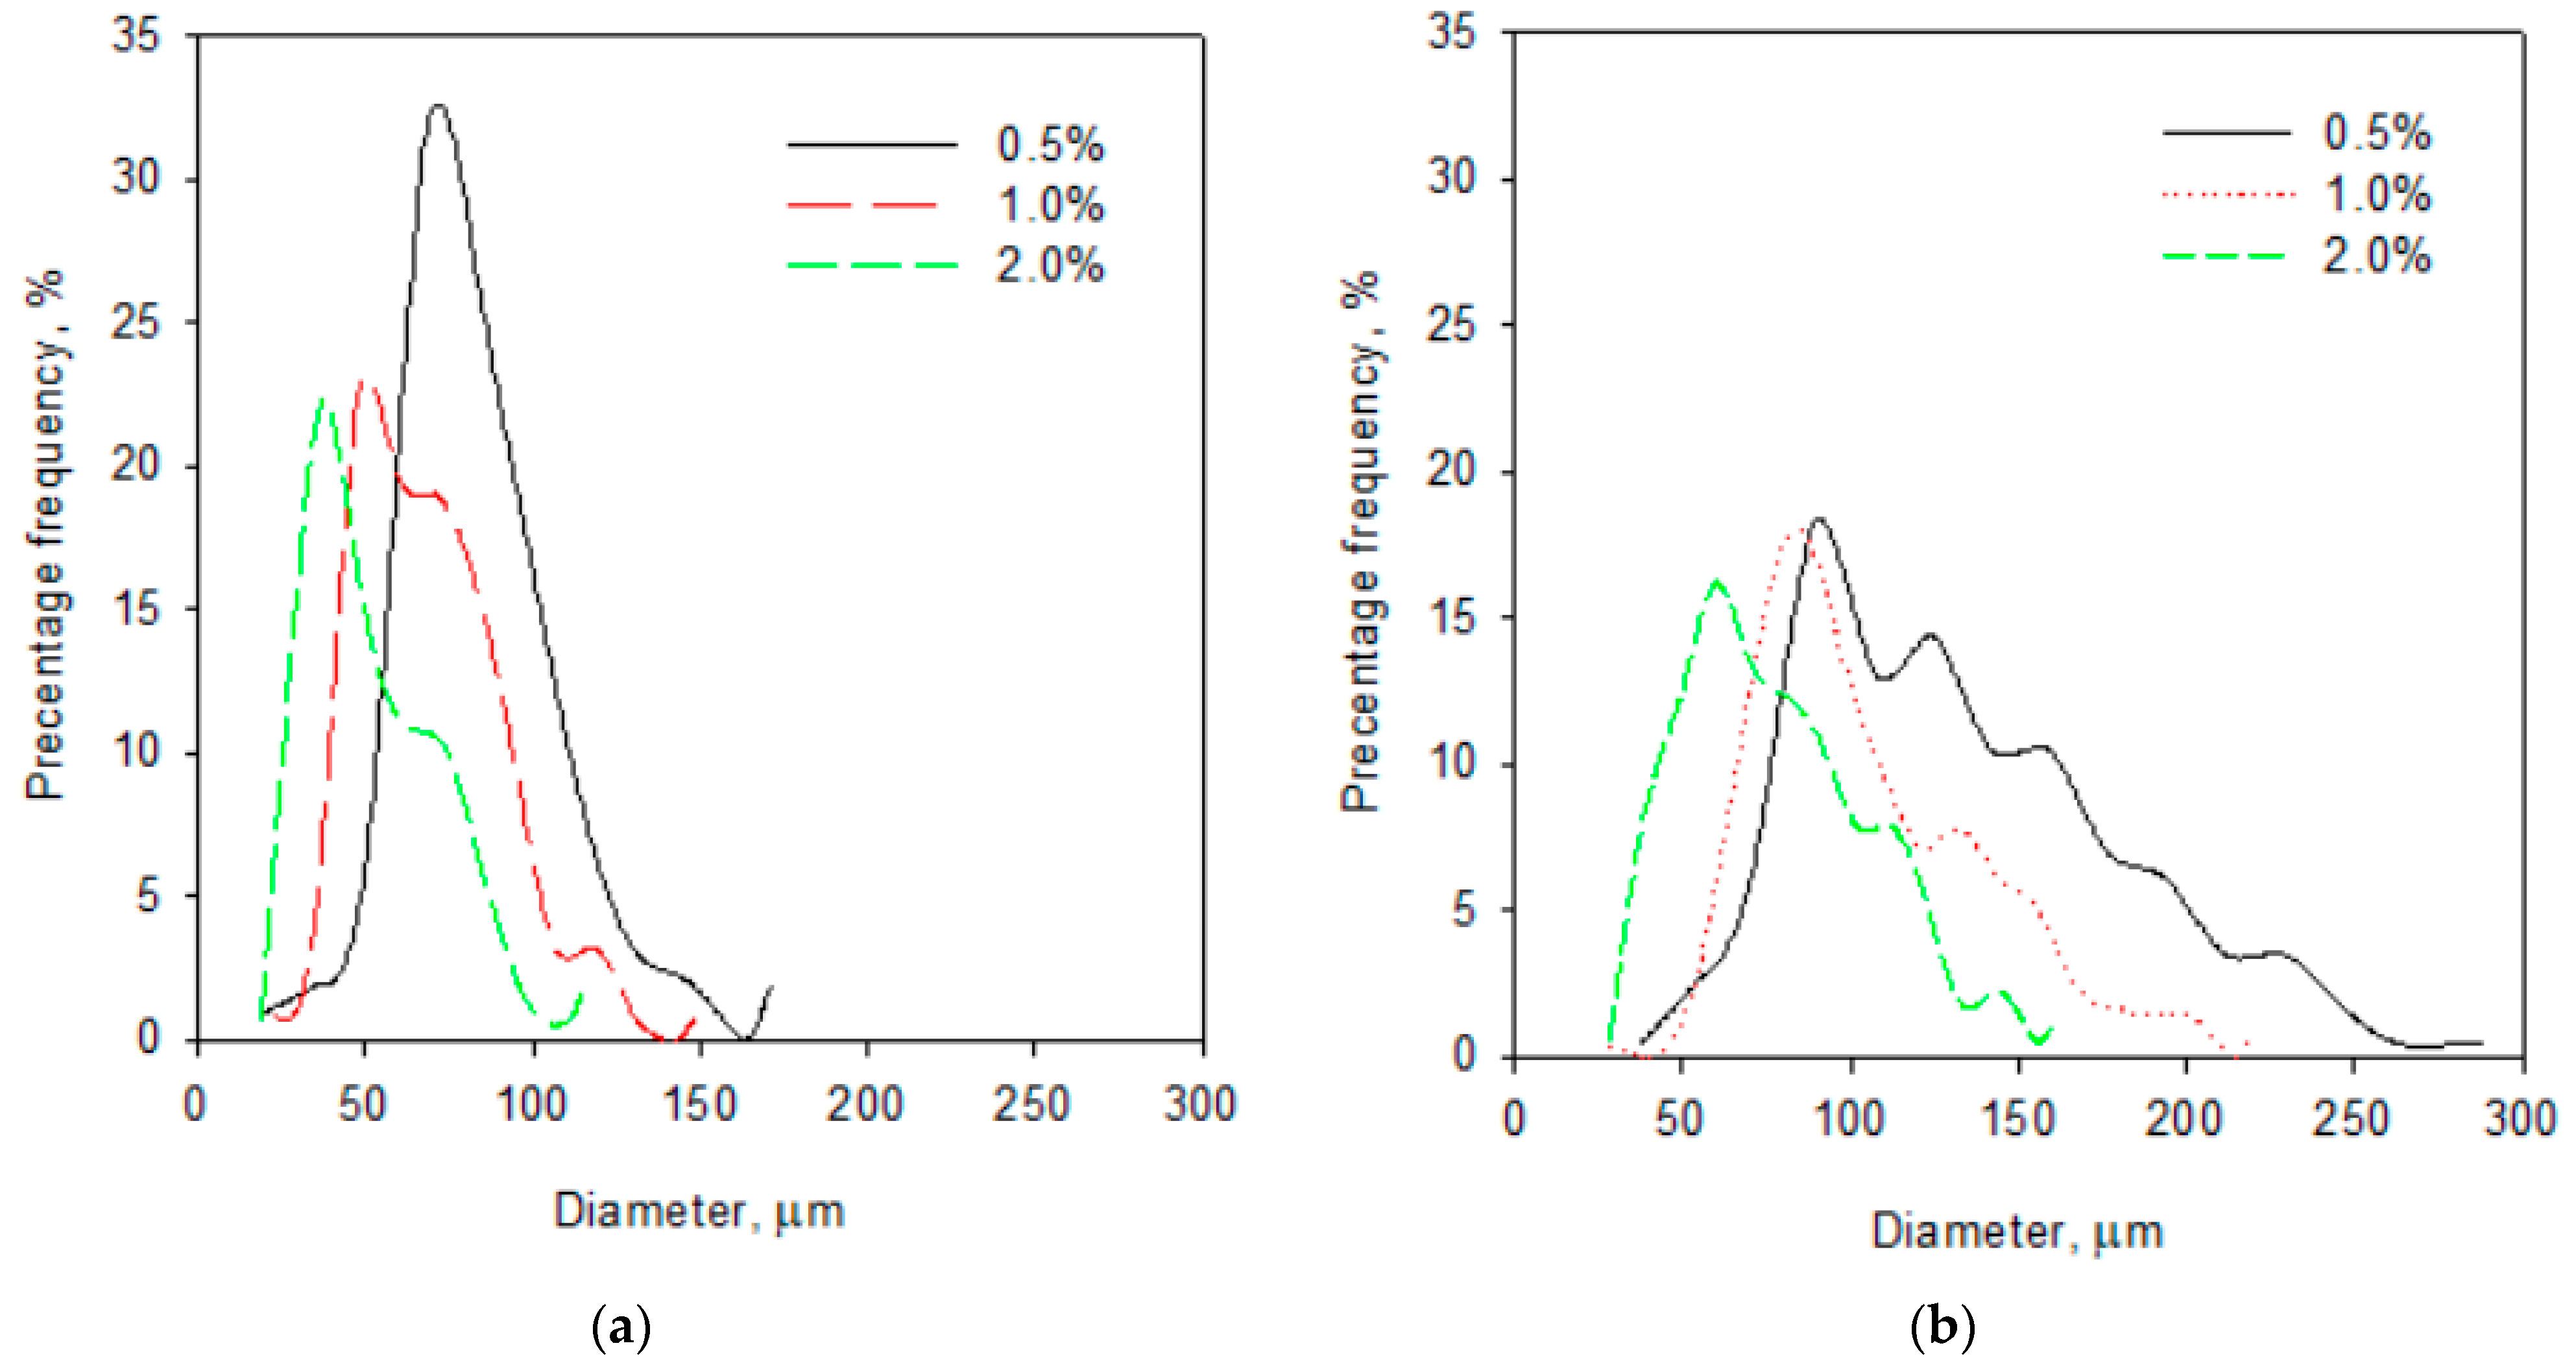
| Addition of Chokeberry Juice Concentrate, % | Addition of Albumin, % | Water Activity | Gas Hold-Up, % | Mean Bubble Diameter, µm |
|---|---|---|---|---|
| 5 | 0.5 | 0.651 ± 0.009 a,† | 65.1 ± 1.2 ab | 67.6 a |
| 1.0 | 0.650 ± 0.007 a | 61.2 ± 2.1 a | 47.2 b | |
| 1.5 | 0.648 ± 0.010 a | 68.7 ± 1.9 bc | 45.4 b | |
| 2 | 0.647 ± 0.011 a | 71.4 ± 2.0 c | 37.2 c | |
| 10 | 0.5 | 0.632 ± 0.012 a | 67.1 ± 1.1 a | 77.8 a |
| 1.0 | 0.631 ± 0.009 a | 68.2 ± 0.9 ab | 66.9 b | |
| 1.5 | 0.629 ± 0.010 a | 70.1 ± 1.3 bc | 58.0 c | |
| 2 | 0.627 ± 0.012 a | 71.2 ± 0.9 c | 54.4 c | |
| 20 | 0.5 | 0.609 ± 0.013 a | 64.2 ± 1.1 a | 89.5 a |
| 1.0 | 0.607 ± 0.014 a | 64.4 ± 0.7 a | 86.1 a | |
| 1.5 | 0.608 ± 0.009 a | 69.9 ± 0.8 b | 65.4 b | |
| 2 | 0.607 ± 0.011 a | 67.8 ± 1.1 b | 59.9 c |
| Addition of Chokeberry Juice Concentrate, % | Addition of Albumin, % | L* | a* | b* | ΔE |
|---|---|---|---|---|---|
| 5 | 0.5 | 61.6 ± 0.4 a,† | +23.0 ± 0.1 a | +1.5 ± 0.1 a | 38.1 ± 0.4 a |
| 1.0 | 63.4 ± 0.3 b | +22.0 ± 0.3 b | +0.9 ± 0.1 b | 40.7 ± 0.6 b | |
| 1.5 | 65.3 ± 0.1 c | +21.0 ± 0.4 b | +0.7 ± 0.1 bc | 42.8 ± 0.3 c | |
| 2 | 69.1 ±0.5 d | +19.7 ± 0.2 c | +0.5 ± 0.1 c | 46.8 ± 0.5 d | |
| 10 | 0.5 | 52.9 ± 0.4 a | +29.1 ± 0.1 a | +2.4 ± 0.1 a | 40.9 ± 0.2 a |
| 1.0 | 54.6 ± 0.9 a | +27.2 ± 0.2 b | +1.8 ± 0.2 b | 42.9 ± 0.4 b | |
| 1.5 | 57.4 ±1.4 b | +25.5 ± 0.7 c | +1.1 ± 0.1 c | 46.0 ± 0.9 c | |
| 2 | 60.3 ± 1.2 c | +22.4 ± 0.9 d | +0.8 ± 0.1 c | 49.5 ± 1.0 d | |
| 20 | 0.5 | 43.6 ±0.9 a | +40.0 ± 0.3 a | +3.8± 0.2 a | 39.7 ± 0.5 a |
| 1.0 | 45.0± 1.6 ab | +35.0 ± 0.7 b | +3.0 ± 0.3 b | 41.3 ± 0.8 a | |
| 1.5 | 47.2 ± 1.3 bc | +32.7 ± 0.8 c | +2.6 ± 0.2 bc | 43.8 ± 0.5 b | |
| 2 | 49.1 ±0.4 c | +31.0 ± 0.9 c | +2.2 ± 0.1 c | 45.9 ± 0.6 c |
| Chokeberry Juice Concentrate, % | Agar Powder, % | Fructose, % | Water, % |
|---|---|---|---|
| 0 | 1.5 | 55.0 | 43.5 |
| 5 | 1.5 | 51.4 | 39.8 |
| 10 | 1.5 | 47.7 | 42.2 |
| 20 | 1.5 | 40.4 | 38.1 |
| Type of Foamed Gel | Chokeberry Juice Concentrate, % | Egg Albumin, % | Fructose, % | Agar Powder, % | Water, % |
|---|---|---|---|---|---|
| 5% C-0.5% A | 5 | 0.5 | 51.4 | 1.5 | 41.7 |
| 5% C-1.0% A | 5 | 1.0 | 51.4 | 1.5 | 40.9 |
| 5% C-1.5% A | 5 | 1.5 | 51.4 | 1.5 | 40.7 |
| 5% C-2.0% A | 5 | 2.0 | 51.4 | 1.5 | 40.2 |
| 10% C-0.5% A | 10 | 0.5 | 47.7 | 1.5 | 40.3 |
| 10% C-1.0% A | 10 | 1.0 | 47.7 | 1.5 | 39.8 |
| 10% C-1.5% A | 10 | 1.5 | 47.7 | 1.5 | 39.3 |
| 10% C-2.0% A | 10 | 2.0 | 47.7 | 1.5 | 38.8 |
| 20% C-0.5% A | 20 | 0.5 | 40.4 | 1.5 | 37.6 |
| 20% C-1.0% A | 20 | 1.0 | 40.4 | 1.5 | 37.1 |
| 20% C-1.5% A | 20 | 1.5 | 40.4 | 1.5 | 36.6 |
| 20% C-2.0% A | 20 | 2.0 | 40.4 | 1.5 | 36.1 |
Publisher’s Note: MDPI stays neutral with regard to jurisdictional claims in published maps and institutional affiliations. |
© 2021 by the authors. Licensee MDPI, Basel, Switzerland. This article is an open access article distributed under the terms and conditions of the Creative Commons Attribution (CC BY) license (https://creativecommons.org/licenses/by/4.0/).
Share and Cite
Jakubczyk, E.; Kamińska-Dwórznicka, A. Effect of Addition of Chokeberry Juice Concentrate and Foaming Agent on the Physical Properties of Agar Gel. Gels 2021, 7, 137. https://doi.org/10.3390/gels7030137
Jakubczyk E, Kamińska-Dwórznicka A. Effect of Addition of Chokeberry Juice Concentrate and Foaming Agent on the Physical Properties of Agar Gel. Gels. 2021; 7(3):137. https://doi.org/10.3390/gels7030137
Chicago/Turabian StyleJakubczyk, Ewa, and Anna Kamińska-Dwórznicka. 2021. "Effect of Addition of Chokeberry Juice Concentrate and Foaming Agent on the Physical Properties of Agar Gel" Gels 7, no. 3: 137. https://doi.org/10.3390/gels7030137
APA StyleJakubczyk, E., & Kamińska-Dwórznicka, A. (2021). Effect of Addition of Chokeberry Juice Concentrate and Foaming Agent on the Physical Properties of Agar Gel. Gels, 7(3), 137. https://doi.org/10.3390/gels7030137