Article

In Situ Measurement Methods for the CO2-Induced Gelation of Biopolymer Systems

1
Institute of Thermal Separation Processes, Hamburg University of Technology, 21073 Hamburg, Germany
2
Institute of Chemical Engineering, Laboratory of Thermal Process Engineering, Ulm University, 89081 Ulm, Germany
3
Laboratory for Development and Modelling of Novel Nanoporous Materials, Hamburg University of Technology, 21073 Hamburg, Germany
*
Author to whom correspondence should be addressed.
Submission received: 18 August 2020 / Revised: 3 September 2020 / Accepted: 4 September 2020 / Published: 9 September 2020
(This article belongs to the Special Issue Aerogels 2020)

Abstract

:
This work presents two novel methods to investigate in situ the carbon dioxide (CO2)-induced gelation of biopolymer-based solutions. The CO2-induced gelation is performed in a viewing cell at room temperature under CO2 pressure (20 to 60 bar), whereby calcium precursors are used as cross-linkers. The novel methods allow the in situ optical observation and evaluation of the gelation process via the change in turbidity due to dissolution of dispersed calcium carbonate (CaCO3) particles and in situ pH measurements. The combination of both methods enables the determination of the gelation direction, gelation rate, and the pH value in spatial and temporal resolution. The optical gelation front and pH front both propagate equally from top to bottom through the sample solutions, indicating a direct link between a decrease in the pH value and the dissolution of the CaCO3 particles. Close-to-vertical movement of both gelation front and pH front suggests almost one dimensional diffusion of CO2 from the contact surface (gel–CO2) to the bottom of the sample. The gelation rate increases with the increase in CO2 pressure. However, the increase in solution viscosity and the formation of a gel layer result in a strong decrease in the gelation rate due to a hindrance of CO2 diffusion. Released carbonate ions from CaCO3 dissolution directly influence the reaction equilibrium between CO2 and water and therefore the change in pH value of the solution. Increasing the CaCO3 concentrations up to the solubility results in lower gelation rates.

Graphical Abstract

1. Introduction

Aerogels are solid materials with high specific surface area and porosity. Recently, they become more and more promising for the applications in food and pharmaceutical area. Biopolymers in particular are receiving considerable attention as precursors for the aerogel production due to unique properties such as edibility and biodegradability (besides the ability to form a gel, which is common for various natural food components). The general steps of aerogel production from biopolymers can be summarized as follows: (1) dissolution of the biopolymer, (2) gelation of the resulting solution, (3) solvent exchange, and (4) supercritical drying with carbon dioxide (CO2) [1]. The first step of biopolymer dissolution mainly depends on the physical properties of a selected biopolymer. However, the gelation step, which has a decisive impact on the formed structure and therefore the properties of obtained aerogels, is often similar for different biopolymer classes. Depending on specific properties of biopolymers, various gelation methods have been developed such as thermal, ionotropic, or acid-induced gelation. One promising method suggested for the gelation of biopolymer solutions is the so-called CO2-induced gelation [2]. Here, pressurized CO2 is applied to the biopolymer solution, causing its gelation. It has been applied to different biopolymers including alginate [2,3,4], amidated pectin [1], silk fibroin [5,6,7], α-elastin [8,9], chitosan [10], whey protein isolate [11], potato starch [12], myosin [13], collagen [14], and hybrids of different biopolymers [3,15]. It has been shown that CO2-induced gelation has several advantageous compared to common gelation methods for biopolymers. CO2-induced gelation enables faster gelation [5,6] resulting in more homogeneous and stable hydrogels [2,5,6,9,11] with higher porosities [5,6], enhanced pore connectivity [9], and increased specific surface area [15] when compared to conventionally gelled counterparts. Supercritically dried pectin gels (after solvent exchange) have been suggested for a range of applications such as biocompatible thermal insulation [16], for drug delivery [17], and food packaging [18].
Depending on the gelation mechanism of a particular biopolymer, a combination of CO2-induced gelation and ionotropic gelation with additional initially non-dissolved cross-linkers like calcium carbonate (CaCO3) particles can be employed [1,2].
The overall mechanism of the CO2-induced gelation can be divided in five steps (Figure 1):
  • Dissolution of CO2 in the aqueous biopolymer solution;
  • Reaction of CO2 with water and formation of carbonic acid;
  • Dissociation of the carbonic acid resulting in a pH drop;
  • Dissolution of cross-linkers (e.g., CaCO3) due to increased solubility at a reduced pH value;
  • Cross-linking of biopolymer chains, which is either induced by reduction of the pH value (step 3) and therefore interaction of biopolymer molecules or by interaction of biopolymer molecules with released cations (step 4).
CO2 dissolution in and reaction with water (steps 1–3, Figure 1) and the dissolution of CaCO3 (step 4, Figure 1) in systems without biopolymers have been studied widely in the literature [19,20,21,22,23,24]. It was shown that additional components like inorganic salts have an impact on the solubility of CO2 and CaCO3 in aqueous solutions [19,22,23,24]. Regarding the reaction equilibrium of the reaction system of CO2 and water, it was shown that at pH 3.5–7, the main carbonate containing species is the bicarbonate ion [19]. The solubility of CaCO3 increases with decreasing pH value [25,26] and increasing pressure of CO2 [27]. Furthermore, although released carbonate ions from CaCO3 dissolution directly influence the equilibria in the reacting water/CO2 system and thus affect the pH value [28], bicarbonate is the main carbonate containing species in the ternary solution at pH 2.5–7 [19].
Each step of the CO2-induced gelation process of biopolymer solutions is most likely impacted by the biopolymer directly due to buffering effects [5] and by progressive changes of physical properties of the reacting solution such as density and viscosity. Furthermore, most probably, each step has in turn a strong impact on the overall gelation process and possibly on the aerogel properties. Nevertheless, although the CO2-induced gelation is a promising approach, its detailed mechanism as well as the impact of the pressurized CO2 still remain not elucidated.
Only a few works investigate the mechanism of the CO2-induced gelation of biopolymer solutions. Floren et al. [5] studied the gelation of silk fibroin solutions in CO2 atmosphere at pressures from 5 to 150 bar at 40 °C without any additional cross-linking agents. A change in the visual appearance of the protein solution from a transparent solution to an opaque gel in CO2 atmosphere was observed. This change in appearance was homogeneous over the entire sample and was used as an indicator for the ongoing gelation process. A homogeneous drop of the pH value throughout the aqueous silk fibroin solution and therefore gelation due to protein precipitation was assumed. The determination of the gelation progress was performed ex situ after depressurization of the system: the solution was defined as gelled if the sample does not flow from the inverted beaker. Hence, the ex situ gelation times are likely to be biased by non-isobaric conditions and a certain duration of the depressurization. Shorter gelation time with increasing CO2 pressure was observed. Furthermore, the impact of high pressure itself on the gelation time was proven by comparing ambient pressure acid-induced gelation with high-pressure-assisted acid-induced gelation at nitrous oxide atmosphere at the same pH value. A decrease in the gelation time comparable to the effect of pressurized CO2 was identified, indicating a strong impact of hydrostatic pressure separated from the pH drop.
Mallepally et al. [6] compared a low pressure (2 bar) bubble through method to the stagnant high pressure method of Floren et al. [5]. An increased gelation velocity by the enhanced CO2 mass transfer into the solution of silk fibroin due to an increased contact surface area was demonstrated.
In situ pH measurements in combination with viscosity measurements to track the gelation process were conducted by Zubal et al. [14] and Oechsle et al. [29] in collagen and cellulose nanocrystal/imidazole solutions, respectively. In both cases, measurements were performed at atmospheric pressure either throughout evaporation of CO2 after depressurization or while sparging the solution with CO2 or nitrogen at low pressure, respectively. A clear dependence of the viscosity and therefore the gelation progress of the biopolymer solutions on the pH value was shown.
A theoretical description of the CO2-induced gelation of protein solutions without additional cross-linker is provided by Floren et al. [5]. The model is based on the assumption that the reaction of CO2 with water dominates the gelation mechanism. Especially at increased pressures, CO2 dissolution in water was assumed to be the limiting step of the pH reduction process. Additionally, it was assumed that the fast formation and dissociation of carbonic acid and rapid diffusion of protons result in a homogenous drop of the pH value inside the protein solution. Therefore, all protein molecules exhibit the same net electrostatic charge at all time without having an impact on the dissolution and reaction of CO2 and water. A theoretical calculation of the pH value inside the protein solution was performed, including the buffer capacity of the protein. Determined pH profiles over time were used to calculate the required gelation time, and it was pointing to a critical part of the mass transfer in the entire acidification process. Comparison with measured gelation times revealed that the impact of the protein concentration is captured insufficiently by the model.
Several works studied the secondary structure of the biopolymer before and after the CO2 treatment; see step 5 of the gelation process in Figure 1. It was shown for most proteins that the treatment with pressurized CO2 at temperatures below 60 °C has no specific effect on the secondary structure when compared to ambient pressure acid treatment. Neither in ex situ measurements after depressurization [5,6,8,10,11] nor in in situ measurements up to 80 bar [8], nor different gelation methods (stagnant or bubble through) [6] show an impact. However, a clear impact on the macroscopic characteristics of the gelation process such as decreased gelation temperature or decreased gelation time was observed [6,8]. Only at temperatures above 60 °C, Xu et al. [11] observed a negative effect of the high-pressure CO2 atmosphere resulting in the loss of structural integrity when compared to pure thermal or high-pressure nitrogen treatment.
Regarding the structural change in polysaccharides, Muljana et al. [12] showed that in CO2 atmosphere, the pressure has an impact on the secondary structure of potato starch and therefore the degree of gelatinization. The measurements of the secondary structure were performed after equilibration at pressures from 1 to 250 bar.
In summary, it can be said that besides information about the change in the secondary structure of biopolymers due to high-pressure CO2 treatment, dynamic mechanisms of the process steps of the CO2-induced gelation of biopolymers are not revealed. Furthermore, no in situ measurement methods to elucidate the overall gelation mechanism of the CO2-induced gelation of biopolymer solutions at elevated pressure have ever been presented. To understand the whole gelation process, individual process steps should be studied in situ. The aim of this work is therefore to develop two in situ methods to enable the measurement of the pH drop throughout the gelation process (step 1–3, Figure 1) and dissolution of calcium carbonate (step 4, Figure 1) individually with spatial and temporal resolution. To evaluate the developed methods and illustrate their benefit for mechanism elucidation, a model gelation system of aqueous amidated pectin solution with suspended CaCO3 particles as additional cross-linker is used.

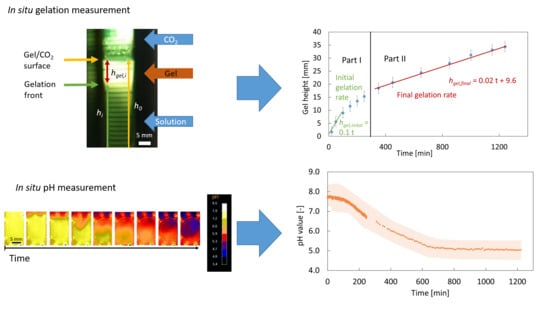
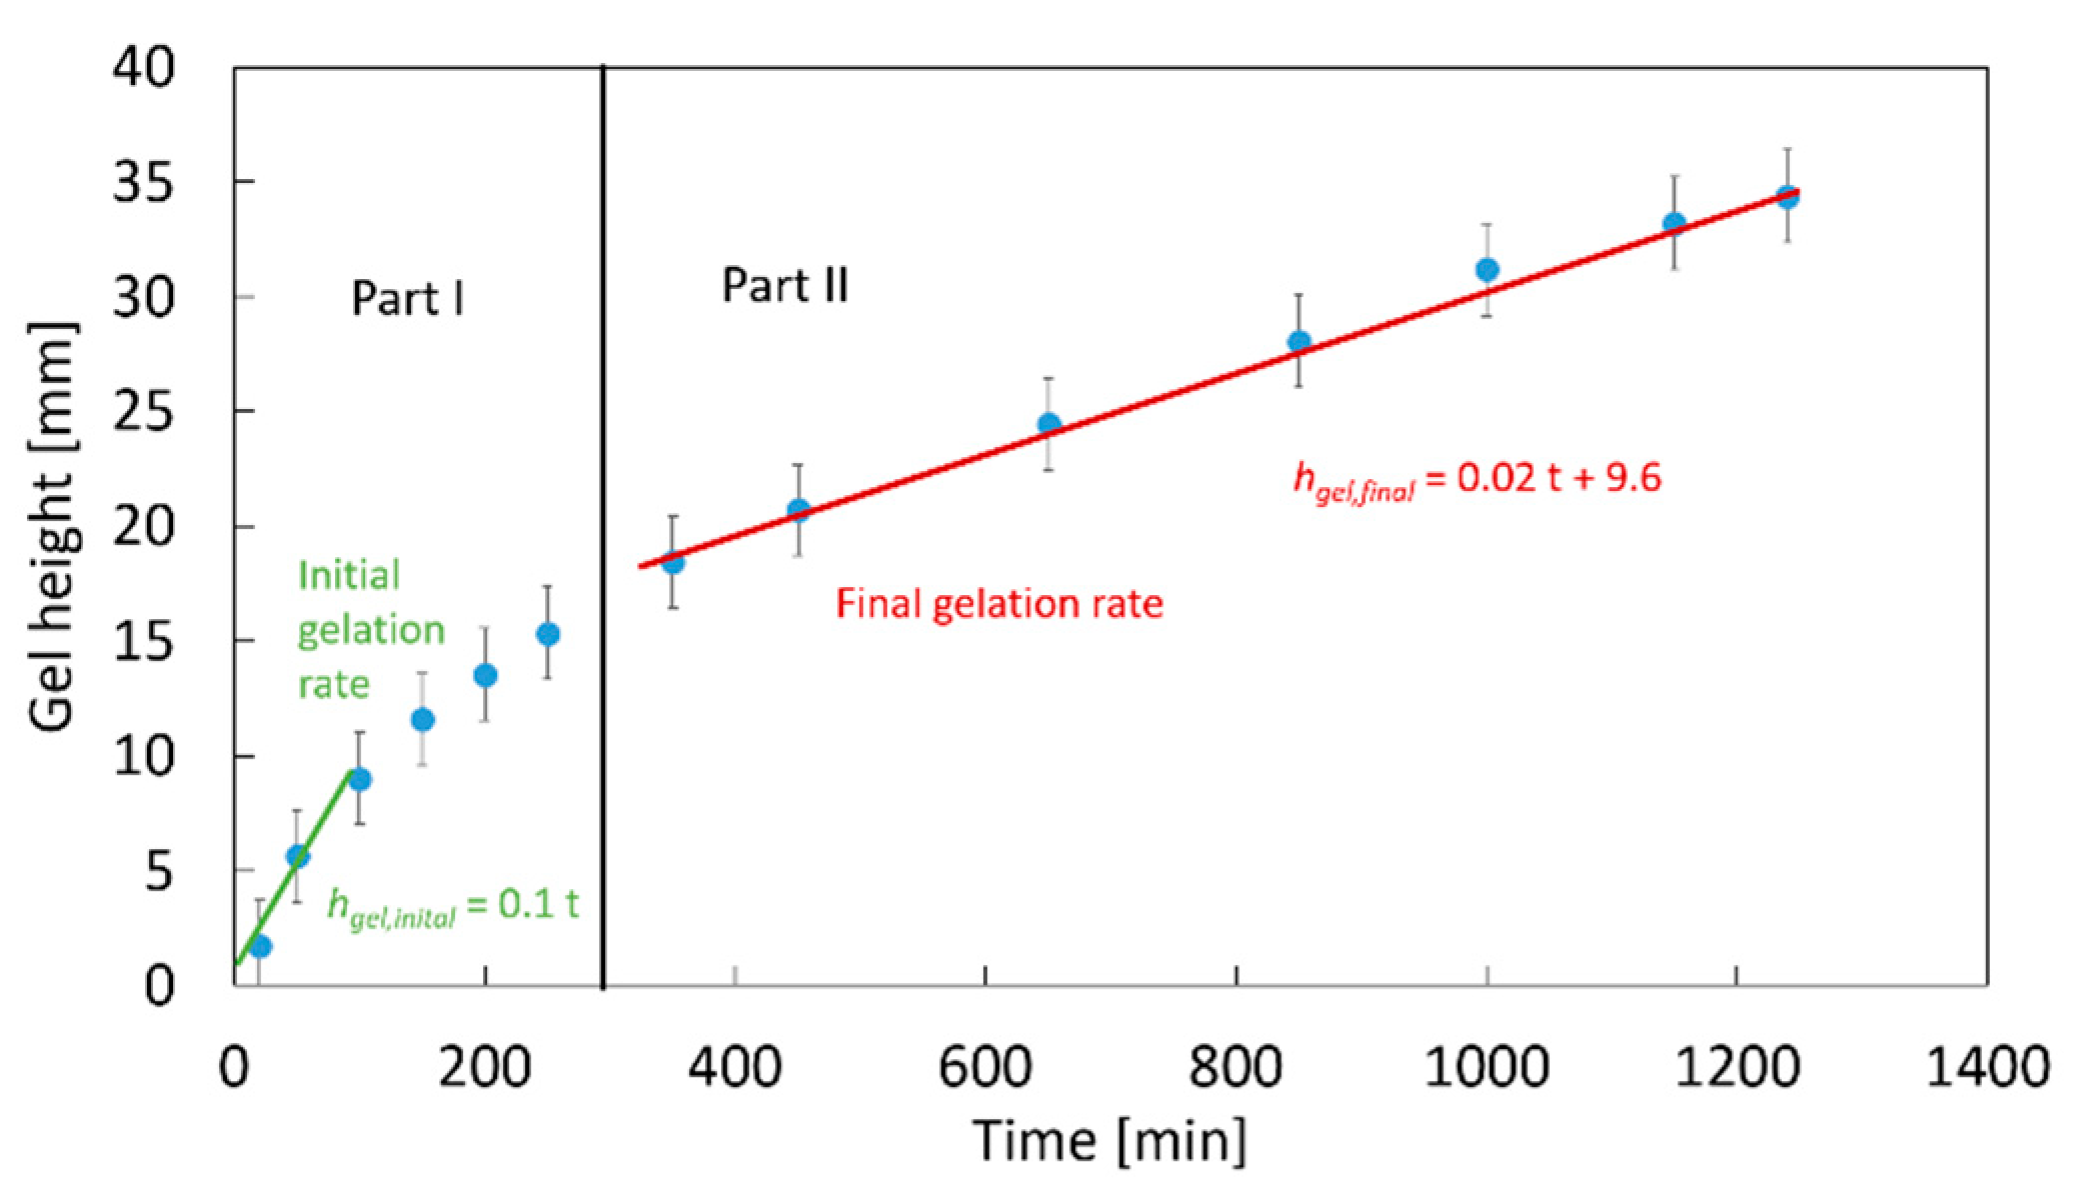
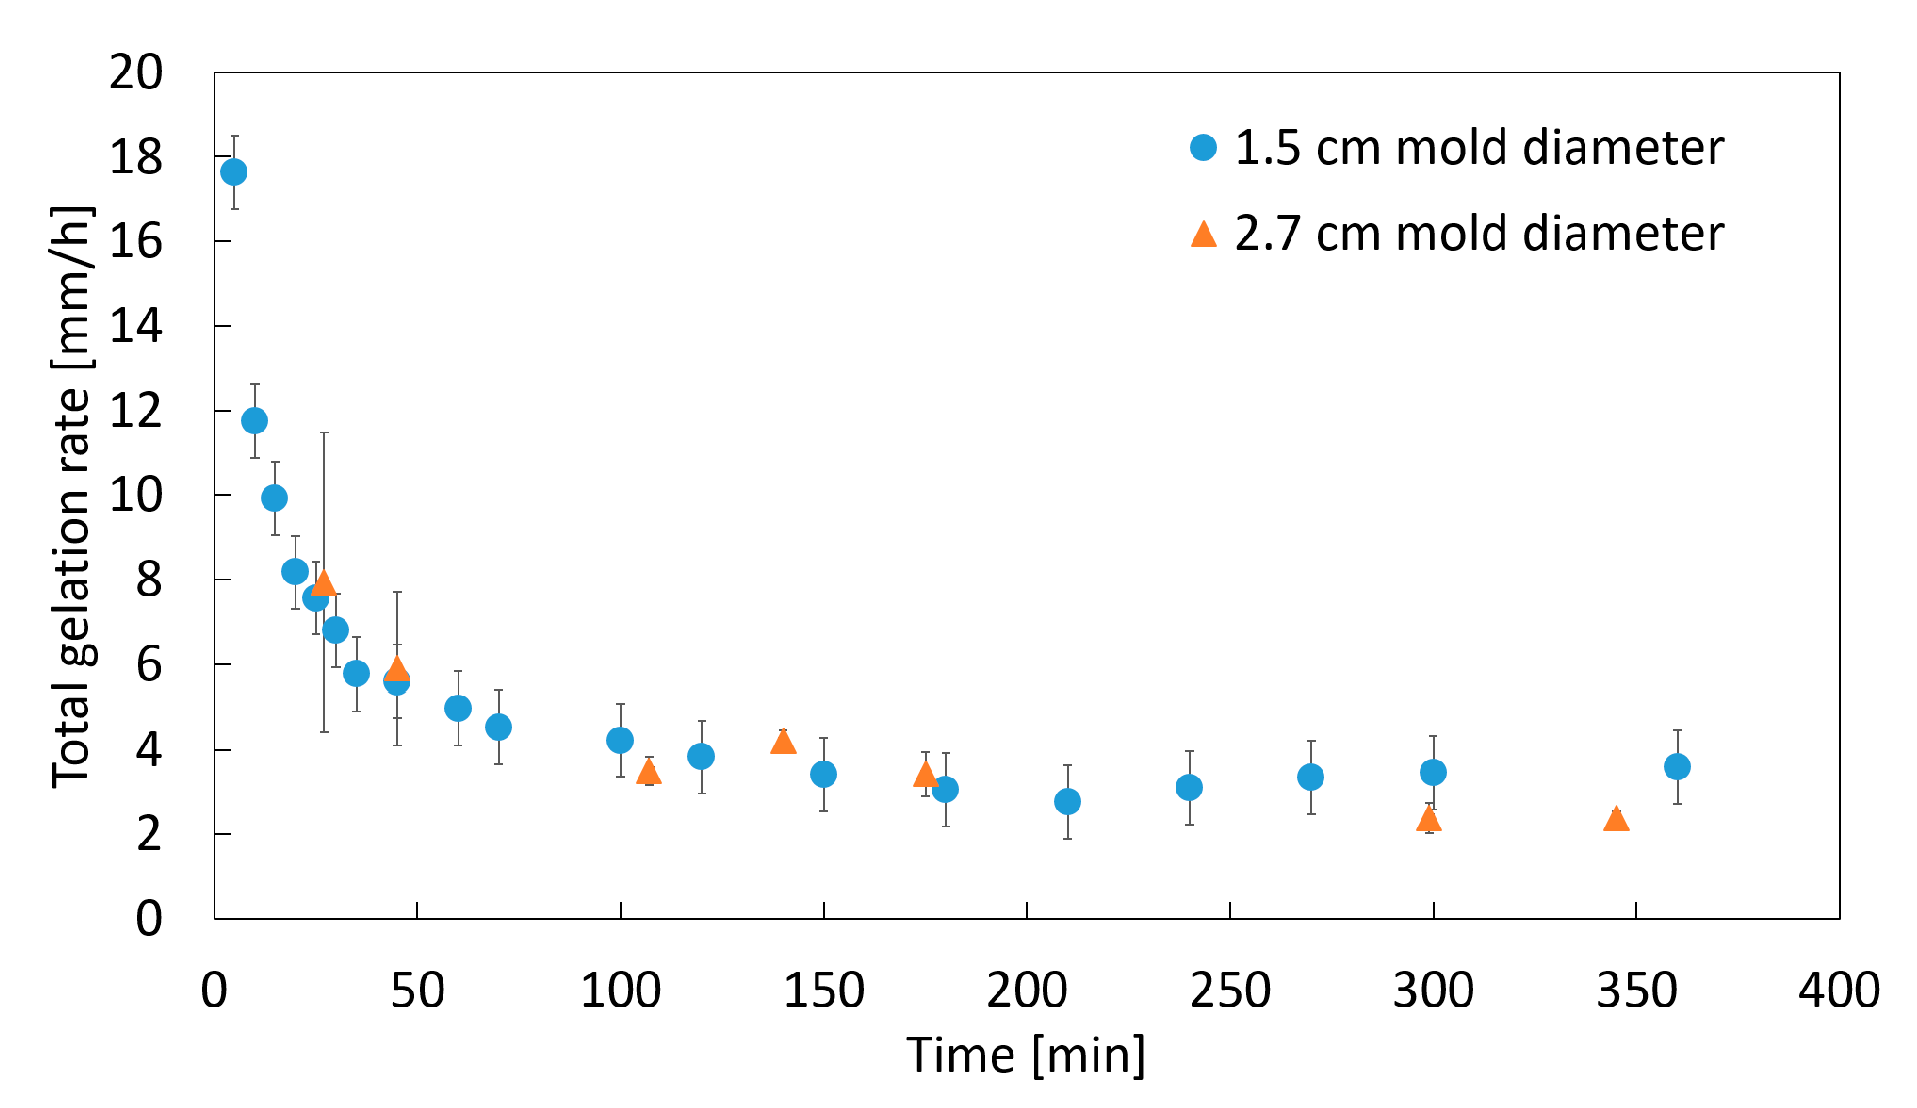
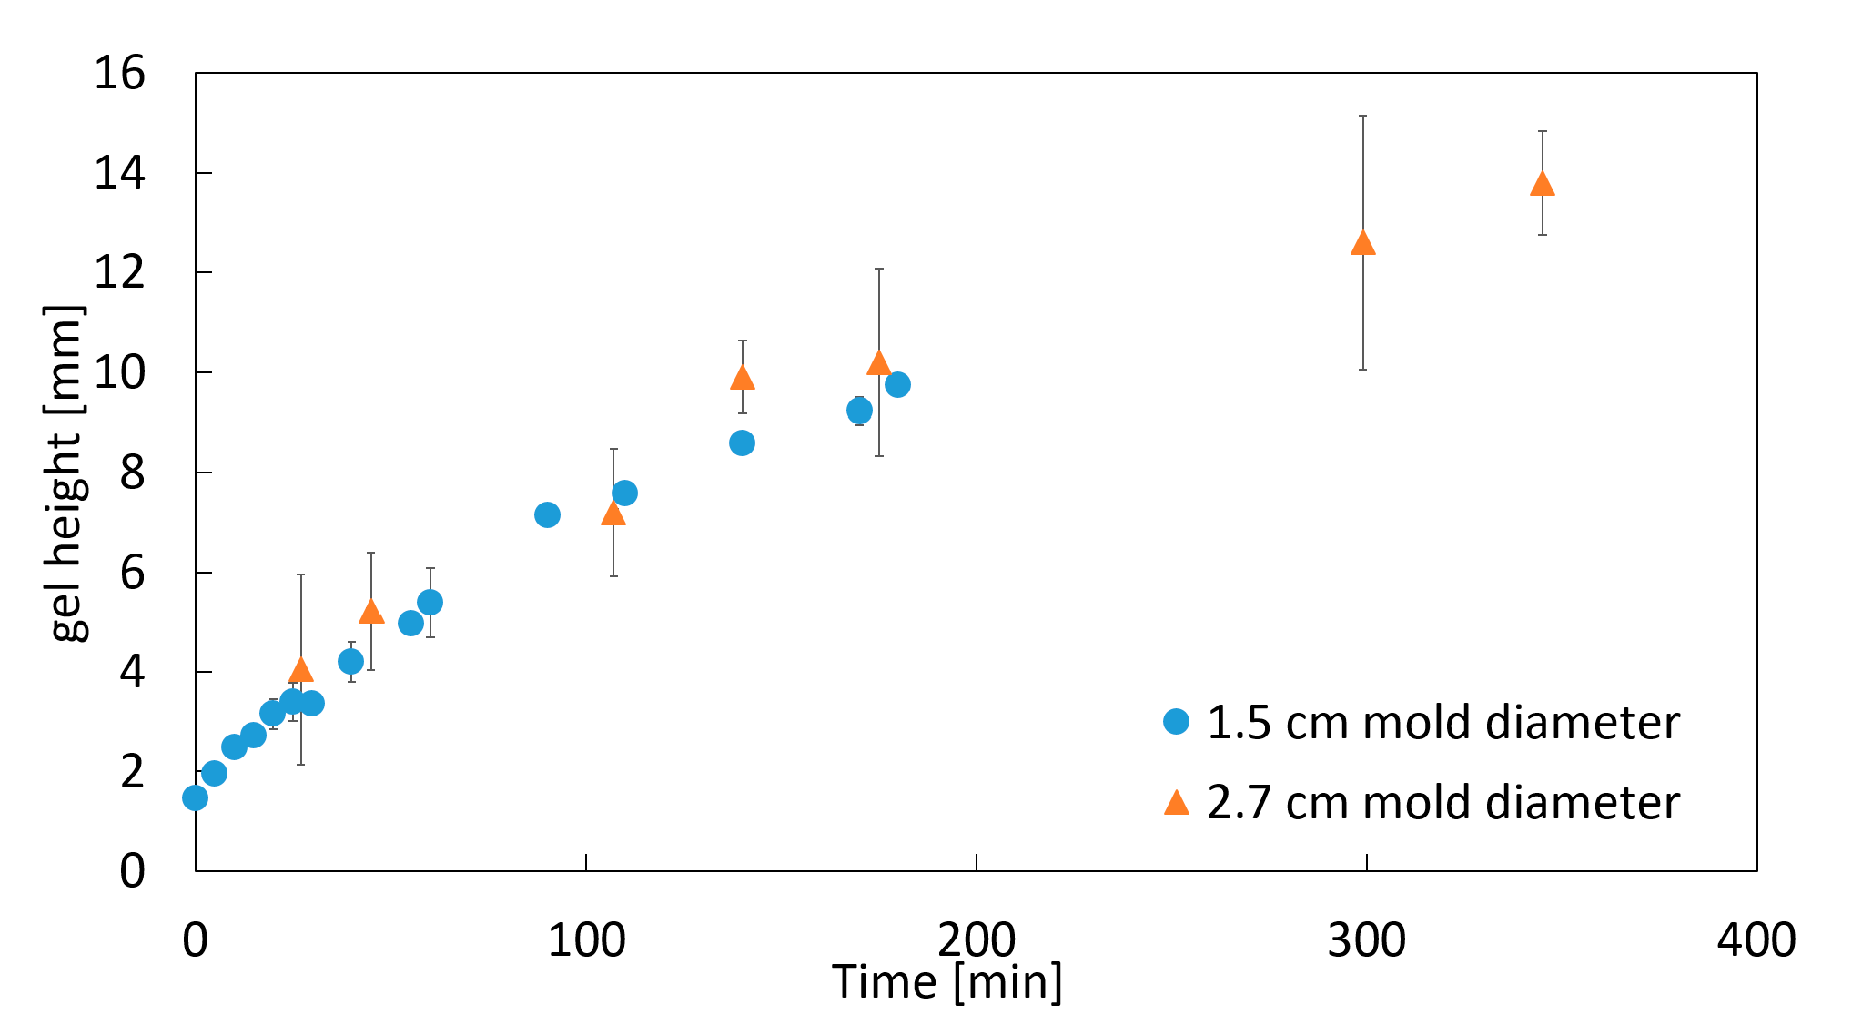
2. Results and Discussion

In this section, the developed in situ measurement methods for the investigation of the overall gelation mechanism of the CO2-induced gelation of biopolymer solutions are presented. Subsequently, the possibilities of investigations of different impact factors as well as the obtained results and the findings for the overall gelation mechanism of the model system are discussed.
The dissolution of the additional cross-linker (step 1–4, Figure 1) and, therefore, the overall gelation mechanism (step 1–5) are studied with in situ optical observation in spatial and temporal resolution. The change in the pH value (step 1–3) is measured in situ with high-pressure fluorescence pH sensor in the amidated pectin solution in spatial and temporal resolution under high-pressure CO2.
Due to uncertainty of actual location of the reaction of CO2 with water and dissociation of carbonic acid, in the following, the diffusion of all carbon-containing species and protons is summarized under one umbrella term of “diffusion of CO2”.

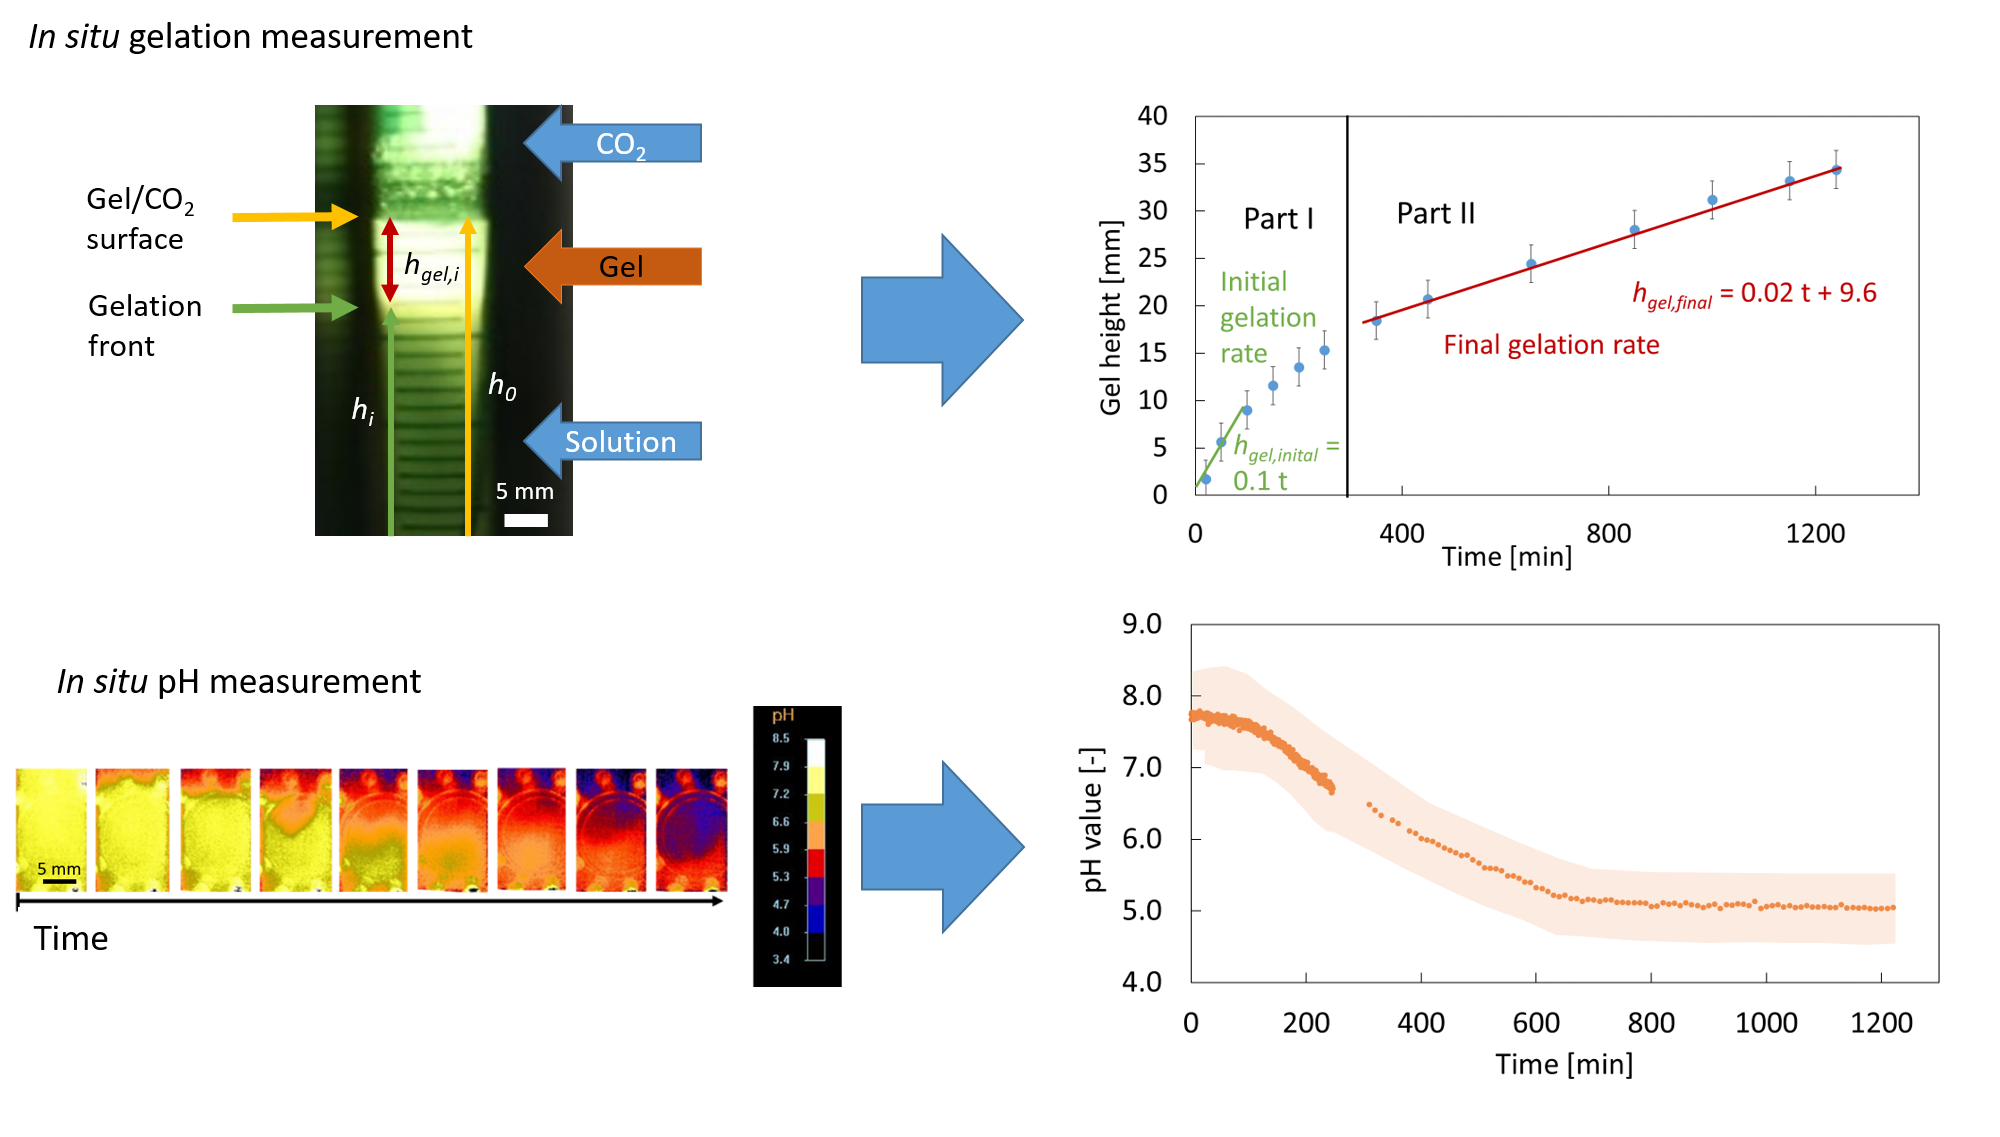
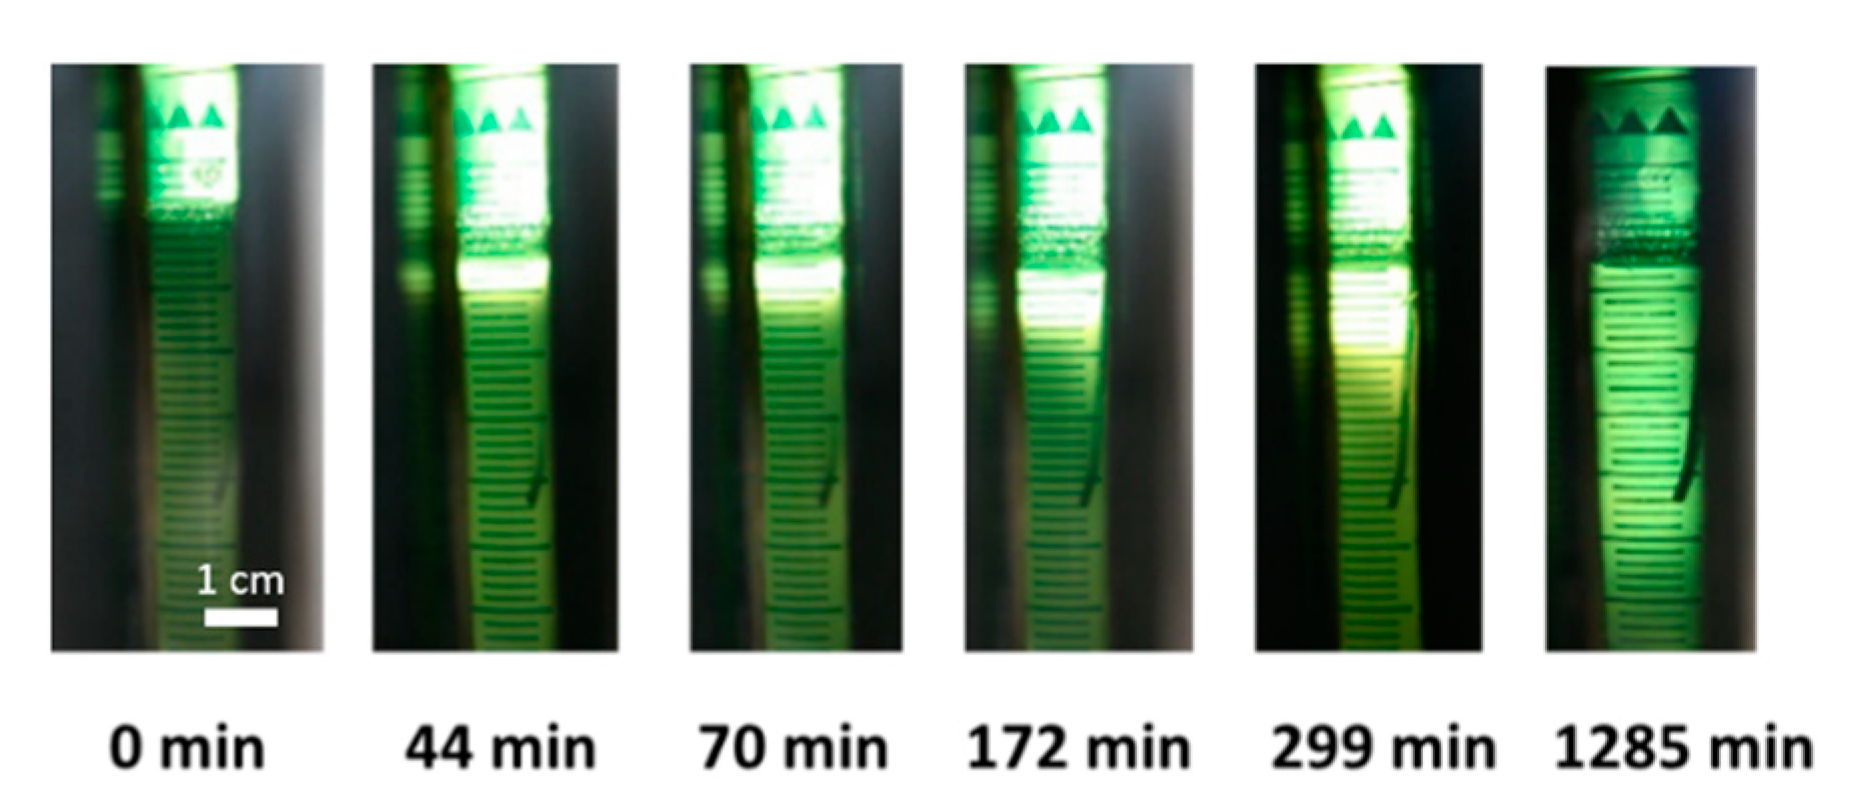
2.1. Optical Measurement of the CaCO3 Dissolution and Gelation

The change in the solution turbidity during CO2-induced gelation of amidated pectin solutions in the presence of suspended CaCO3 particles is observed in situ over time as shown in Figure 2. A graduate clearance of the suspension from the top of the mold (contact area with CO2 gas phase) to the bottom of the mold is observed. This clearance indicates the dissolution of the CaCO3 particles, and therefore, the gelation of the pectin solution due to cross-linking of pectin chains with released calcium ions.
To prove the assumption that cross-linking with calcium ions (step 5, Figure 1) is much faster than dissolution (step 4), the gelation process is stopped for certain experiments by depressurization, while a gelation front could still be observed between a clear upper and a turbid lower part of the sample. After complete depressurization, the structure of the different regions is evaluated. The clear part consists of a completely gelled, self-supporting hydrogel, whereas, the turbid part is partly liquid and partly formed very weak gel, indicating that CaCO3 dissolution already started, but no complete gelation has yet occurred. Due to these findings and due to the fact that ionic reactions are usually very fast, it is assumed in the following work that the clearance is a direct indication of the occurred gelation. Therefore, the surface between the clear gel and the still turbid solution is defined as the gelation front in this work.
Optical observation of the gelation process over time at 50 bar reveals that gelation occurs from the top of the solution, where it is in contact with the CO2 gas phase, to the bottom of the solution (Figure 2). This indicates a one dimensional, vertical diffusion of CO2 from the top to the bottom of the polymer solution, resulting in dissolution of the CaCO3 particles and therefore vertical movement of the gelation front. This vertical movement of the gelation front, in comparison to homogeneous gelation, indicates that gelation is much faster than CO2 diffusion inside the sample. As soon as CO2 reached a non-gelled part of the solution, gelation occurs. Therefore, later on, CO2 has to diffuse through the already-formed gel at the top of the sample.
For the evaluation and quantification of the gelation process, the height of the clear gel is measured as a function of time (Figure 3), with the slope being the process gelation rate r g e l , p e r i o d   (Equation (4)). Two regions can be identified in Figure 3: a strong increase in the gel height at the beginning of the process (part I) and, later, a nearly-linear increase in the gel height (region of constant gelation rate; part II).
The slope of linear part II is defined as the final gelation rate r g e l ,   f i n a l . The calculated total gelation rates (Equation (3)) over time are shown in Figure 4. The total gelation rate is high at the beginning of the gelation process, where the gelation front is close to the contact area with gaseous CO2, and it decreases strongly over time to a nearly constant gelation rate, with the propagation of the gelation front towards the bottom of the sample. The decrease in the gelation rate indicates an increasing resistance for the diffusion of CO2 through the already formed gel structure at the top of the solution in comparison to transport through the initially liquid phase.

2.1.1. Impact of the Mold Material

To account for eventual diffusion of CO2 through the walls of the mold, two different types of molds are tested: polyethylene and glass molds. In the case of open polyethylene molds, after some time, additional clearance of the sample solution occurs at the sides and the bottom of the mold. To prove the possibility of diffusion through polyethylene material, additional gelation experiments are performed with closed lids for the polyethylene molds. For the closed lid polyethylene molds, after some time, a clearance of the solution can be observed, pointing to the CO2 diffusion through the mold material. For glass molds, no side diffusion can be observed. The significance of the effect of side diffusion depended on the material of the mold, its wall thickness and the total gelation duration (due to sample’s height).
These observations show that for the detailed investigation of the gelation mechanism, an impermeable mold material should be used to reduce overlapping of different process steps due to ongoing three dimensional “side” gelation. Furthermore, enforcing one dimensional diffusion and gelation front movement simplifies the identification of impact factors such as changing viscosity and buffering effects, as discussed later on.

2.1.2. Impact of the Mold Diameter

To prove the assumption of one-dimensional diffusion of CO2 in the vertical direction, the mold diameter is varied to change the contact area between the sample and gaseous CO2. Neither the increase in the gel height nor the change in the gelation rate over time is influenced by the diameter of the mold (Figure 4 and Figure 5). These observations prove the assumption of a one dimensional, vertical diffusion of CO2 inside the amidated pectin solution.

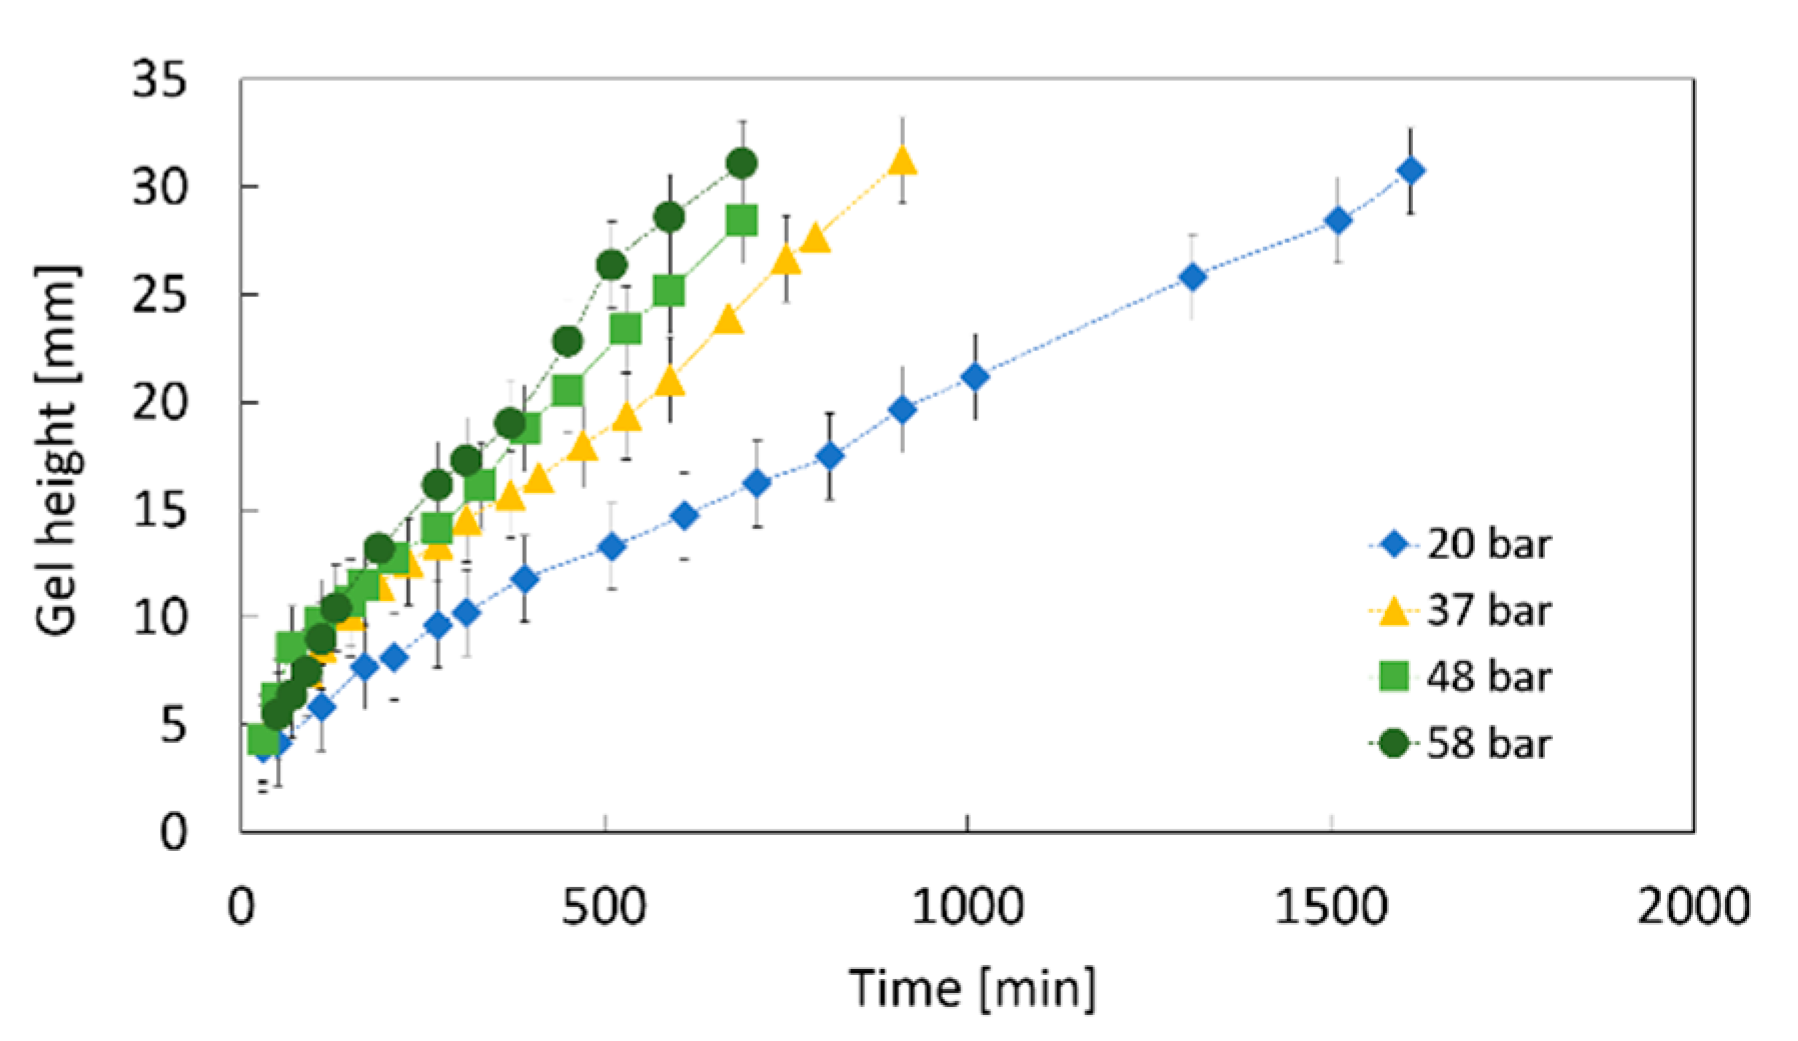
2.1.3. Impact of the CO2 Pressure

The influence of the CO2 pressure on the gelation process is investigated, since it determines the CO2 solubility in the biopolymer solution (step 1, Figure 1). The increase in the gelation height over time is shown in Figure 6 for four different pressures ranging from 20 to 58 bar. The highest gelation rate is observed at the highest pressure. At the same time, for the first ca. 200 min of the process the gelation rate does not vary significantly with pressure. This indicates that at the beginning of the process, the CO2 is dissolved rapidly causing fast gelation at the top of the solution. From a certain height onward, the progressively growing gel layer begins to hinder diffusion of CO2 into lower parts of the solution. The results shown in Figure 6 indicate that for pressures between 37 and 58 bar the critical height of the gel layer is reached after ca. 200 min. At this point, the diffusion of the CO2 is hindered so much that the CO2 solubility begins to have an impact on the further gel formation. Thus, at lower pressures, i.e., with lower CO2 concentrations at the top of the solution, the CO2 diffusion rate decreases as a result of a lower concentration gradient [30].
At 20 bar, a remarkably lower gelation rate is observed directly from the beginning of the process. This indicates that the CO2 solubility is so low at this pressure that already a thin gel layer represents a significant hindrance for CO2 diffusion. For comparison reasons, the CO2 solubility in pure water is shown in Table 1 for studied pressures (values calculated from the Henry’s dissolution constant H C P = 3.3 × 10 4 mol m 3 Pa from reference [31] at 25 °C as:
  c =   H C P · P CO 2 ,
where c is the concentration of CO2 in pure water and P CO 2 is the partial pressure of CO2 in the gas phase.

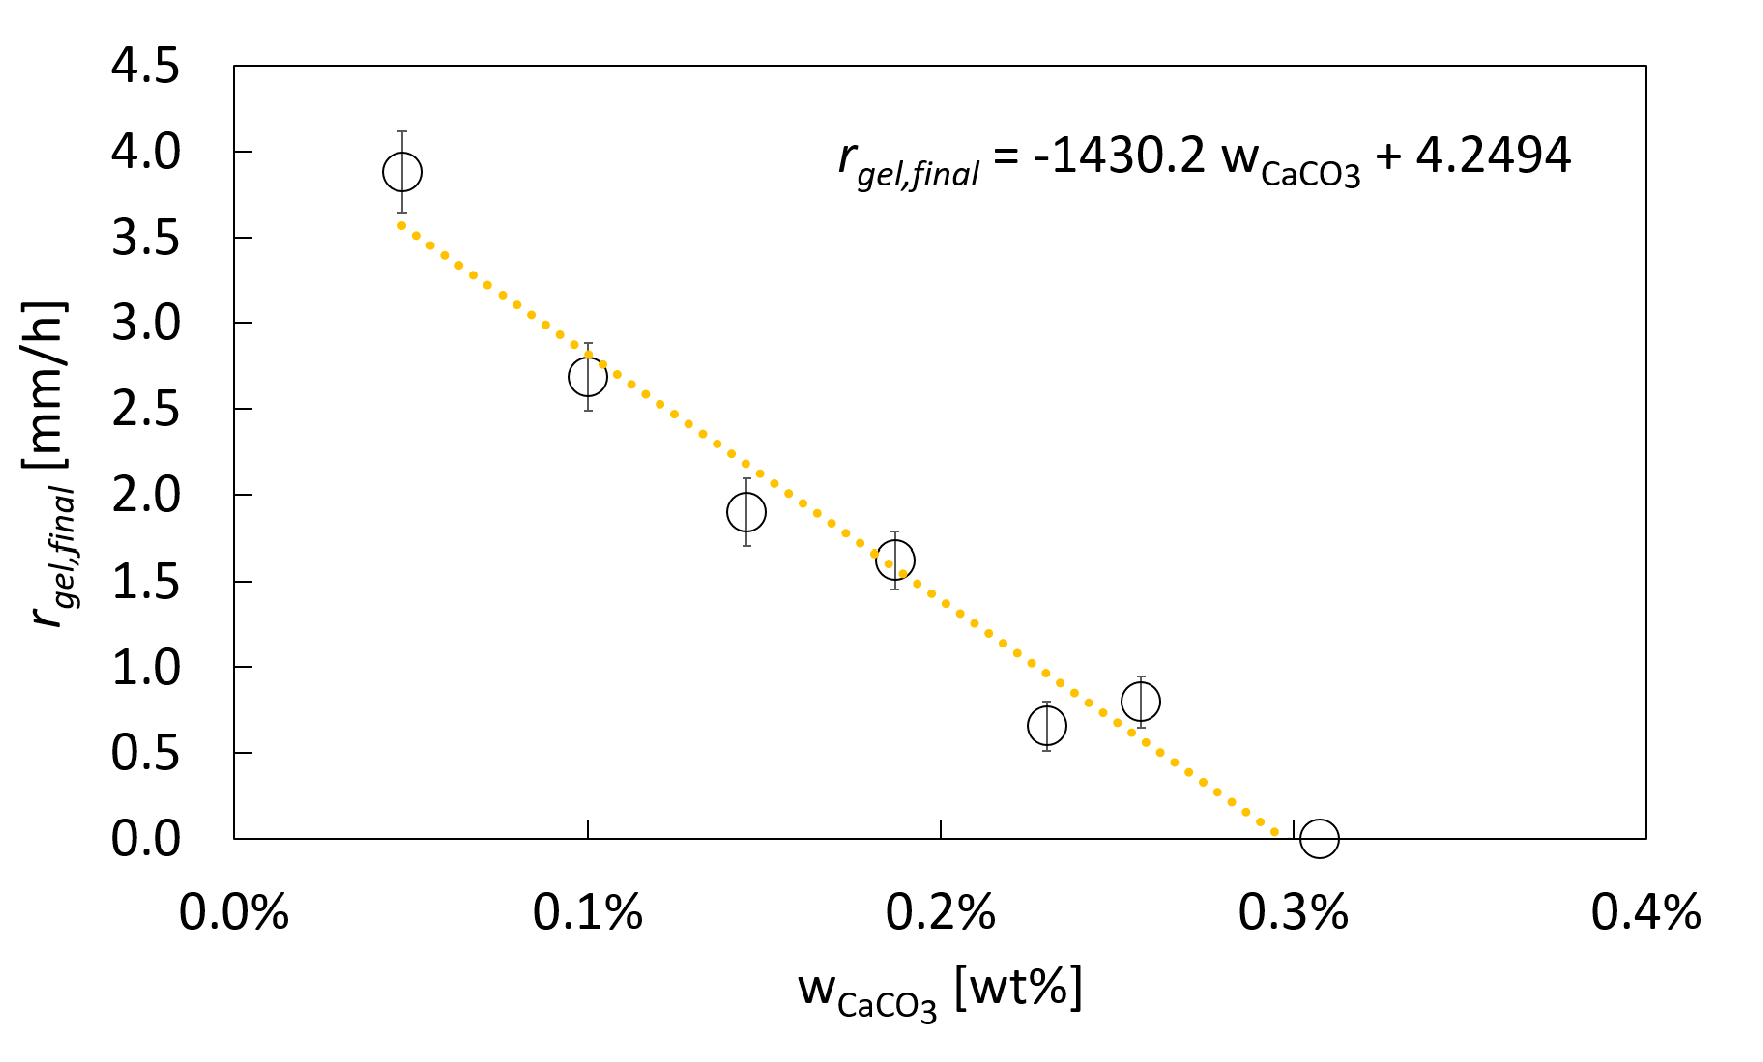
2.1.4. Impact of the CaCO3 Concentration

To evaluate the impact of dispersed CaCO3, solutions with different CaCO3 concentrations are studied with respect to the gel formation and final gelation rate. As shown in Figure 7, the final gelation rate decreases approximately linearly with increasing CaCO3 concentration. This can be explained by the fact that the visual observation of the gelation is, strictly speaking, an observation of the dissolution of the CaCO3 particles. During the dissolution of CaCO3, the pH system is buffered by the reaction of released CO32− ions with the protons to HCO3 [19] (Figure 1), decreasing the amount of free protons. Diffusion of more protons towards the gelation front is required for further dissolution of CaCO3 and ongoing pH change. At higher CaCO3 concentrations, this buffering effect is more pronounced so that it takes longer to dissolve all dispersed CaCO3. The approximately linear relation between the initial CaCO3 concentration and the final gelation rate (Figure 7) indicates that the dissolution kinetics of single particles are barely influenced, but only the increase in the total amount of CaCO3 and therefore the increased need of protons due to stoichiometric reaction causes the decrease in the final gelation rate. For initial CaCO3 particle concentrations close to solubility (at process parameters), a lower driving force for dissolution may have an additional impact on the decreased dissolution rate. Hence, a decrease in the final gelation rate occurs with increasing CaCO3 concentration up to the solubility of CaCO3 in water (0.29 wt.-% at 50 bar CO2 and 25 °C; see [22]). If the initial CaCO3 concentration is taken above the solubility reached throughout the process, dissolution and gelation process still take place, but cannot be observed anymore due to disturbing residual turbidity of the resulting gels.
With the presented method, no quantification of the amount of dissolved CaCO3, besides indication of complete gelation, is possible. In situ quantification of the solution turbidity and the therefore determination of the residual amount of CaCO3 is part of our future work to identify the actual cross-linking degree inside the sample at any time and with spatial resolution. Nevertheless, to obtain homogeneous gels, it is recommended to define the cross-linking degree beforehand by the initial CaCO3 concentration and perform the gelation process until complete dissolution.
Thus, it could be shown that the kinetics of the cross-linker dissolution have a major impact on the kinetics of the overall gelation mechanism of the biopolymer solution.
The developed method of in situ optical investigation of the gelation process with temporal and spatial resolution enables the detailed investigation of the dissolution and gelation mechanism (step 4 and 5, Figure 1) of the CO2-induced gelation. Impact factors such as pressure, composition, and gel formation throughout the gelation process on the kinetics of the overall gelation process can be identified and evaluated.
The optical observation of the gelation system is applicable for all systems with a change in optical appearance, making this method potentially transferable to systems with such a behavior.

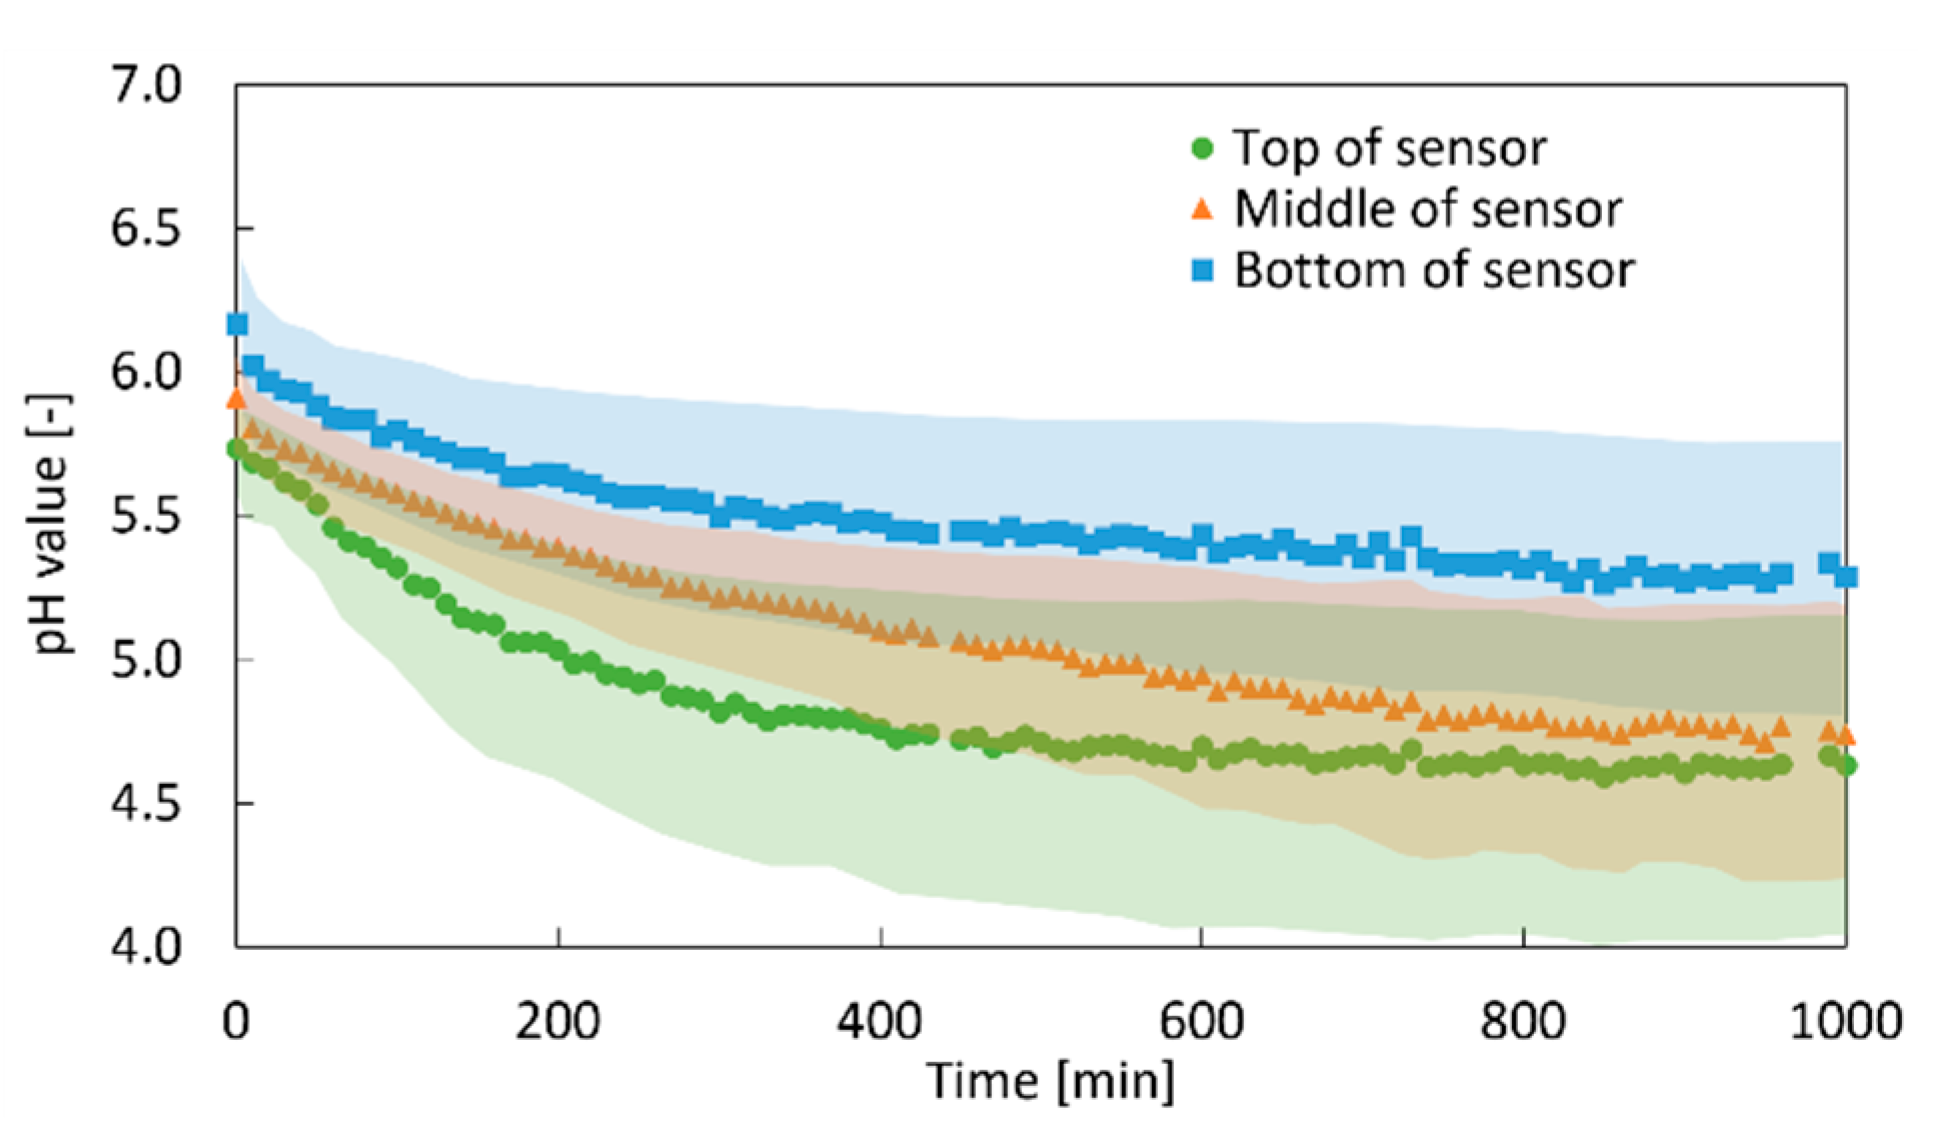
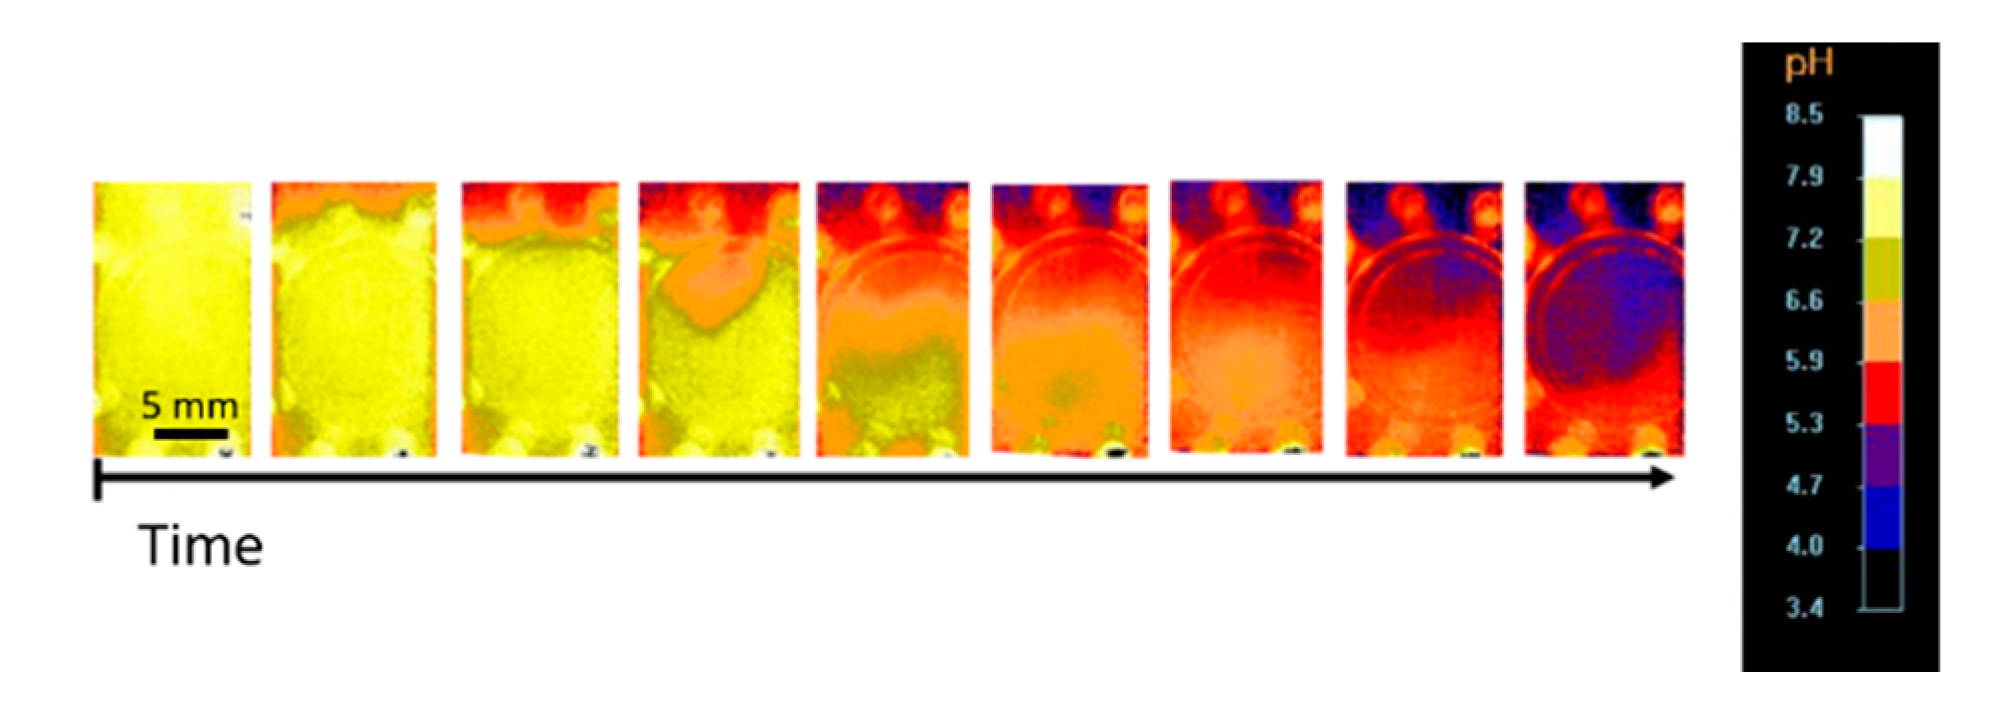
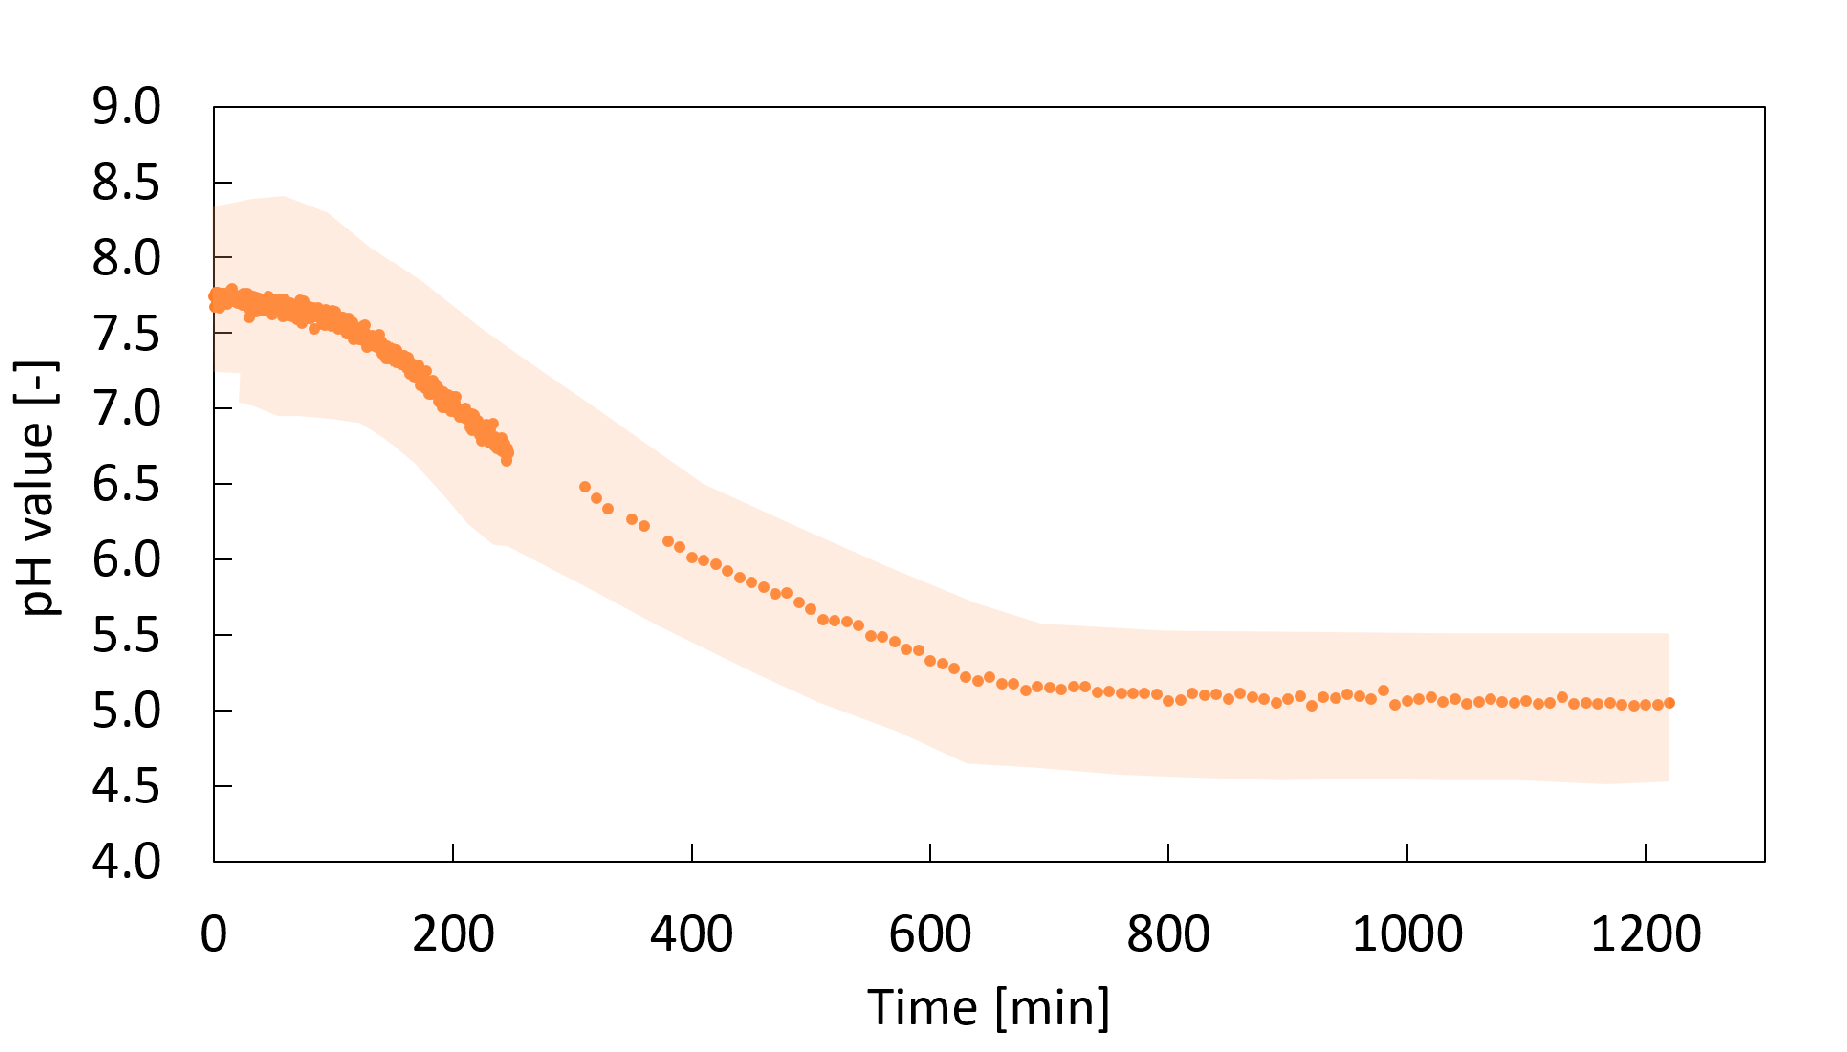
2.2. In Situ pH Measurement

The pH value of the gelation sample is measured in situ in temporal and spatial resolution inside samples in contact with high-pressure CO2 atmosphere using an optical fluorescence system. Pictures of the fluorescence sensor after superimposing the pH value from fluorescence data are shown in Figure 8. At the beginning of the process, a neutral pH value is present in the entire sample as adjusted during solution preparation. The pH value decreases over time from the top of the solution, where it is in contact with gaseous CO2, to the bottom, in a good agreement with the one dimensional vertical diffusion of CO2 in the sample throughout gelation observation; see Section 2.1.
The quantified change in the averaged pH value as a function of time is shown in Figure 9 for a sample of amidated pectin. The pH value decreases from the initial value of around 7.5 to a final, equilibrium pH value of 5.0, indicating dissociation of carbonic acid formed from dissolved CO2. The final pH value of 5.0 is sufficient for CaCO3 dissolution as it is described in Section 2.1. Although the error margin is comparably high, the trend of the pH value over time can be observed clearly. The equilibrium pH value of 5.0 at 50 bar is in good agreement with literature of the ternary water–CO2–CaCO3 system [19].
To determine the change in the pH value with spatial resolution over the sample height, the evaluation of the pH measurements is conducted at different positions of the fluorescence sensor. The results for three regions of the sample (top, middle, bottom) are shown in Figure 10. The pH value starts decreasing at the top of the sensor, followed by the middle part and the bottom part. Although the error margins shown in Figure 10 are large, the trend is clear and consistent with the data obtained from the pH sensor in Figure 8 and the gelation front measurement in Section 2.1. It should be noted that the pH value in the lower regions starts decreasing even before the final pH value is reached at the top of the gel. This indicates that CO2 diffuses to lower parts even when CaCO3 is not completely dissolved in the upper layers. However, the amount of CO2 reaching lower parts is not sufficient to dissolve much of the CaCO3 (Section 2.1) until complete gelation of upper parts. At the end of the gelation process, when the sample is completely gelled, a pH value of 5.0 is reached in the entire sample (data not shown).

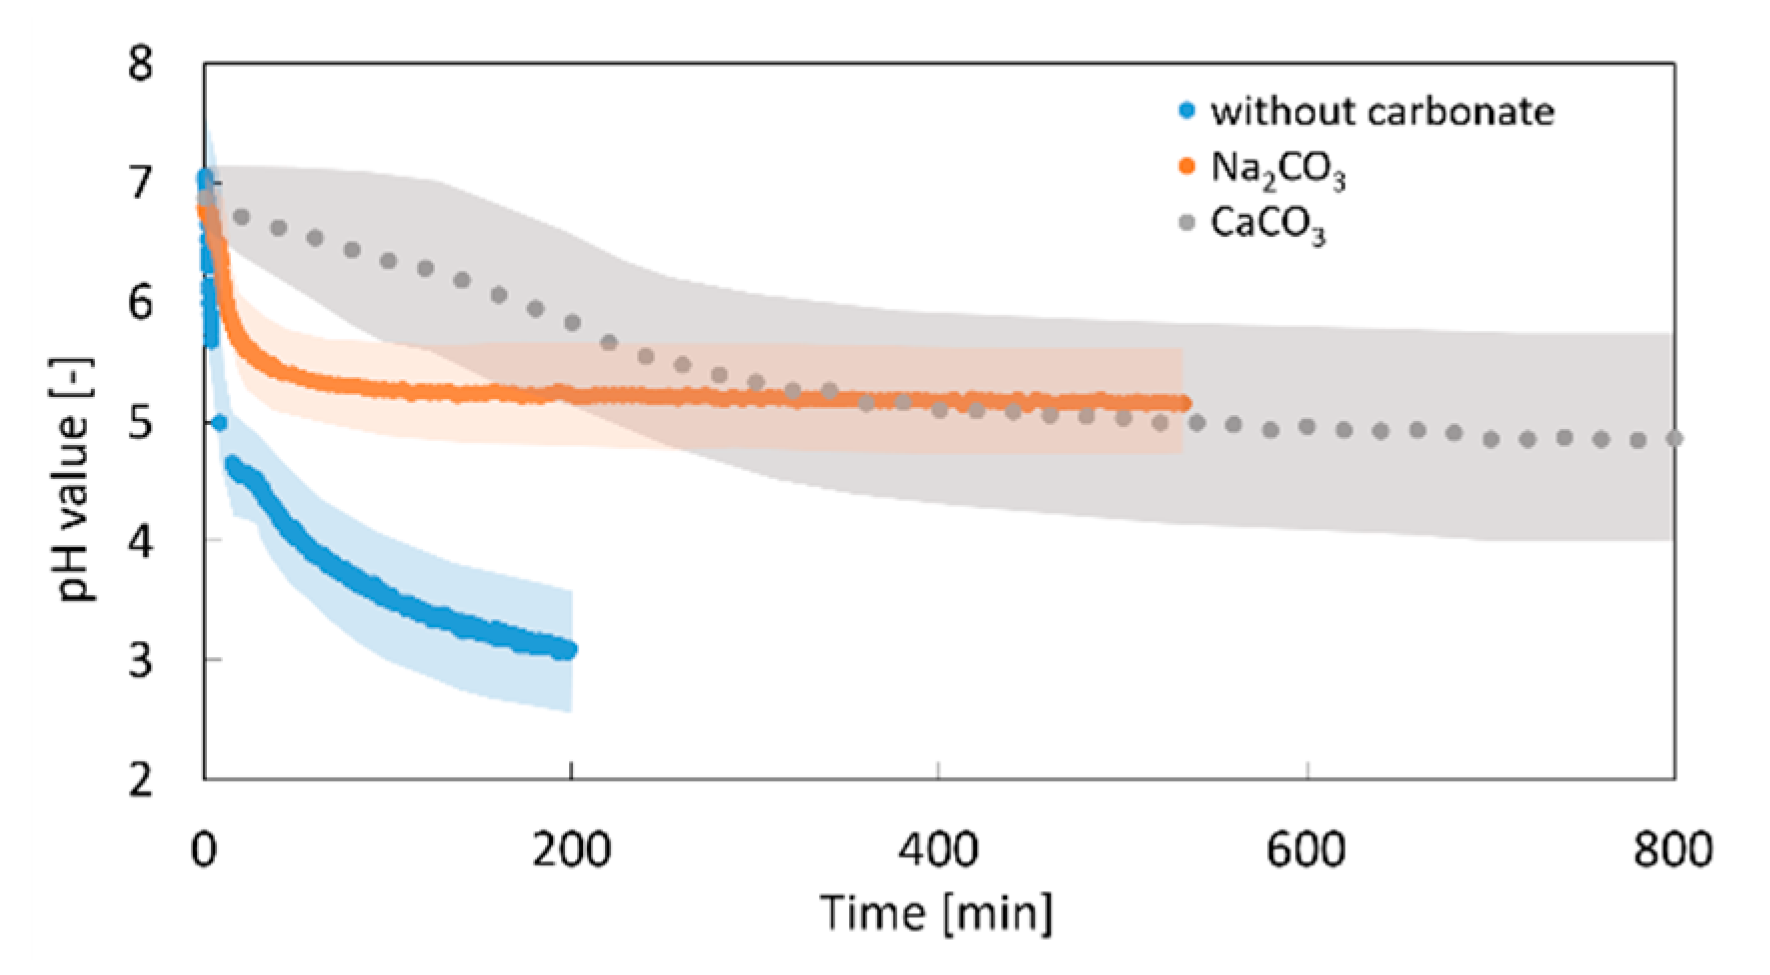
2.2.1. Impact of the Additional Carbonate

Two modifications of the experiments are performed to evaluate the impact of CaCO3 particles on the evolution of the pH value. First, gelation experiments without CaCO3 were conducted, wherein no gelation occurred. Second, substitution of the CaCO3 by sodium carbonate (Na2CO3) is undertaken to study a pure impact of carbonate ions without interference from the gelation and CaCO3 dissolution process. The change in the pH value with time in the presence of calcium and sodium carbonates is shown in Figure 11. In this case, the final pH value of the pectin system decreases to approx. 5.0. In contrast, in the system without any additional carbonate ions (excluding the ones formed by the equilibrium of CO2 and water), the pH value drops to 3.1. This is in good agreement with the literature values for the binary CO2–water reaction systems at 50 bar [32,33]. The result proves that CO32− ions released from dissolution of CaCO3 or free CO32− ions from dissociation of Na2CO3 react with free protons and impact the CO2–water reaction equilibrium, demonstrating a buffering effect as shown in the literature for ternary water–CO2–CaCO3 systems [19,28].
In the case of Na2CO3, i.e., with free CO32− ions, the pH drop occurs rapidly at the beginning of the process (Figure 11). On the other hand, for dispersed CaCO3 a decrease in the pH value is much slower. This might be explained by two different effects: (1) diffusion of CO2 in progressively emerging high viscous gel is slowed down (see Section 2.2.2); (2) The CO2 diffusion rate is slowed down by the CaCO3 dissolution kinetics. Nevertheless, the effect of the CaCO3 concentration in the range 0.05–0.23 wt.-% on the pH development kinetics is rather small (data not shown).

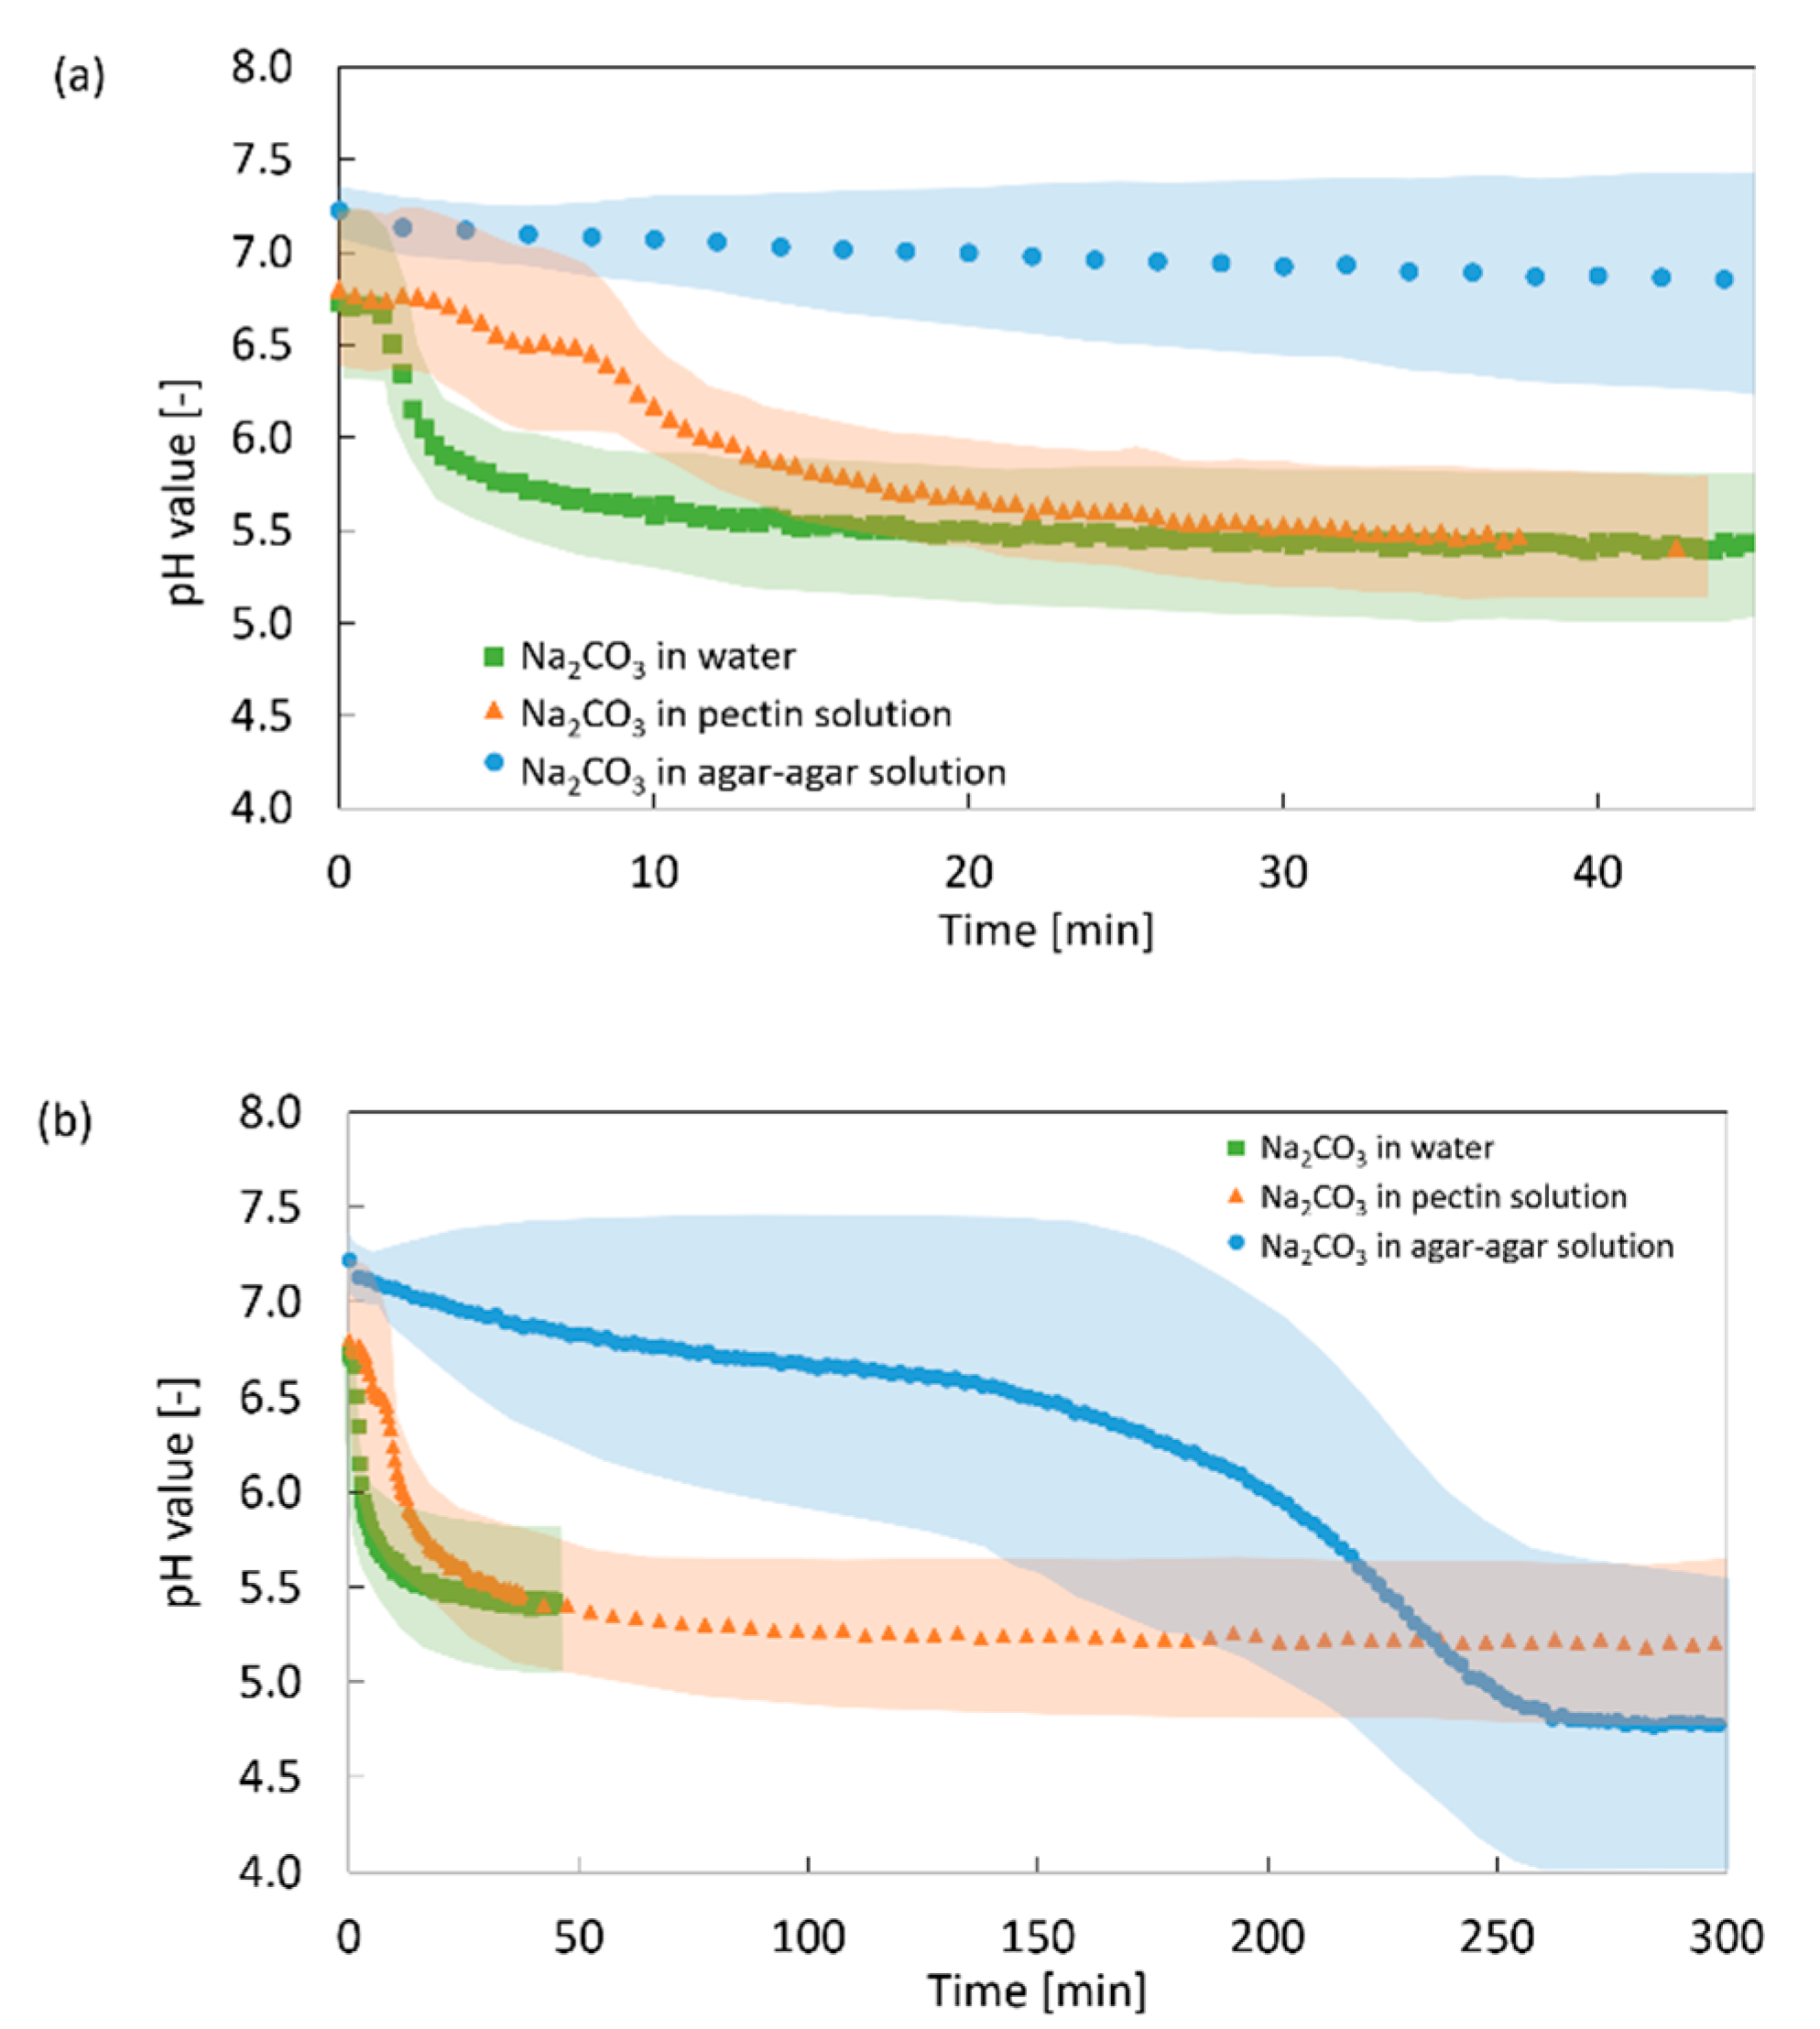
2.2.2. Impact of the Solution Viscosity

To investigate the impact of emerging gel layer and concomitant increase in viscosity η, three systems with different viscosities are compared. The presence of CO32− ions was realized by addition of Na2CO3. No gelation takes place due to the absence of Ca2+ and thus the viscosity is expected to be constant throughout the process and over the entire sample.
The development of the pH value in water (η = 1 mPas), 1 wt.-% amidated pectin solution (η = 30 mPas), and 1 wt.-% agar–agar solution (η = 1000 mPas) is shown in Figure 12 as a function of time in the presence of CO2 at 50 bar. For solutions with higher viscosity, the pH drop is slowed down, indicating the hindrance of CO2 diffusion, which is in agreement with general dependence of the diffusion coefficient in the liquid phase on its viscosity according to the Stokes–Einstein equation D A B ~ 1 η . The same impact of the solution viscosity on the pH development is also obtained for systems without additional carbonate sources (data not shown).
In the case of gelling systems, the impact of the hindrance due to increasing viscosity and gel formation is more complex. As discussed in Section 2.1, gelation is much faster than diffusion of CO2 (including diffusion of carbonate containing species of HCO3 and CO32− and H+), resulting in gel formation at the top of the sample and progression of the gelation front to the bottom instead of homogeneous gelation throughout the sample. The formed gel layer hinders diffusion and results in slowed down overall gelation process (compare Figure 3 and Figure 4). Due to progressive gelation for the complex system, the resistance for CO2 diffusion is non-homogeneous throughout the sample and changes with time. The complexity of the CO2/water reaction system and the lack of information about the location and characteristic time of CO2 hydration, acid dissociation (and therefore H+ generation), and which species truly diffuse inside the sample complicate the determination of the diffusion rate. Investigation of this more complex case including the quantitative description of CO2 diffusion is the matter of our future work.
The in situ measurements of the pH value at high-pressure CO2 atmosphere in spatial and temporal resolution enable the investigation of the gelation mechanism step 3 of the overall gelation process (Figure 1) for the amidated pectin model system. The direction and velocity of CO2 diffusion and the localization of proton release as well as the impact of the dissolution of the CaCO3 are revealed. In combination with the optical observation of CaCO3 dissolution, detailed information about the interactions of steps 3 and 4/5 could be obtained. The developed approach is applicable for the investigation of the impact of single components on the development of pH value. Furthermore, the method is transferable to other gelation systems, currently being restricted to the pH range of 2–8, for which sensors are available.

3. Conclusions

An experimental set-up combining two different in situ measurement methods was developed to study the mechanism of the CO2-induced gelation of biopolymer solutions. The in situ observation of the CaCO3 dissolution as well as the monitoring of the pH value of the amidated pectin as a model system were measured in temporal and spatial resolution in CO2 atmosphere. Both measurements reveal clearly one-dimensional, vertical diffusion of CO2 in the sample from the top (contact area with pressurized CO2) to the bottom of the sample. It could be shown that the observed movement of the gelation front is consistent with a measured pH drop throughout the gelation process. The impact of setting parameters, such as pressure, mold material, sample dimensions, and solution composition including cross-linker concentration on the process steps 3 and 4/5, could be identified using the developed in situ methods.
It could be shown that the gel formation itself has a strong impact on the gelation process. The formation of gel layers at the top of the sample caused the hindrance for the CO2 diffusion and therefore for the ongoing gelation process. These findings showed that different mechanisms govern the process in different parts of the sample at the same time. For the quantification of the overall gelation kinetics, gelation rates were calculated from the increase in the gel height over time. The gelation rates can be used for the estimation of the gelation duration in samples of different sizes and geometries. The impact of different gelation parameters, such as CO2 pressure, solution composition, and geometry and material of the molds on the gelation mechanism, were investigated. It could be shown that the added carbonate directly affects the equilibrium of the CO2–water reaction system and therefore the gelation process. Furthermore, it was shown that the kinetics and mechanisms of different process steps depend strongly on the solution composition (CaCO3 and CO2 content).
Although a few restrictions regarding the change in visual appearance for the optical method and the limited range of the pH measurements reduce the transferability of the presented methods to other biopolymer systems, they can be used for a wide range of reported biopolymer systems to elucidate the impact of single process steps as well as the impact of single components and process parameters on the overall gelation mechanism.

4. Materials

Amidated pectin (degree of esterification: 24%; degree of amidation: 25%) was kindly provided by Herbstreith and Fox KG, Neuenbürg/Württ, Germany. Calcium carbonate was kindly provided by Magnesia GmbH, Lüneburg, Germany. Sodium carbonate (Na2CO3), and agar–agar solutions were purchased from Carl Roth GmbH & Co.KG, Karlsruhe, Germany. Sodium hydroxide (NaOH) was purchased from Th.Geyer, Hamburg, Germany. Sodium chloride (NaCl, food grade) was purchased from Ja! (REWE Markt GmbH), Köln, Germany. CO2 was purchased from AGA gas GmbH, Hamburg, Germany. Deionized water was used for solution preparation. All chemicals were used as received.

5. Methods

5.1. Preparation of Stock Solutions

Amidated pectin (1 wt.-%) was dissolved in deionized water by magnetic stirring and neutralized with 0.5 M sodium hydroxide solution to pH 7. For gelation experiments, calcium carbonate was added to reach a final concentration of 0.05 to 0.23 wt.-% and suspended with a rotor stator homogenizer Heidolph DIAX 900, Heidolph Instruments GmbH & Co.KG, Schwabach, Germany. Agar–agar solution was prepared by dissolution of agar–agar in deionized water by heating up to 95 °C. Biopolymer solutions with 0.18 wt.-% sodium carbonate (Na2CO3) were prepared. Water–salt mixtures of CaCO3 (0.18 wt.-%) and Na2CO3 (0.2 wt.-%) were prepared by homogenizing the salts in deionized water. Sodium chloride (0.5 to 1.8 wt.-%) was added to reach an appropriate ionic strength for the sensor during pH measurements.

5.2. CO2-Induced Gelation

CO2-induced gelation was performed in a custom-made high-pressure viewing cell with two vertical opposite windows (Figure 13). Prepared solutions were poured into cylindrical plastic or glass molds with diameters of 1.5, 2.7 or 2.9 cm and placed into the high-pressure viewing cell for gelation or pressurization. Gelation was performed at 10 to 60 bar in CO2 atmosphere and at room temperature. The pressure was kept constant for minimum 24 h to guarantee a complete gelation of the sample. Depressurization was conducted afterwards with 1–2 bar/min to avoid bubble formation inside the gel.

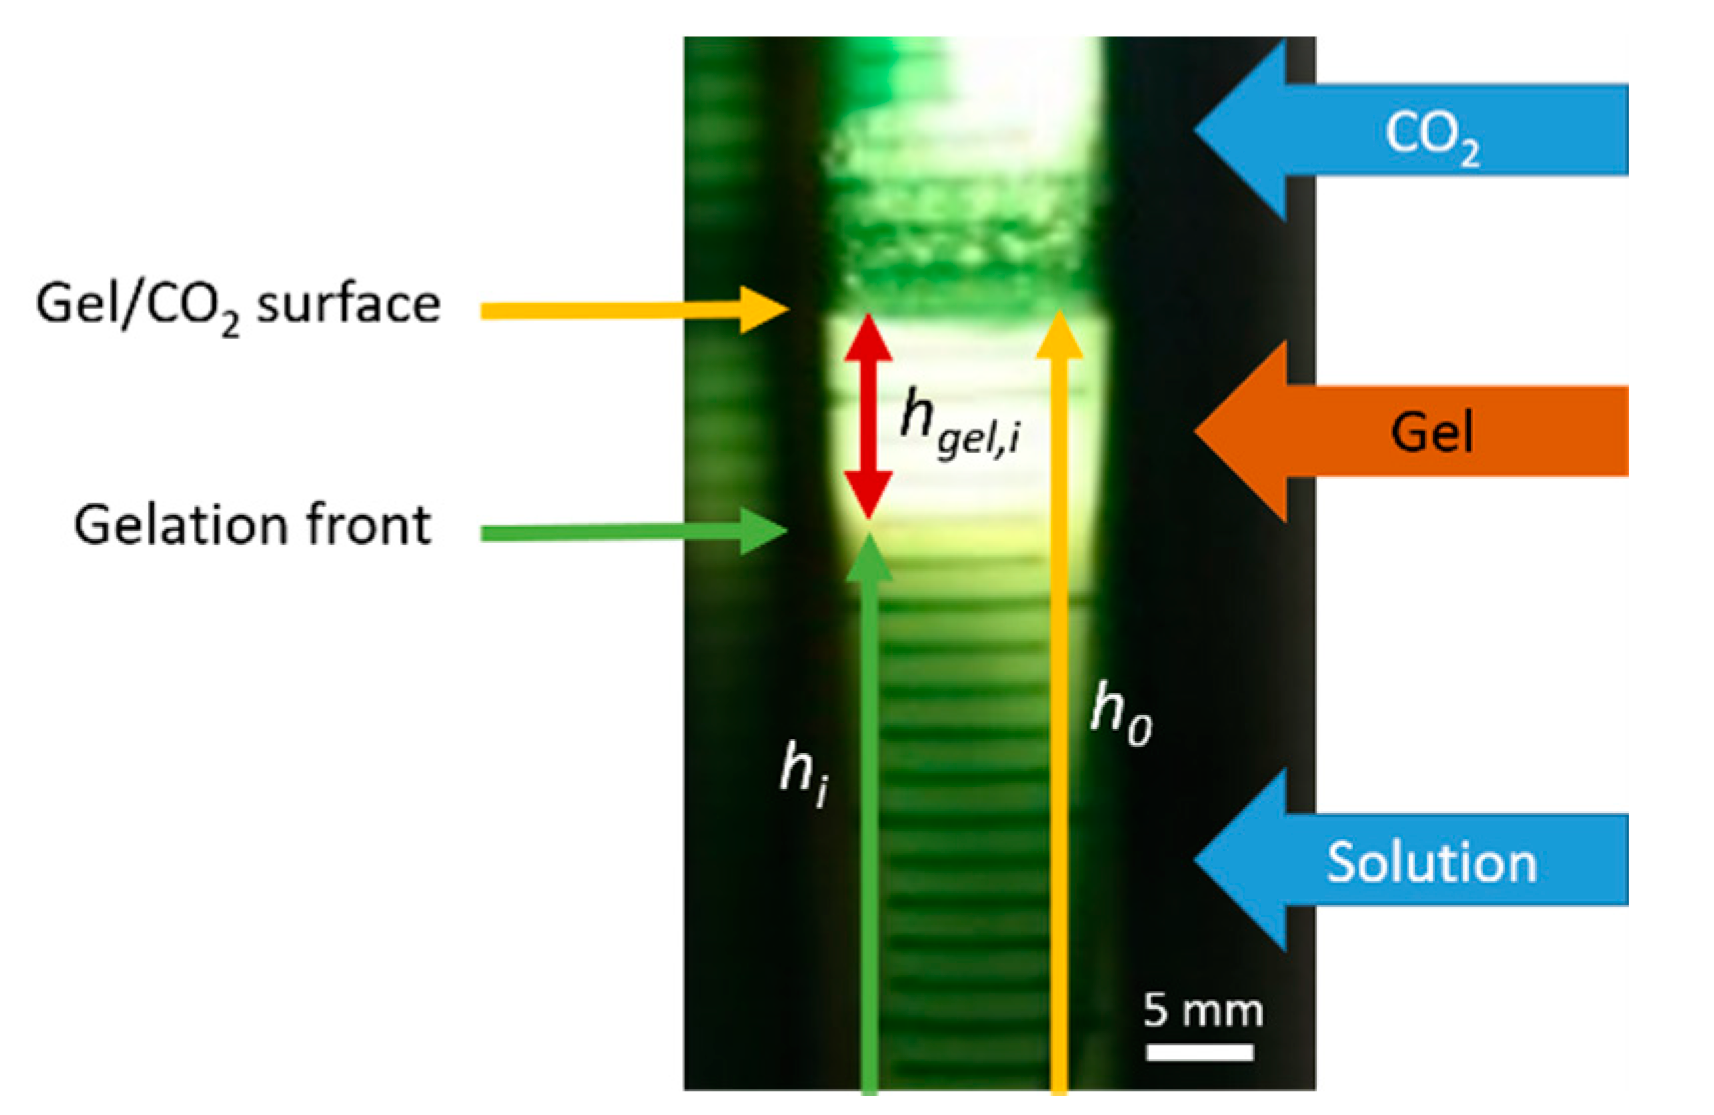
5.3. Visual Observation and Evaluation of the Gelation Progress

The gelation of the biopolymer solution was observed directly through the windows of the high-pressure viewing cell with back-light from a lamp (lamp 2, Figure 13). Due to the dissolution of the CaCO3 particles (step 4, Figure 1), the turbid suspension turned into a clear gel (Figure 14). It could be shown in preliminary experiments that the observed clear regions of the solution consist of stable, completely gelled hydrogel (Figure 14). Therefore, it is assumed that as soon as dissolution of the CaCO3 (step 4) can be observed, cross-linking (step 5) already took place.
The progress of the gelation was given by the movement of the gelation front between the turbid solution and the clear gel at the top of the sample (Figure 14). From these observations, the height of already formed gel was calculated as:
h g e l , i = h 0 h i
where h g e l , i ,   h 0 ,   a n d   h i are the absolute height of the gel, the position of the gel/CO2 phase boundary (measured from the bottom of the sample), and the position of the phase boundary between gel and solution (measured from the bottom of the sample) at time i , respectively (see Figure 14).
The gelation rate describes the time-dependent velocity of the gelation front inside the sample. Two types of gelation rates are distinguished: (1) a total gelation rate r g e l , i which is determined as proportion of the formed gel height over a certain time i:
r g e l , i =   h g e l , i t i t 0 ,
where t i is the time at which the gel height is determined and (2) the gelation rate of a certain period throughout the gelation process determined as the slope of the gel height as a function of time.
r g e l ,     p e r i o d =   d h g e l d t | p e r i o d
The error of the gel height measurement was assumed as inaccuracy of the reading with ± 2 mm. As common for the evaluation of optical images, measurement values can be biased by the operator’s experience. The error of the calculated gelation rates for time periods was determined as the standard error of the linear regression for linear parts of the plot h g e l vs. time.
The development of the gel height and the gelation rate on time is sensitive not only to process parameters such as pressure and temperature, but also to other experimental settings (such as total height of the sample, mold material, and additives such as salts). This should be particularly taken into account when comparing results of obtained values of different measurements.

5.4. In Situ pH Measurement

In situ pH measurements were performed with an optical imaging system called VisiSens (PreSens Precision Sensing GmbH, Regensburg, Germany) consisting of fluorescent pH measurement foils, the VisiSens detector unit Duo2 for VisiSens 2, and the evaluation program VisiSens AnalytiCal2 version 2.11. Sticky fluorescent pH foils used as sensors were attached to the internal surface of the sample mold directly in contact with the sample solution. During measurements, the sensor was illuminated by a fluorescent lamp (lamp 1 integrated in the detector unit from the outside of the high-pressure viewing cell, Figure 13). Fluorescence of the sensor is a function of pH value inside the solution. Sensors with pH ranges of 2–4 and 5–8 were used. Spatially resolved fluorescence of the sensor was detected through the window from outside of the autoclave with the camera (Figure 13). Fluorescence was translated to the pH value using a calibration implemented beforehand in the program VisiSens AnalytiCal2.11.
The error margin for the pH measurements at a given time was estimated as the standard deviation across all detected pixels of the fluorescent sensor. To increase accuracy, the viewing cell had to be darkened completely during pH measurements, except for the light from lamp 1 (Figure 13). The pH measurement system enabled the spatial resolution of the pH value over the sample.

5.5. Viscosity Measurement

Shear viscosities (η) of stock solutions were determined with a Malvern Kinexus Pro (KNX 2100, Malvern Instruments GmbH, Herrenberg, Germany) using a double-slit geometry (DG 25 R0426SS with Df24127) at a shear rate of 1/s.

Author Contributions

Conceptualization, I.P., P.G. and I.S.; methodology, I.P.; validation, I.P.; formal analysis, I.P. and L.-M.R.; investigation, I.P. and L.-M.R.; resources, I.S.; writing—original draft preparation, I.P.; writing—review and editing, I.S., P.G. and L.-M.R.; visualization, I.P. and L.-M.R.; supervision, I.S. and P.G.; project administration, I.P., P.G. and I.S. All authors have read and agreed to the published version of the manuscript.

Funding

This research received no external funding.

Conflicts of Interest

The authors declare no conflict of interest.

References

  1. Subrahmanyam, R.; Gurikov, P.; Meissner, I.; Smirnova, I. Preparation of Biopolymer Aerogels Using Green Solvents. J. Vis. Exp. 2016, 113. [Google Scholar] [CrossRef] [Green Version]
  2. Gurikov, P.; Raman, S.P.; Weinrich, D.; Fricke, M.; Smirnova, I. A novel approach to alginate aerogels: Carbon dioxide induced gelation. RSC Adv. 2015, 5, 7812–7818. [Google Scholar] [CrossRef]
  3. Raman, S.P.; Gurikov, P.; Smirnova, I. Hybrid alginate based aerogels by carbon dioxide induced gelation: Novel technique for multiple applications. J. Supercrit. Fluids 2015, 106, 23–33. [Google Scholar] [CrossRef]
  4. Partap, S.; Rehman, I.; Jones, J.R.; Darr, J.A. “Supercritical Carbon Dioxide in Water” Emulsion-Templated Synthesis of Porous Calcium Alginate Hydrogels. Adv. Mater. 2006, 18, 501–504. [Google Scholar] [CrossRef]
  5. Floren, M.L.; Spilimbergo, S.; Motta, A.; Migliaresi, C. Carbon dioxide induced silk protein gelation for biomedical applications. Biomacromolecules 2012, 13, 2060–2072. [Google Scholar] [CrossRef]
  6. Mallepally, R.R.; Marin, M.A.; McHugh, M.A. CO2-assisted synthesis of silk fibroin hydrogels and aerogels. Acta Biomater. 2014, 10, 4419–4424. [Google Scholar] [CrossRef]
  7. Mallepally, R.R.; Marin, M.A.; Surampudi, V.; Subia, B.; Rao, R.R.; Kundu, S.C.; McHugh, M.A. Silk fibroin aerogels: Potential scaffolds for tissue engineering applications. Biomed. Mater. 2015, 10, 035002. [Google Scholar] [CrossRef]
  8. Dehghani, F.; Annabi, N.; Valtchev, P.; Mithieux, S.M.; Weiss, A.S.; Kazarian, S.G.; Tay, F.H. Effect of dense gas CO2 on the coacervation of elastin. Biomacromolecules 2008, 9, 1100–1105. [Google Scholar] [CrossRef]
  9. Annabi, N.; Mithieux, S.M.; Weiss, A.S.; Dehghani, F. The fabrication of elastin-based hydrogels using high pressure CO2. Biomaterials 2009, 30, 1–7. [Google Scholar] [CrossRef]
  10. Ji, C.; Annabi, N.; Khademhosseini, A.; Dehghani, F. Fabrication of porous chitosan scaffolds for soft tissue engineering using dense gas CO2. Acta Biomater. 2011, 7, 1653–1664. [Google Scholar] [CrossRef]
  11. Xu, D.; Yuan, F.; Jiang, J.; Wang, X.; Hou, Z.; Gao, Y. Structural and conformational modification of whey proteins induced by supercritical carbon dioxide. Innov. Food Sci. Emerg. Technol. 2012, 12, 32–37. [Google Scholar] [CrossRef]
  12. Muljana, H.; Picchioni, F.; Heeres, H.J.; Janssen, L.P.B.M. Supercritical carbon dioxide (scCO2) induced gelatinization of potato starch. Carbohydr. Polym. 2009, 78, 511–519. [Google Scholar] [CrossRef]
  13. Guo, M.; Liu, S.; Ismail, M.; Farid, M.M.; Ji, H.; Mao, W.; Gao, J.; Li, C. Changes in the myosin secondary structure and shrimp surimi gel strength induced by dense phase carbon dioxide. Food Chem. 2017, 227, 219–226. [Google Scholar] [CrossRef]
  14. Zubal, L.; Bonani, W.; Maniglio, D.; Ceccato, R.; Renciuk, D.; Hampl, A.; Migliaresi, C.; Jancar, J.; Vojtova, L. Soluble collagen dissolution and assembling in pressurized carbon dioxide water solutions. Express Polym. Lett. 2018, 12, 159–170. [Google Scholar] [CrossRef]
  15. Alnaief, M.; Mohammad, B.; Aljarrah, M.; Obaidat, R.M. Preparation and preliminary characterization of hybrid alginate—Carrageenan aerogel: Effect of gelation methods. Jordan J. Phys. 2019, 12, 79–86. [Google Scholar]
  16. Groult, S.; Budtova, T. Thermal conductivity/structure correlations in thermal super-insulating pectin aerogels. Carbohydr. Polym. 2018, 196, 73–81. [Google Scholar] [CrossRef]
  17. García-González, C.A.; Jin, M.; Gerth, J.; Alvarez-Lorenzo, C.; Smirnova, I. Polysaccharide-based aerogel microspheres for oral drug delivery. Carbohydr. Polym. 2015, 117, 797–806. [Google Scholar] [CrossRef] [Green Version]
  18. Nešić, A.; Gordić, M.; Davidović, S.; Radovanović, Ž.; Nedeljković, J.; Smirnova, I.; Gurikov, P. Pectin-based nanocomposite aerogels for potential insulated food packaging application. Carbohydr. Polym. 2018, 195, 128–135. [Google Scholar] [CrossRef]
  19. Butler, J.N. Carbon Dioxide Equilibria and Their Applications; Lewis Publishers INC: Chelsea, MI, USA, 1991. [Google Scholar]
  20. Spycher, N.; Pruess, K.; Ennis-King, J. CO2-H2O mixtures in the geological sequestration of CO2. I. Assessment and calculation of mutual solubilities from 12 to 100 °C and up to 600 bar. Geochim. Cosmochim. Acta. 2003, 67, 3015–3031. [Google Scholar] [CrossRef]
  21. Diamond, L.W.; Akinfiev, N.N. Solubility of CO2 in water from −1.5 to 100 °C and from 0.1 to 100 MPa: Evaluation of literature data and thermodynamic modelling. Fluid Phase Equilib. 2003, 208, 265–290. [Google Scholar] [CrossRef]
  22. Miller, J.P. A portion of the system calcium carbonate-carbon dioxide-water with geological implications. Am. J. Sci. 1952, 250, 161–203. [Google Scholar] [CrossRef]
  23. Bermejo, M.D.; Martín, A.; Florusse, L.J.; Peters, C.J.; Cocero, M.J. The influence of Na2SO4 on the CO2 solubility in water at high pressure. Fluid Phase Equilib. 2005, 238, 220–228. [Google Scholar] [CrossRef]
  24. Jeon, P.R.; Lee, C.-H. Prediction of CO2 solubility in multicomponent electrolyte solutions up to 709 bar: Analogical bridge between hydrophobic solvation and adsorption model. Chem. Eng. J. 2020, 389, 123459. [Google Scholar] [CrossRef]
  25. Goss, S.L.; Lemons, K.A.; Kerstetter, J.E.; Bogner, R.H. Determination of calcium salt solubility with changes in pH and PCO2, simulating varying gastrointestinal environments. J. Pharm. Pharmacol. 2007, 59, 1485–1492. [Google Scholar] [CrossRef]
  26. Hart, P.W.; Colson, G.W.; Burris, J. Application of carbon dioxide to reduce water-side lime scale in heat exchangers. J. Sci. Technol. For. Prod. Process. 2011, 1, 67–70. [Google Scholar]
  27. Frear, G.L.; Johnston, J. The solubility of calcium carbonate (calcite) in certain aqueous solutions at 25°. J. Am. Chem. Soc. 1929, 51, 2082–2093. [Google Scholar] [CrossRef]
  28. Letcher, T.M. (Ed.) Developments and Applications in Solubility; Royal Society of Chemistry: Cambridge, UK, 2007. [Google Scholar] [CrossRef] [Green Version]
  29. Oechsle, A.L.; Lewis, L.; Hamad, W.Y.; Hatzikiriakos, S.G.; MacLachlan, M.J. CO2-Switchable Cellulose Nanocrystal Hydrogels. Chem. Mater. 2018, 30, 376–385. [Google Scholar] [CrossRef]
  30. Baehr, H.D.; Stephan, K. Heat and Mass Transfer, 3rd ed.; Springer: Berlin/Heidelberg, Germany, 2011. [Google Scholar]
  31. Sander, R. Compilation of Henry’s law constants (version 4.0) for water as solvent. Atmos. Chem. Phys. 2015, 15, 4399–4981. [Google Scholar] [CrossRef] [Green Version]
  32. Meyssami, B.; Balaban, M.; Teixeira, A. Prediction of pH in model systems pressurized with carbon dioxide. Biotechnol. Prog. 1992, 8, 149–154. [Google Scholar] [CrossRef]
  33. Pigaleva, M.A.; Elmanovich, I.V.; Kononevich, Y.N.; Gallyamov, M.O.; Muzafarov, A.M. A biphase H2O/CO2 system as a versatile reaction medium for organic synthesis. RSC Adv. 2015, 5, 103573–103608. [Google Scholar] [CrossRef]
Figure 1. Scheme of the gelation process of CO2-induced gelation of biopolymer solutions with possibly cross-linker calcium carbonate.
Gels 06 00028 g001
Figure 2. Development of the gel phase and gelation front from top to bottom over time of a 1 wt.-% amidated pectin solution with 0.18 wt.-% CaCO3 at 50 bar CO2 and room temperature.
Gels 06 00028 g002
Figure 3. Representative case of the change in the gel height throughout gelation process at 35 bar; 1 wt.-% amidated pectin solution with 0.18 wt.-% CaCO3 at room temperature.
Gels 06 00028 g003
Figure 4. Change in the total gelation rate (Equation (3)) over time; 1 wt.-% amidated pectin with 0.18 wt.-% CaCO3 at 50 bar and room temperature.
Gels 06 00028 g004
Figure 5. Increase in the gel height in contact with pressurized CO2 over time with varied mold diameters; 1 wt.-% amidated pectin solution with 0.18 wt.-% CaCO3 at 50 bar and room temperature.
Gels 06 00028 g005
Figure 6. Impact of the CO2 pressure in the gas phase on the change in the gel height over time; 1 wt.-% amidated pectin solution with 0.18 wt.-% CaCO3 at room temperature.
Gels 06 00028 g006
Figure 7. Change in the final gelation rate ( r g e l , f i n a l ) over initial CaCO3 concentration; 1 wt.-% amidated pectin solution, 50 bar, room temperature.
Gels 06 00028 g007
Figure 8. Calculated pH value from fluorescence measurements; 1 wt.-% amidated pectin and 55 bar CO2; observable circles and dots at the fluorescence sensor are due to light reflections from LEDs and were not taken into account in the evaluation of pH value.
Gels 06 00028 g008
Figure 9. Decrease in the solution pH value over time; 1 wt.-% amidated pectin, 0.18 wt.-% CaCO3, 50 bar CO2, room temperature; transparent region represents the error margin of pH measurement.
Gels 06 00028 g009
Figure 10. Spatial resolution of the change in the pH value over time; 1 wt.-% amidated pectin solution, 0.18 wt.-% CaCO3, 50 bar, room temperature; transparent region represents the error margin of pH measurement.
Gels 06 00028 g010
Figure 11. Impact of carbonate salts on the evolution of the pH value under CO2 pressure of p = 50 bar; 1 wt.-% amidated pectin; 0.18 wt.-% CaCO3 or Na2CO3, respectively; and room temperature. Transparent region represents the error margin of pH measurement.
Gels 06 00028 g011
Figure 12. Development of the pH value in aqueous systems with additional Na2CO3 (0.18 wt.-%) in the presence of CO2 (50 bar), water: η = 1 mPas, 1 wt.-% amidated pectin: η = 30 mPas, 1 wt.-% agar–agar: η = 1000 mPas, without CaCO3. (a) detailed graph of first 45 min; (b) complete measurement. Transparent region represents the error margin of pH measurement.
Gels 06 00028 g012
Figure 13. Scheme of the high-pressure viewing cell for CO2-induced gelation.
Gels 06 00028 g013
Figure 14. Example for the observation of CO2-induced gelation of 1 wt.-% amidated pectin solution inside the viewing cell at 50 bar.
Gels 06 00028 g014
Table 1. Calculated solubility of CO2 in pure water at 25 °C; Henry solubility constant of HCP = 3.3 × 10⁻⁴ mol/(m3 Pa) taken from [31].
Pressure of CO2 Atmosphere (Bar)Solubility of CO2 in Pure Water (mol/m3)
20660
371221
481584
581914

