Article

Research and Development of a CO2-Responsive TMPDA–SDS–SiO2 Gel System for Profile Control and Enhanced Oil Recovery

1
College of Petroleum Engineering, Yangtze University, Wuhan 430100, China
2
Oil and Gas Technology Research Institute, PetroChina Qinghai Oilfield Company, Jiuquan 736202, China
*
Author to whom correspondence should be addressed.
Gels 2025, 11(9), 709; https://doi.org/10.3390/gels11090709
Submission received: 1 August 2025 / Revised: 22 August 2025 / Accepted: 1 September 2025 / Published: 3 September 2025

Abstract

A CO2-responsive TMPDA–SDS–SiO2 gel system was developed and evaluated through formulation optimization, structural characterization, rheological testing, and core flooding experiments. The optimal formulation was identified as 7.39 wt% SDS, 1.69 wt% TMPDA, and 0.1 wt% SiO2, achieving post-CO2 viscosities above 103–104 mPa·s. Spectroscopic and microscopic analyses confirmed that CO2 protonates TMPDA amine groups to form carbamate/bicarbonate species, which drive the micellar transformation into a wormlike network, thereby enhancing gelation and viscosity. Rheological tests showed severe shear-thinning behavior, excellent shear recovery, and reversible viscosity changes under alternating CO2/N2 injection. The gel demonstrated rapid responsiveness, reaching stable viscosities within 8 min, and maintained good performance after 60 days of thermal aging at 90 °C and in high-salinity brines. Plugging tests in sand-packed tubes revealed that a permeability reduction of 98.9% could be achieved at 0.15 PV injection. In heterogeneous parallel core flooding experiments, the gel preferentially reduced high-permeability channel conductivity, improved sweep efficiency in low-permeability zones, and increased incremental oil recovery by 14.28–34.38% depending on the permeability contrast. These findings indicate that the CO2-responsive TMPDA–SDS–SiO2 gel system offers promising potential as a novel smart blocking gel system for improving the effectiveness of CO2 flooding in heterogeneous reservoirs.

1. Introduction

With the increasing difficulty of developing unconventional oil and gas resources, enhancing oil recovery (EOR) and extending the production life of mature reservoirs have become important challenges in the petroleum industry. CO2 flooding has attracted wide attention due to its dual advantages of improving recovery efficiency and contributing to carbon sequestration [1,2,3]. However, because of reservoir heterogeneity and the unfavorable mobility ratio between CO2 and crude oil, CO2 tends to finger through high-permeability channels during displacement, resulting in limited sweep efficiency and low displacement efficiency. These issues have to some extent restricted the practical effectiveness of CO2 flooding [4,5,6,7,8].
To improve both sweep efficiency and displacement efficiency in CO2 flooding, various mobility-control strategies have been proposed, including water-alternating-gas (WAG) injection [9,10,11,12,13], CO2 foam flooding [14,15], polymer-assisted CO2 flooding [16], and CO2 thickening techniques [17,18]. On this basis, several modified approaches have been developed in recent years. For example, chemically enhanced WAG introduces chemical agents into the water slug, which interact with subsequently injected CO2 through chemical reactions or interfacial stabilization, thereby improving fluid transport characteristics [19]. Another example is nanocomposite viscosity-enhancing systems, in which nanoparticles and polymers act synergistically to increase solution viscosity, delay CO2 breakthrough in high-permeability channels, and demonstrate potential applicability in WAG or gas flooding processes [20]. These methods not only alleviate CO2 channeling and improve sweep efficiency but may also enhance displacement efficiency by reducing interfacial tension or increasing relative pressure gradients, thereby contributing to further improvements in oil recovery.
Among these methods, gel systems have been reported to show potential for mitigating CO2 channeling in high-permeability zones due to their plugging capability and adaptability to reservoir temperature and pressure conditions. In recent years, CO2-responsive gels, which undergo sol–gel transitions upon CO2 stimulation, have been regarded as promising smart fluids for improving the effectiveness of CO2 flooding [21]. Such gels can undergo structural transformations under CO2 exposure, enabling relatively selective plugging and flow redirection. In contrast, traditional gels or nanocomposite viscosity-enhancing systems mainly rely on high pre-injection viscosity to improve the mobility ratio, which may limit injectivity and selectivity. CO2-responsive gels, however, can be injected as low-viscosity solutions and subsequently undergo in situ gelation under CO2 stimulation, making them more suitable for blocking high-permeability channels.
Previous studies have reported promising results for CO2-responsive gels under different conditions. For instance, a carrageenan–PEI–ethylenediamine system was reported to form a three-dimensional network structure under CO2 exposure, exhibiting strong plugging capability and possible oil recovery enhancement [22]. CO2-responsive preformed particle gels demonstrated strong swelling capacity and plugging strength under acidic environments, achieving nearly complete plugging in core flooding experiments [23]. Furthermore, a CO2-responsive gel–wormlike micelle coupling system exhibited significant viscosity enhancement and improved displacement performance upon CO2 stimulation [24]. In addition, PEI–SDS gels containing nano-SiO2 were reported to display favorable rheological reinforcement and plugging ability [25]. More recently, Xin and co-workers investigated the application of CO2-responsive gels in fractured and low-permeability reservoirs, suggesting their potential applicability under complex heterogeneous conditions [26].
In this context, a CO2-responsive TMPDA–SDS–SiO2 gel system was developed in this study. The formulation, rheological properties, and CO2-triggered behavior of the gel were characterized, and parallel core flooding experiments were conducted under permeability contrasts of 10, 20, and 30 to examine its plugging and displacement features under heterogeneous conditions. Building on previous work, this study provides additional experimental observations regarding the applicability of the CO2-responsive TMPDA–SDS–SiO2 gel system under heterogeneous conditions.

2. Results and Discussion

2.1. Formulation Optimization

2.1.1. Effect of SDS to TMPDA Molar Ratio on System Viscosity

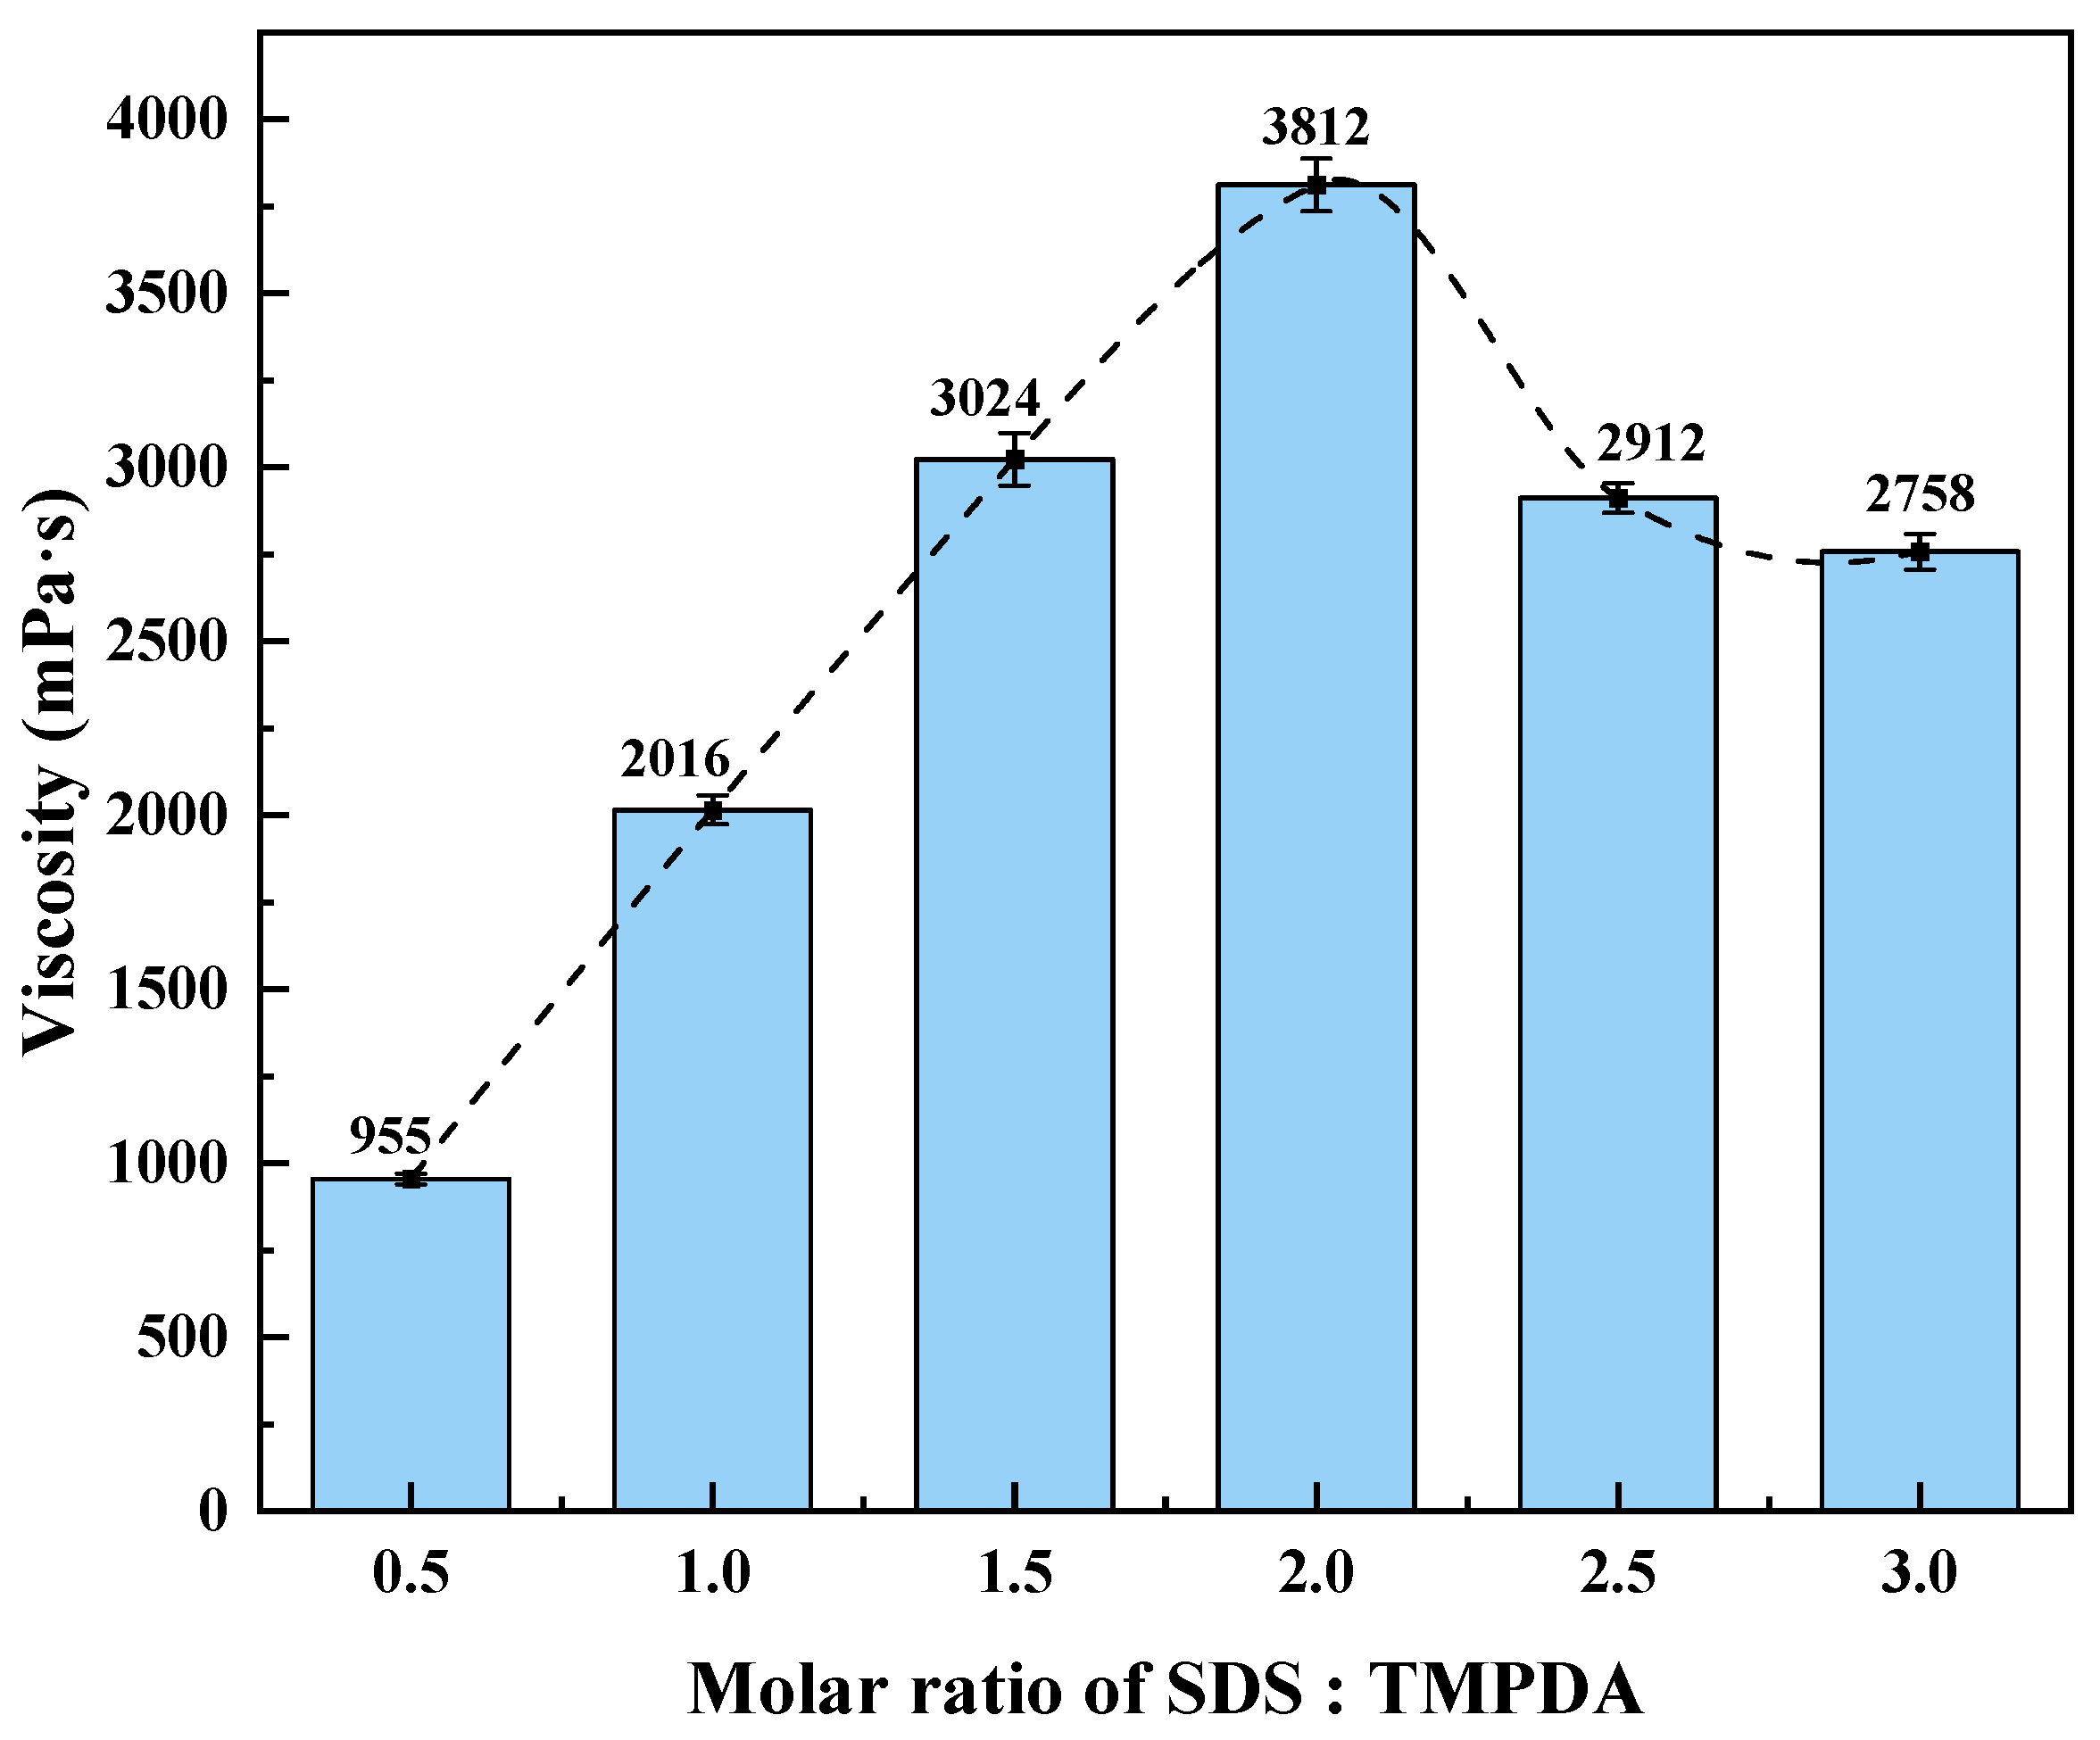
At a fixed total molar concentration of 300 mmol/L, the viscosity response of the CO2-responsive TMPDA–SDS–SiO2 gel system was evaluated at SDS:TMPDA molar ratios of 0.5, 1.0, 1.5, 2.0, 2.5, and 3.0. Before CO2 introduction, the solution exhibited a viscosity of approximately 1.2 mPa·s. After CO2 stimulation, the viscosities increased to 955, 2016, 3024, 3812, 2912, and 2758 mPa·s, respectively, showing an overall trend of first increasing and then decreasing (Figure 1). The maximum viscosity (3812 mPa·s) was obtained at a molar ratio of 2:1, suggesting that this ratio provided the most favorable conditions for viscosity enhancement.
This peak viscosity can be explained by the micellar structural transformation induced by compositional balance. At the 2:1 ratio, TMPDA acts as a divalent organic cation that promotes the growth of elongated wormlike micelles with greater flexibility, thereby enhancing the probability of entanglement into a transient three-dimensional network and significantly increasing viscosity [27,28]. Similar micelle growth and viscosity enhancement phenomena have been reported in other surfactant–amine systems [29,30]. When the SDS fraction was further increased, excess anionic surfactant tended to form spherical or short-rod micelles, which reduced micelle entanglement and led to a decline in viscosity [31].

2.1.2. Effect of SDS–TMPDA Mass Fraction on System Viscosity

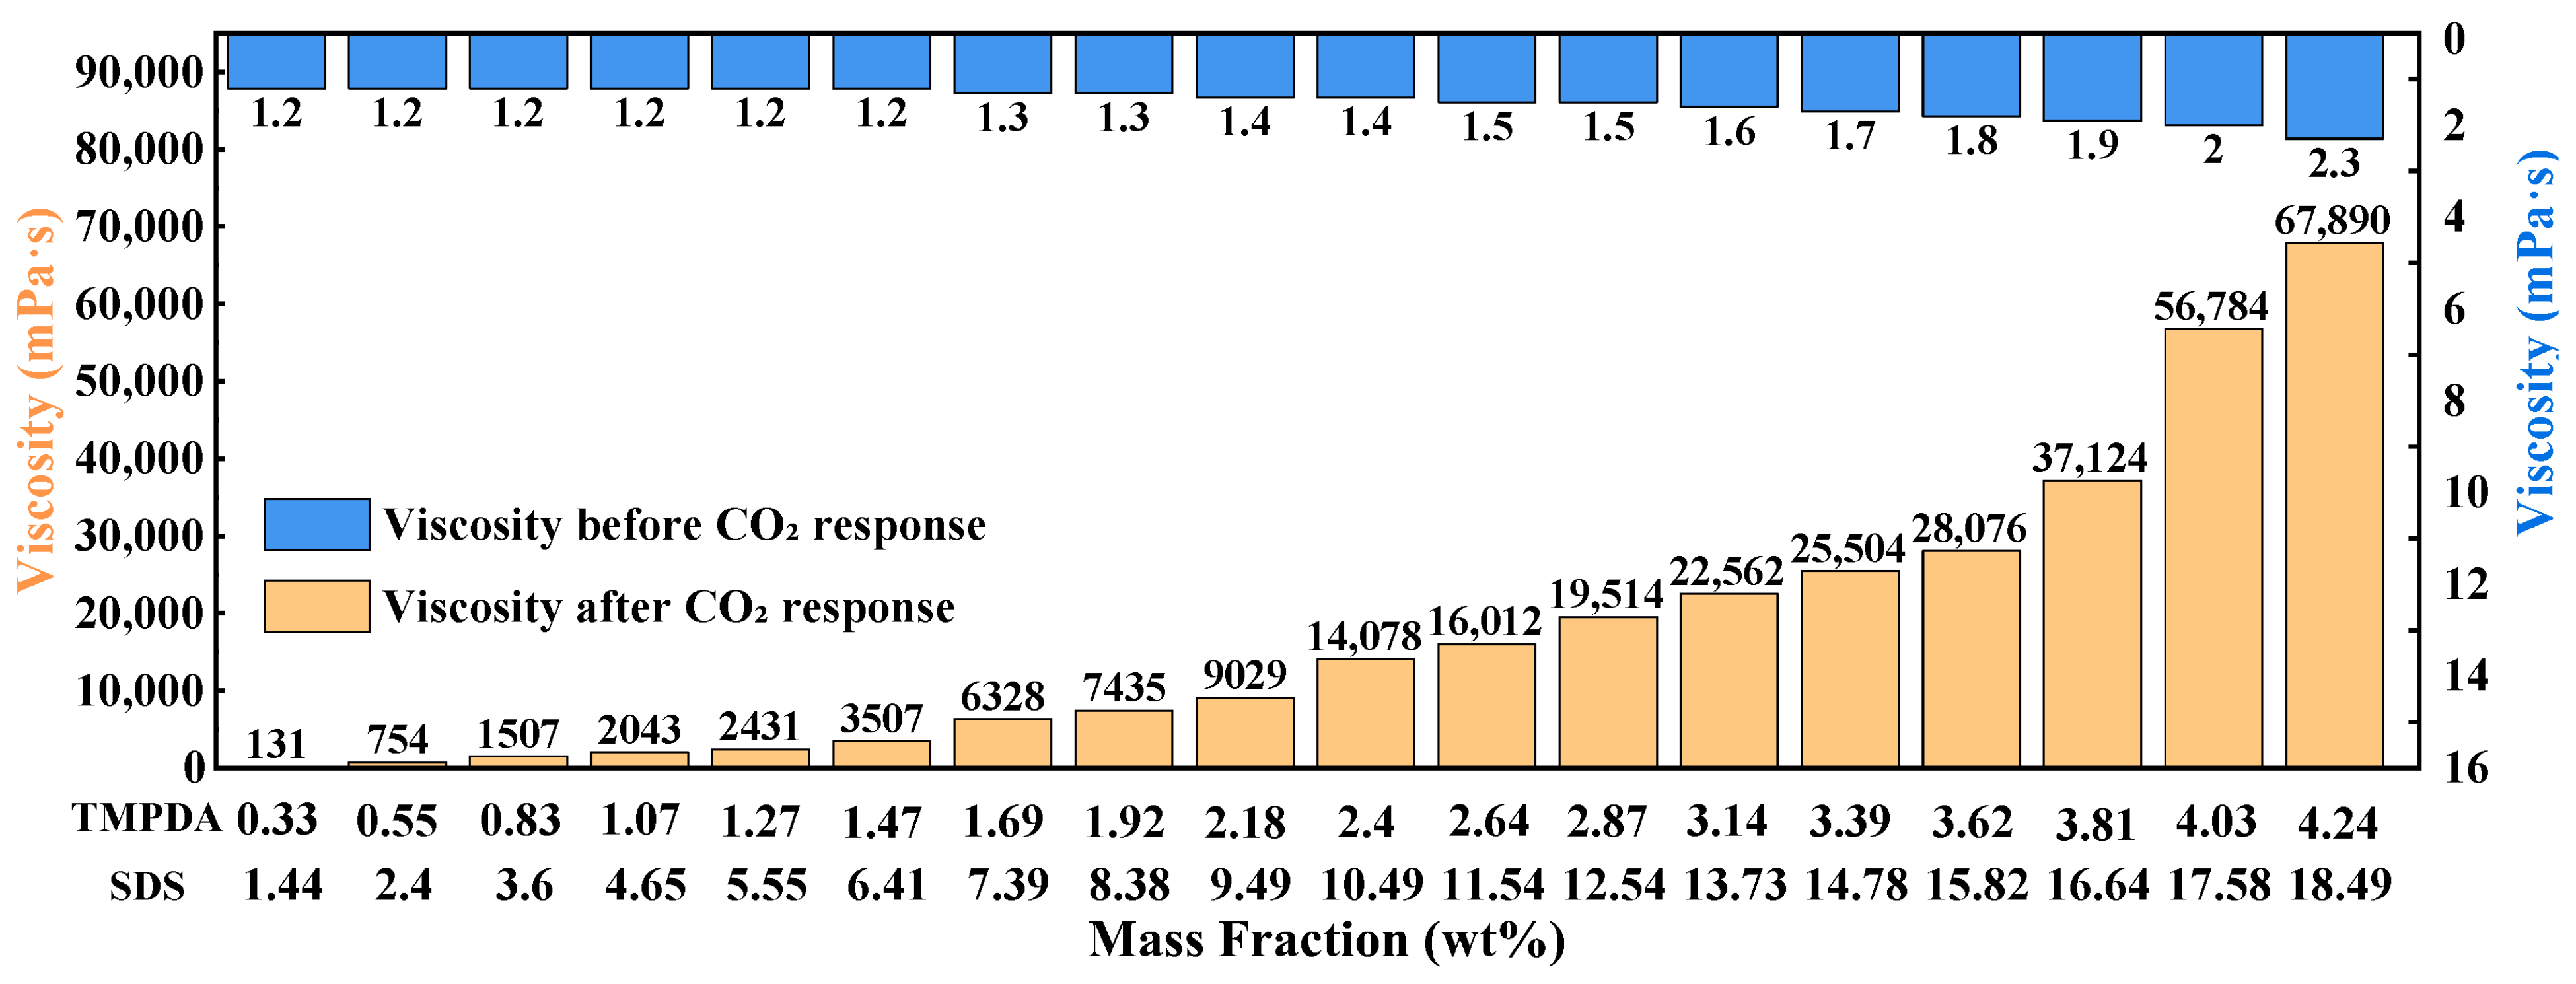
Based on the optimal SDS:TMPDA molar ratio of 2:1 determined in Section 2.1.1, the influence of total mass fraction (1.44 wt% SDS + 0.33 wt% TMPDA to 18.49 wt% SDS + 4.24 wt% TMPDA) on viscosity was further investigated (Figure 2). Before CO2 introduction, viscosities remained low and nearly constant (1.2–2.3 mPa·s). After CO2 stimulation, however, viscosities increased markedly, from 131 mPa·s at the lowest concentration to 67,890 mPa·s at the highest concentration.
This sharp increase can be attributed to TMPDA protonation, which enhances intermolecular interactions and promotes cross-linked micellar network formation. Higher concentrations provide more micelles and greater entanglement density, further reinforcing the gel structure. Nevertheless, excessively high concentrations, despite producing higher viscosities, would increase material cost and injection pressure, which may hinder field application. Balancing performance and feasibility, the composition of 7.39 wt% SDS + 1.69 wt% TMPDA was selected for subsequent experiments.

2.1.3. Effect of Nano-Silica on the Viscosity of the System

Based on the optimized formulation of 7.39 wt% SDS and 1.69 wt% TMPDA, the effect of nano-silica concentration on viscosity was investigated (Figure 3). As the nano-silica content increased from 0.02 wt% to 0.1 wt%, the viscosity rose from 7739 mPa·s to a maximum of 10,311 mPa·s. When the concentration exceeded 0.1 wt%, viscosity decreased continuously, reaching 6288 mPa·s at 0.9 wt%.
These results suggest a concentration-dependent dual effect of nano-silica. At low dosages (<0.1 wt%), well-dispersed nanoparticles act as crosslinking points, strengthening the micellar network through hydrogen bonding, electrostatic attraction, and interfacial interactions, thus enhancing viscosity. At higher dosages (>0.1 wt%), nanoparticle aggregation and competitive adsorption disturb network homogeneity and weaken micellar entanglement, leading to reduced viscosity. Taking both viscosity enhancement and stability into account, 0.1 wt% was identified as the optimal nano-silica concentration. Therefore, the final optimized formulation of the CO2-responsive TMPDA–SDS–SiO2 gel system was 7.39 wt% SDS, 1.69 wt% TMPDA, and 0.1 wt% SiO2.

2.2. Xiangyingjili Fenxi

2.2.1. Spectroscopic Evidence of CO2-Induced Interactions (1H-NMR and FTIR)

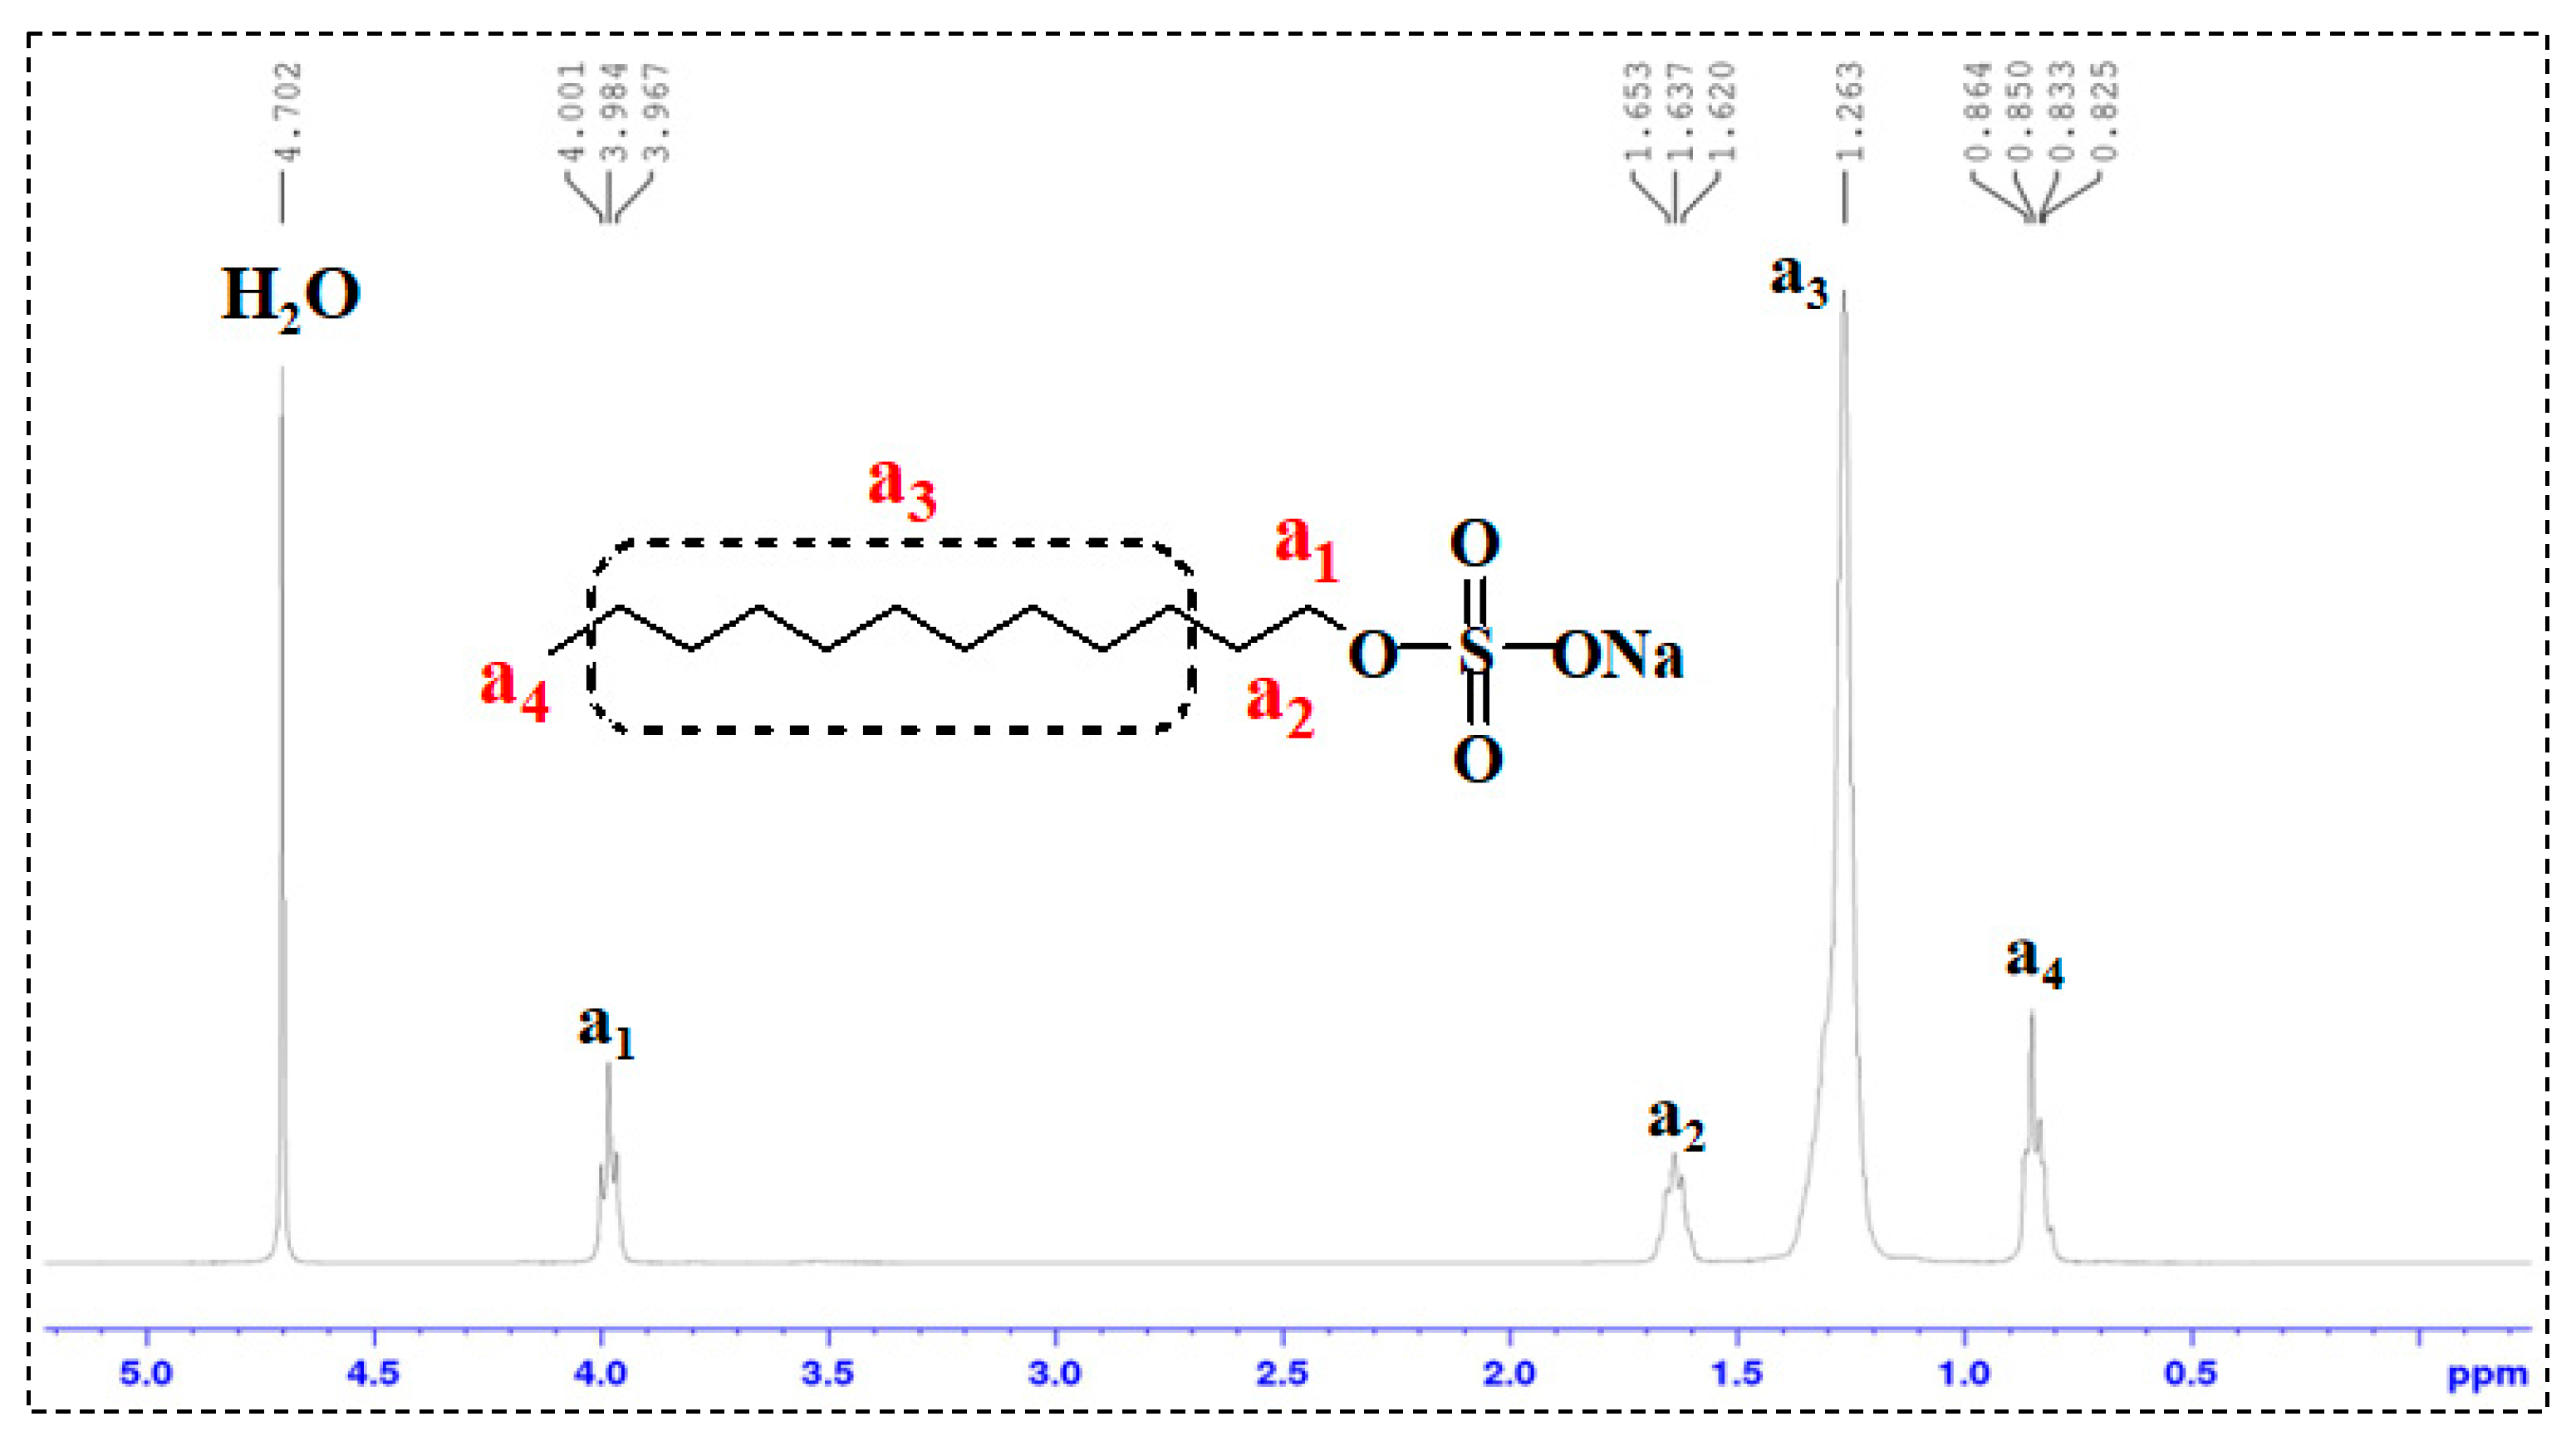
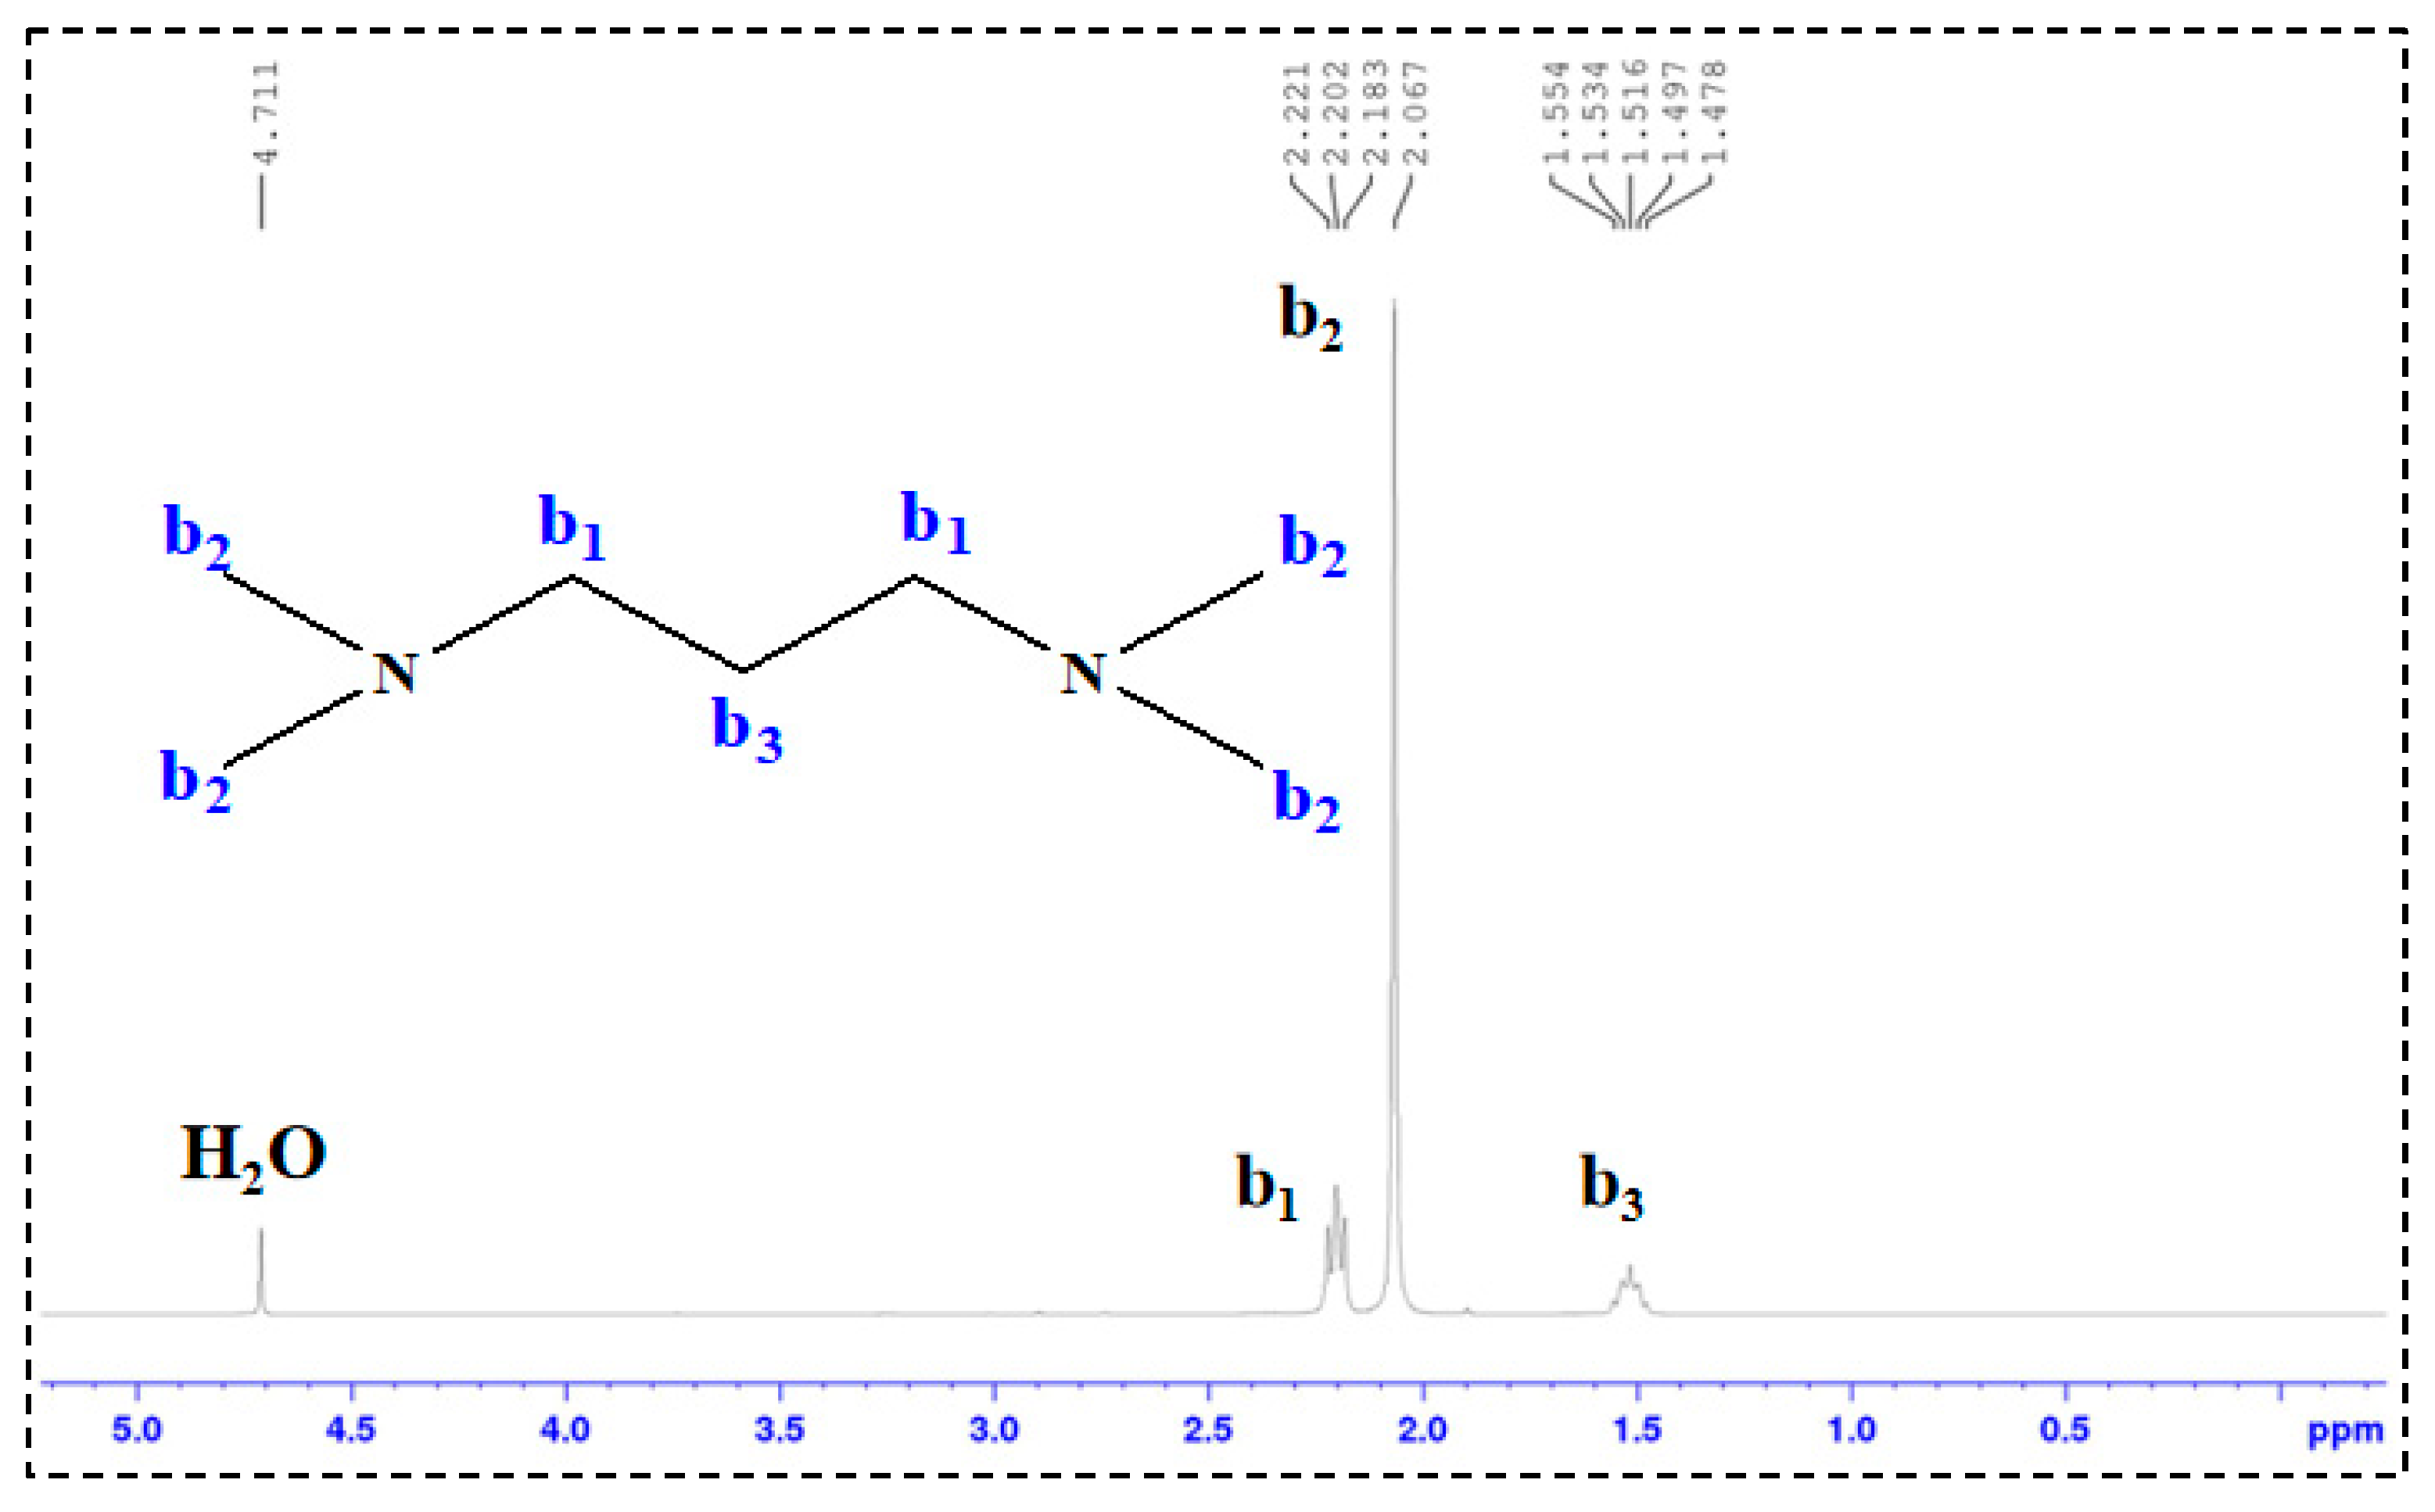
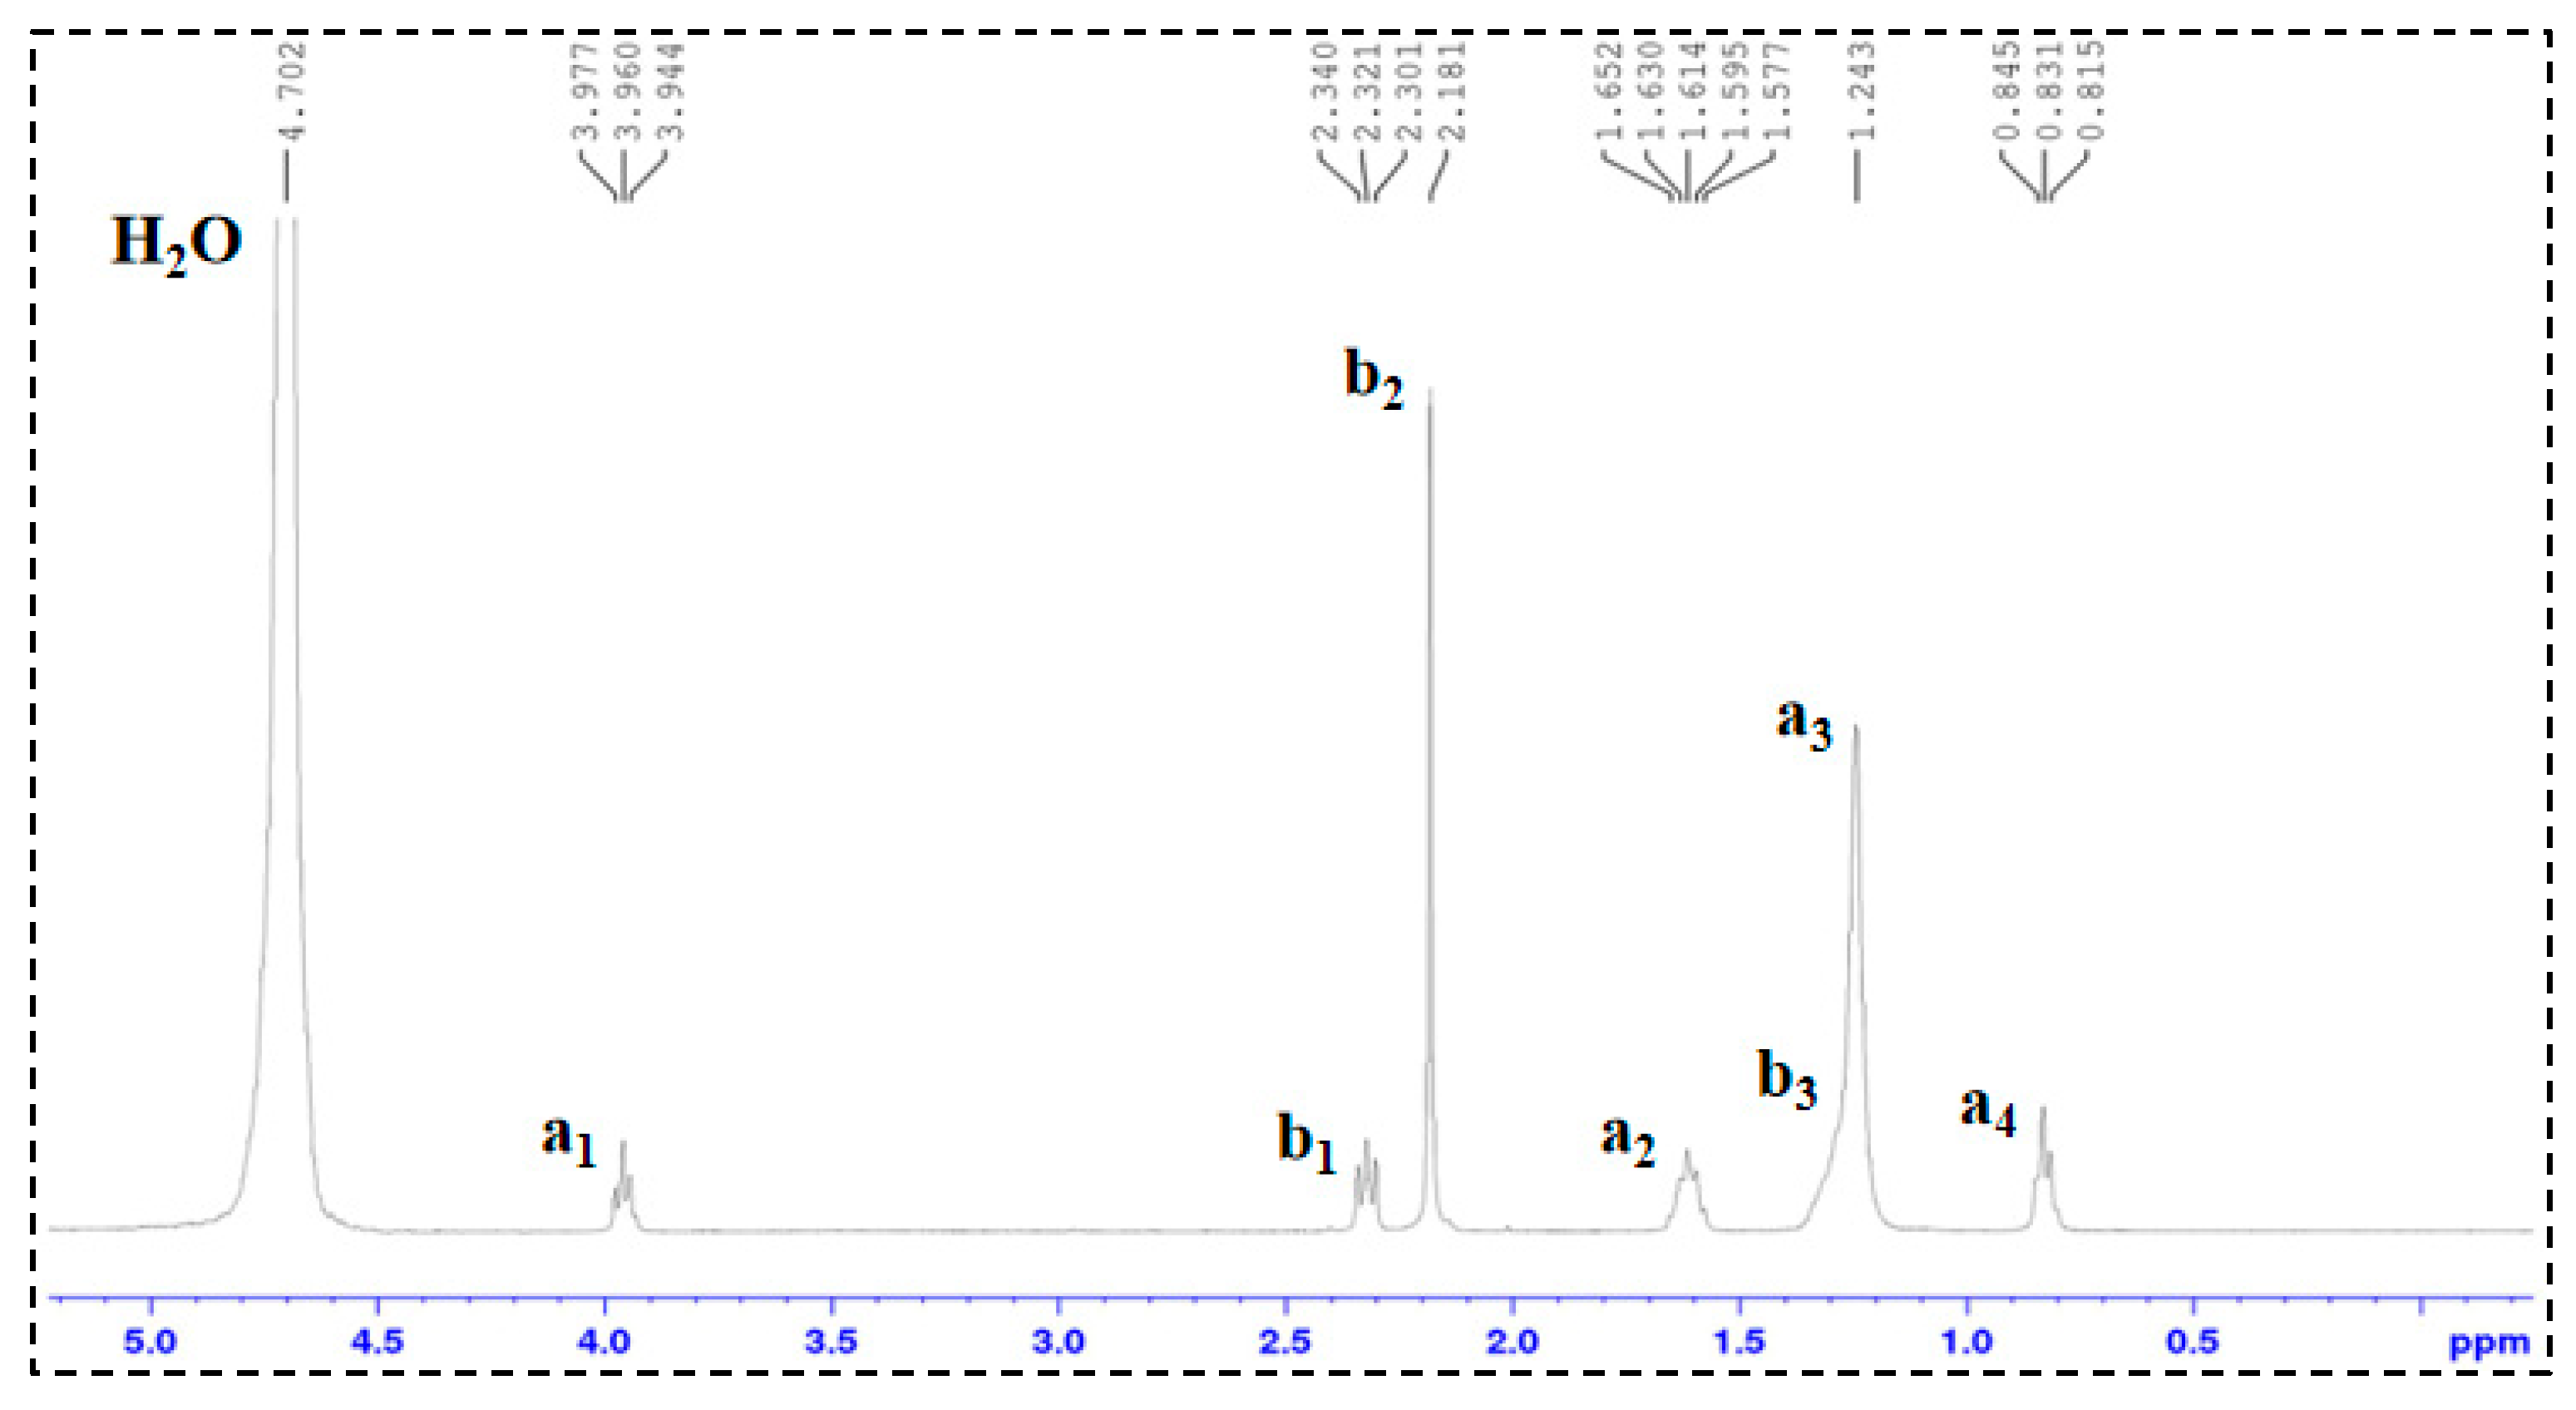
To elucidate the CO2-triggered structural changes in the TMPDA–SDS system, both 1H nuclear magnetic resonance (1H-NMR) and Fourier transform infrared (FTIR) spectroscopy were employed (Figure 4, Figure 5, Figure 6, Figure 7 and Figure 8).
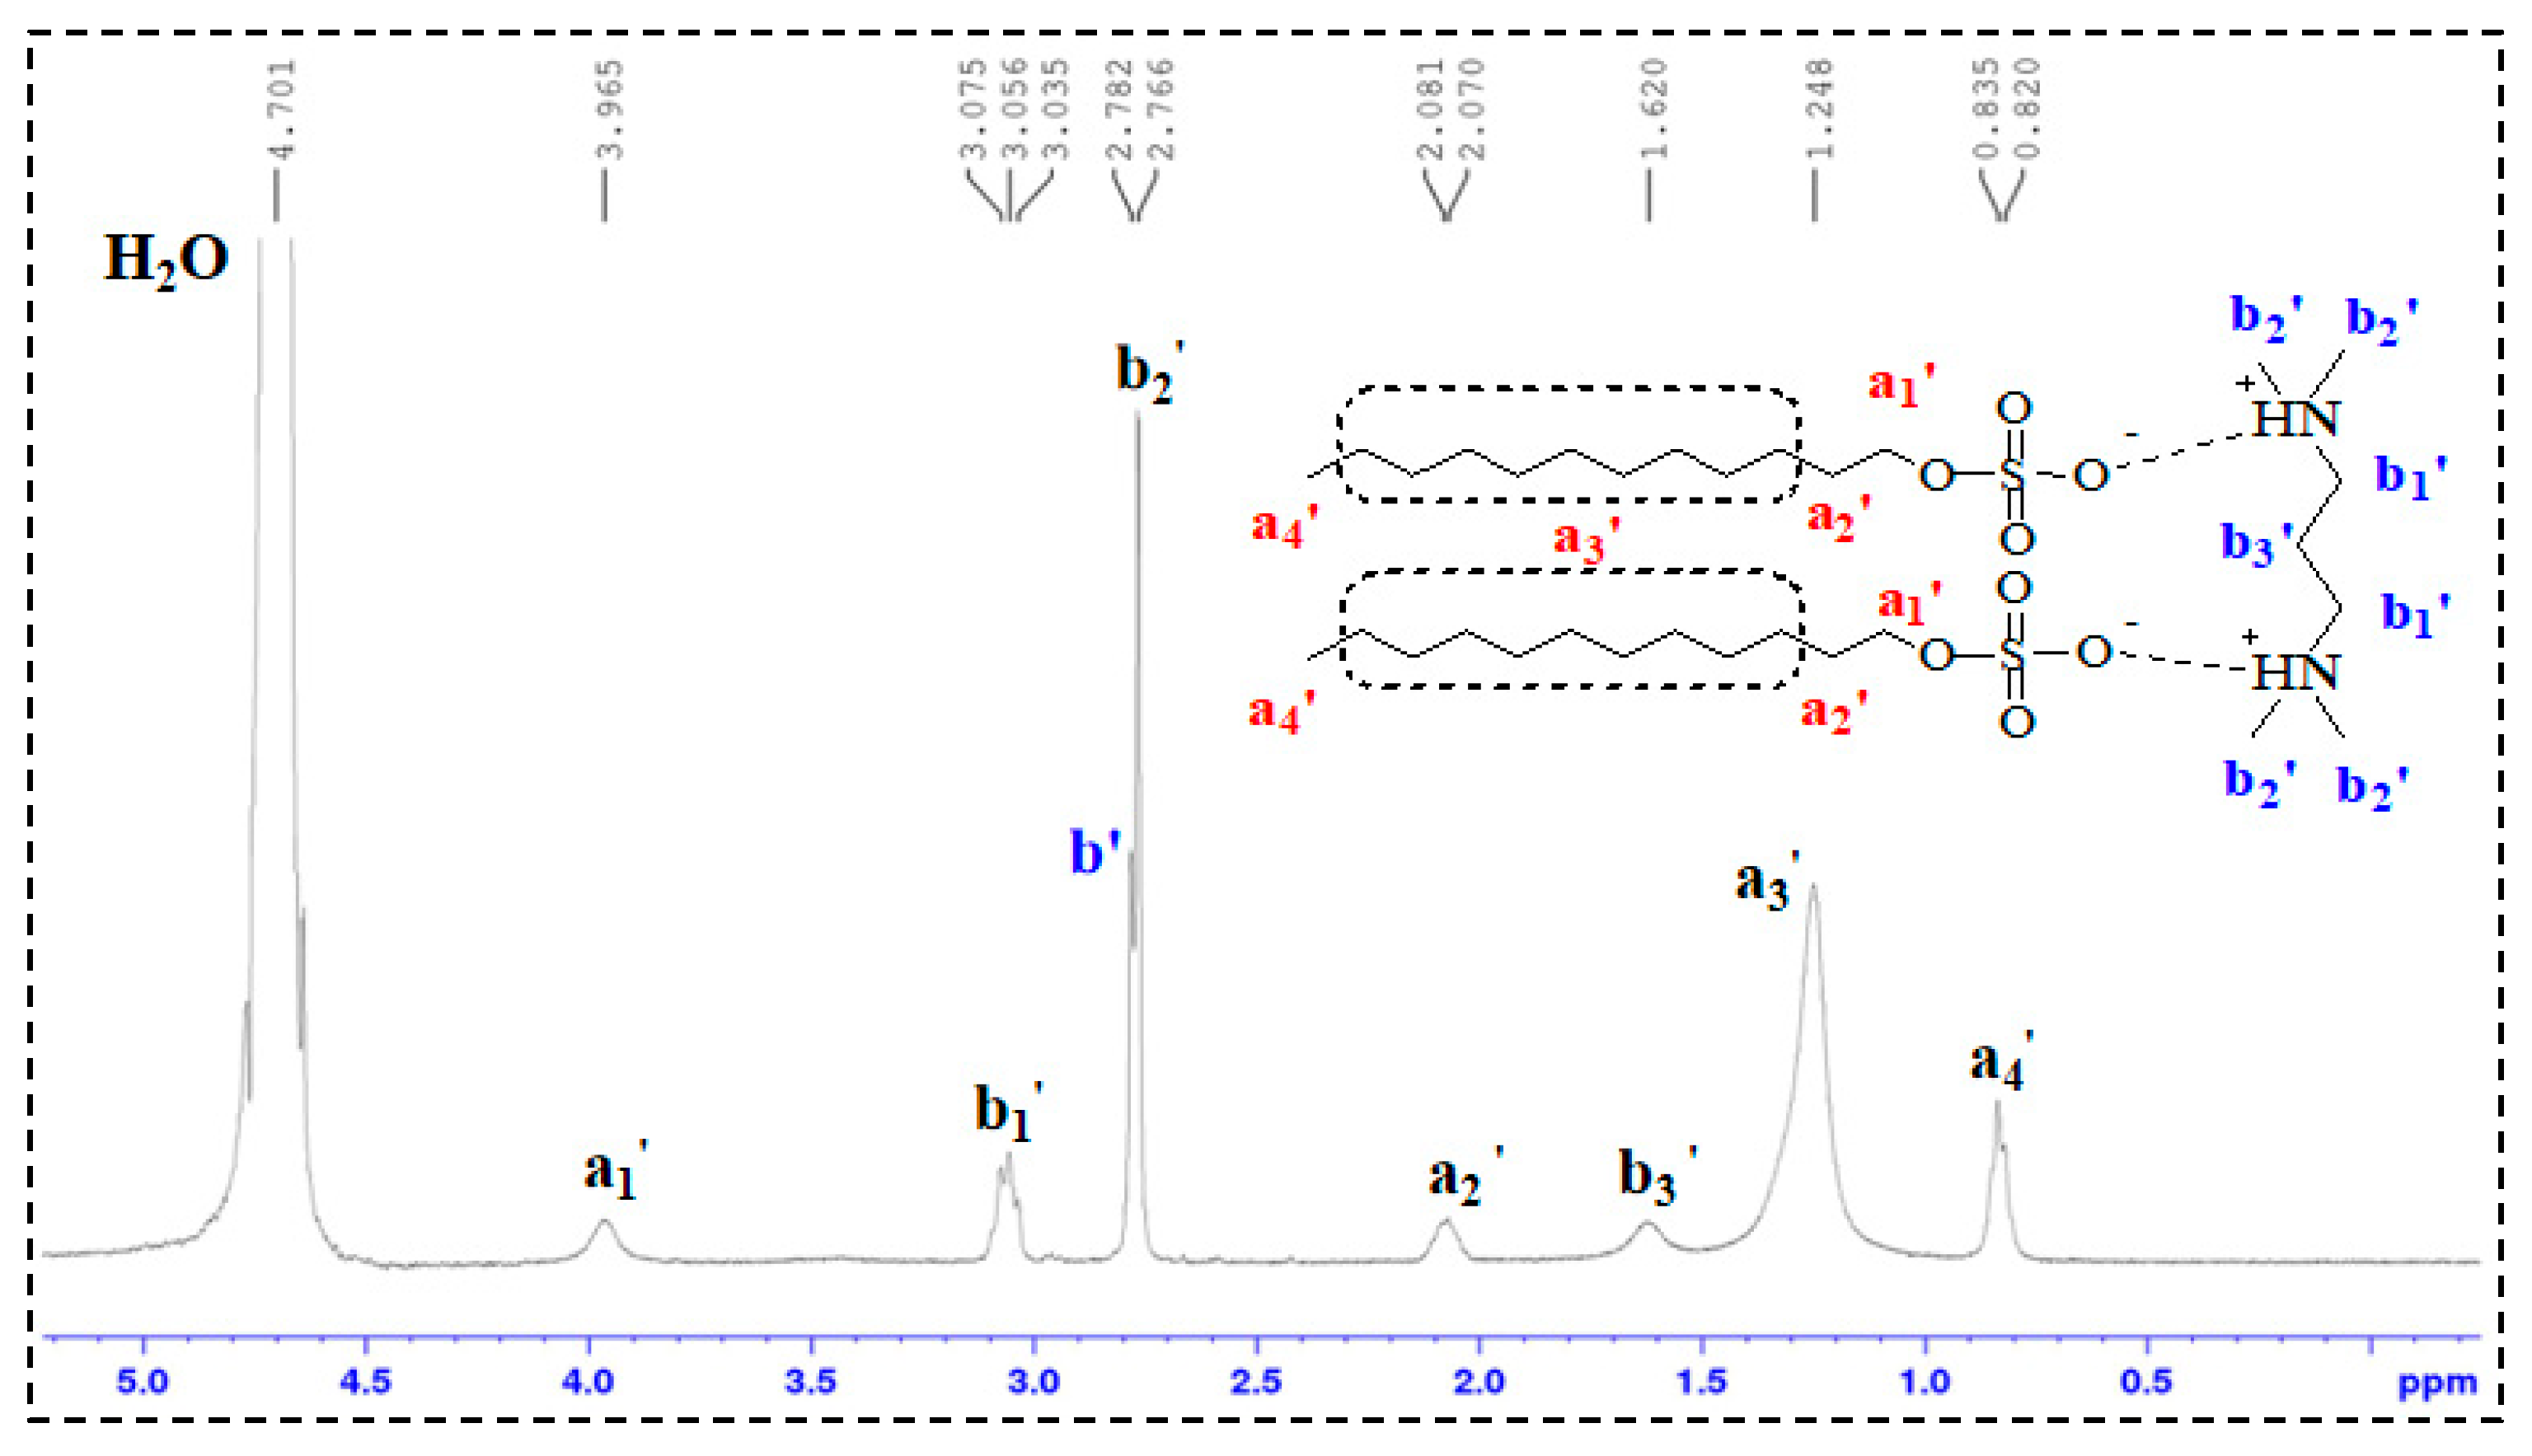
In the 1H-NMR spectra of SDS and TMPDA (Figure 4 and Figure 5), characteristic resonances corresponding to alkyl chains and amine groups were clearly observed. Upon mixing SDS and TMPDA (Figure 6), no significant shifts or new peaks appeared, suggesting that their interactions are dominated by non-covalent forces such as electrostatic attraction and hydrophobic association rather than covalent bonding. However, after CO2 introduction (Figure 7), distinct spectral changes emerged. Specifically, new peaks (a1′, b1′) appeared adjacent to the original SDS and TMPDA signals, accompanied by downfield shifts and broadening of existing peaks. These spectral modifications indicate the generation of new proton environments, consistent with the reaction of CO2 with the amine groups of TMPDA. Such changes suggest the possible formation of CO2-derived carbamate or bicarbonate species, although 1H-NMR alone cannot unambiguously distinguish between them.
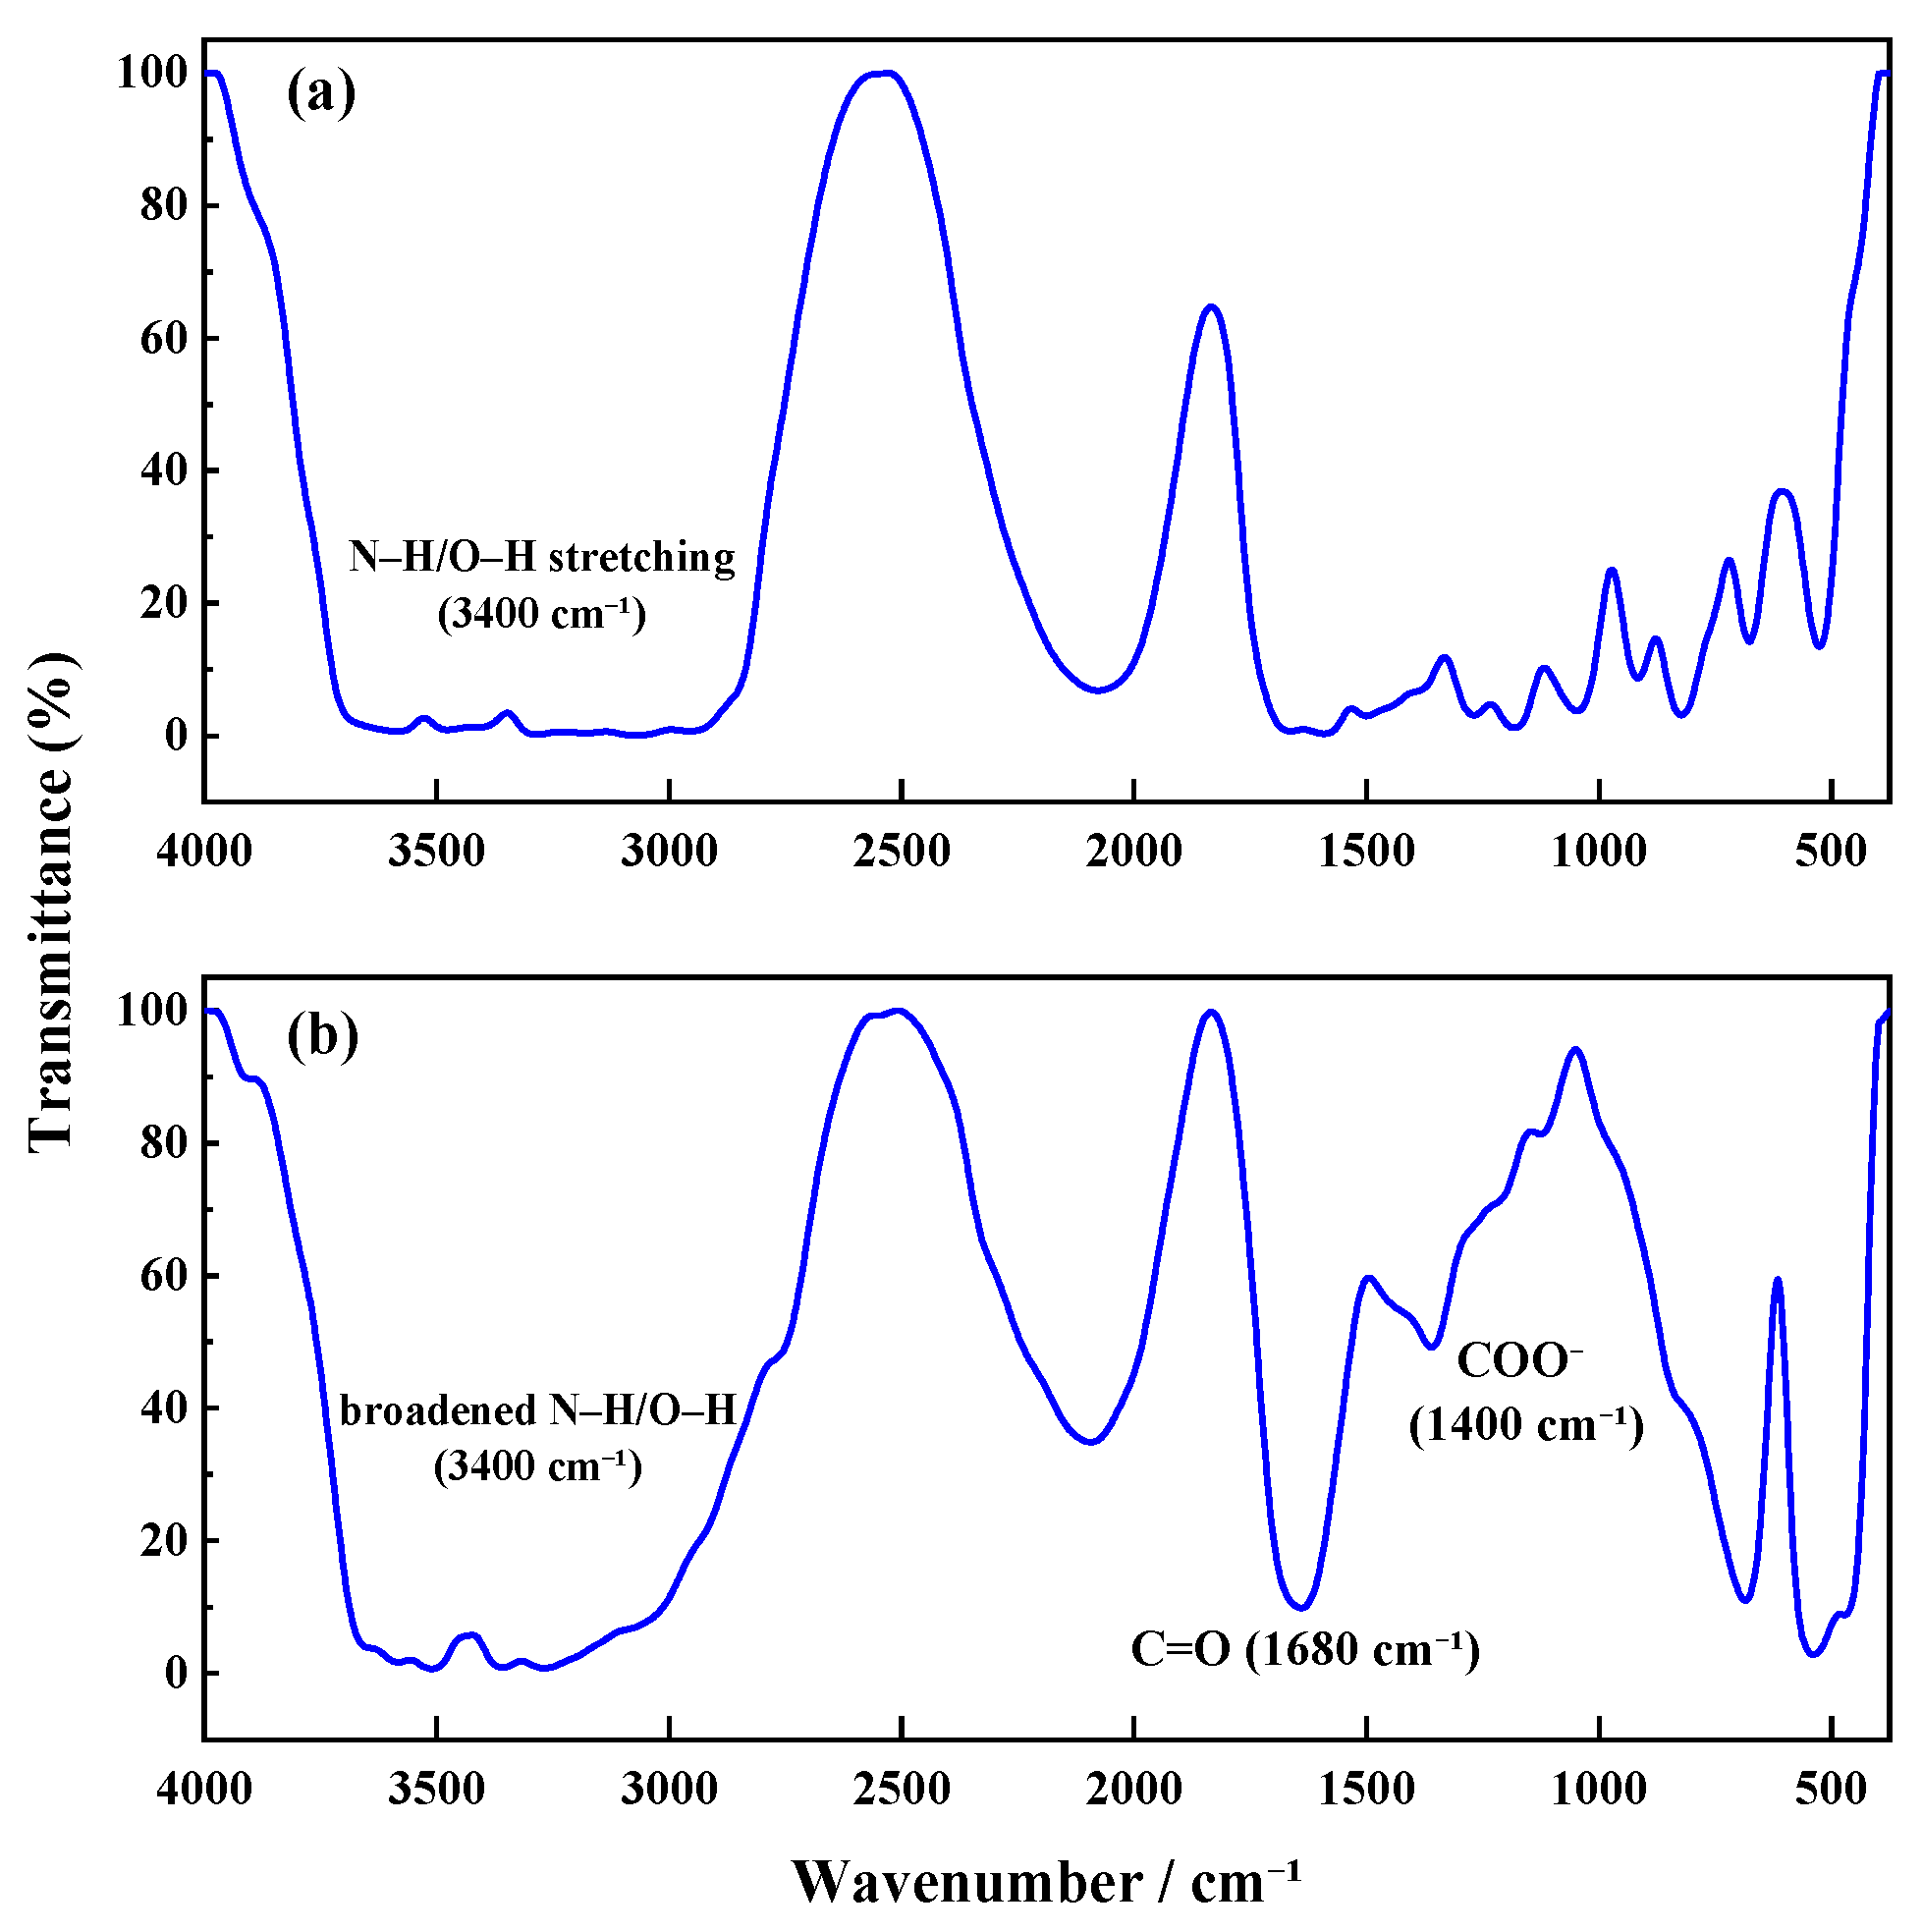
The FTIR spectra provide complementary and more direct evidence. Before CO2 introduction (Figure 8), the TMPDA–SDS system exhibited no distinctive absorption in the carbonyl region. After CO2 exposure, two new strong bands appeared near ~1680 cm−1 and ~1400 cm−1, which can be assigned to C=O stretching and COO symmetric/asymmetric vibrations, respectively. These features are characteristic of carbamate and bicarbonate species, thereby confirming that CO2 reacts with TMPDA to generate such ionic derivatives.
Taken together, the combined NMR and FTIR results demonstrate that CO2 protonates the TMPDA amine groups and leads to the formation of carbamate and/or bicarbonate species. These ionic products alter the charge balance and molecular interactions in the TMPDA–SDS–CO2 system, promoting micellar restructuring and the transition toward entangled wormlike networks that underpin the macroscopic gelation and viscosity enhancement.

2.2.2. Morphological Evolution from SEM Observations

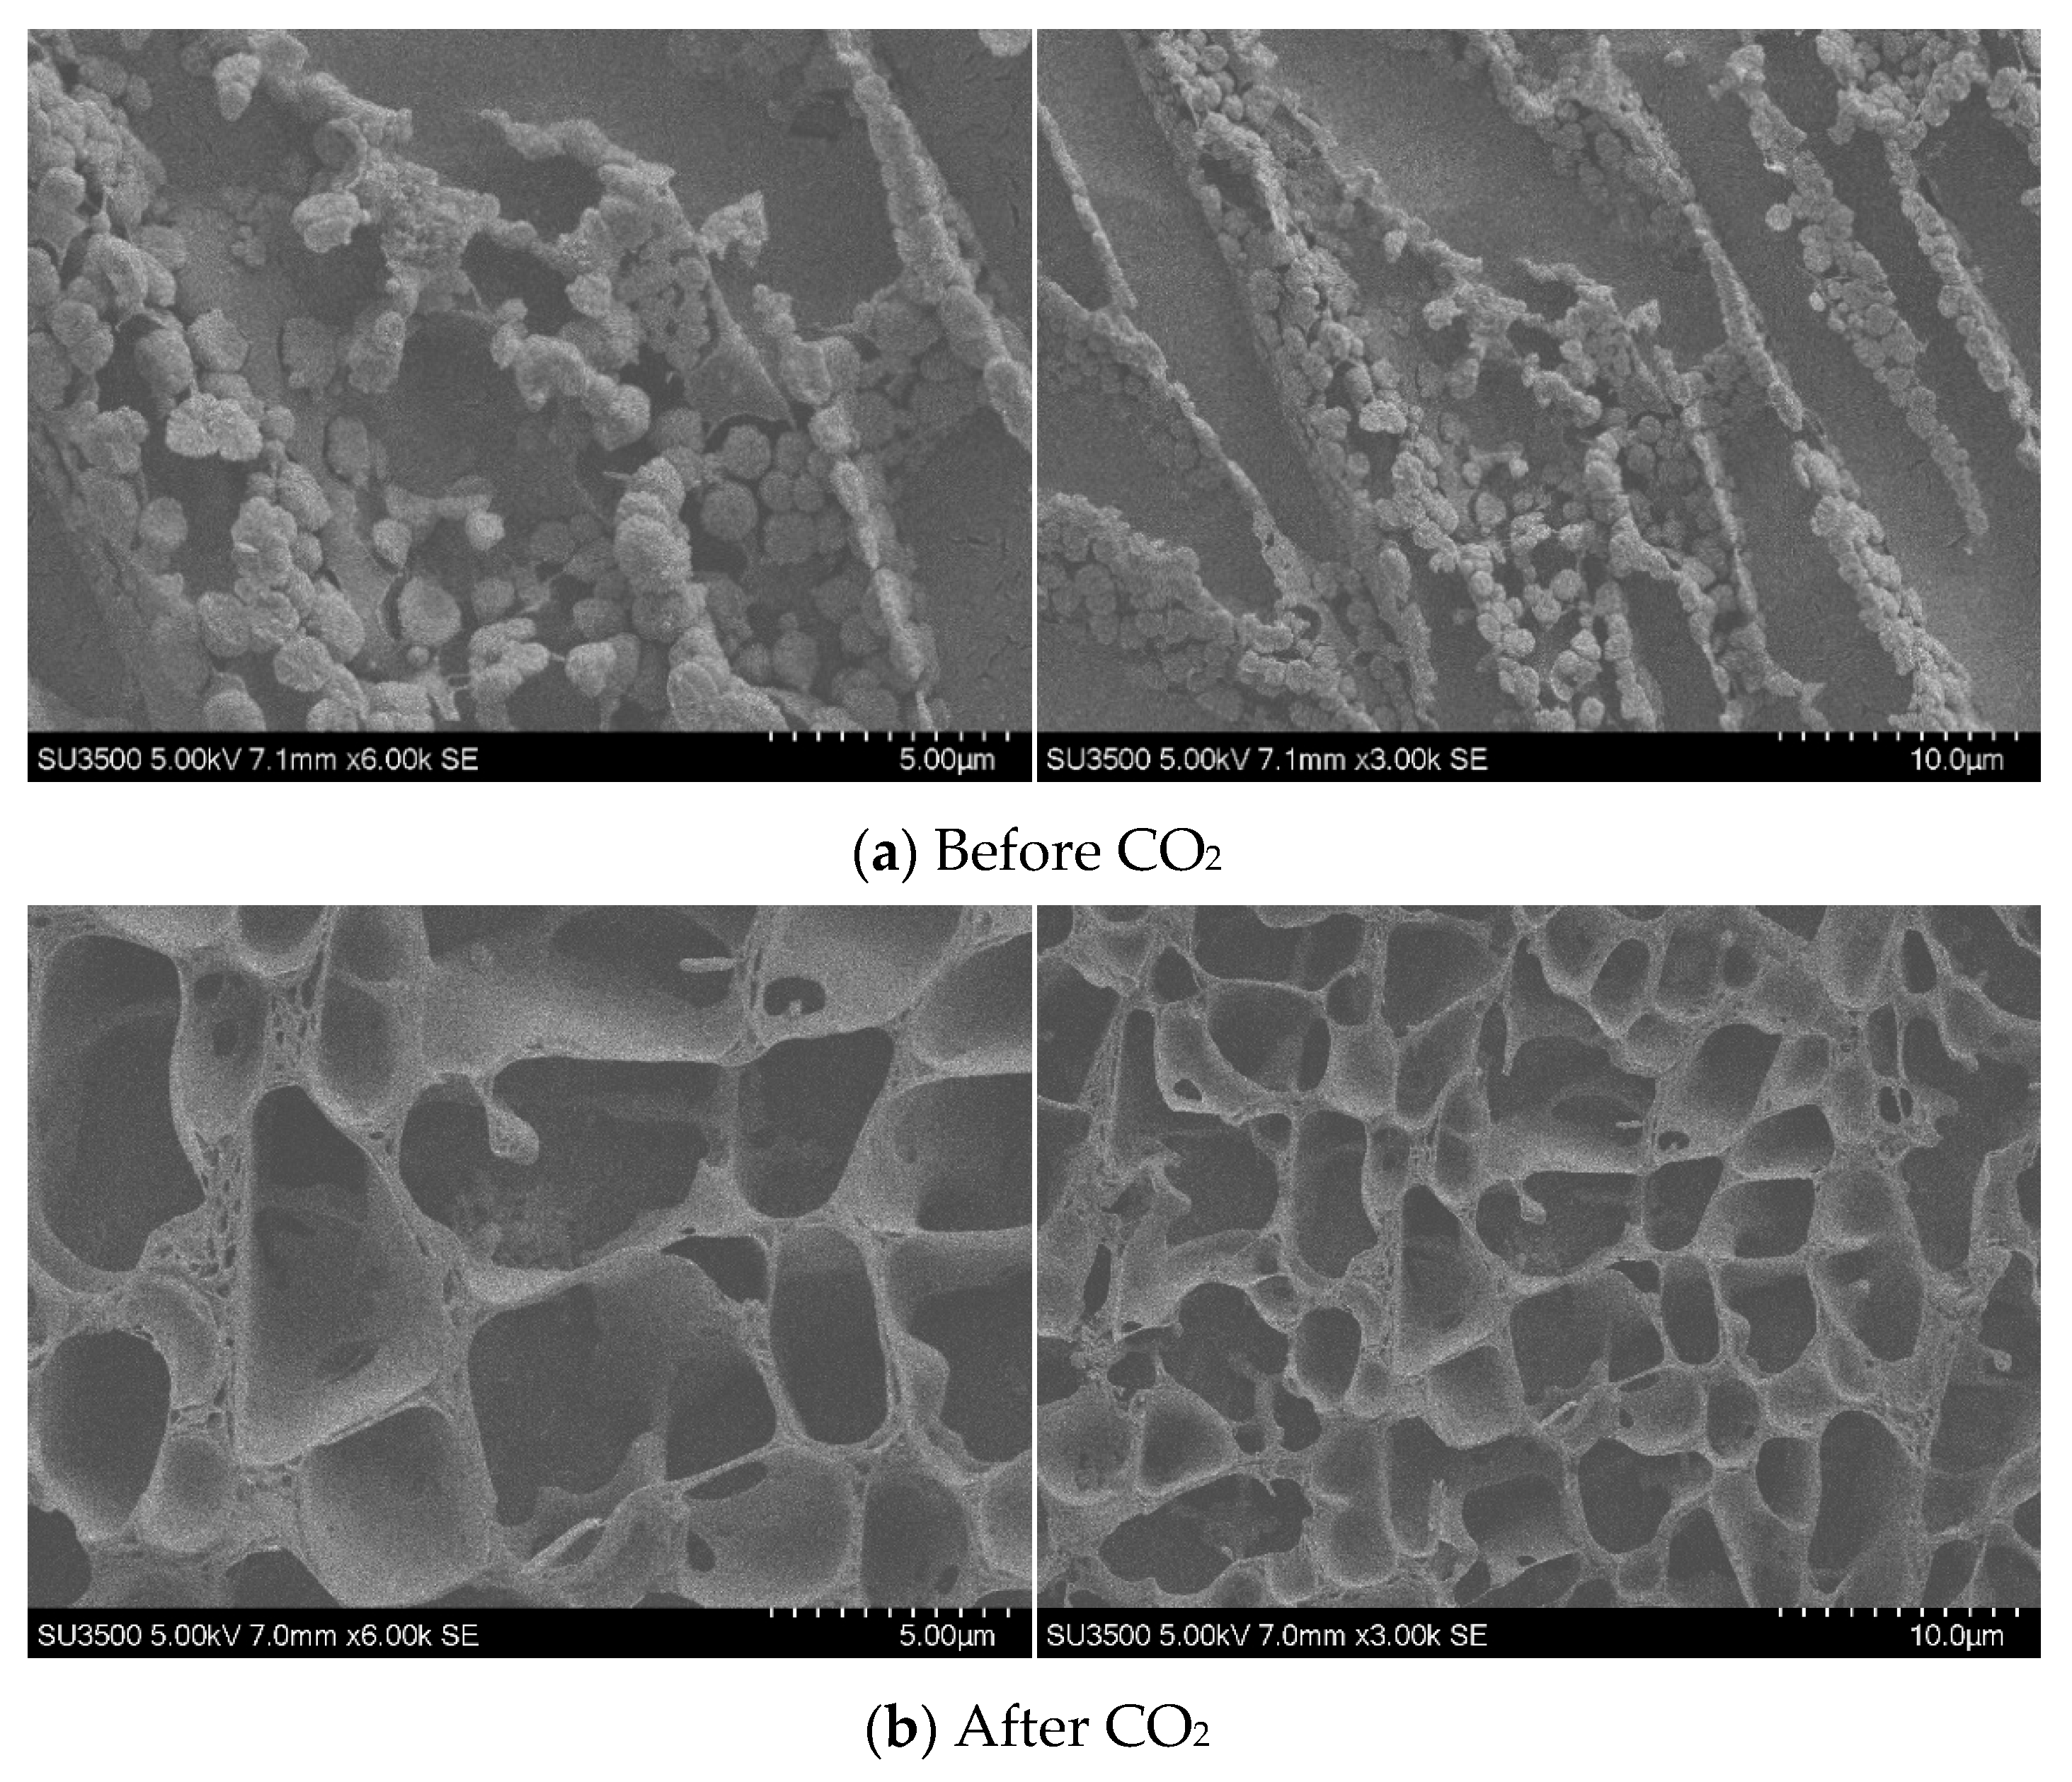
Cryo-SEM was employed to observe the morphological changes in the TMPDA–SDS system before and after CO2 stimulation (Figure 9).
Before CO2 introduction (Figure 9a), the samples exhibited a loose and discontinuous morphology, consisting of irregular aggregates with poorly connected structures. Such features indicate insufficient micelle entanglement and limited network formation, consistent with the low viscosity measured in rheological tests. After CO2 introduction (Figure 9b), the micrographs revealed a significant transformation into a denser, sponge-like network with highly interconnected pores. The emergence of this continuous three-dimensional framework demonstrates enhanced intermolecular associations and structural reorganization under CO2 stimulation, which accounts for the substantial viscosity increase in the CO2-responsive TMPDA–SDS system.

2.3. Rheological Behavior of the CO2-Responsive Gel

2.3.1. Rheological Properties Before and After CO2 Response

As shown in Figure 10, the TMPDA–SDS–SiO2 gel system exhibits distinctly different rheological behavior before and after CO2 exposure. Prior to CO2 introduction, the viscosity remained close to 1 mPa·s across the entire shear rate range, consistent with the characteristics of a Newtonian fluid. After CO2 stimulation, however, the viscosity rapidly increased to the order of 103–104 mPa·s and displayed clear shear-thinning behavior. This transition reflects the formation of a structured three-dimensional network, which resists flow at low shear rates but gradually breaks down under higher shear. The accompanying photographs (Figure 10) further illustrate this macroscopic change, showing the transformation from a transparent solution to a semi-translucent, highly viscous gel, thereby confirming the CO2-induced microstructural reconstruction.

2.3.2. Shear–Rest–Shear Cyclic Tests

To assess the structural reversibility of the gel network, shear–rest–shear cyclic experiments were performed on the CO2-responsive TMPDA–SDS–SiO2 gel system (Figure 11). Under high shear, the viscosity decreased sharply due to partial disruption of the micellar entanglement. Once shearing ceased, the viscosity gradually recovered, indicating that the disrupted network could spontaneously reorganize through noncovalent interactions such as electrostatic attraction, hydrogen bonding, and hydrophobic association. After several shear–rest cycles, the system largely regained its initial viscosity, demonstrating excellent shear-recovery performance. This reversibility is advantageous for field applications, where gels must endure dynamic flow conditions while maintaining plugging ability.

2.3.3. Alternating CO2/N2 Injection

The cyclic viscosity response under alternating CO2/N2 injection is presented in Figure 12. Upon CO2 injection, the viscosity increased sharply, whereas subsequent N2 injection caused a rapid decrease, reflecting partial disassembly of the CO2-stabilized micellar network. The repeatable rise-and-fall profiles over multiple cycles confirm that the CO2-responsive TMPDA–SDS–SiO2 gel system exhibits reversible gas responsiveness. Mechanistically, CO2 protonates the amino groups of TMPDA, generating carbamate/bicarbonate ionic species that promote crosslinking with SDS micelles, thereby forming a dense wormlike network. Displacement of CO2 by N2 reverses this protonation process, weakening intermolecular associations and reducing viscosity. Such tunable rheological behavior highlights the potential for regulating plugging and unplugging functions in reservoir environments through alternating CO2/N2 stimulation.

2.4. Thermal and Salt Resistance of CO2-Responsive Gels

To further evaluate the stability and applicability of the optimized CO2-responsive TMPDA–SDS–SiO2 gel system, three aspects were investigated: the influence of CO2 injection time on gel viscosity, the thermal stability under high-temperature aging, and the salt tolerance in simulated formation brines.

2.4.1. Effect of CO2 Injection Time on Gel Viscosity

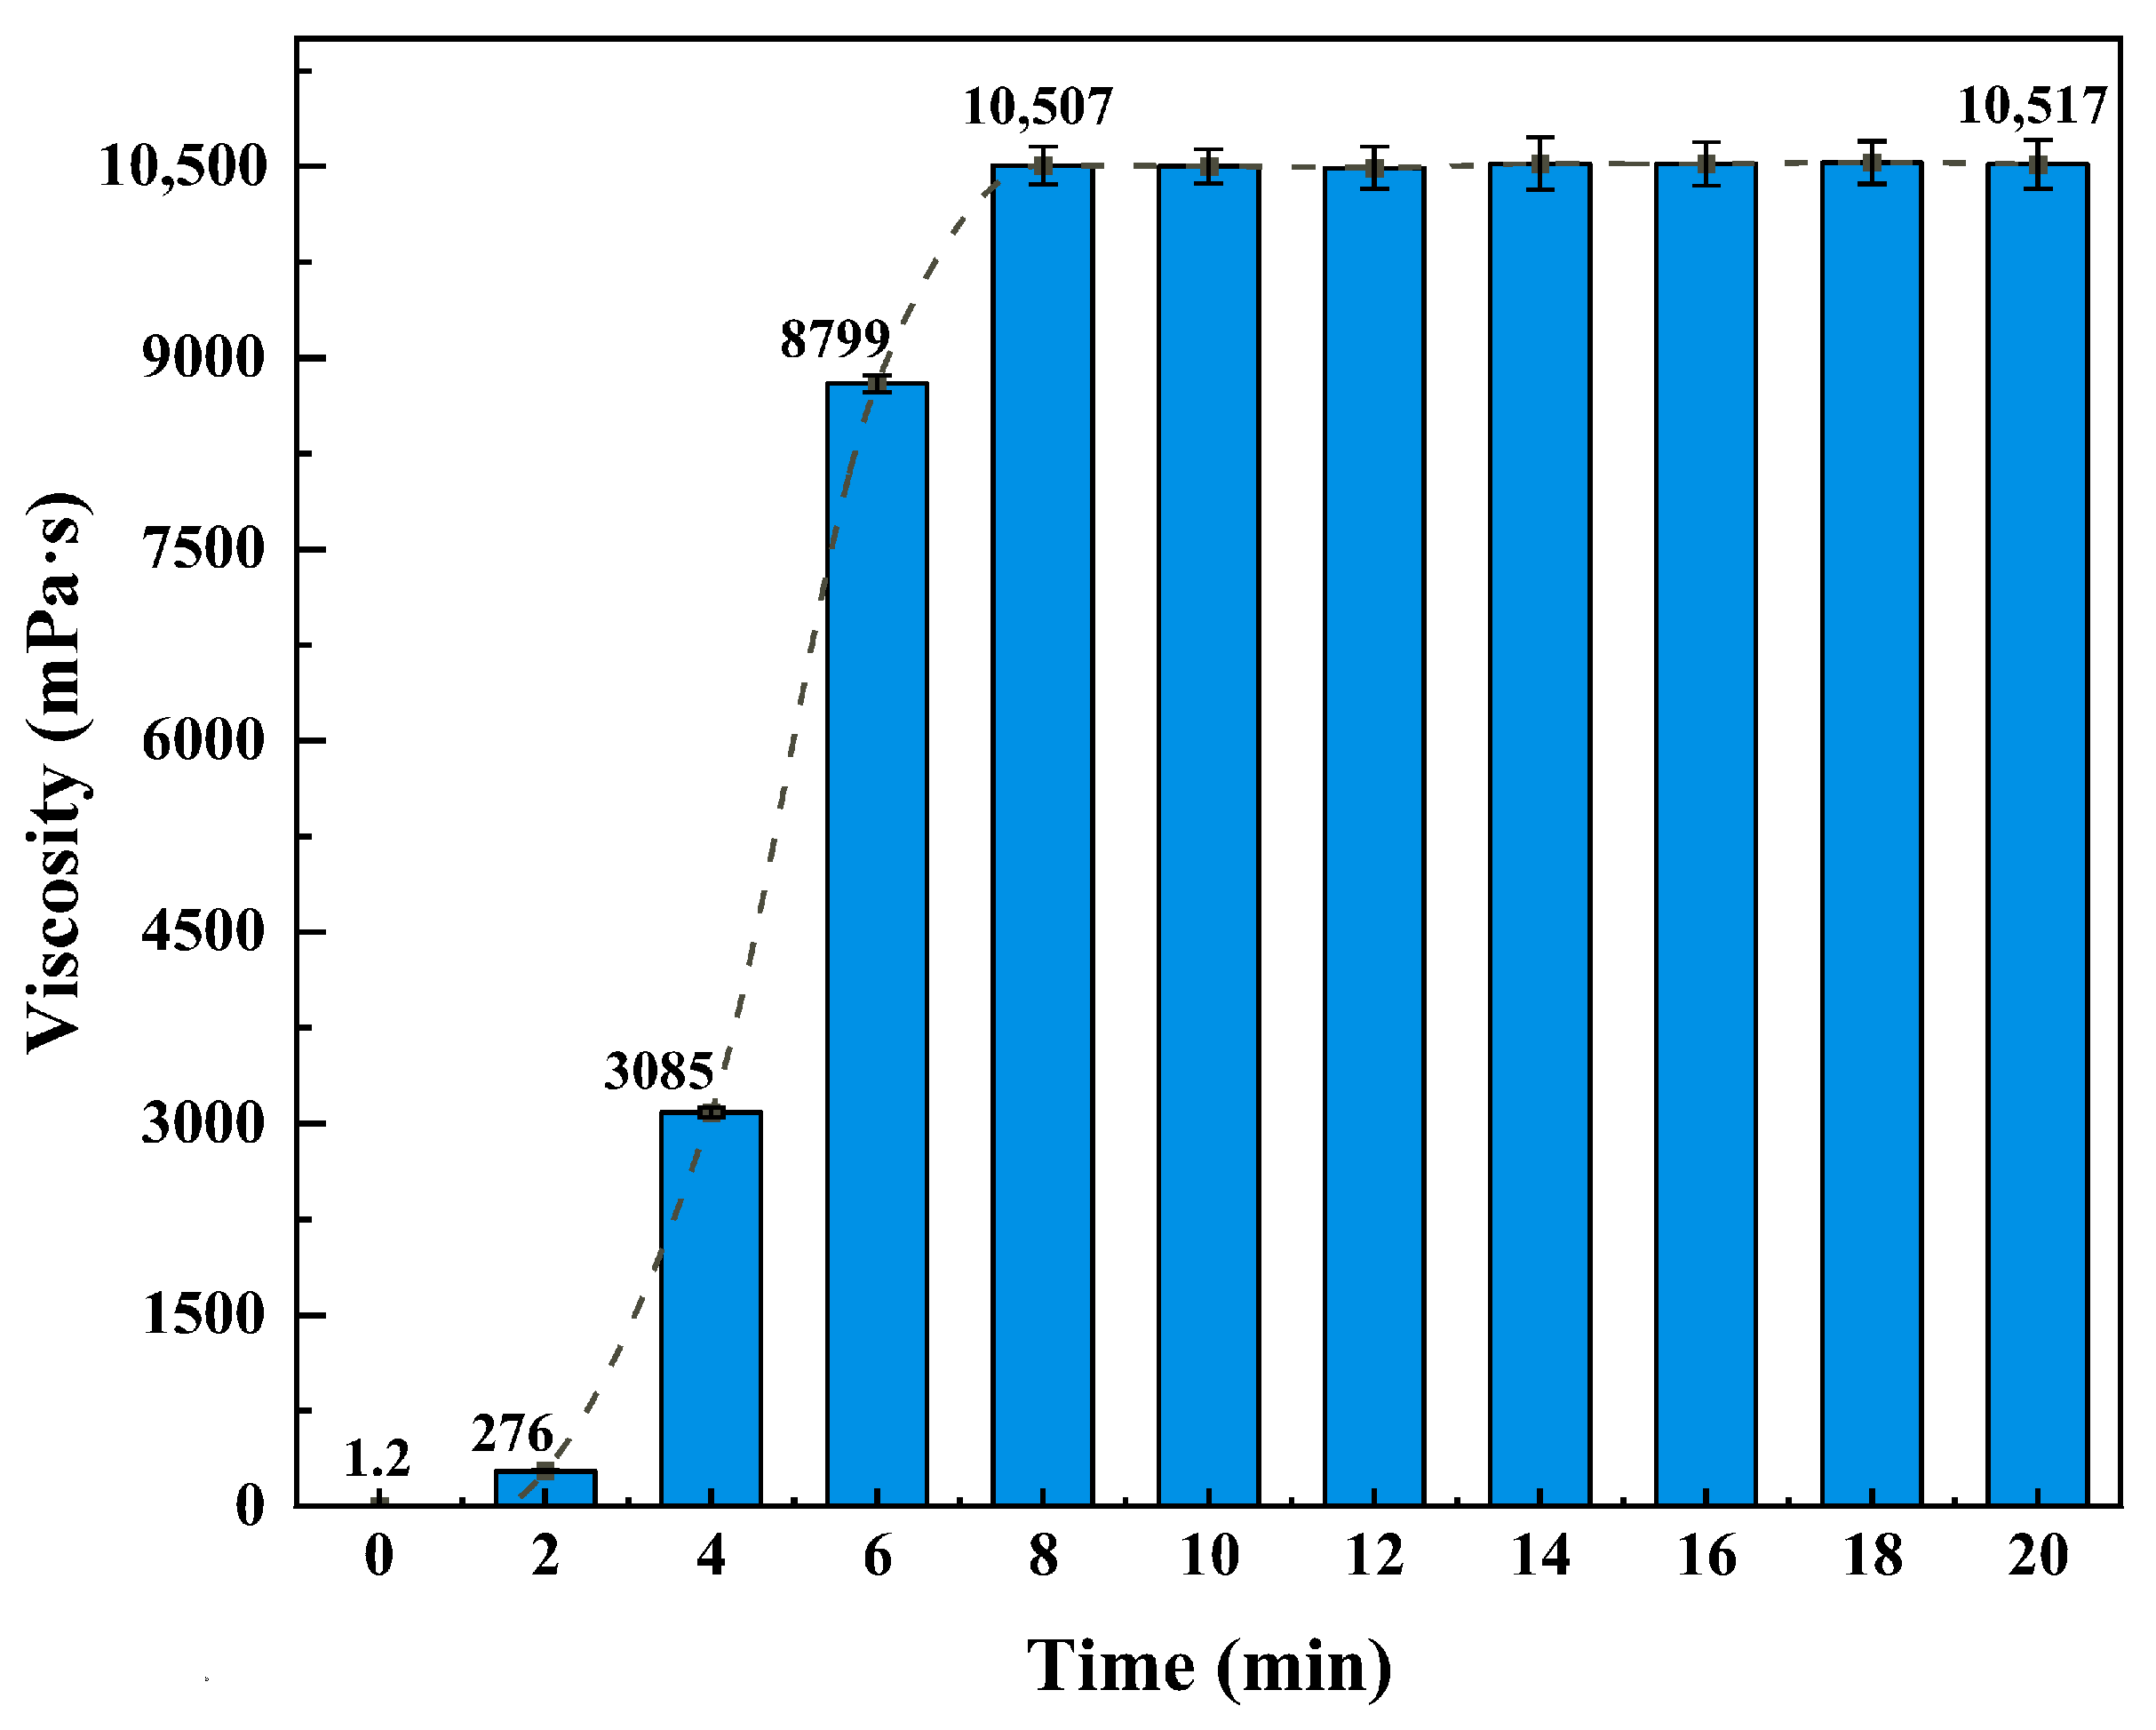
As shown in Figure 13, the viscosity of the CO2-responsive TMPDA–SDS–SiO2 gel system increased sharply with prolonged CO2 injection. The viscosity rose from 1.2 mPa·s at the initial stage to 10,507 mPa·s within 8 min, after which it reached a plateau and remained stable (10,517 mPa·s at 20 min). This behavior indicates that the gel achieves steady-state gelation rapidly, confirming its ability to undergo structural reconstruction within a short response time. Such fast responsiveness is advantageous for field applications where timely gelation is required under reservoir conditions.

2.4.2. Thermal Aging Stability at 90 °C

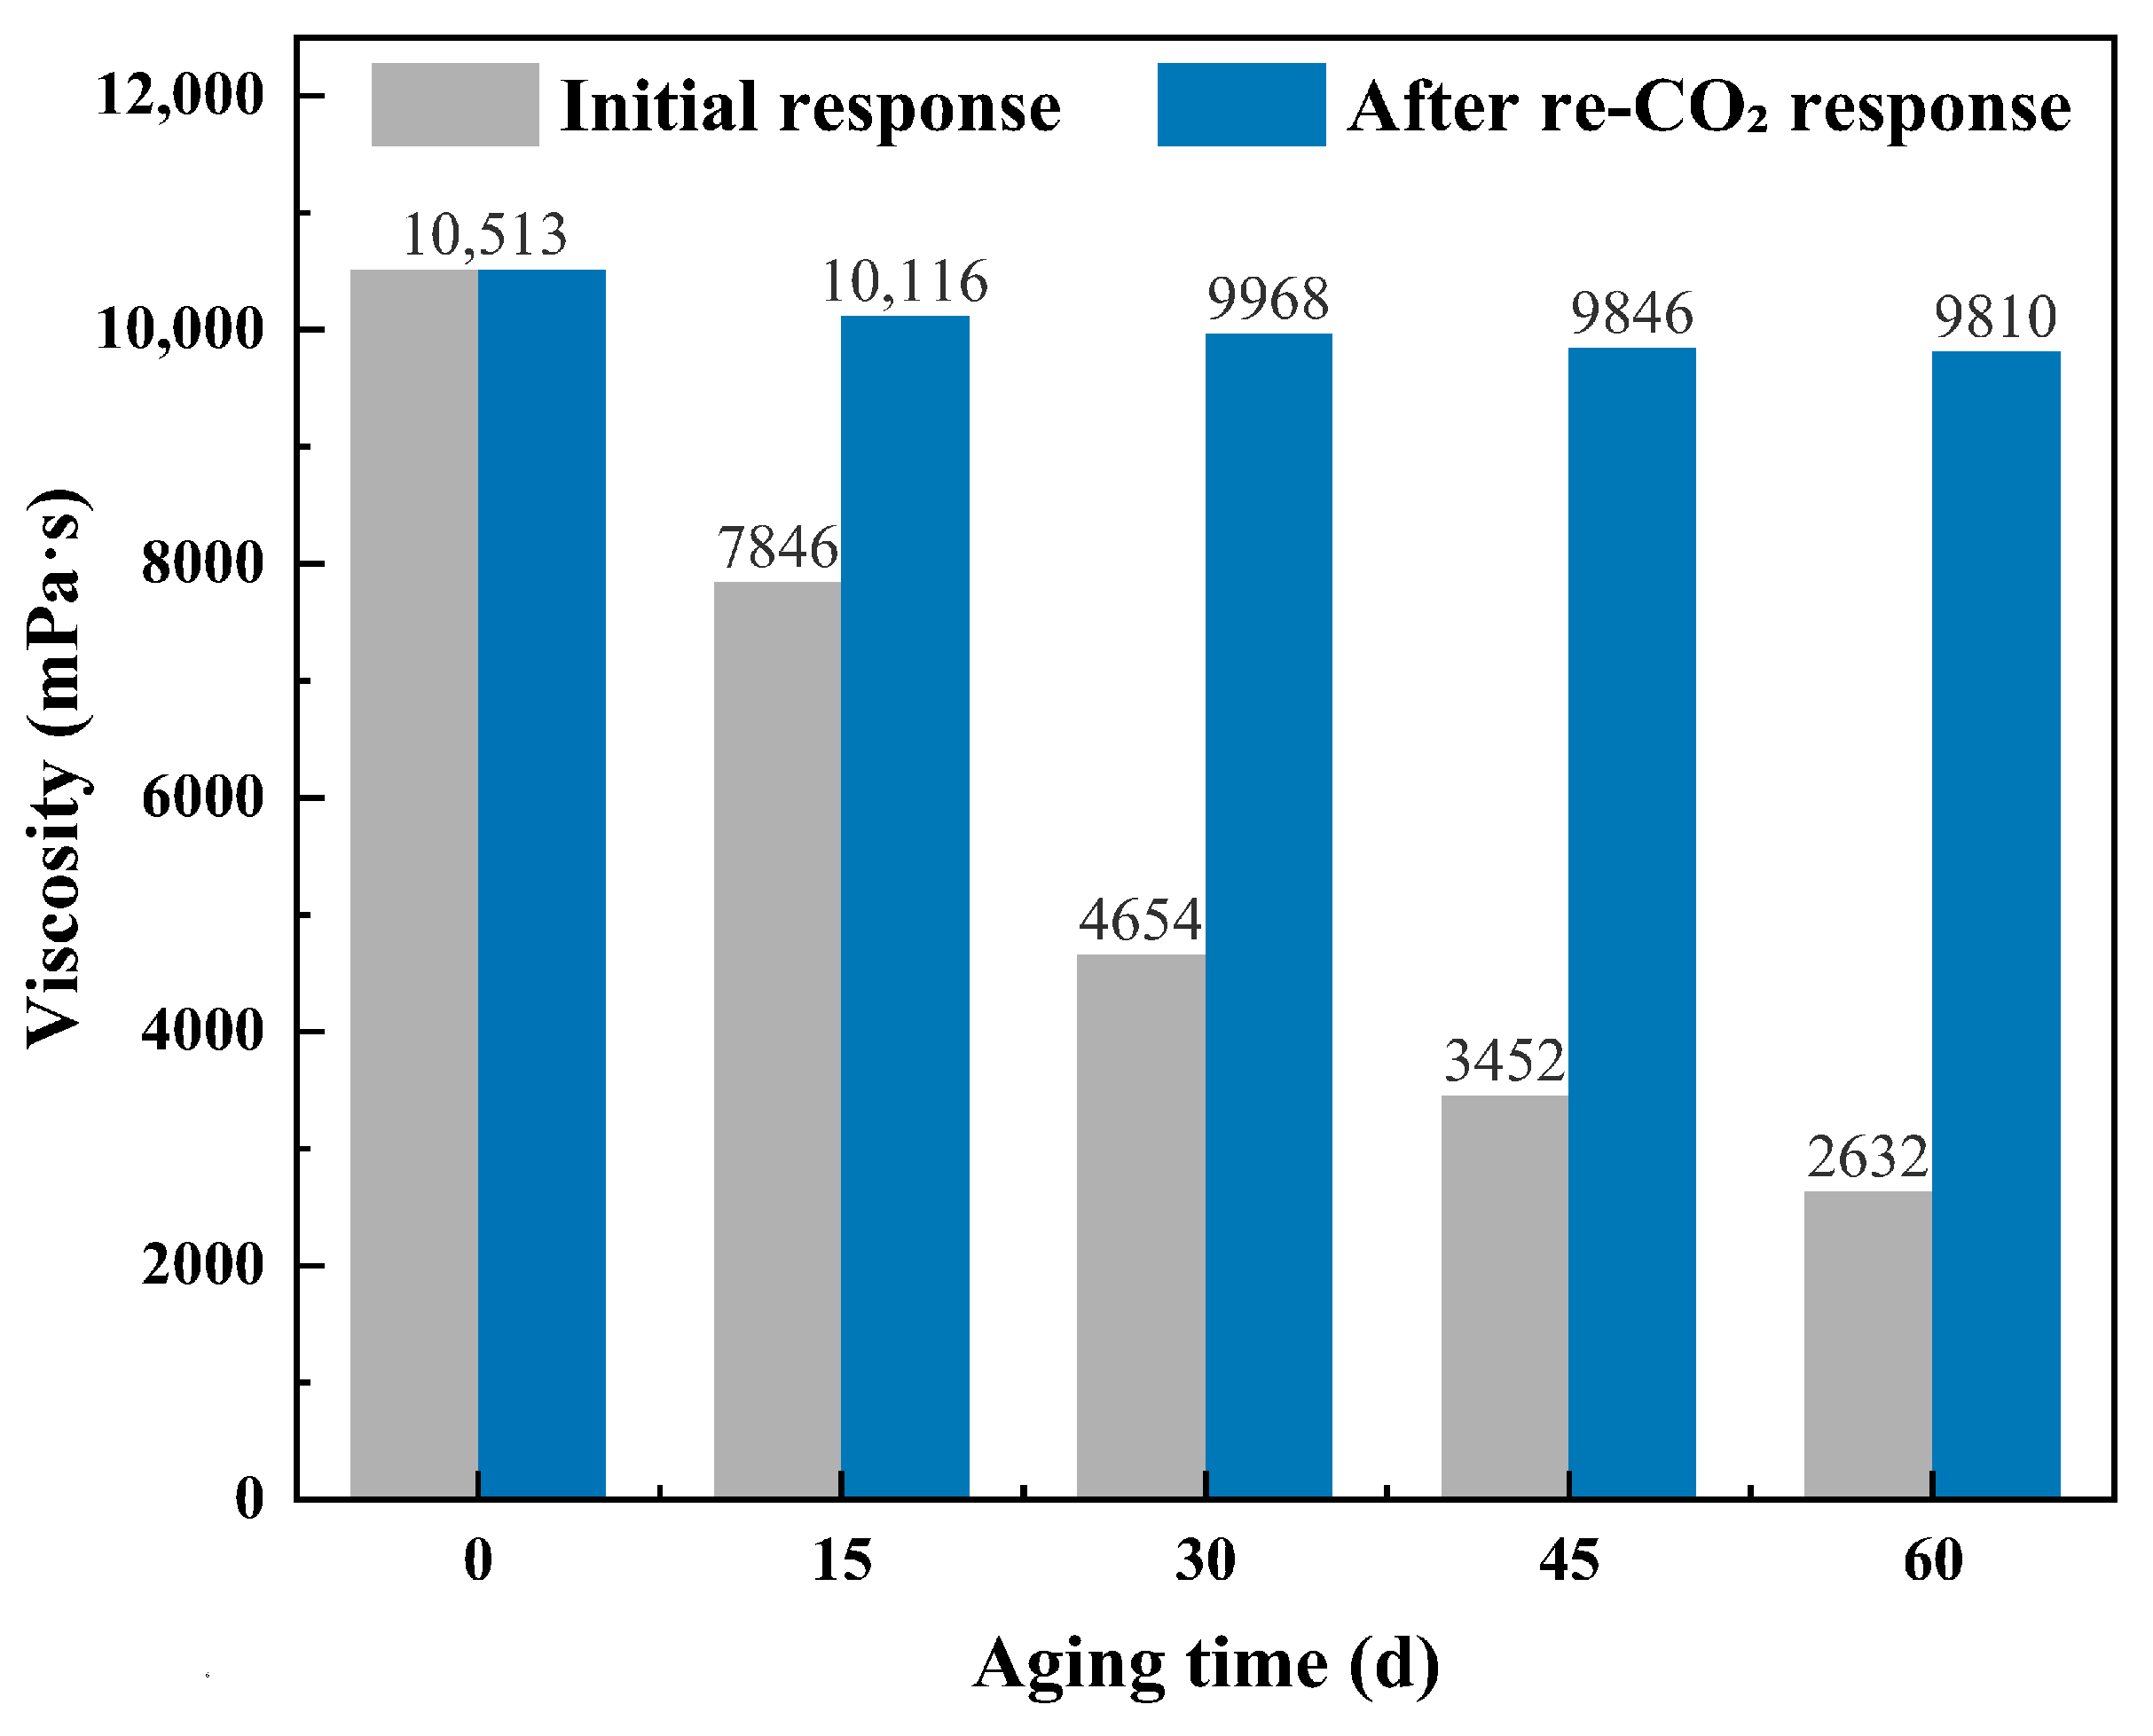
The thermal stability of the CO2-responsive TMPDA–SDS–SiO2 gel system was evaluated by aging samples at 90 °C for up to 60 days, with viscosities measured both before and after re-introduction of CO2 (Figure 14). The initial CO2-induced viscosity decreased progressively with increasing aging time, dropping from 10,513 mPa·s at day 0 to 2632 mPa·s at day 60. Nevertheless, upon re-exposure to CO2, the gel viscosity could be effectively recovered, maintaining values above 9800 mPa·s even after 60 days of high-temperature treatment. These results indicate that while prolonged thermal aging partially weakens the gel structure, the system exhibits excellent CO2-responsive recovery, ensuring long-term functional stability under reservoir conditions.

2.4.3. Salt Tolerance Under Different Salinity Levels

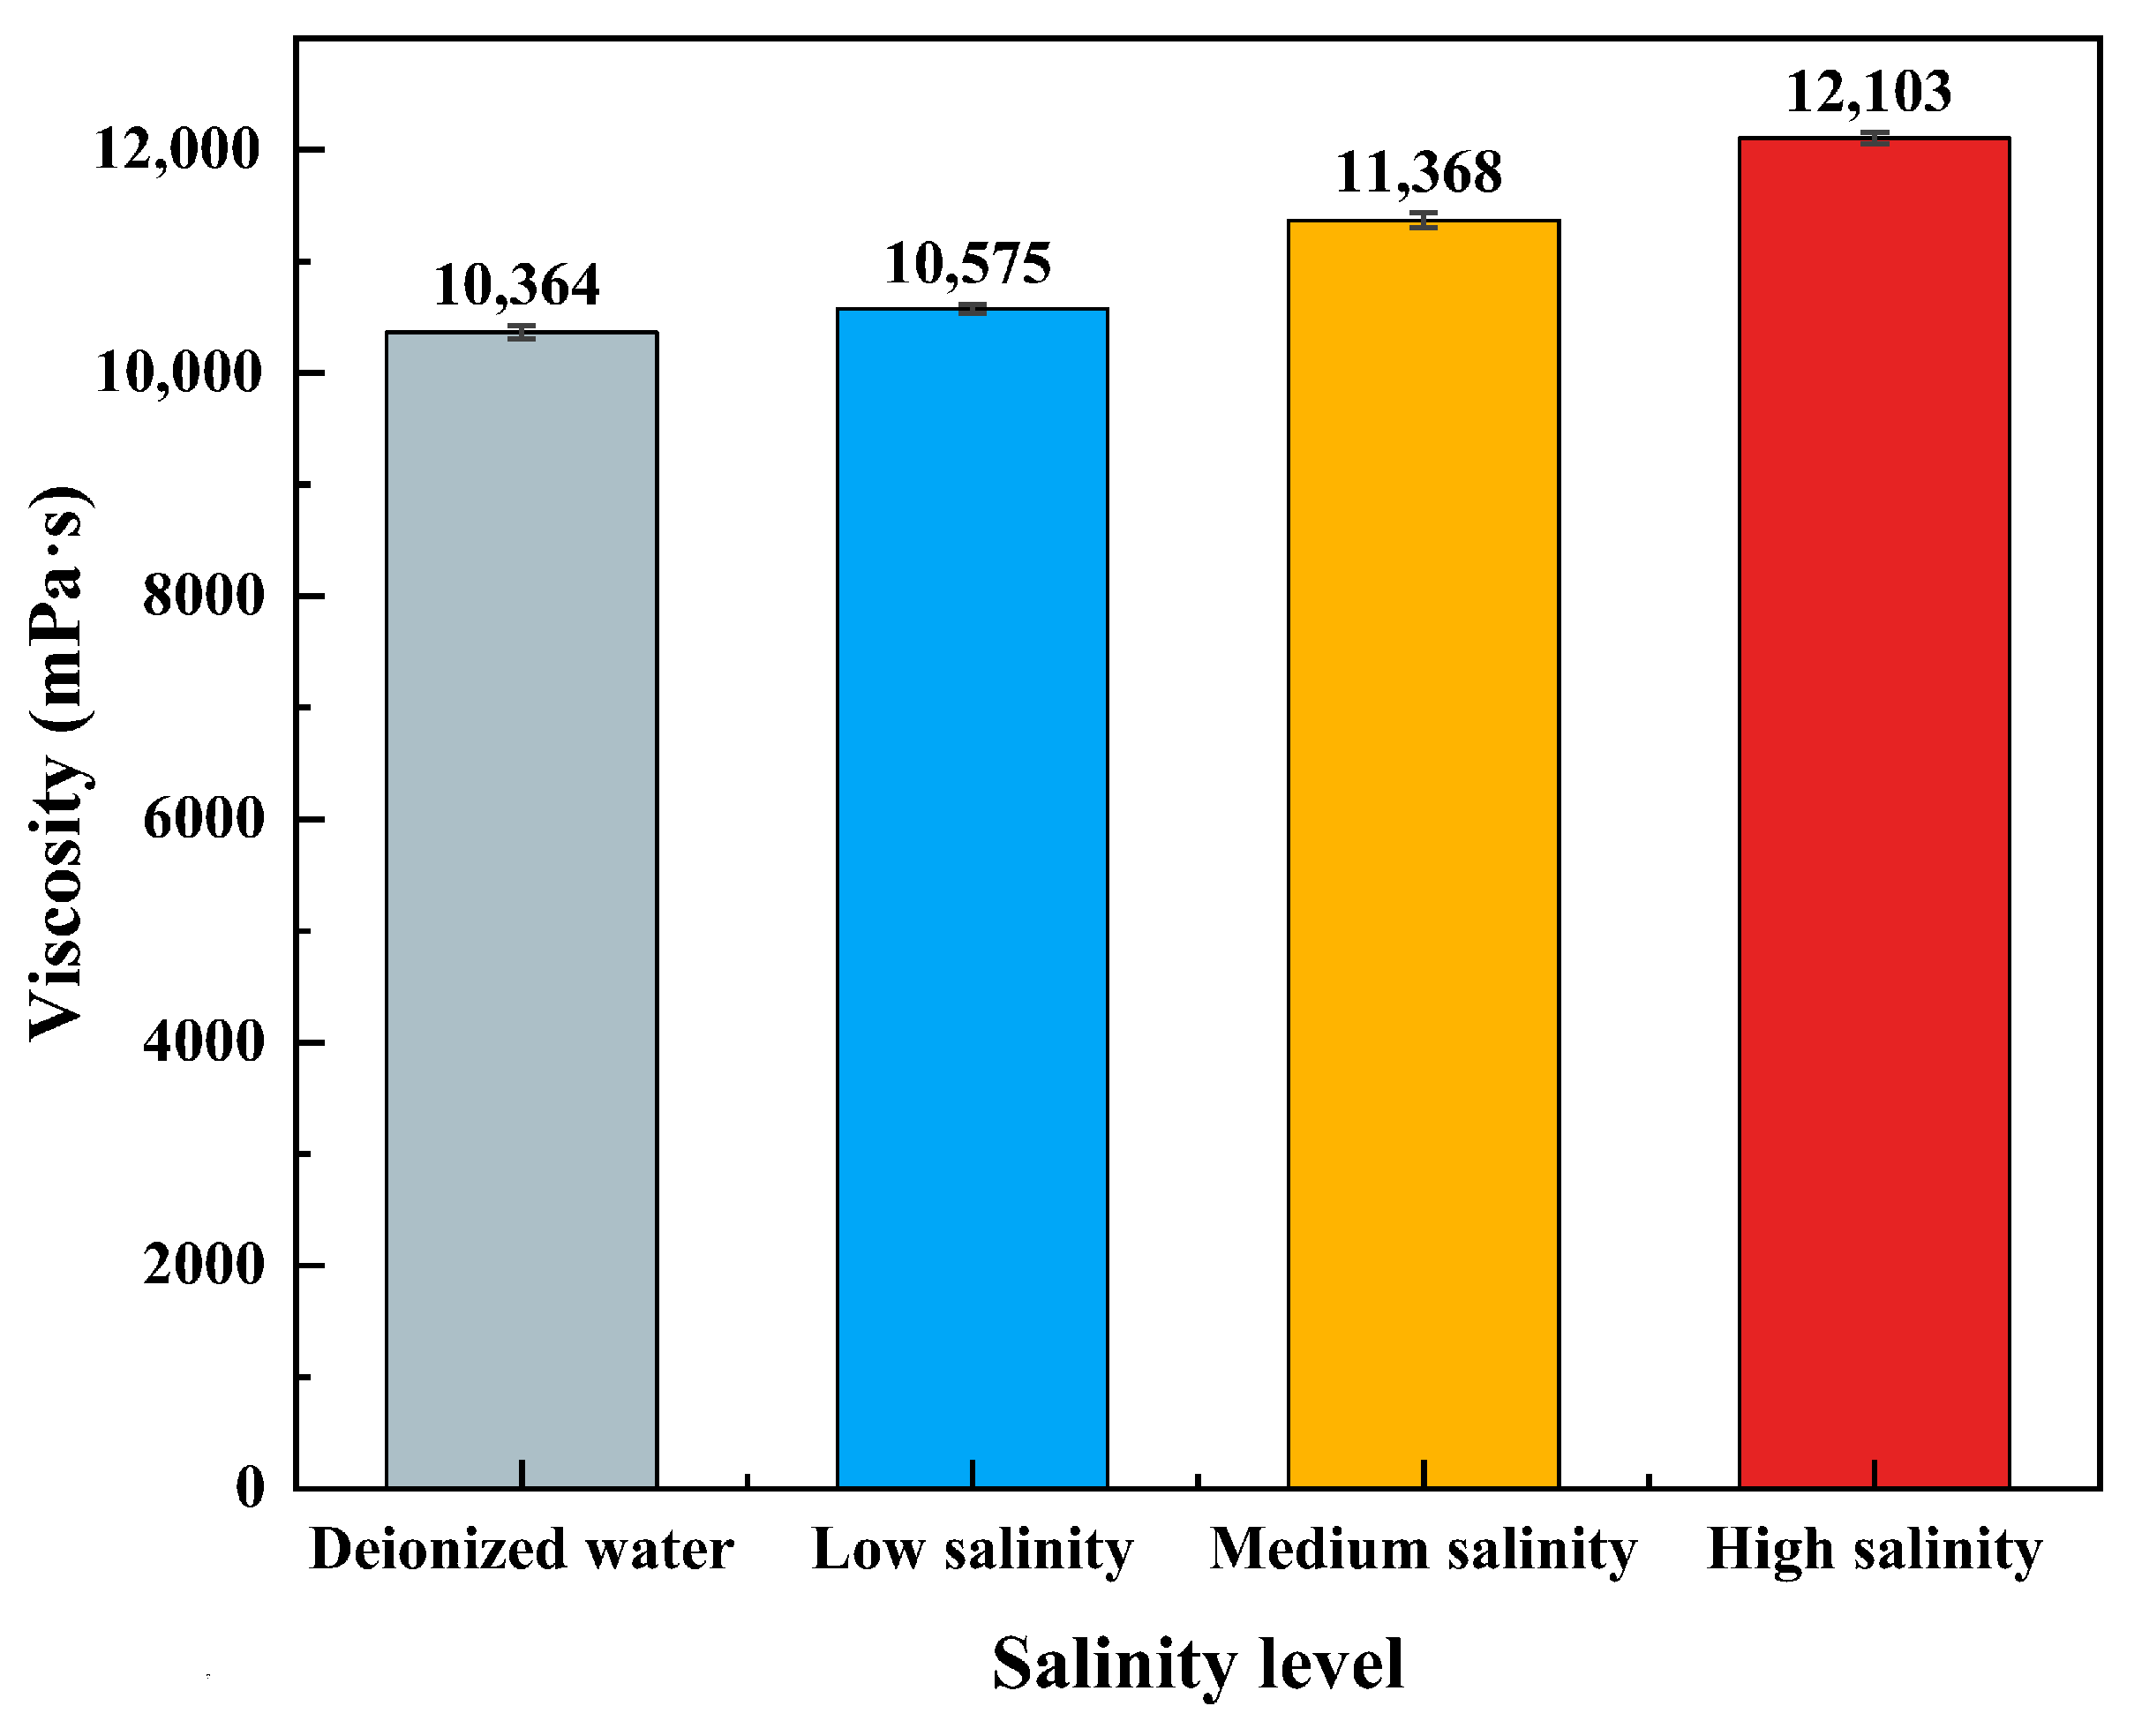
The salt tolerance of the CO2-responsive TMPDA–SDS–SiO2 gel system was evaluated using deionized water, low-salinity brine, medium-salinity brine, and high-salinity brine as solvents (Figure 15). The results showed a slight increase in viscosity with increasing salinity, from 10,364 mPa·s in deionized water to 12,103 mPa·s in high-salinity brine. This enhancement can be attributed to the screening effect of electrolytes, which reduces electrostatic repulsion between charged micelles and facilitates closer packing and reinforcement of the micellar network. These findings demonstrate that the gel system possesses excellent salt tolerance and remains effective under a wide range of reservoir salinity conditions.

2.5. Plugging Performance and Heterogeneous Core Flooding Tests

2.5.1. Relationship Between Injected PV and Plugging Performance

The plugging performance of the CO2-responsive TMPDA–SDS–SiO2 gel system in sand-packed tubes was evaluated at different injected pore volumes (PV) under a backpressure of 5 MPa (Table 1). With increasing injected PV, permeability reduction became progressively more pronounced. The blocking efficiency rose from 74.6% at 0.1 PV to 90% at 0.14 PV and reached 98.9% when the injection volume reached 0.15 PV. These results demonstrate that the gel system can achieve nearly complete plugging at relatively low injection volumes, providing the foundation for subsequent heterogeneous core flooding experiments.

2.5.2. Heterogeneous Parallel Core Flooding Experiments

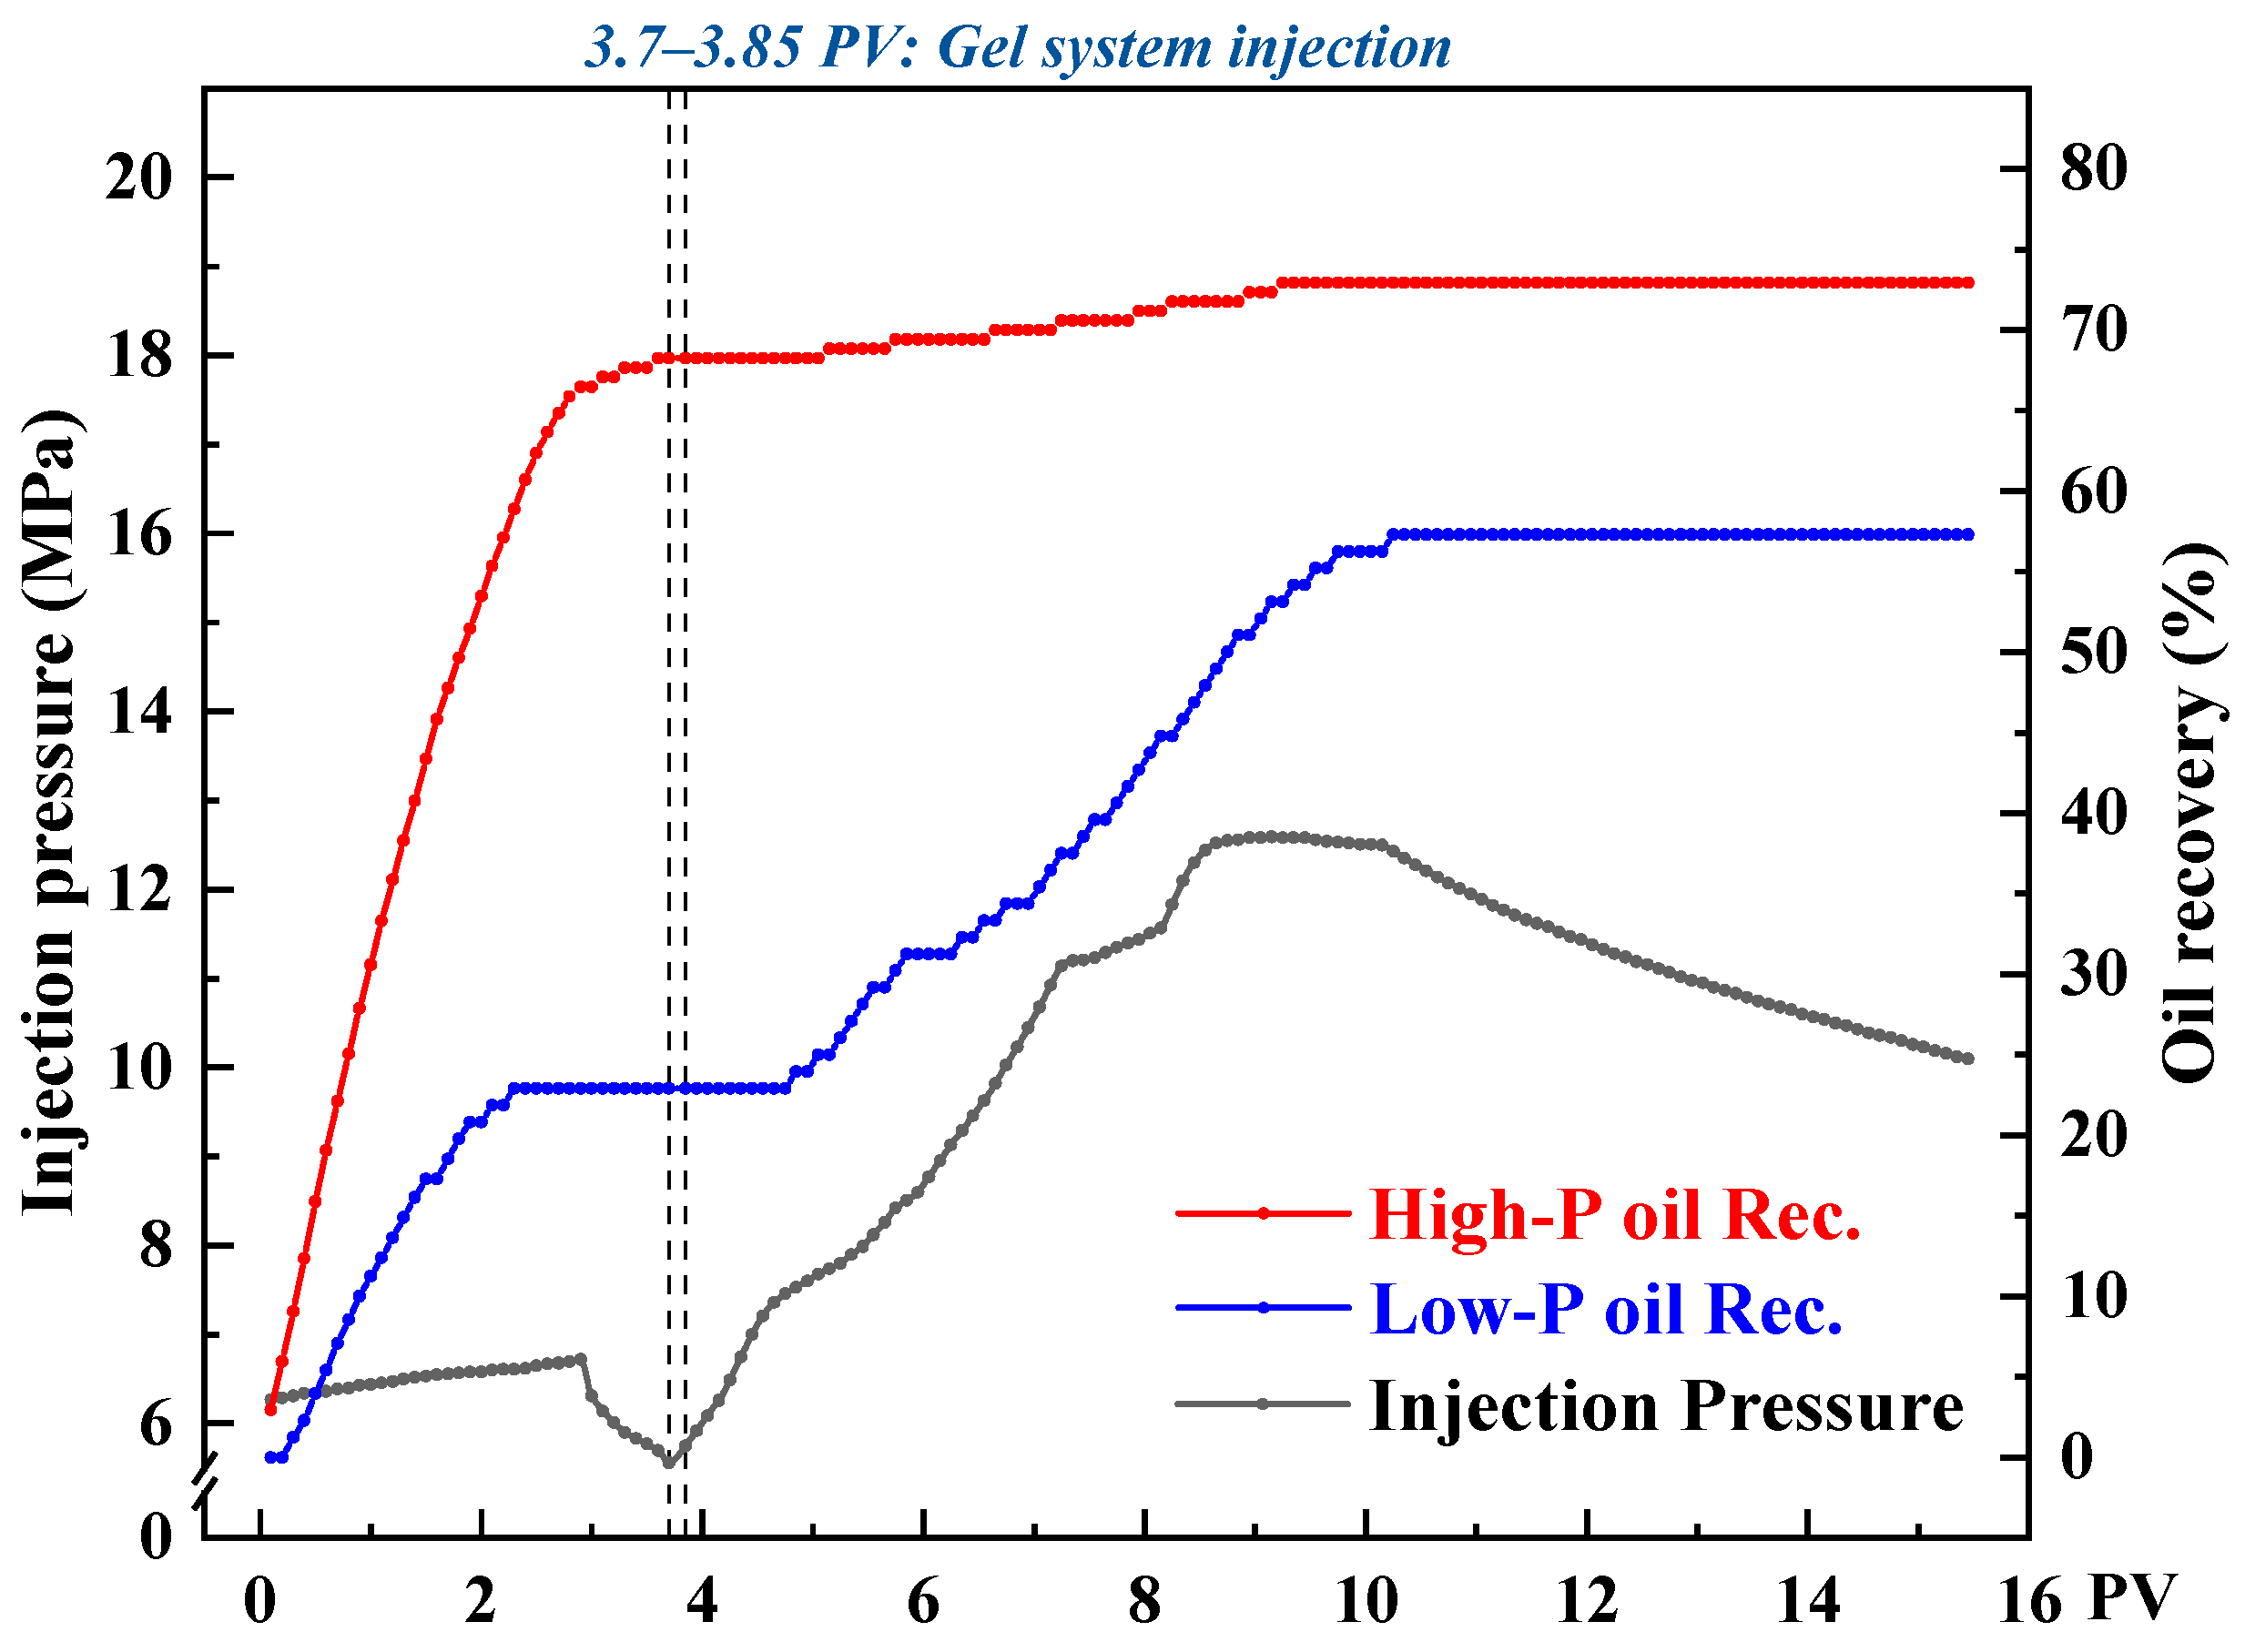
To investigate the flow-diverting behavior of the CO2-responsive TMPDA–SDS–SiO2 gel system under heterogeneous conditions during CO2 flooding, three sets of parallel core flooding experiments were conducted with permeability contrasts of 10, 20, and 30. Figure 16, Figure 17 and Figure 18 present the injection pressure and oil recovery curves, and the corresponding recovery data are summarized in Table 2.
During the initial CO2 flooding stage, the injected gas preferentially entered the high-permeability cores, resulting in rapid breakthrough and higher recovery factors (68.24%, 62.40%, and 56.30% for contrasts of 10, 20, and 30, respectively), while the low-permeability cores exhibited delayed breakthrough and lower recoveries (22.92%, 18.64%, and 17.86%). After injecting 0.15 PV of the CO2-responsive gel, the permeability of the high-permeability channels was significantly reduced, leading to a sharp rise in injection pressure. This forced subsequent CO2 to flow into the low-permeability regions, thereby improving their recoveries by 34.38%, 23.63%, and 14.28% under contrasts of 10, 20, and 30, respectively.
From the displacement curves, it can be seen that when the permeability contrast was low (contrast = 10), the gel was distributed more uniformly, which effectively expanded the sweep volume in the low-permeability core and yielded the highest incremental recovery. In contrast, under severe heterogeneity (contrast = 30), the dominant flow in the high-permeability path limited gel penetration into the low-permeability zone, resulting in a lower recovery increment.
Overall, the CO2-responsive gel system exhibited a clear profile control effect by preferentially reducing the permeability of high-permeability channels, suppressing CO2 channeling, and improving oil recovery in low-permeability regions. As the degree of heterogeneity increased, the profile control efficiency declined, indicating that in field applications, the gel dosage and plugging strategies should be adjusted according to permeability distribution to improve overall recovery.

3. Conclusions

In this study, a CO2-responsive TMPDA–SDS–SiO2 gel system was developed and evaluated. The main findings are as follows:
(1)
Formulation optimization: The optimal composition was identified as 7.39 wt% SDS + 1.69 wt% TMPDA + 0.1 wt% SiO2. This system exhibited rapid CO2-triggered gelation, with viscosity increasing from 1.2 mPa·s to >10,000 mPa·s within 8 min.
(2)
Rheological performance: The gel showed reversible shear-thinning behavior, good shear recovery, and repeatable responsiveness under alternating CO2/N2 injection, suggesting adaptability under dynamic flow conditions.
(3)
Stability: The gel retained high viscosity after thermal aging (>9800 mPa·s after 60 days at 90 °C) and maintained effectiveness across a wide salinity range.
(4)
Plugging and flooding performance: In sand-packed tubes, plugging efficiency reached 98.9% at 0.15 PV injection. In heterogeneous dual-core flooding tests, incremental recoveries of 34.4%, 23.6%, and 14.3% were obtained at permeability contrasts of 10, 20, and 30, respectively.
In summary, the TMPDA–SDS–SiO2 gel system exhibited fast CO2 responsiveness, satisfactory long-term stability, and effective profile control in laboratory tests, indicating its potential for improving mobility control and oil recovery in heterogeneous reservoirs.

4. Materials and Methods

4.1. Experimental Materials and Equipment

Experimental Materials: The low-molecular-weight amine used in this study was N,N,N′,N′-tetramethyl-1,3-propanediamine (TMPDA, analytical grade). The surfactant was sodium dodecyl sulfate (SDS, analytical grade). The nano-silica consisted of spherical particles with an average diameter of approximately 20 nm. Carbon dioxide (CO2, 99 mol%) was used as the triggering gas. Analytical-grade sodium chloride (NaCl), calcium chloride (CaCl2), and magnesium chloride (MgCl2) were used to prepare synthetic brines. Deionized water was used in all experiments. The oil sample was a mixture of crude oil from the Zhongyuan Oilfield and kerosene at a 1:1 mass ratio, with the viscosity of the simulated oil measured as 3.08 mPa·s at 40 °C.
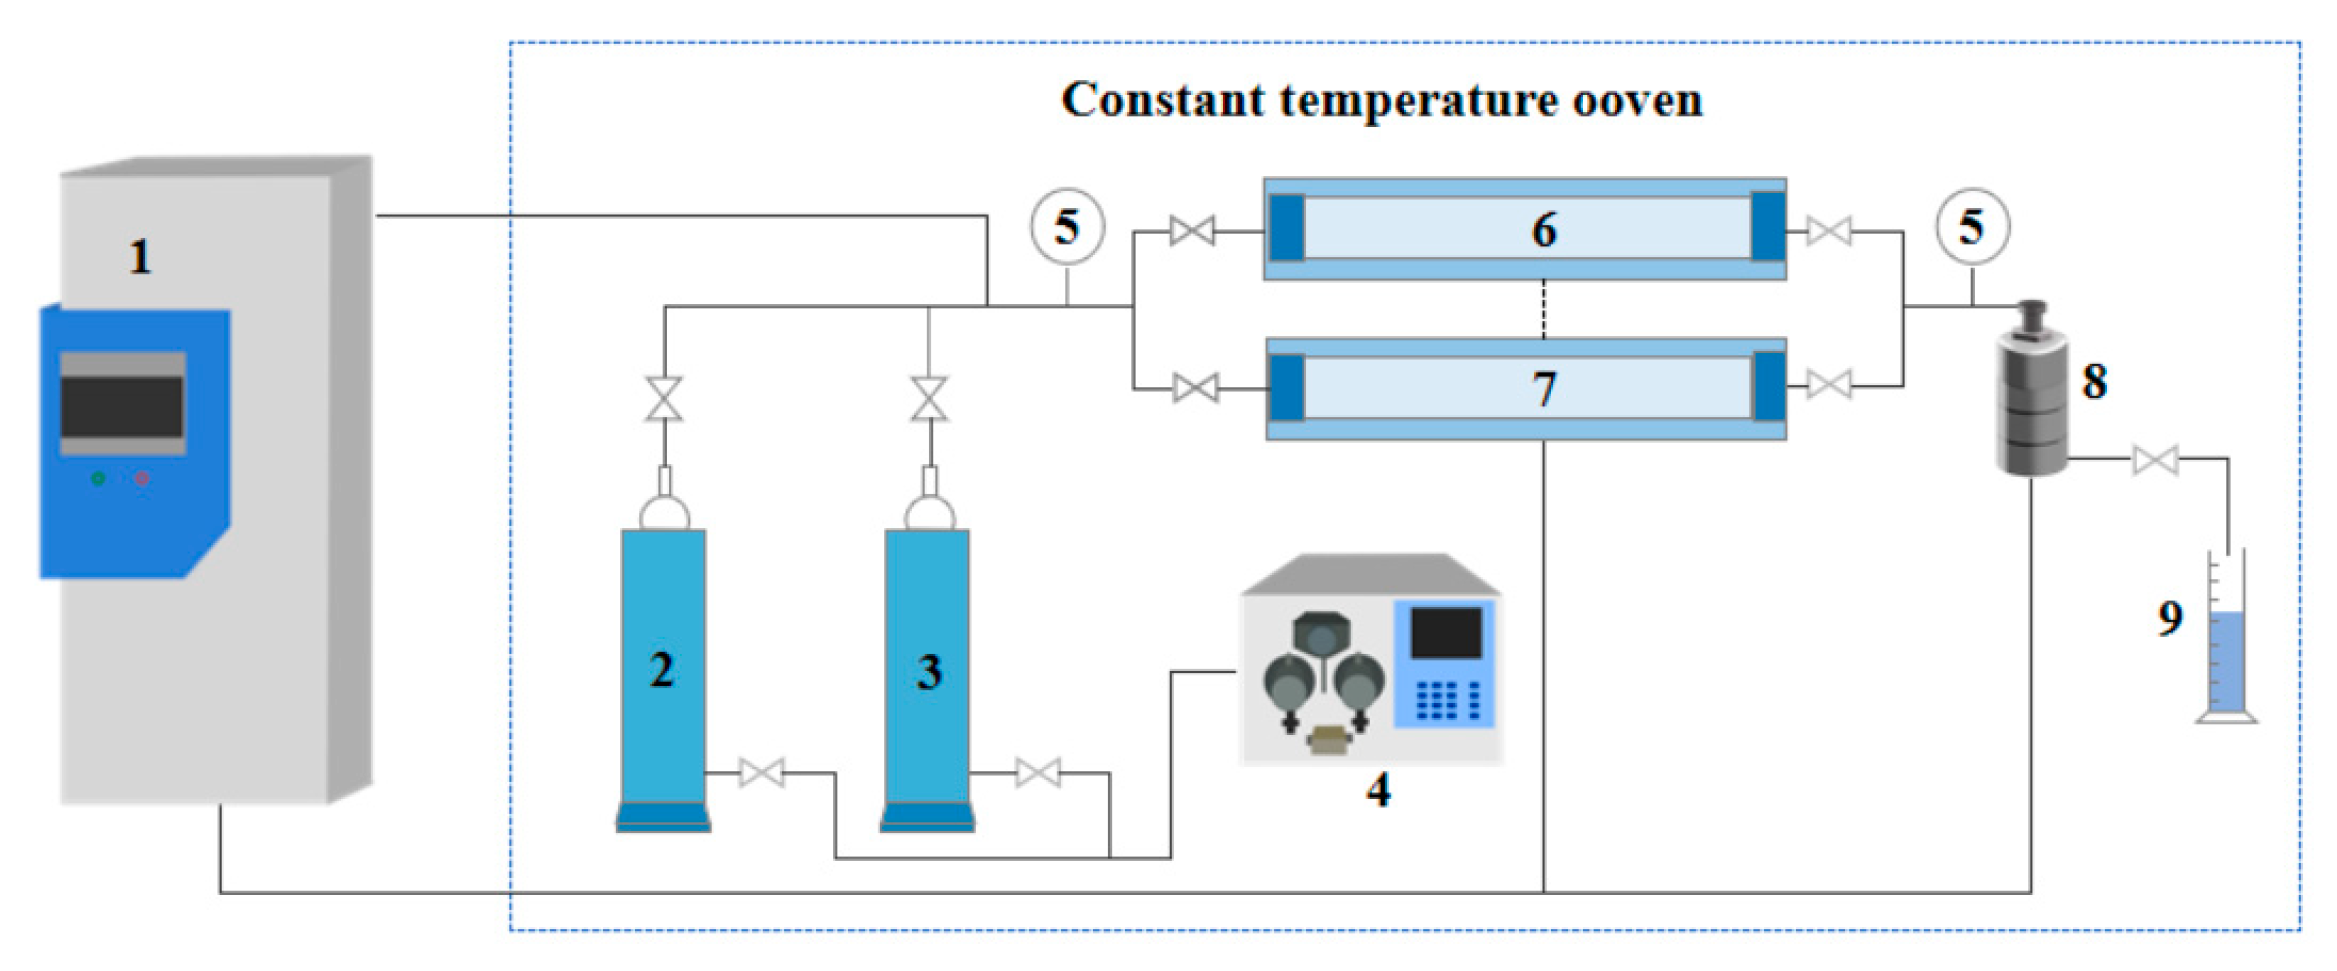
Experimental Equipment: The main instruments included a digital viscometer (DV-II, Brookfield, AMETEK, Middleboro, MA, USA), a flowmeter (G10-15F, Chengfeng Flowmeter Co., Ltd., Shandong, China), a nuclear magnetic resonance (NMR) spectrometer (Avance III 300 MHz, Bruker Corporation, Billerica, MA, USA), a rotational rheometer (Haake MARS 60, Thermo Fisher Scientific, Karlsruhe, Germany), a scanning electron microscope (SU3500, Hitachi High-Tech Corporation, Tokyo, Japan), and a Fourier transform infrared (FTIR) spectrometer (Tensor 27, Bruker Corporation, Billerica, MA, USA). A core flooding system (see Figure 19) was employed to conduct heterogeneous dual-core parallel flooding experiments.

4.2. Preparation and Optimization of the CO2-Responsive TMPDA–SDS–SiO2 Gel System

Gel Preparation Method: SDS, TMPDA, and nano-silica were dissolved in deionized water in the designed proportions and placed in a three-necked flask. The mixture was stirred at room temperature for 5 min until a transparent solution was obtained, representing the pre-gelation state. After standing for 10 min, the solution was transferred to a gas-washing bottle. Under ambient temperature and pressure, CO2 was continuously introduced at a flow rate of 0.1 L·min−1 using a glass rotameter, while stirring was maintained to ensure adequate gas–liquid contact until the solution transformed into a viscoelastic gel.
Formulation Optimization Method: A single-factor method was used to evaluate the effects of the SDS:TMPDA molar ratio, the total mass fraction of SDS + TMPDA, and the nano-silica content on the viscosity of the CO2-responsive TMPDA–SDS–SiO2 gel system, with the goal of determining the optimal formulation. The experimental design included the following: (1) SDS:TMPDA molar ratios of 0.5, 1.0, 1.5, 2.0, 2.5, and 6.0; (2) 18 groups of total SDS + TMPDA mass fractions, ranging from 1.44% SDS + 0.33% TMPDA to 18.49% SDS + 4.24% TMPDA; and (3) nano-silica concentrations of 0.02%, 0.04%, 0.06%, 0.08%, 0.09%, 0.1%, 0.3%, 0.5%, 0.7%, and 0.9%. The viscosity of the gel after CO2 stimulation was measured using a digital viscometer.

4.3. Structural Characterization

1H-NMR Analysis: 1H nuclear magnetic resonance (1H-NMR) spectroscopy was performed on TMPDA, SDS, a TMPDA–SDS mixture, and the CO2-responsive TMPDA–SDS mixture. The procedure was as follows: (1) each sample was dissolved in D2O and transferred to an NMR tube, with the measurement temperature set at 25 °C; (2) the NMR probe was tuned to match the magnetic field and radio frequency source; (3) the instrument was calibrated and parameters were set; and (4) data were acquired, and free induction decay (FID) signals were collected.
FTIR Analysis: Fourier-transform infrared (FTIR) spectroscopy was used to characterize TMPDA–SDS solutions before and after CO2 stimulation. Samples were tested using the smear method, and spectra were recorded at 25 °C.
SEM Analysis: Scanning electron microscopy (SEM) was employed to observe TMPDA–SDS mixtures before and after CO2 stimulation. The procedure included the following: (1) ultra-low-temperature freezing of the samples; (2) fracturing of the frozen samples under cryogenic conditions, followed by sputter-coating with a thin metal layer; and (3) low-temperature SEM imaging.
All structural and spectroscopic characterizations in this section were conducted on the TMPDA–SDS system with a composition of 7.39 wt% SDS and 1.69 wt% TMPDA, without the addition of nano-silica.

4.4. Rheological Behavior Evaluation

Steady Shear Behavior: A gel sample prepared with the optimized TMPDA–SDS–SiO2 formulation (7.39 wt% SDS, 1.69 wt% TMPDA, and 0.1 wt% SiO2) was tested for viscosity under varying shear rates (0.1–500 s−1) at 25 °C using a rotational rheometer.
Shear Recovery Property: The shear recovery performance was evaluated by conducting a shear–rest–shear cycle test at a constant shear rate of 100 s−1.
Alternating CO2/N2 Injection Test: To examine gas responsiveness, CO2 and N2 were alternately injected into the gel solution at a flow rate of 0.1 L·min−1 at 25 °C. Viscosity changes during gas alternation were monitored using a digital viscometer.
Effect of CO2 Injection Time: The influence of CO2 injection duration on system viscosity was investigated at 25 °C using a digital viscometer. CO2 was continuously injected at 0.1 L·min−1 for up to 20 min, and viscosity was recorded at 2 min intervals.

4.5. Thermal and Salt Resistance

Thermal Aging Test (90 °C): Experiments were performed on the CO2-responsive TMPDA–SDS–SiO2 gel system with the optimized formulation (7.39 wt% SDS, 1.69 wt% TMPDA, and 0.1 wt% SiO2). Gel samples were sealed and aged in an oven at 90 °C for 0, 15, 30, 45, and 60 days. At each aging time point, the samples were cooled to 25 °C, and their apparent viscosities were measured under identical conditions using a digital viscometer. Immediately afterward, CO2 was introduced into the same samples at 25 °C at a rate of 0.1 L·min−1 until a stable viscosity was obtained, and the post-response viscosity was recorded.
Salt Tolerance: Synthetic brines with low (5275.1 mg·L−1), medium (21,000 mg·L−1), and high (52,780.1 mg·L−1) salinities were prepared using NaCl, CaCl2, and MgCl2, with deionized water as the zero-salinity control. Gel solutions were formulated using these brines, and CO2 was injected at 25 °C at a rate of 0.1 L·min−1 until the viscosity stabilized. The apparent viscosity was then measured at 25 °C using a digital viscometer.

4.6. Plugging Performance and Heterogeneous Core Flooding

Relationship between Injected PV and Plugging Efficiency: Experiments were conducted in sand-packed tubes at 40 °C under a backpressure of 5 MPa and a confining pressure of 20 MPa, using the CO2-responsive TMPDA–SDS–SiO2 gel system (7.39 wt% SDS, 1.69 wt% TMPDA, and 0.1 wt% SiO2). The procedure was as follows: (1) Quartz sand was packed into the tubes, and the pore volume (PV) was determined by water saturation; (2) Initial CO2 permeability (k0) was measured at an injection rate of 2 mL·min−1; (3) Gel solutions were injected at different pore volumes (0.10, 0.12, 0.14, 0.15, 0.25, and 0.50 PV); (4) CO2 was reinjected at 2 mL·min−1 while continuously monitoring inlet/outlet pressures and outlet flow rate. Once steady state was reached, permeability after gel injection (k1) was calculated. Plugging efficiency was then determined using the plugging ratio (1–k1/k0).
Heterogeneous Dual-Core Parallel Flooding: These experiments were performed in dual-core systems with permeability contrast ratios of 10 (high: 300 mD; low: 30 mD), 20 (high: 600 mD; low: 30 mD), and 30 (high: 600 mD; low: 20 mD). The procedure was as follows: (1) High- and low-permeability cores were oven-dried and aged for 6 h, then sequentially saturated with deionized water and simulated oil; (2) The cores were mounted in the flooding apparatus, with the experimental conditions set to 40 °C, 5 MPa backpressure, and 20 MPa confining pressure; (3) CO2 was injected at 2 mL·min−1 until no further fluid was produced; (4) 0.15 PV of the TMPDA–SDS–SiO2 solution was injected; (5) A second CO2 flooding was carried out until no additional fluid was produced, concluding the experiment. Throughout the entire process, inlet/outlet pressures, cumulative oil production, and CO2 volume were recorded at every 0.1 PV of injection.
A schematic flowchart of the experimental procedures, including gel preparation, structural and rheological characterization, and core-flooding tests, is shown in Figure 20.
Author Contributions

Conceptualization, M.F. and G.L.; Methodology, G.L.; Validation, J.C. and Y.Z.; Formal analysis, G.L.; Investigation, G.L.; Resources, M.F.; Data curation, J.C. and Y.Z.; Writing—original draft preparation, G.L.; Writing—review and editing, G.L.; Visualization, J.C.; Supervision, M.F.; Project administration, M.F.; Funding acquisition, M.F. All authors have read and agreed to the published version of the manuscript.

Funding

This research received no external funding. The study and the APC were financially supported by the corresponding author (Meilong Fu).

Data Availability Statement

The data supporting the findings of this study are available within the article. Further inquiries can be directed to the corresponding author.

Conflicts of Interest

Author Jun Chen was employed by the Oil and Gas Technology Research Institute, PetroChina Qinghai Oilfield Company. The remaining authors declare that the research was conducted in the absence of any commercial or financial relationships that could be construed as a potential conflict of interest.

Nomenclature

Abbreviation
TMPDAN,N,N′,N′-tetramethyl-1,3-propanediamine
SDSSodium dodecyl sulfate
SiO2Nano-silica
CO2Carbon dioxide
N2Nitrogen
NMRNuclear magnetic resonance
FTIRFourier transform infrared spectroscopy
SEMScanning electron microscopy
Symbols
PVpore volume
k0initial permeability (mD)
k1permeability after gel treatment (mD)
wt%weight percent
mol%mole percent

Appendix A

Table A1. Experimental data for Figure 3.
SDS:TMPDA Molar RatiosViscosity (mPa·s)
Experiment #1Experiment #2Experiment #3
0.5:1953971940
1:1201119782060
1.5:1302331012950
2:1380737403889
2.5:1291228702955
3:1275427092811
Table A2. Experimental data for Figure 4.
SDS and TMPDA Mass FractionsExperiment #1Experiment #2Experiment #3
Viscosity Before Response (mPa·s)Viscosity After Response (mPa·s)Viscosity Before Response (mPa·s)Viscosity After Response (mPa·s)Viscosity Before Response (mPa·s)Viscosity After Response (mPa·s)
1.44% SDS + 0.33% TMPDA1.2131----
2.4% SDS + 0.55% TMPDA1.254----
3.6% SDS + 0.83% TMPDA1.21507----
4.65% SDS + 1.07% TMPDA1.22043----
5.55% SDS + 1.27% TMPDA1.224321.224491.22413
6.41% SDS + 1.47% TMPDA1.235141.235091.23498
7.39% SDS + 1.69% TMPDA1.363451.363171.36321
8.38% SDS + 1.92% TMPDA1.374531.374321.37419
9.49% SDS + 2.18% TMPDA1.490261.490431.49017
10.49% SDS + 2.4% TMPDA1.414,078----
11.54% SDS + 2.64% TMPDA1.516,012----
12.54% SDS + 2.87% TMPDA1.519,514----
13.73% SDS + 3.14% TMPDA1.622,562----
14.78% SDS + 3.39% TMPDA1.725,504----
15.82% SDS + 3.62% TMPDA1.828,076----
16.64% SDS + 3.81% TMPDA1.937,124----
17.58% SDS + 4.03% TMPDA256,784----
18.49% SDS + 4.24% TMPDA2.367,890----
Table A3. Experimental data for Figure 5.
SiO2 Mass Fraction (%)Viscosity (mPa·s)
Experiment #1Experiment #2Experiment #3
0.02777276577828
0.04888388059026
0.06976794829870
0.0810,152998110,255
0.0910,27110,06510,276
0.110,31110,25910,369
0.39865979110,043
0.5861086908936
0.7752475547583
0.9630062136352
Table A4. Experimental data for Figure 12.
Shear Rate (s−1)Viscosity (mPa·s)
Experiment #1Experiment #2Experiment #3
0.082822941.925762924.451982910.293494
-2941.925762921.556962907.085341
-2909.997232885.9549022933.387979
-2913.555152930.4551562917.115085
-2926.465992949.253952901.087358
-2939.5 2948.729012932.001891
-2943.616152951.0026832930.950206
-2945.056922949.2485872935.054047
-2951.075322952.8453252984.947004
-2955.937862954.6613742958.943709
-2959.501742971.0702582969.89688
-2961.246732960.8110732961.884063
-2964.084152968.3381342970.802287
-2967.907192969.8745422966.743545
-2971.133712976.2025542962.736465
-2971.970562979.4751882986.780223
-2973.993782975.5070672978.762815
-2976.164822974.2211032973.830323
-2978.1 2979.5857422966.59278
-2979.230882982.642612980.407619
-2980.346682979.576082978.808597
-2982.813122981.4896192981.562697
-2985.2 2985.8358652981.425908
-2986.197232989.6550462976.365261
-2987.695462987.1564672988.338924
-2989.480972990.492822989.415143
-2991.541622992.6257932995.51707
-2993.178842991.3857762988.641087
-2993.949652993.9725032991.984435
-2995.320082995.1058652996.330039
-2997.369052996.35022993.105352
-2998.863222995.3776793002.25732
-3000.102283002.4613662997.257523
-3001.4723002.6188513000.113686
-3002.969983006.3098212997.178036
-3004.558333008.8202173008.144022
-3005.314353004.253172999.058168
-3005.950213002.3359362999.04102
-3007.310393007.2824473005.002555
-3008.605483006.2536343015.796879
-3009.423733011.6591153009.859272
-3010.072953010.0506573012.664186
-3011.006593012.7934123006.639049
-3013.517383014.7887353012.559839
-3012.969493010.7708643016.582434
-3010.480643012.9347663006.503291
-3009.41113013.6441363007.680591
-3009.910113008.3138013011.465451
-3009.900333012.8216093013.344627
-3008.683213009.0011993015.467119
-3012.647393013.5953623011.235266
-3021.552563020.5473873015.275831
-3025.47863021.9987983028.268727
-3029.106143026.4319983025.322537
-3026.296143028.0220093027.150719
-3023.399833025.5296753024.178104
-3026.944643028.6440623023.144129
-3029.719353029.0318553030.115732
-3029.535773032.8772313032.152254
-3029.589183033.7563223031.081613
-3032.367713031.2568993029.128707
-3031.222343033.9311163030.048866
-3034.035443036.8928913033.027063
-3036.621573035.1555143026.02729
-3038.578033036.2010033033.003003
-3037.485123038.2081663034.972299
-3038.233763039.7429083037.009014
-3039.753913041.2735623037.948091
-3042.255163040.8087643038.92502
-3041.011813041.6677283040.90496
-3044.85753043.9039593042.940796
-3048.190833046.8721493047.882974
-3051.684623050.8519143052.882597
-3053.341873054.0639063051.863614
-3055.329083052.2932793053.84869
-3049.153093049.3313863050.872004
-3050.358533051.114943052.780489
-3053.608423054.0374813055.83
-3050.365213052.9120743048.654036
-3042.054653045.6465153042.635671
-3044.526583046.3750143048.653781
-3052.321673051.4375153048.597837
-3066.717863069.5000183063.716725
-3039.637573040.562523037.529406
-3033.444173035.6250223031.574677
-3028.257613028.6875243027.409126
-3018.301493019.7500263022.583493
-3017.963173018.8125293015.795519
-3028.331763027.8750313025.722446
-3032.649763036.9375333030.503741
-3011.14753012.0000013016.424515
-3009.829763005.0625033010.510866
-2989.701032991.1250062992.539827
-2950.219632957.1875072958.464483
-2860.552312851.250012869.272897
-2682.499172680.3125122698.242717
-2280.787472275.3750182291.227719
-1544.0471553.4375171535.220813
-756.65396750.5000194767.2340739
477.47812313.03668312.5625204320.3064988
Table A5. Experimental data for Figure 15.
CO2 Injection Time (min)Viscosity (mPa·s)
Experiment #1Experiment #2Experiment #3
01.21.21.2
2269276283
4312330523079
6881387318854
810,65210,51110,359
1010,63710,49510,372
1210,61210,55310,298
1410,72610,52710,314
1610,71110,47210,381
1810,69410,53410,365
2010,70310,52610,321
Table A6. Experimental data for Figure 17.
Salinity (mg·L−1)Viscosity (mPa·s)
Experiment #1Experiment #2Experiment #3
010,31010,42610,357
5275.110,54010,61510,569
21,00011,30011,43111,373
52,780.112,09012,15912,059

References

  1. Bui, D.; Nguyen, S.; Ampomah, W.; Acheampong, S.A.; Hama, A.; Amosu, A.; Koray, A.-M.; Appiah Kubi, E. A Comparison of Water Flooding and CO2-EOR Strategies for the Optimization of Oil Recovery: A Case Study of a Highly Heterogeneous Sandstone Formation. Gases 2025, 5, 1. [Google Scholar] [CrossRef]
  2. Hu, W.; Wei, Y.; Bao, J. Progress in Theories and Technologies for Development of Low-Permeability Oil and Gas Reservoirs in China. Pet. Explor. Dev. 2018, 45, 646–656. [Google Scholar] [CrossRef]
  3. Hu, S.; Guo, X.; Zhang, J.; Chen, S. Technology for Enhancing Oil and Gas Recovery under the Dual-Carbon Vision: Advances in CCUS-Enhanced Recovery. World Pet. Ind. 2024, 31, 81–91. [Google Scholar]
  4. Ebaid, H.; Gasser, M.; Yehia, T.; Okoroafor, E.R. Enhancing Oil Recovery in Heterogeneous Reservoirs with CO2 Flooding: A Simulation Study. In Proceedings of the SPE/AAPG/SEG Carbon, Capture, Utilization, and Storage Conference & Exhibition, Houston, TX, USA, 11–13 March 2024. [Google Scholar]
  5. Klimenko, A.; Cui, L.; Ding, L.; Bourrel, M. CO2 Geostorage and Enhanced Oil Recovery: Challenges in Controlling Foam/Emulsion Generation and Propagation. ACS Omega 2024, 9, 37094–37104. [Google Scholar] [CrossRef]
  6. Ma, L.; Lu, C.; Guo, J.; Yong, R.; Wu, J.; Zeng, B. Development Status and Key Issues in Water-Driven Pressure Exploitation of Low-Permeability/Tight Reservoirs in China; Daqing Petroleum Geology & Development: Daqing, China, 2025; pp. 1–9. [Google Scholar]
  7. Liao, H. CO2 Injection to Enhance Recovery in Tight Sandstone Gas Reservoirs: Laboratory Experiments and Numerical Simulation. Daqing Pet. Geol. Dev. 2025, 44, 101–106. [Google Scholar]
  8. He, Y.; Wang, Z.; Zheng, Z.; Tu, H.; He, Y. Experimental Study on Microscopic Recovery Characteristics of CO2 Miscible Flooding in Offshore L-Type Low-Permeability Reservoir. Oil Gas Reserv. Eval. Dev. 2025, 15, 589–596. [Google Scholar]
  9. Rawat, A.; Khanikar, B.; Samanta, A.K.; Nguessan, P.; Mehta, B.; Sircar, A.; Desai, B.; Bera, A.; Bist, N. Experimental Analysis of Sequential Water-Alternating CO2 Gas Injection for Enhancing Oil Recovery in X-Field Sandstone Reservoir of Cambay Basin. Sci. Rep. 2025, 15, 21238. [Google Scholar] [CrossRef]
  10. Lei, X.; Zheng, Z.; Yu, G.; Zhang, K. Response Characteristics of CO2 Gas-Water Alternating Injection after Water Flooding in Ultra-Low Permeability Reservoirs. Spec. Oil Gas Reserv. 2020, 27, 113–117. [Google Scholar]
  11. Dai, Y.; Guo, H.; Li, H.; Zeng, Q.; Meng, L.; Wang, R.; Meng, H.; Gao, T. Quantitative Study on Mechanisms of Gas–Water Alternating Injection in Fractured Tight Oil Reservoirs. Sci. Technol. Eng. 2020, 20, 10248–10254. [Google Scholar]
  12. Zhang, M.; Zhao, F.; Lü, G.; Hou, J.; Song, L.; Zhang, H.; Zhang, D. Applicability Limits of CO2–Water Alternating Injection in Enhancing CO2 Flooding Performance. Oilfield Chem. 2020, 37, 279–286. [Google Scholar]
  13. Chen, X.; Li, Y.; Sun, X.; Liu, Z.; Liu, J.; Liu, S. Investigation of Polymer-Assisted CO2 Flooding to Enhance Oil Recovery in Low-Permeability Reservoirs. Polymers 2023, 15, 3886. [Google Scholar] [CrossRef] [PubMed]
  14. Telmadarreie, A.; Trivedi, J.J. CO2 Foam and CO2 Polymer-Enhanced Foam for Heavy Oil Recovery and CO2 Storage. Energies 2020, 13, 5735. [Google Scholar] [CrossRef]
  15. Li, Z.; Hou, D.; Lu, T.; Huang, S.; Zhang, K.; Li, S.; Gu, Z. Mechanism and Thermal Stability of Hydrophobic SiO2 Nanoparticle-Stabilized Foam. Oilfield Chem. 2019, 36, 494–500. [Google Scholar]
  16. Jansen-Van Vuuren, R.D.; Sina, N.; Philip, M.J. CO2-Responsive Gels. Chem. Soc. Rev. 2023, 52, 3470–3542. [Google Scholar] [CrossRef] [PubMed]
  17. Li, G.; Fu, M.; Hu, J.; Lu, S.; Fu, M. Thickened CO2 Flooding to Enhance Oil Recovery in Low-Permeability Sandstone Reservoirs. Fuel 2025, 385, 134148. [Google Scholar] [CrossRef]
  18. Mwakipunda, G.C.; Nyakilla, E.E.; Kasimu, N.A.; Wang, C.; Xu, X.; Ricky, E.X. Comprehensive Review on CO2 Thickeners for Mobility Control in Enhanced Oil Recovery: Recent Advances and Future Outlook. J. Ind. Eng. Chem. 2023, 126, 69–91. [Google Scholar] [CrossRef]
  19. Fang, P.; Yang, Z.; Zhang, Q.; Yu, H.; Feng, F.; Wan, Y.; Wei, J.; Mei, Y.; Cao, M. Chemically Enhanced Water-Alternating-Gas Injection for Improved CO2 Sweep Efficiency and Geological Sequestration in CO2-EOR: Insights from Physical Experiments and Molecular Simulation. Results Eng. 2025, 27, 106239. [Google Scholar] [CrossRef]
  20. Behdadfar, M.H.; Sheng, J.J.; Esmaeilnezhad, E. Designing Effective Enhanced Oil Recovery Fluid: Combination of Graphene Oxide, D118 SuperPusher, and Chuback Surfactant. J. Mol. Liq. 2023, 390 Pt B, 123081. [Google Scholar] [CrossRef]
  21. Wu, H.; Lou, Y.; Zhai, X.; Li, Z.; Liu, B. Development and Characterization of a CO2-Responsive Intelligent Polymer Sealant. ACS Omega 2023, 8, 35066–35076. [Google Scholar] [CrossRef]
  22. Wang, H.; Yang, C.; Zhang, Y.; Wang, C. Preparation and Effect of CO2 Response Gel for Plugging Low-Permeability Reservoirs. Gels 2024, 10, 449. [Google Scholar] [CrossRef]
  23. Deng, J.; Zhao, H.; Zheng, H.; Zhuang, Y.; Wei, K.; Yuan, H.; Deng, Z.; Gao, Y.; Zhou, X.; Yu, T.; et al. CO2-Responsive Preformed Particle Gels with High Strength for CO2 Conformance Control in Heterogeneous Reservoirs. SSRN Prepr. 2024, 379, 133040. [Google Scholar] [CrossRef]
  24. Du, D.; Chen, B.; Pu, W.; Zhou, X.; Liu, R.; Jin, F. CO2-Responsive Gel Particles and Wormlike Micelles Coupling System for Controlling CO2 Breakthrough in Ultra-Low Permeability Reservoirs. Colloids Surf. A Physicochem. Eng. Asp. 2022, 650, 129546. [Google Scholar] [CrossRef]
  25. Liu, F.; Zhang, M.; Huang, H.; Cheng, R.; Su, X. CO2-Responsive Plugging Gel with Sodium Dodecyl Sulfate, Polyethyleneimine, and Silica. Polymers 2025, 17, 706. [Google Scholar] [CrossRef]
  26. Xin, Y.; Li, B.; Li, Z.; Li, Z.; Wang, B.; Wang, X.; Zhang, M.; Li, W. Gas Channeling Control with CO2-Responsive Gel System in Fractured Low-Permeability Reservoirs: Enhancing Oil Recovery during CO2 Flooding. Sep. Purif. Technol. 2025, 353 Pt B, 128475. [Google Scholar] [CrossRef]
  27. Chen, Z.; Penfold, J.; Li, P.; Doutch, J.; Fan, Y.; Wang, Y. Effects of Length and Hydrophilicity/Hydrophobicity of Diamines on Self-Assembly of Diamine/SDS Gemini-like Surfactants. Soft Matter 2017, 13, 8980–8989. [Google Scholar] [CrossRef]
  28. Anachkov, S.; Georgieva, G.S.; Abezgauz, L.; Danino, D.; Kralchevsky, P.A. Viscosity Peak due to Shape Transition from Wormlike to Disklike Micelles: Effect of Dodecanoic Acid. Langmuir 2018, 34, 4897–4907. [Google Scholar] [CrossRef] [PubMed]
  29. Minkenberg, C.B.; Homan, B.; Boekhoven, J.; Norder, B.; Koper, G.J.; Eelkema, R.; van Esch, J.H. Responsive Wormlike Micelles from Dynamic Covalent Surfactants. Langmuir 2012, 28, 13570–13576. [Google Scholar] [CrossRef] [PubMed]
  30. Xiong, C.; Wei, F.; Zhou, Q.; Peng, K.; Ye, Z.; Yang, H. A CO2-Responsive Smart Fluid Based on Supramolecular Assembly Structures Varying Reversibly from Vesicles to Wormlike Micelles. RSC Adv. 2020, 10, 25311–25318. [Google Scholar] [CrossRef] [PubMed]
  31. Lynn, M.; Walker, R. Rheology and Structure of Worm-Like Micelles. Curr. Opin. Colloid Interface Sci. 2001, 6, 417–421. [Google Scholar] [CrossRef]
Figure 1. Viscosity of the CO2-responsive TMPDA–SDS–SiO2 gel system at different SDS:TMPDA molar ratios after CO2 introduction. Detailed data are provided in Table A1.
Gels 11 00709 g001
Figure 2. Viscosity variation in the CO2-responsive TMPDA–SDS–SiO2 gel system before and after CO2 introduction at different mass fractions. Detailed data are provided in Table A2.
Gels 11 00709 g002
Figure 3. Viscosity of TMPDA–SDS–SiO2 systems at varying nano-silica mass fractions. Detailed experimental data are provided in Table A3.
Gels 11 00709 g003
Figure 4. 1H-NMR spectrum of SDS.
Gels 11 00709 g004
Figure 5. 1H-NMR spectrum of TMPDA.
Gels 11 00709 g005
Figure 6. 1H-NMR spectrum of the TMPDA–SDS binary system.
Gels 11 00709 g006
Figure 7. 1H-NMR spectrum of the CO2-responsive TMPDA–SDS system after CO2 stimulation.
Gels 11 00709 g007
Figure 8. FTIR spectra of the TMPDA–SDS system before (a) and after (b) CO2 introduction.
Gels 11 00709 g008
Figure 9. SEM images of the TMPDA–SDS system before (a) and after (b) CO2 introduction.
Gels 11 00709 g009
Figure 10. Rheological properties of the CO2-responsive TMPDA–SDS–SiO2 gel system before and after CO2 exposure. Photographs showing the sol–gel transition. Detailed experimental data are provided in Table A4.
Gels 11 00709 g010
Figure 11. Shear–rest–shear cyclic test of the CO2-responsive TMPDA–SDS–SiO2 gel system after CO2 exposure.
Gels 11 00709 g011
Figure 12. Viscosity response of the CO2-responsive TMPDA–SDS–SiO2 gel system under alternating CO2/N2 injection.
Gels 11 00709 g012
Figure 13. Effect of CO2 injection time on the viscosity evolution of the CO2-responsive TMPDA–SDS–SiO2 gel system. Detailed experimental data are provided in Table A5.
Gels 11 00709 g013
Figure 14. Thermal aging stability of the CO2-responsive TMPDA–SDS–SiO2 gel system at 90 °C for up to 60 days, including viscosity recovery upon re-CO2 exposure.
Gels 11 00709 g014
Figure 15. Viscosity of the CO2-responsive TMPDA–SDS–SiO2 gel system prepared in deionized water and simulated brines of different salinity levels. Detailed experimental data are provided in Table A6.
Gels 11 00709 g015
Figure 16. Injection pressure and recovery curves during CO2 flooding with the CO2-responsive TMPDA–SDS–SiO2 gel system at a permeability contrast of 10.
Gels 11 00709 g016
Figure 17. Injection pressure and recovery curves during CO2 flooding with the CO2-responsive TMPDA–SDS–SiO2 gel system at a permeability contrast of 20.
Gels 11 00709 g017
Figure 18. Injection pressure and recovery curves during CO2 flooding with the CO2-responsive TMPDA–SDS–SiO2 gel system at a permeability contrast of 30.
Gels 11 00709 g018
Figure 19. Core flooding experiment setup. (1) CO2 injection pump; (2) simulated oil/water; (3) CO2-responsive TMPDA–SDS–SiO2 solution; (4) constant flow and pressure displacement pump; (5) pressure gauge; (6–7) high- and low-permeability core holders; (8) backpressure valve; (9) gas–liquid separator.
Gels 11 00709 g019
Figure 20. Experimental workflow of the CO2-responsive TMPDA–SDS–SiO2 gel study.
Gels 11 00709 g020
Table 1. Plugging efficiency of the CO2-responsive TMPDA–SDS–SiO2 gel system at different injected PV values in sand-packed tubes.
PVPorosity (%)Initial Permeability (mD)Permeability After Gel Injection (mD)Blocking Efficiency (%)
0.141.58435110.474.6
0.1240.2742172.1182.9
0.1440.5342842.6790
0.1542.134484.7498.9
0.2542.014423.7199.1
0.541.284252.4299.4
Table 2. Oil recovery under different permeability contrasts before and after injection of the CO2-responsive TMPDA–SDS–SiO2 gel system.
Permeability ContrastFirst CO2 Flooding Recovery (%)Second CO2 Flooding Recovery (%)Incremental Recovery (%)
High Perm.Low Perm.High Perm.Low Perm.High Perm.Low Perm.
1068.2422.9272.9457.294.7134.38
2062.4018.6471.2042.278.8023.63
3056.3017.8673.6932.1417.3914.28
Disclaimer/Publisher’s Note: The statements, opinions and data contained in all publications are solely those of the individual author(s) and contributor(s) and not of MDPI and/or the editor(s). MDPI and/or the editor(s) disclaim responsibility for any injury to people or property resulting from any ideas, methods, instructions or products referred to in the content.