2.1.2. Zeta Potential Values
Zeta potential measurements revealed that all kratom NPs formulations possessed negative surface charges, ranging from −22.60 ± 1.47 mV to −29.57 ± 3.23 mV. KY NP demonstrated the most negative zeta potential (−29.57 ± 3.23 mV), followed closely by HK NP (−29.40 ± 3.05 mV), KD NP (−26.20 ± 0.38 mV), and KG NP (−22.60 ± 1.47 mV). The blank formulation exhibited a ZP of −23.30 ± 3.32 mV. Typically, NPs with zeta potential values greater than ±30 mV are often considered highly stable due to strong electrostatic repulsion. NPs within the −20 to −30 mV range may still maintain colloidal stability, particularly when formulated with steric stabilizers. In this study, the use of a poloxamer likely provided additional steric hindrance via its hydrophilic polyethylene oxide chains, forming a protective hydration shell that prevented particle aggregation. This dual stabilization mechanism—electrostatic and steric—is consistent with the previous findings where poloxamer coatings contributed to the stability of nanoparticles, even with moderately negative zeta potentials [
16]. Together, the observed zeta potential values and the presence of steric stabilizers suggest that all prepared nanoparticles possess adequate colloidal stability for topical delivery.
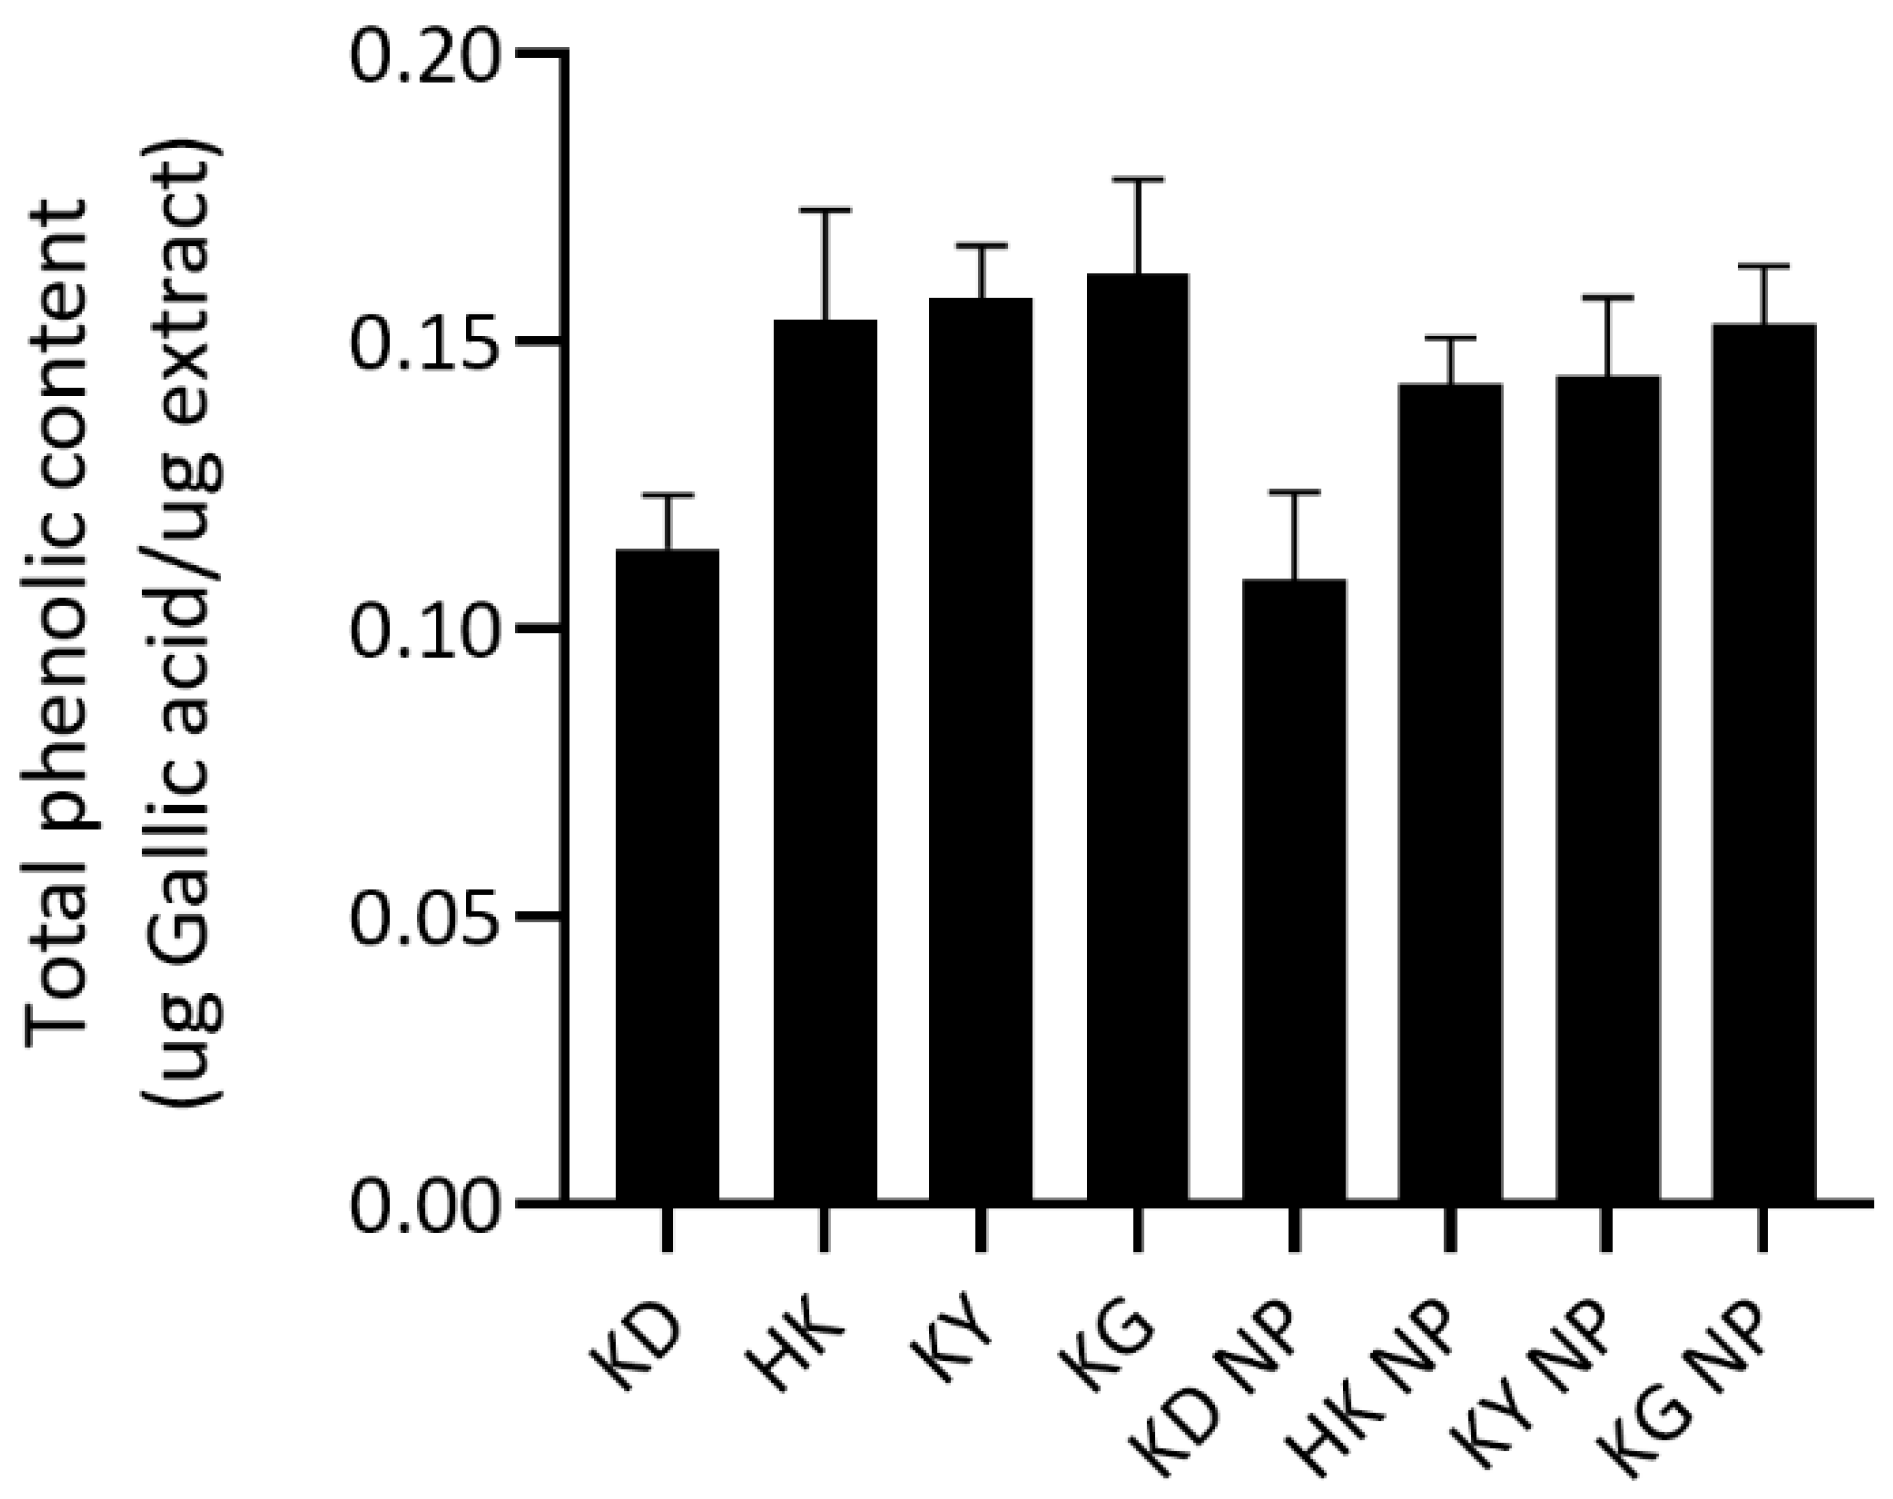
Total Phenolic Content
The total phenolic content (TPC) of each extract and its corresponding NPs formulation was quantified and expressed in micrograms of gallic acid equivalents per microgram of extract (µg GAE/µg extract) (
Figure 1). Among the crude extracts, KG exhibited the highest TPC (0.1616 ± 0.0164 µg GAE/µg extract), followed by KY (0.1576 ± 0.0089), HK (0.1537 ± 0.0192), and KD (0.1138 ± 0.0094). A similar trend was observed in NP formulations, with the highest TPC observed in KG NP (0.1529 ± 0.0102), followed by KY NP (0.1439 ± 0.0137), HK NP (0.1426 ± 0.0079), and KD NP (0.1084 ± 0.0154). The statistical analysis revealed that KD had a significantly lower TPC compared to HK, KY, and KG, as well as significantly lower than KG NP.
These findings highlight the superior phenolic content of KG and KY varieties, supporting their traditional use and potential antioxidant efficacy. In contrast, the lower TPC in KD suggests a reduced contribution to phenolic-dependent antioxidant activity. Notably, no statistically significant differences in TPC were observed between each crude extract and its corresponding NP formulations (p > 0.05). This suggests that a poloxamer-based encapsulation system effectively preserves the phenolic constituents without causing degradation or loss. It also indicates that the phenolic compounds were either not significantly retained within the micelle core or remained fully accessible or reactive with the Folin–Ciocalteu reagent following encapsulation.
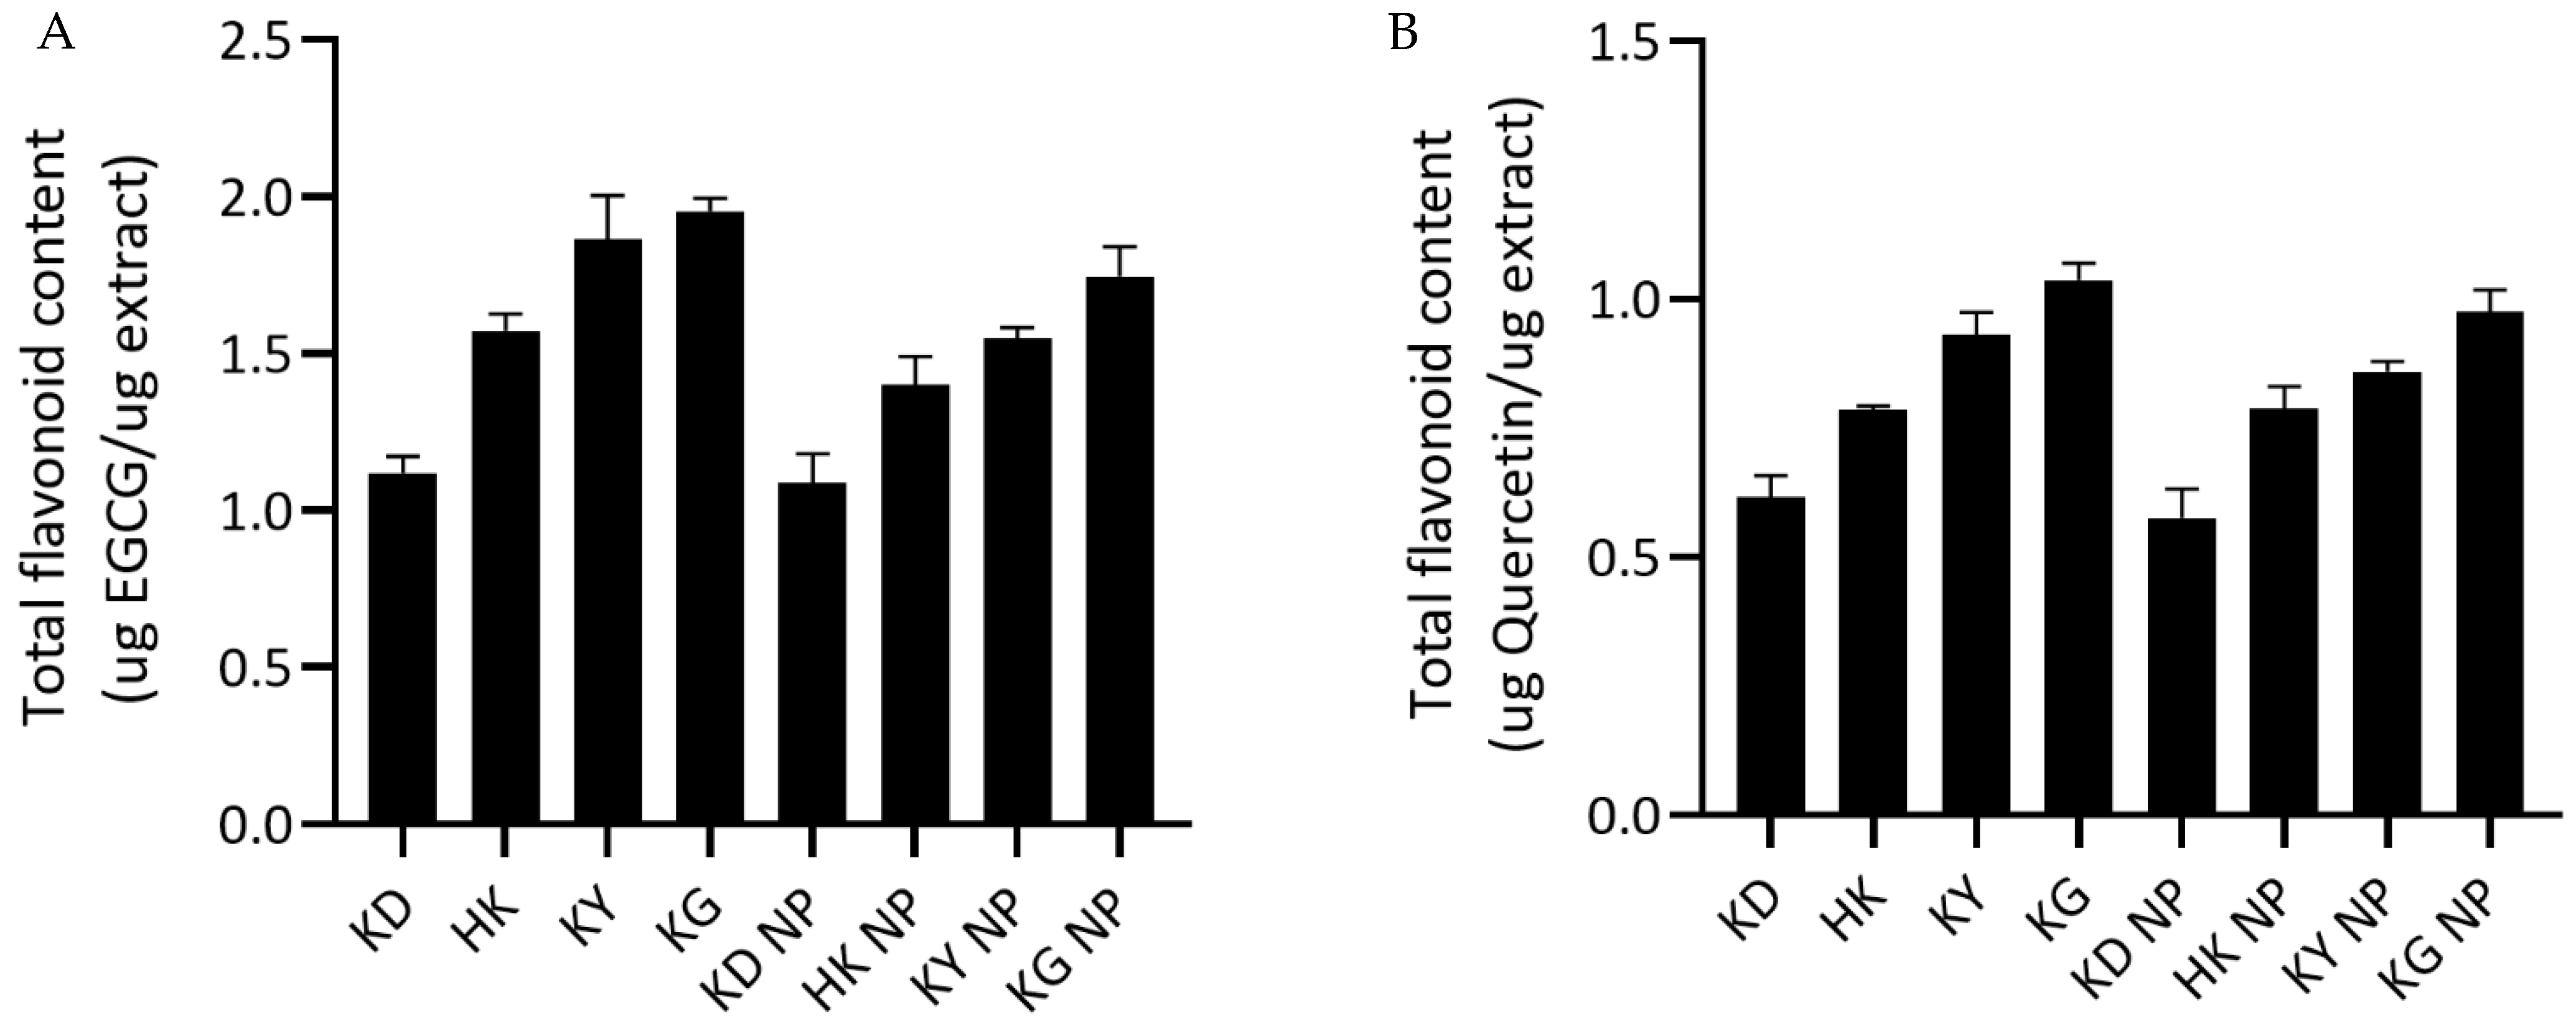
Total Flavonoid Content
The total flavonoid content (TFC), quantified using both EGCG and quercetin equivalents, was assessed for each kratom extract and its corresponding poloxamer-based NP formulation (
Figure 2). Among the crude extracts, KG exhibited the highest TFC, with values of 1.9539 ± 0.0413 µg EGCG equivalent/µg extract and 1.0370 ± 0.0322 µg quercetin equivalent/µg extract, followed by KY and HK. In contrast, KD showed the lowest TFC, with values of 1.1199 ± 0.0524 and 0.6153 ± 0.0431 EGCG and quercetin equivalents per µg extract, respectively. The NP formulations mirrored these trends: KG NP and KY NP retained the highest TFC values, while KD NP consistently showed the lowest. The statistical analysis indicated no significant differences in TFC between each extract and its corresponding nanoparticle formulation (
p > 0.05), suggesting that the NP preparation process effectively preserved the flavonoid content of the extracts.
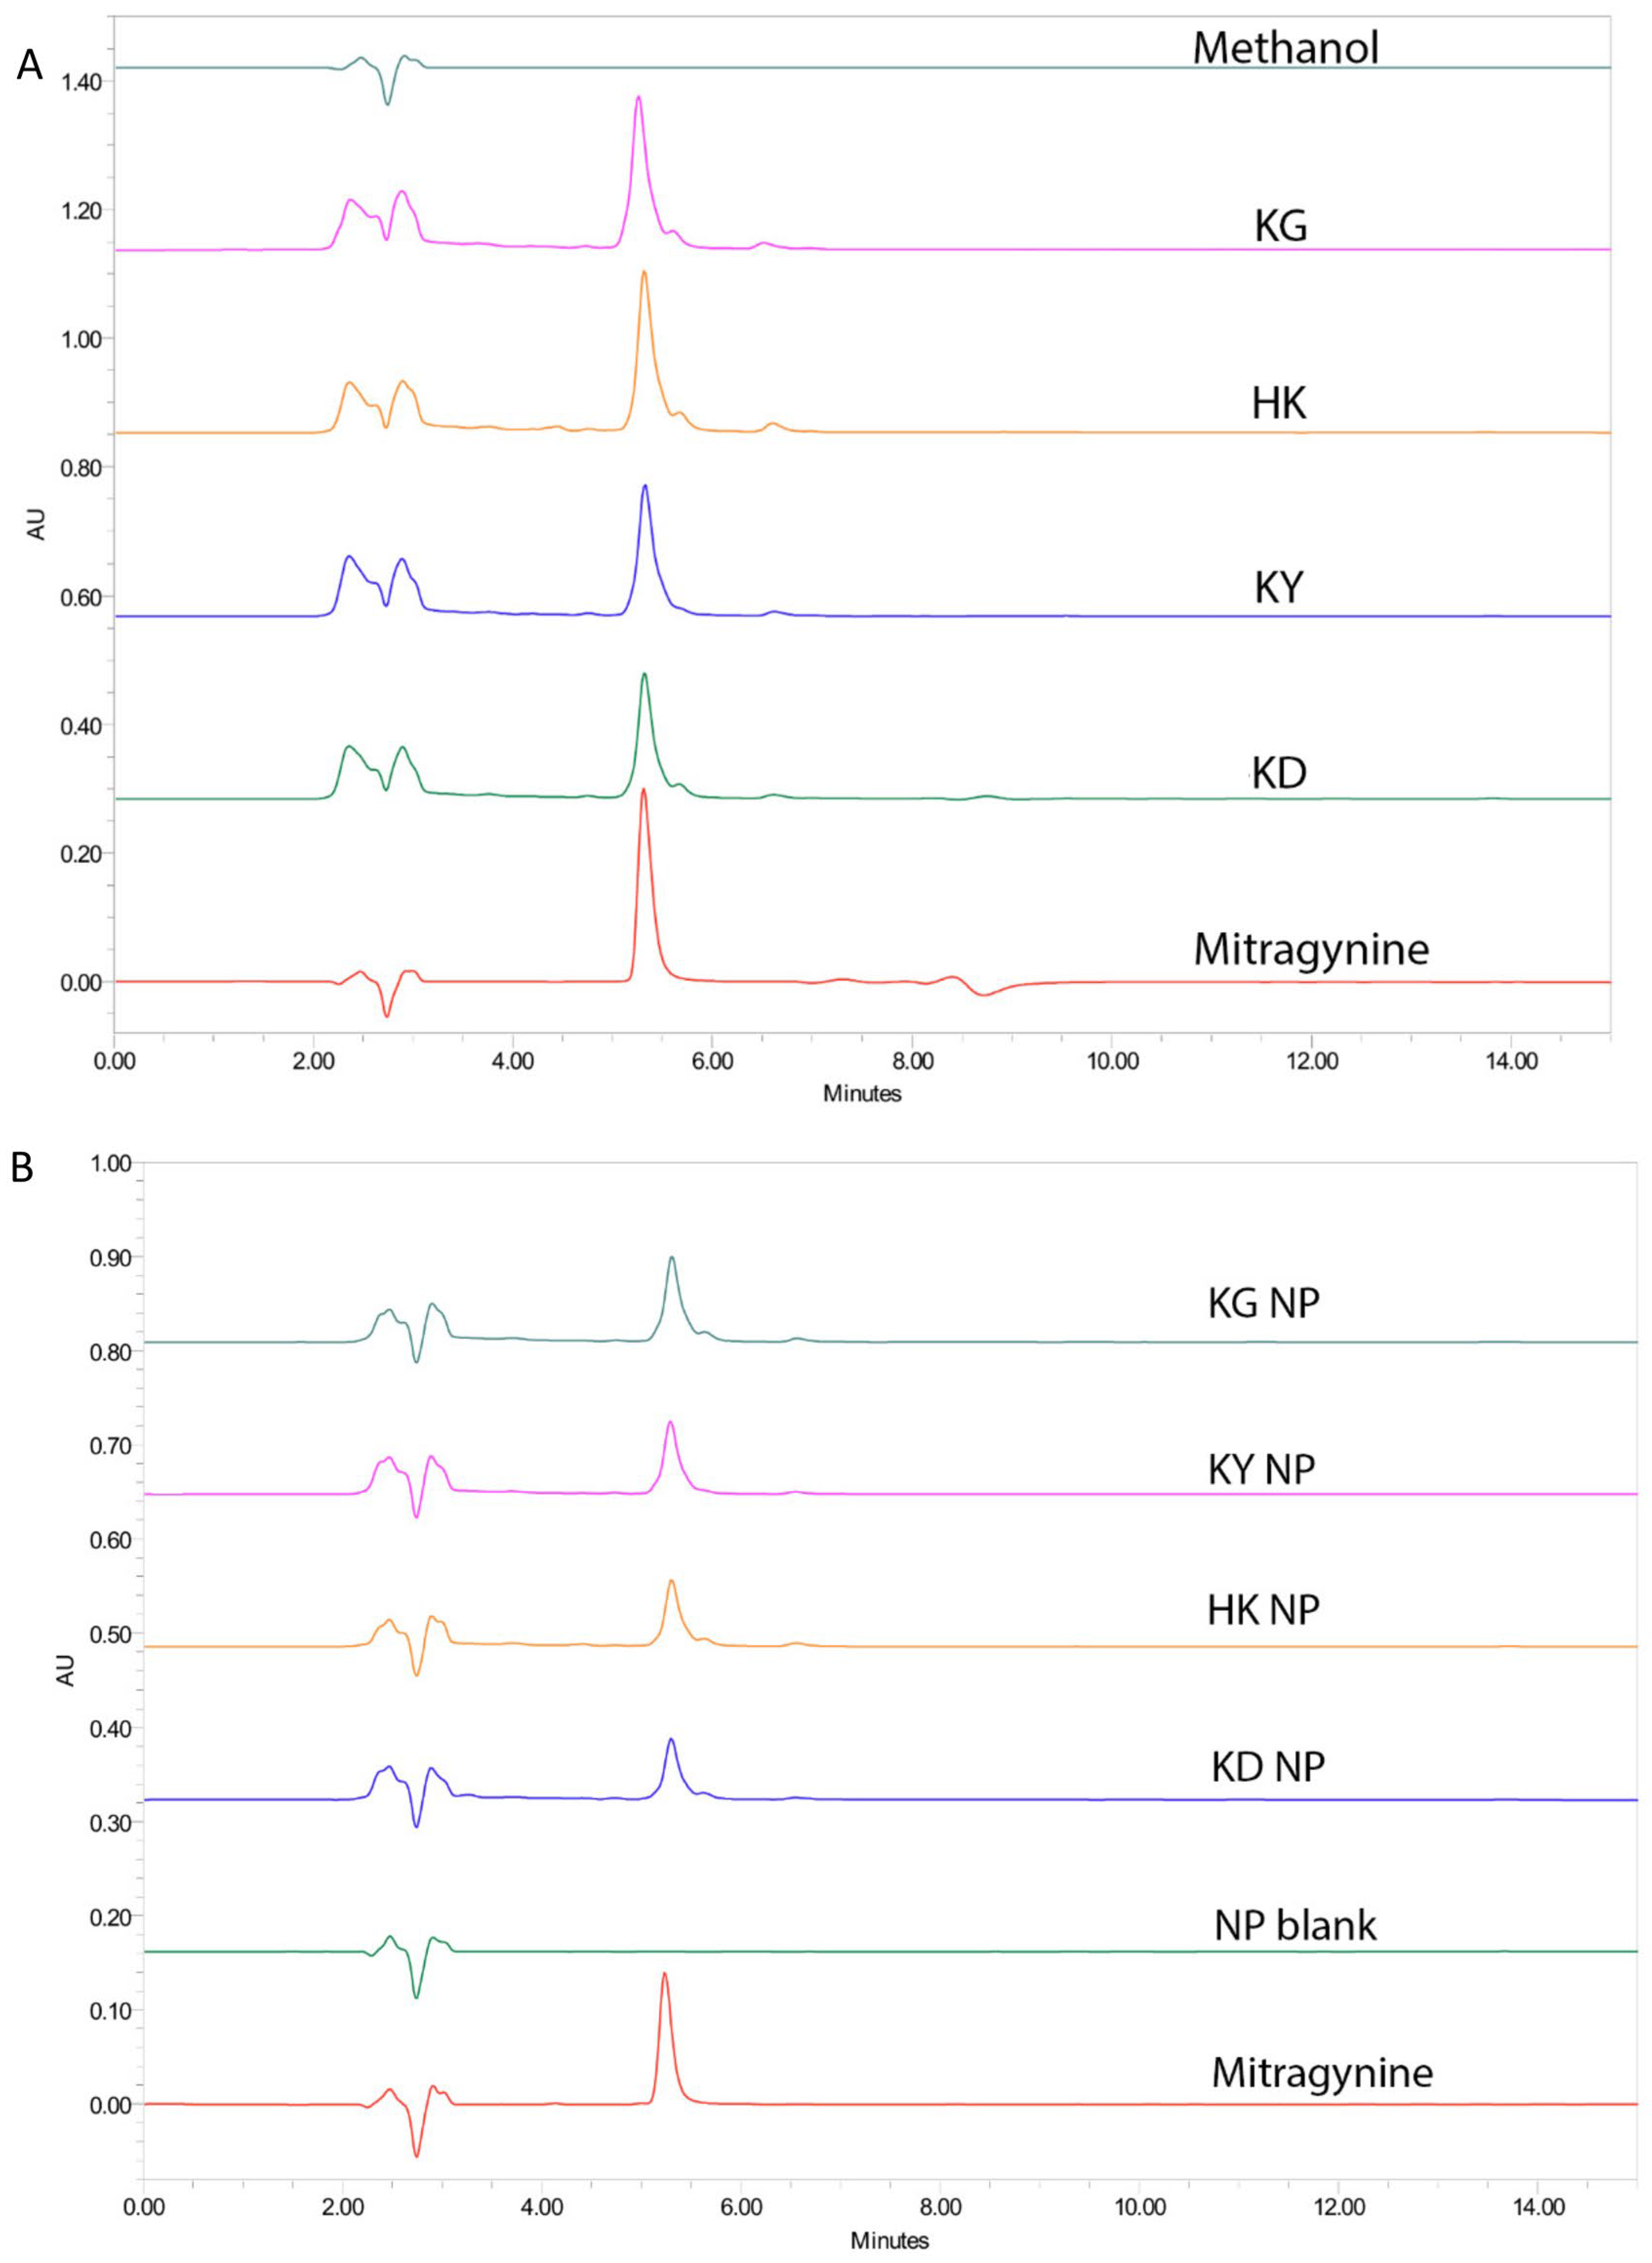
Quantification of Mitragynine in Extracts and Nanoparticle Formulations
High-performance liquid chromatography (HPLC) was used to quantify mitragynine in various kratom extracts and their corresponding NP formulations. Under the selected chromatographic conditions, the retention time (RT) of mitragynine was consistently observed at approximately 5.2–5.3 min. Representative chromatograms included samples from crude extracts (KD, HK, KY, and KG), NP formulations (KD NP, HK NP, KY NP, and KG NP), a blank nanoparticle formulation, and a mitragynine standard (40 ppm) (
Figure 3). Each sample showed a sharp peak corresponding to mitragynine. The absence of a corresponding peak in the blank nanoparticle formulation confirmed the specificity of the method and the absence of mitragynine contamination from excipients.
The tailing observed in the chromatograms of nanoparticle (NP) formulations may be attributed to the interaction of the mitragynine with the poloxamer, which can cause delayed elution and result in peak asymmetry [
17].
The mitragynine content in the crude extracts and corresponding NP formulations was quantified and expressed as both % w/w and mg/g of sample. Among the crude extracts, HK exhibited the highest mitragynine content (9.97 ± 0.10% w/w; 98.39 ± 1.05 mg/g), followed by KG (9.64 ± 0.24%, 96.41 ± 0.24 mg/g), KY (7.65 ± 0.13%, 76.52 ± 0.10 mg/g), and KD (7.48 ± 0.18%, 74.82 ± 0.14 mg/g). Among the NPs, KG NP retained the highest mitragynine content (8.20 ± 0.17% w/w; 81.97 ± 0.17 mg/g), followed by KY NP (6.27 ± 0.22%; 62.75 ± 0.22 mg/g), HK NP (5.82 ± 0.15%; 58.25 ± 0.15 mg/g), and KD NP (5.15 ± 0.24%; 51.51 ± 0.24 mg/g).
The calibration curve for the quantification method demonstrated excellent linearity over the concentration range of 10–100 µg/mL, with a correlation coefficient (R2) of 0.9987. The linear regression equation was y = 30,629x + 166,812. The method exhibited good accuracy, with low residuals across all concentrations. The residual standard deviation was calculated to be 39,008.53, which was subsequently used to determine the sensitivity of the method. The limit of detection (LOD) and limit of quantification (LOQ) were calculated based on the ICH Q2 (R1) guideline as 4.20 µg/mL and 12.74 µg/mL, respectively, indicating the method’s suitability for detecting and quantifying the analyte within the working range.
The precision analysis displayed low relative standard deviation (RSD) values for all NP samples, indicating excellent analytical repeatability: KG NP (0.20%), HK NP (0.26%), KY NP (0.34%), and KD NP (0.46%). All values remained within acceptable limits for bioanalytical methods. These findings confirm that HK and KG extracts contain the highest levels of mitragynine, supporting their potential as potent sources of bioactive alkaloids. Although the mitragynine content decreased following nanoparticle formulation, KG NP and KY NP still retained relatively high concentrations, suggesting good formulation efficiency and compound stability during the encapsulation process.
The encapsulation efficiency (%EE) of mitragynine in the nanoparticle formulations varied depending on the kratom source. The KD NP formulation showed an average %EE of 79.25 ± 0.49%, while KY NP exhibited a significantly higher encapsulation efficiency of 94.34 ± 0.36%. In contrast, HK NP presented the lowest %EE among the four, with an average of 67.76 ± 0.66%. Notably, the KG NP formulation demonstrated the highest %EE at 97.78 ± 0.13%, indicating a highly efficient encapsulation. These results suggest that the phytochemical profile of different kratom sources may influence the encapsulation capacity of the nanoparticles.
DPPH Radical Scavenging Activity
The antioxidant activities of kratom leaf extracts and their corresponding NP formulations were evaluated using the DPPH radical scavenging assay. As illustrated in
Figure 4A,B, all samples exhibited dose-dependent scavenging activity, though with varying degrees of potency. Among the crude extracts, KY showed the highest DPPH radical scavenging activity, with an IC
50 of 152.47 ± 3.26 µg/mL, followed closely by KD (157.90 ± 1.65 µg/mL) and HK (167.60 ± 1.91 µg/mL). KG demonstrated the lowest antioxidant activity among the crude samples, with an IC
50 of 197.70 ± 4.30 µg/mL. For the NP formulations, HK NP exhibited the strongest antioxidant capacity, with an IC
50 of 151.23 ± 3.55 µg/mL, slightly outperforming its crude counterpart. KG NP and KY NP followed, with IC
50 values of 160.17 ± 3.76 µg/mL and 163.97 ± 0.61 µg/mL, respectively. In contrast, KD NP showed a slightly reduced activity compared to its extract form, with an IC
50 of 199.87 ± 2.18 µg/mL. This underperformance may be attributed to the specific phytochemical composition of the KD strain, which contained the lowest total phenolic and flavonoid content among the varieties studied. As expected, the positive control, ascorbic acid, demonstrated the strongest antioxidant activity, with an IC
50 of 34.99 ± 1.47 µg/mL. In comparison, mitragynine—the major alkaloid in kratom—showed a relatively weak radical scavenging activity, with an IC
50 of 602.60 ± 17.11 µg/mL, which was higher than that of all kratom samples tested.
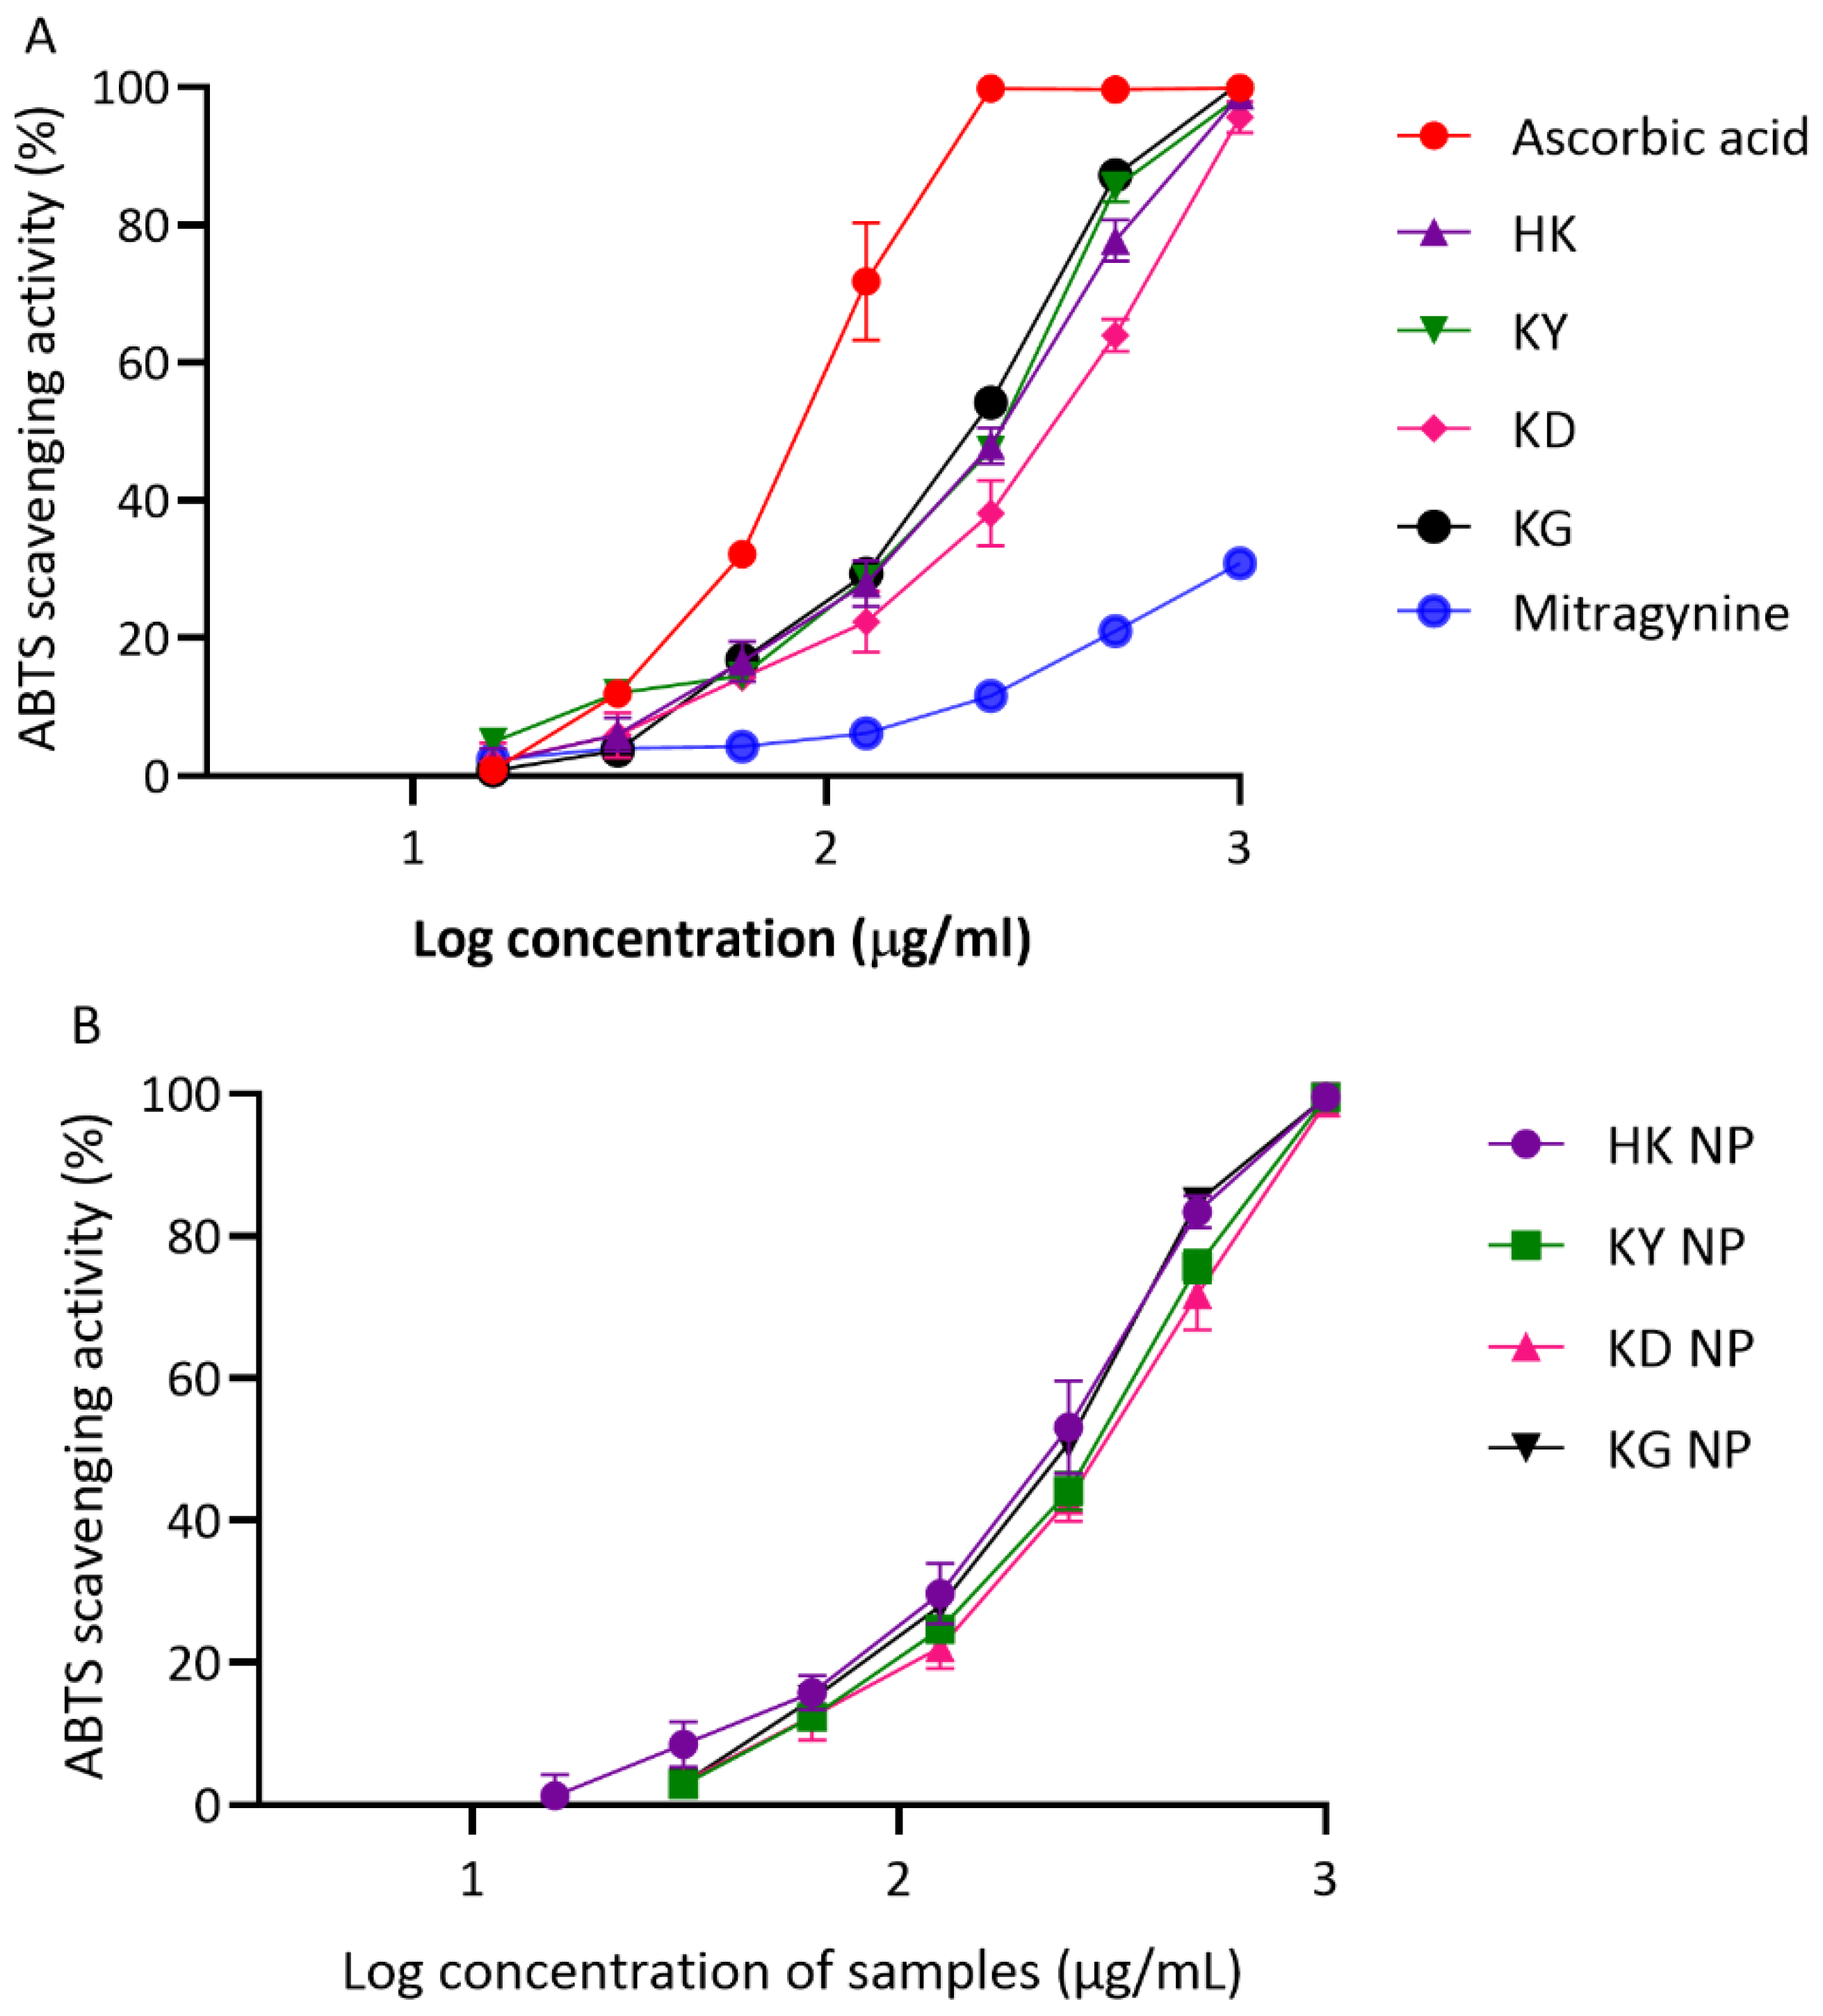
ABTS Radical Scavenging Activity
The ABTS assay further confirmed the antioxidant potential of both kratom leaf extracts and their corresponding NP formulations (
Figure 5A,B). In this assay, the IC
50 values of the crude extracts followed a slightly different pattern compared to the DPPH results. KG showed the strongest activity among the extracts (201.67 ± 5.05 µg/mL), followed by KY (217.93 ± 5.53 µg/mL) and HK (229.77 ± 22.01 µg/mL). KD exhibited the weakest ABTS scavenging capacity, with an IC
50 of 304.23 ± 38.52 µg/mL. The NP formulations generally retained or slightly enhanced antioxidant activity compared to their corresponding crude extracts. HK NP again showed the strongest activity among the NP samples (207.37 ± 28.26 µg/mL). KG NP and KY NP followed, with IC
50 values of 216.40 ± 11.40 µg/mL and 255.63 ± 12.58 µg/mL, respectively. Interestingly, KD NP showed improved activity compared to its crude extract, with a lower IC
50 of 272.83 ± 28.84 µg/mL As expected, ascorbic acid remained the most effective ABTS scavenger, with an IC
50 of 83.16 ± 6.27 µg/mL. In contrast, mitragynine—the major alkaloid in kratom—showed minimal ABTS scavenging activity, with a markedly higher IC
50 value of 2022.00 ± 108.53 µg/mL, confirming that it is not a major contributor to kratom’s antioxidant effect.
Overall, all kratom extracts possessed a moderate antioxidant capacity in both DPPH and ABTS assays. Among the extracts, KY and HK showed slightly stronger activities than KD and KG, consistent with their relatively higher total phenolic and flavonoid contents. The incorporation of the extracts into NP formulations generally preserved or modestly improved the antioxidant capacity, particularly in the ABTS assay. Notably, HK NP demonstrated the lowest IC50 values among NP formulations in both assays, suggesting the effective retention and stability of antioxidant constituents during formulation. Interestingly, mitragynine exhibited the weakest antioxidant activity, reinforcing that the observed effects are likely attributable to other phenolic or flavonoid constituents in kratom rather than this primary alkaloid. These findings support the hypothesis that kratom’s antioxidant potential is primarily driven by its phenolic and flavonoid compounds rather than by mitragynine. Ascorbic acid, used as a positive control, consistently demonstrated superior radical scavenging performance, underscoring the moderate nature of kratom’s antioxidant capacity.
Ferric Reducing Antioxidant Power (FRAP) Activity
The reducing power of kratom leaf extracts and their corresponding NP formulations was assessed using the ferric reducing antioxidant power (FRAP) assay, with ascorbic acid serving as a positive control. Results are expressed in terms of Fe(II) equivalents (µM), with higher values indicating a greater ferric reducing capacity. As shown in
Figure 6A, ascorbic acid demonstrated the strongest reducing ability in a dose-dependent manner, reaching 1063.06 µM Fe(II) equivalents at 1000 µg/mL. Among the crude extracts, KY exhibited the highest FRAP value (810.55 µM), followed by KG (752.48 µM), HK (708.18 µM), and KD (582.61 µM), all measured at 1000 µg/mL. These results indicate that all kratom leaf extracts possess a notable ferric reducing activity, with KY and KG showing the strongest effects. In the NP formulations (
Figure 6B), a similar trend of dose-dependent increase in FRAP activity was observed. At 1000 µg/mL, KG NP demonstrated the highest Fe(II) equivalent value (642.55 µM), followed by KY NP (619.12 µM), HK NP (608.65 µM), and KD NP (470.49 µM). These results suggest that the ferric reducing power was generally preserved after nanoparticle formulation, although slightly reduced compared to the crude extracts.
Correlation Between Phytochemical Content and Antioxidant Activities
A Pearson correlation analysis was conducted to evaluate the relationships between phytochemical content (TPC and TFC, measured as EGCG and quercetin equivalents) and IC
50 values of crude kratom extracts (KD, HK, KY, KG) and their corresponding NP formulations (KD NP, HK NP, KY NP, KG NP) (
Table 1).
Among the extract samples, a strong and statistically significant negative correlation was observed between TPC and ABTS IC50 (r = −0.9755, p = 0.0245), indicating that phenolic compounds play a key role in enhancing free radical scavenging. Similarly, TFC, whether measured as EGCG equivalents (r = −0.9856, p = 0.0144) or quercetin equivalents (r = −0.9856, p = 0.0144), also showed a strong and statistically significant negative correlation with ABTS IC50 values. These findings highlight flavonoids as potent contributors to hydrogen atom donation and radical neutralization. In contrast, correlations between the phytochemical content and DPPH IC50 values were weaker and not statistically significant. TPC showed a moderate positive correlation (r = 0.5802, p = 0.4198), while TFC (EGCG and quercetin) yielded similar trends (r ≈ 0.63, p > 0.37). The FRAP assay results demonstrated strong positive correlations between reducing power and both TPC (r = 0.8492, p = 0.1508) and TFC (r ≈ 0.87, p ≈ 0.13). These findings suggest that both phenolic and flavonoid compounds contribute meaningfully to the electron donation involved in ferric ion reduction.
In the NP formulations, similar trends were observed. TPC exhibited a strong negative correlation with ABTS IC50 (r = −0.9308, p = 0.0692), suggesting that the phenolic content retained in the NP formulations continues to contribute to the antioxidant capacity. Likewise, TFC (EGCG and quercetin) also showed strong negative correlations with ABTS IC50 (r = −0.86), supporting the role of flavonoids in radical scavenging even after nanoencapsulation. For the FRAP assay, all phytochemical parameters demonstrated strong positive correlations: TPC (r = 0.8566), TFC-EGCG (r = 0.9106), and TFC-quercetin (r = 0.9108), with p-values ranging from around 0.09 to 0.14. Although these correlations did not reach statistical significance, the trends clearly reflect that nanoparticle incorporation preserved the reducing potential associated with phenolic and flavonoid compounds. Correlations with DPPH were again weaker and not statistically significant (r = −0.79 for both TPC and TFC), reinforcing the notion that this assay may be less responsive to subtle phytochemical variations in both crude and nanoparticle-formulated systems.
The antioxidant performance of kratom extracts and their NP formulations can be largely attributed to their phenolic content. Strong positive correlations between total phenolic content (TPC) and both FRAP and ABTS assays suggest that phenolic compounds are the primary contributors to antioxidant activity, particularly in hydrophilic systems where electron donation and radical scavenging predominate. These assays, which operate in aqueous environments, effectively reflect the redox potential of polyphenols commonly present in kratom. In contrast, the DPPH assay, conducted in a less polar (absolute ethanol) medium, showed no significant correlation with TPC. This discrepancy may stem from the specific reactivity of certain phenolic compounds, which may be less efficient at quenching DPPH radicals or hindered by limited solubility or matrix effects in non-aqueous environments [
18]. Therefore, while TPC is a strong predictor of antioxidant performance in ABTS and FRAP assays, it does not reliably predict DPPH scavenging under these conditions. Moreover, the consistently low correlation between total flavonoid content (TFC) and antioxidant activity across all assays indicates that flavonoids, although present, may not be the dominant bioactive constituents in these extracts. The reduced antioxidant capacity observed in most NP formulations may be due to partial encapsulation, which limits the accessibility of free phenolic compounds or from dilution effects. Notably, KG NP retained a relatively high TPC and antioxidant activity compared to other NP formulations, indicating possible differences in formulation efficiency or improved stability of active compounds.
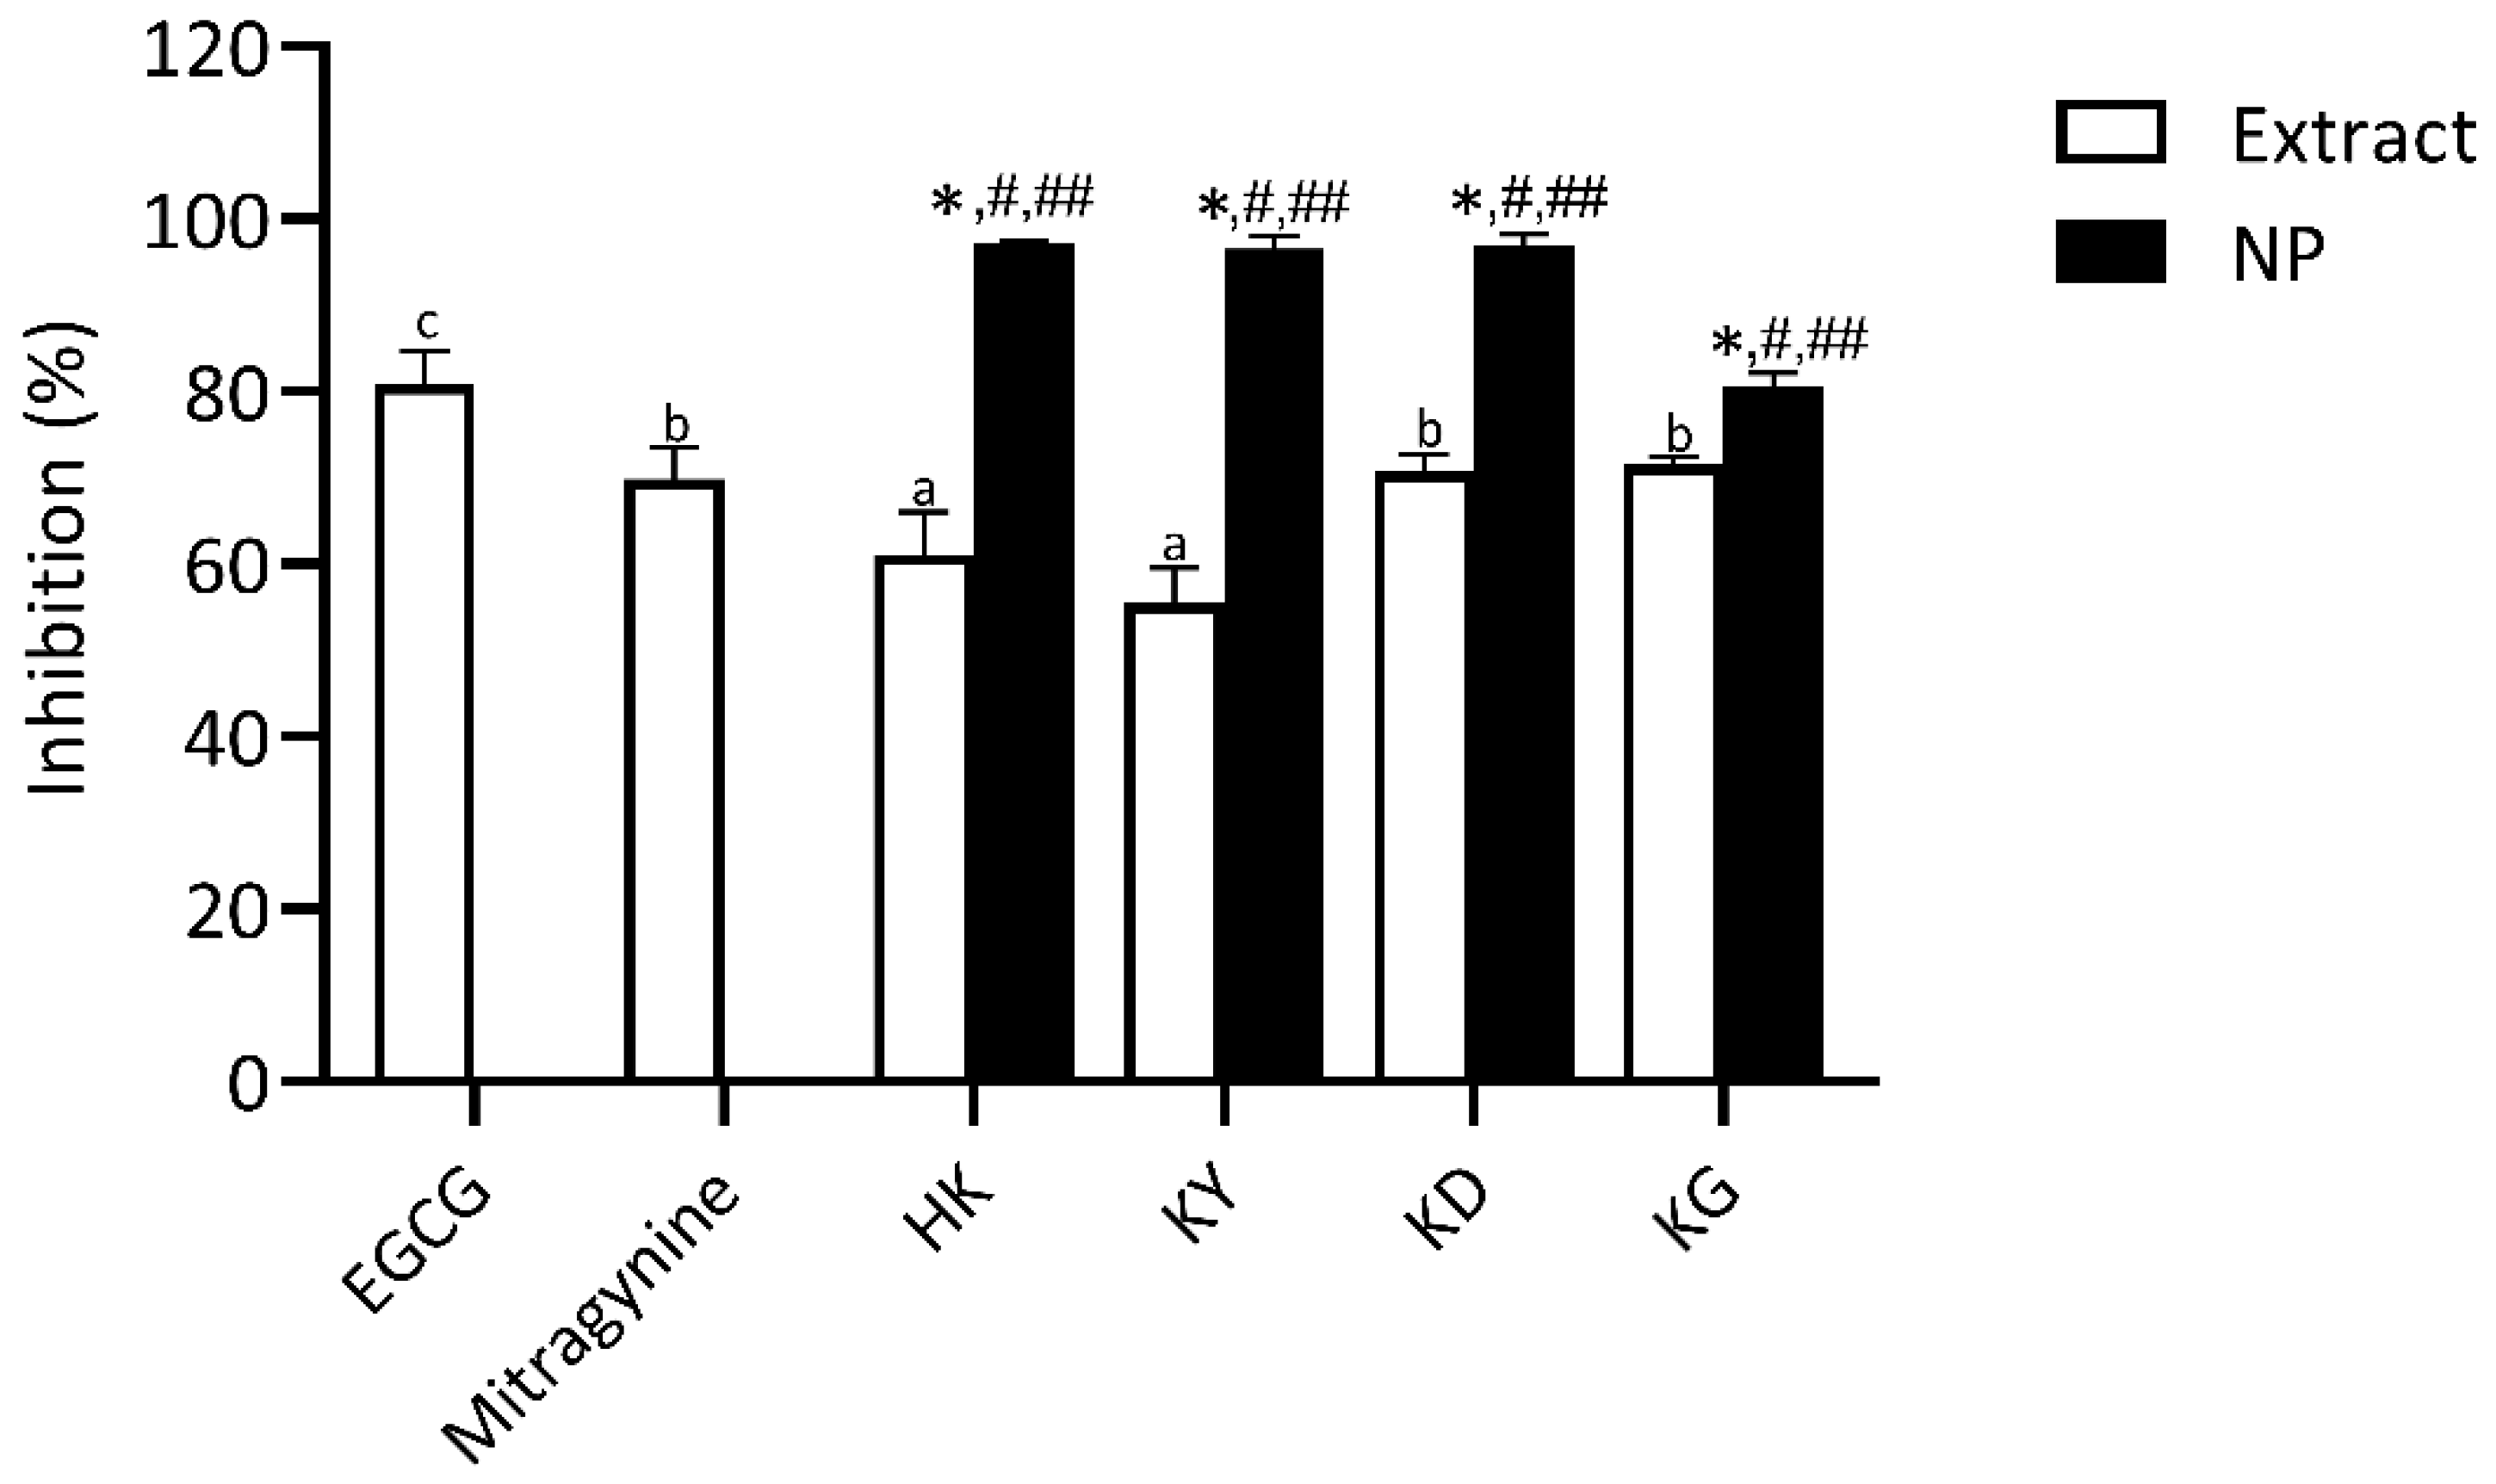
Collagenase Inhibitory Activity
Collagenase, a zinc-dependent multidomain enzyme, plays a key role in collagen degradation, contributing to skin wrinkling and the aging process. Therefore, inhibiting collagenase activity represents a strategic approach to delaying collagen breakdown and maintaining skin integrity [
19]. This study evaluated the collagenase inhibitory activity of kratom leaf extracts and their corresponding NP formulations, using EGCG as a positive control and mitragynine as a bioactive marker for comparison.
As shown in
Figure 7, all tested samples demonstrated varying degrees of collagenase inhibition. EGCG demonstrated the highest inhibitory activity (80.8 ± 3.9%), while mitragynine showed a moderate inhibitory activity (69.9 ± 3.7%), which was significantly lower than that of EGCG but notably higher than the HK and KY extracts. Interestingly, KD and KG showed the most pronounced collagenase inhibition (70.7 ± 1.0 and 71.6 ± 0.8%, respectively) among the crude extracts, with values statistically comparable to mitragynine. These findings are particularly promising for anti-aging applications, as collagenase activity directly contributes to collagen degradation and the loss of skin structural integrity associated with visible signs of skin aging [
19]. Previous studies have reported that the collagenase inhibitory effect of EGCG is primarily due to its polyphenolic structure. The hydroxyl groups of polyphenols play a crucial role by forming hydrogen bonds with the backbone amide and functional groups of the collagenase enzyme [
20]. Additionally, hydrophobic interactions between the benzene rings of polyphenols and the enzyme may induce conformational changes, resulting in enzyme inactivation [
21].
However, the collagenase inhibition observed with kratom leaf extracts may involve mechanisms distinct from the direct enzyme binding typically associated with polyphenols. The indole alkaloids from
M. speciosa, particularly mitragynine, are known to exert their effects primarily through anti-inflammatory and antioxidant mechanisms [
8,
22]. Mitragynine has been shown to suppress the cyclooxygenase–prostaglandin E2 (COX-PGE2) signaling pathway, resulting in the down regulation of matrix metalloproteinase-1 (MMP-1), a collagenase responsible for collagen degradation [
23,
24]. This indirect mechanism suggests that mitragynine and kratom extracts can offer protection against collagen degradation and support anti-aging benefits, even in the absence of direct enzymatic inhibition. Moreover, kratom leaf extracts contain a diverse array of bioactive compounds, including flavonoids, polyphenols, and terpenoids, all known to contribute to various pharmacological activities [
25]. The antioxidant properties demonstrated in this study suggest that these compounds may act synergistically, enhancing the overall inhibitory effect on collagenase activity. Such synergism may further support the potential utility of kratom leaf extracts in anti-aging skincare applications.
In the NP formulations, collagenase inhibitory activity significantly improved across all kratom leaf extracts. Notably, HK NP had the highest activity (97.2 ± 0.3%), which was not only significantly higher than its crude extract counterpart but also comparable to the inhibitory activity of EGCG and mitragynine. This suggests that the NP formulation of the HK extract achieves inhibition levels similar to those of well-established anti-aging agents. KY NP, KD NP, and KG NP also showed a strong inhibition in the range of 80.56 ± 1.60–97.23 ± 0.29%, all significantly higher than the activities of their respective crude extracts, EGCG, and mitragynine. The substantial enhancement in collagenase inhibition observed in the NP formulations may result from the improved dispersibility of particular active components upon encapsulation. These findings highlight the potential of kratom-derived nanoparticles—particularly HK NP—as promising candidates for anti-aging skincare applications targeting collagen breakdown and skin matrix preservation.
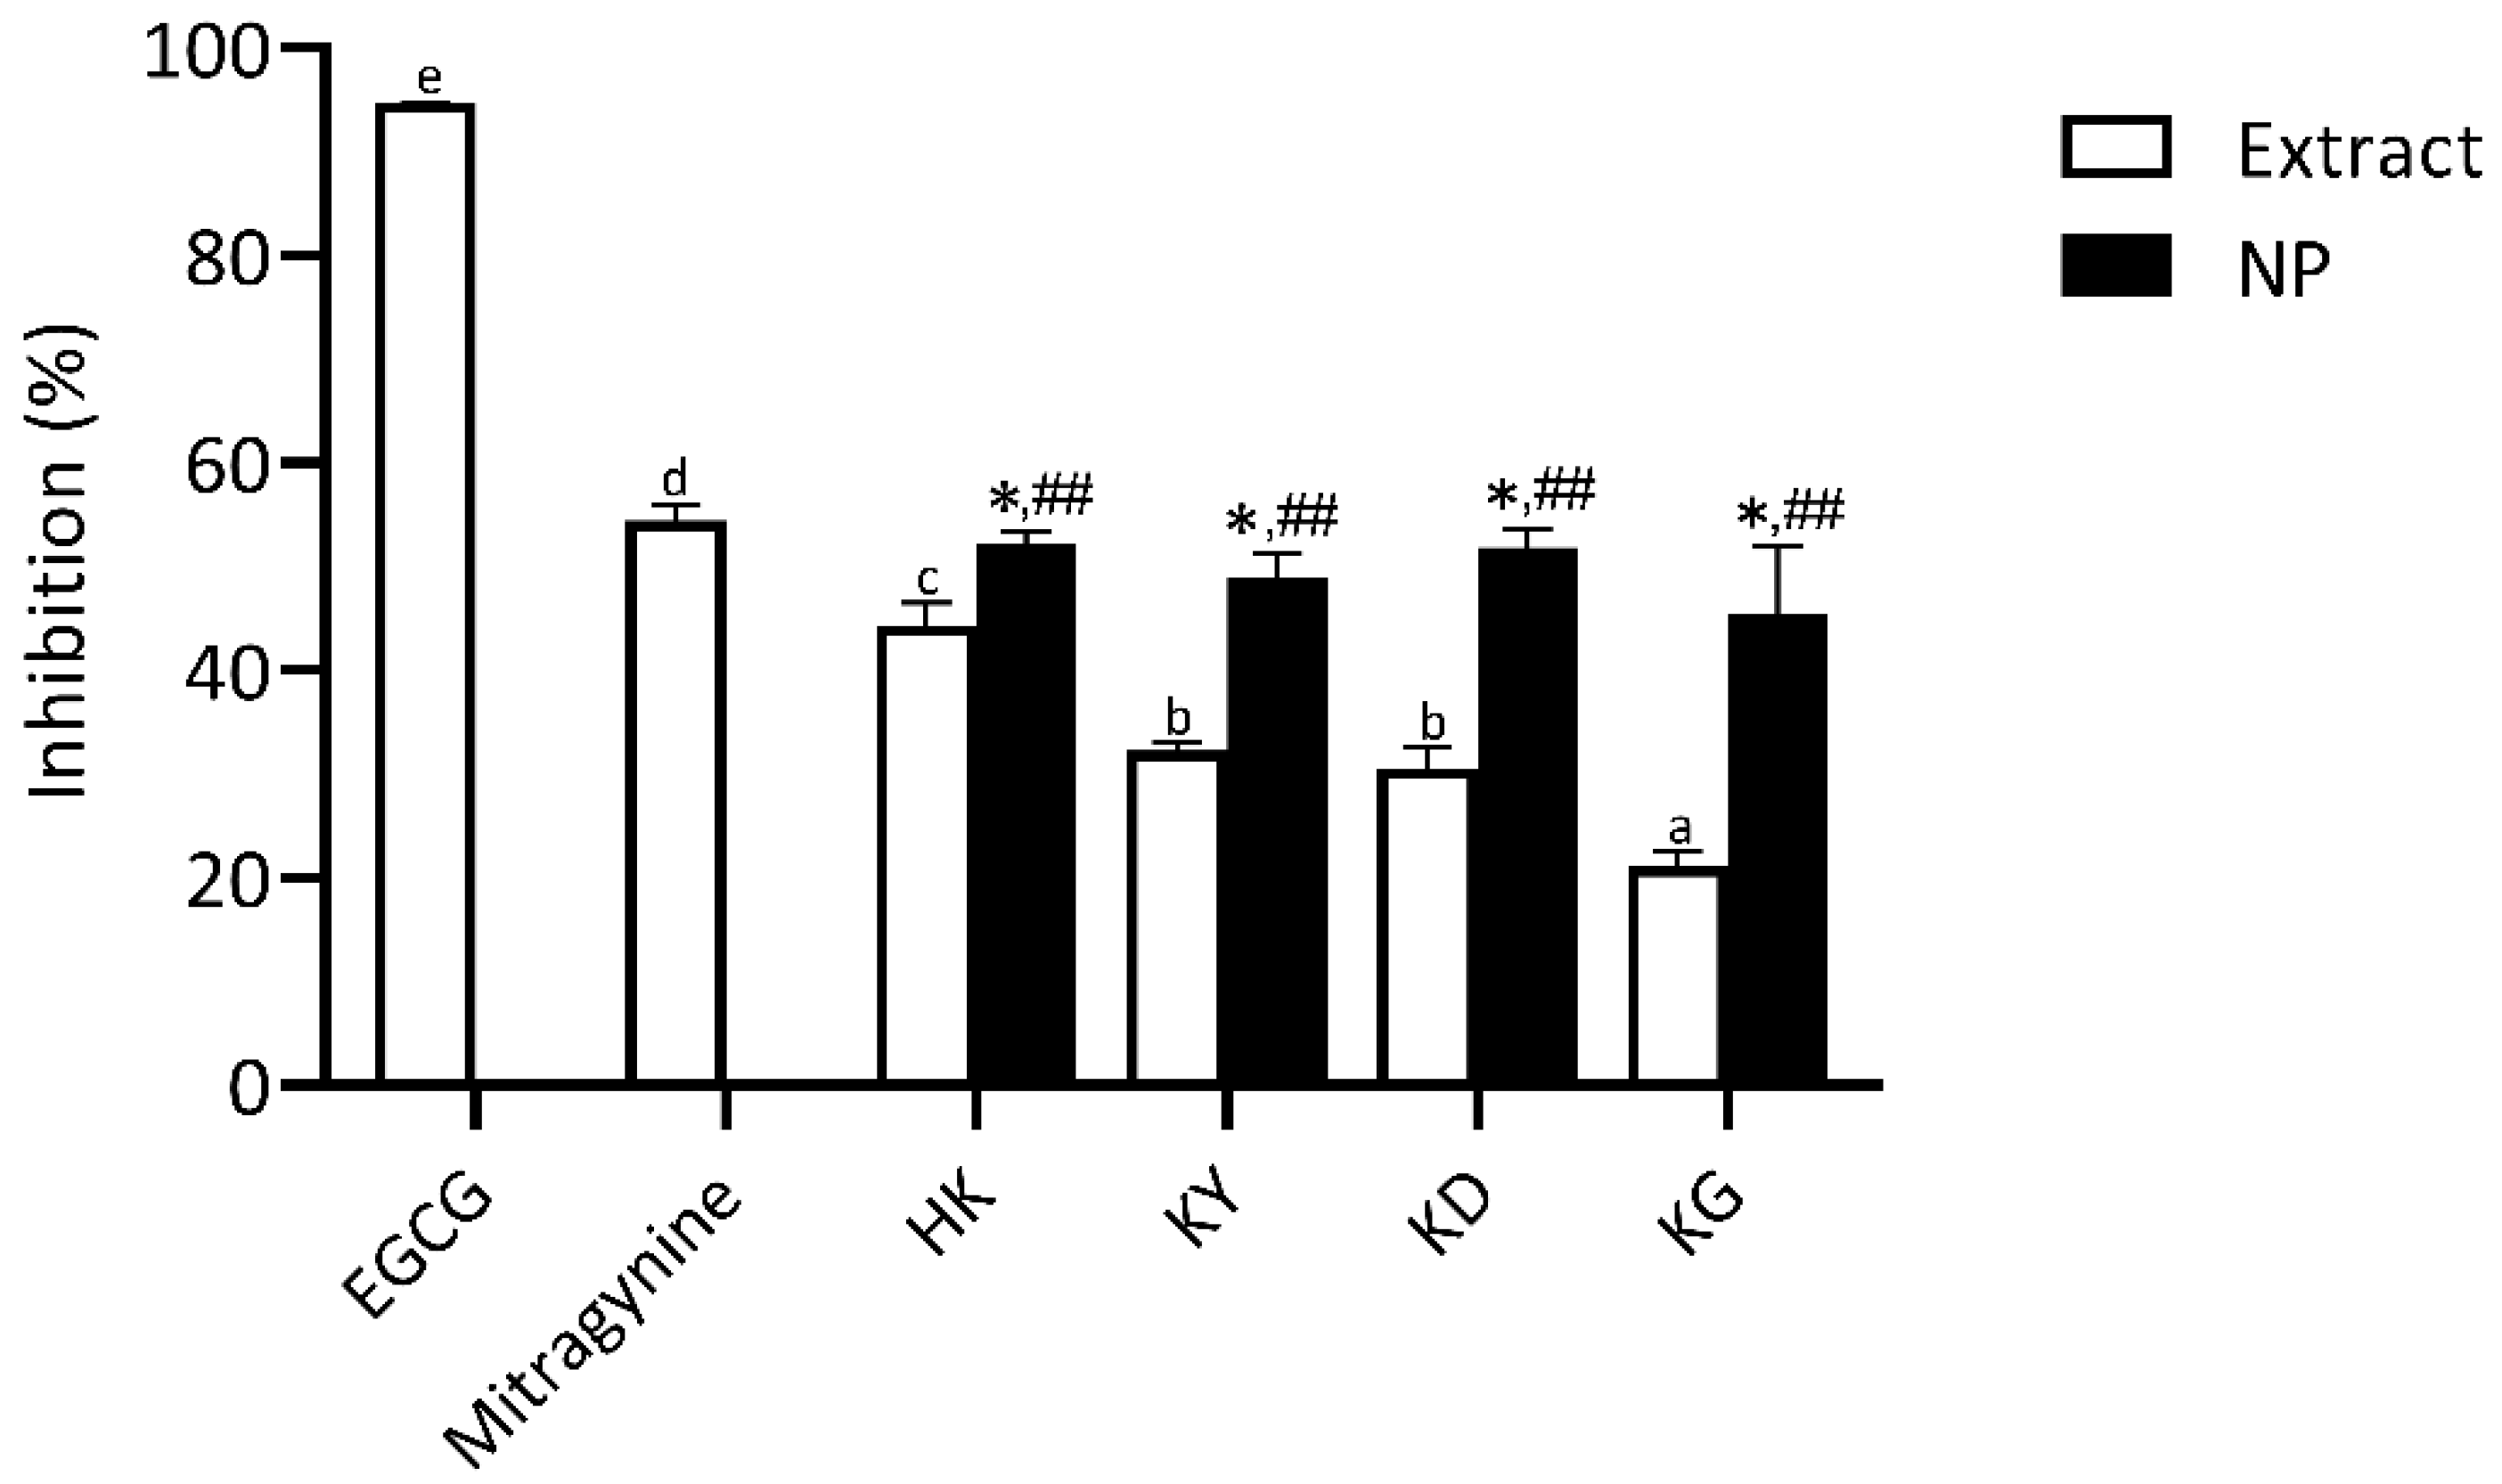
Elastase Inhibitory Activity
Elastin, a key component of the extracellular matrix (ECM), is essential for maintaining skin elasticity and structural integrity. Elastase, a serine protease, hydrolyzes elastin and other ECM proteins, and its dysregulation is closely associated with skin aging processes [
26]. In this study, the elastase inhibitory activity of kratom leaf extracts and their NP formulations was evaluated and compared to EGCG and mitragynine. As shown in
Figure 8, all tested samples exhibited varying degrees of elastase inhibition. EGCG demonstrated the highest elastase inhibitory activity (94.7 ± 0.1%), significantly greater than all other tested samples. Mitragynine exhibited moderate inhibition (54.5 ± 1.5%). Among the crude extracts, HK showed the highest elastase inhibition (44.3 ± 2.3%), followed by KY, KD, and KG, which demonstrated a progressively lower inhibition.
Since elastase is a serine protease responsible for elastin degradation, its inhibition is critical for preserving skin firmness and elasticity [
27]. Natural elastase inhibitors such as catechin and EGCG are well-documented, with polyphenols playing a significant role in this activity [
28,
29]. This study found that mitragynine, an indole alkaloid, and kratom leaf extracts exhibited a moderate but significant elastase inhibition; however, their efficacy was considerably lower than that of EGCG. The observed elastase inhibitory activity of kratom extracts may be influenced by their distinct composition of bioactive compounds, including indole alkaloids and polyphenols. While polyphenols are well known for their direct enzyme inhibition through specific molecular interactions, indole alkaloids may contribute to elastase regulation through alternative mechanisms, such as the suppression of inflammatory pathways and oxidative stress [
30,
31,
32]. These complementary effects highlight the potential of kratom extracts in anti-aging formulations, particularly when combined with other compounds that provide direct enzyme-inhibitory activity.
All NP formulations exhibited significantly higher elastase inhibitory activity than their respective crude extracts, with inhibition levels ranging from approximately 45.46 ± 6.53% to 52.19 ± 1.20%. However, no significant differences were observed among the NP formulations, indicating that the improvement primarily arises from nanoencapsulation itself, which enhances the delivery and effectiveness of active compounds. Although the inhibition levels of the NP formulations remained lower than EGCG, their enhanced activity compared to crude extracts highlights the potential of nanotechnology in improving the efficacy of kratom extracts for dermal anti-aging applications targeting elastase inhibition.
Hyaluronidase Inhibitory Activity
Hyaluronic acid (HA) is a vital component of the extracellular matrix (ECM), playing a key role in maintaining skin hydration and moisture balance. Enhancing HA levels primarily involves inhibiting hyaluronidase activity, as this enzyme is responsible for HA degradation [
4]. Therefore, the use of effective hyaluronidase inhibitors represents a targeted strategy to preserve HA content and support skin hydration. The hyaluronidase inhibitory activity of kratom leaf extracts and their NP formulations was evaluated and compared to EGCG, a well-established positive control, and mitragynine, the principal bioactive marker compound. As shown in
Figure 9, all samples exhibited varying degrees of hyaluronidase inhibition. Mitragynine (83.33 ± 1.35%) and EGCG (77.75 ± 2.42%) exhibited high levels of inhibitory effects, both significantly greater than those of the kratom leaf extracts. The strong activity of mitragynine suggests a possible interaction with the enzyme, potentially preventing the degradation of hyaluronic acid, a crucial component for maintaining skin hydration and firmness The crude kratom extracts, including HK, KY, KD, and KG, demonstrated moderate hyaluronidase inhibition (61.56 ± 0.51–70.31 ± 1.66%), with no statistically significant difference among several samples, indicating a relatively similar bioactive compound profile. The notable hyaluronidase inhibitory effect of mitragynine observed in this study may be mechanistically associated with its well-documented anti-inflammatory properties, which may also contribute indirectly to the regulation of hyaluronidase activity.
Following NP formulations, all kratom leaf extracts showed significantly enhanced hyaluronidase inhibitory activity. HK NP demonstrated the highest inhibitory activity (91.67 ± 3.56%), exceeding that of its corresponding extract and statistically comparable to mitragynine. Other NP samples—KY NP (86.83 ± 2.48%), KD NP (84.98 ± 2.06%), and KG NP (83.23 ± 2.34%) also showed marked improvements over their respective extracts. Other NP samples—KY NP (86.3 ± 2.5%), KD NP (84.9 ± 2.1%), and KG NP (83.2 ± 2.3%) also showed marked improvements over their respective extracts. These results suggest that nanoencapsulation effectively preserves or enhances the hyaluronidase-inhibiting activity of the bioactive constituents, highlighting their potential for skincare applications aimed at retaining skin moisture by protecting hyaluronic acid from enzymatic degradation.
The significant inhibition of hyaluronidase by mitragynine may also be attributed to its anti-inflammatory properties. Hyaluronidase not only degrades hyaluronic acid but also promotes inflammation by generating low-molecular-weight hyaluronic acid fragments that act as damage-associated molecular patterns (DAMPs). These fragments can trigger inflammation and tissue degradation [
33]. Mitragynine, the main indole alkaloid in
Mitragyna speciosa, has been shown to inhibit pro-inflammatory mediators such as TNF-α, IL-1β, and COX-2, while suppressing NF-κB signaling, all of which are closely involved in inflammation and aging processes [
34,
35]. Similarly, ginkgoside B dimethyl ester, an indole alkaloid N-glycoside derived from
Ginkgo biloba, has been reported to protect dermal fibroblasts by reducing MMP-1 expression, restoring collagen levels, and inhibiting MAPK and Akt signaling pathways [
36]. These findings suggest that mitragynine may exert protective effects on the skin through similar anti-inflammatory and anti-degradative mechanisms.
The anti-aging related enzyme activities indicate that while mitragynine contributes to enzyme inhibition, especially collagenase and hyaluronidase, its activity alone does not fully explain the observed effects. EGCG, used as a positive control, exhibited superior elastase and collagenase inhibition, reinforcing its role as a potent anti-aging standard. Therefore, the anti-enzyme effects in kratom extracts and NPs are likely involving not only mitragynine but also polyphenolic compounds.
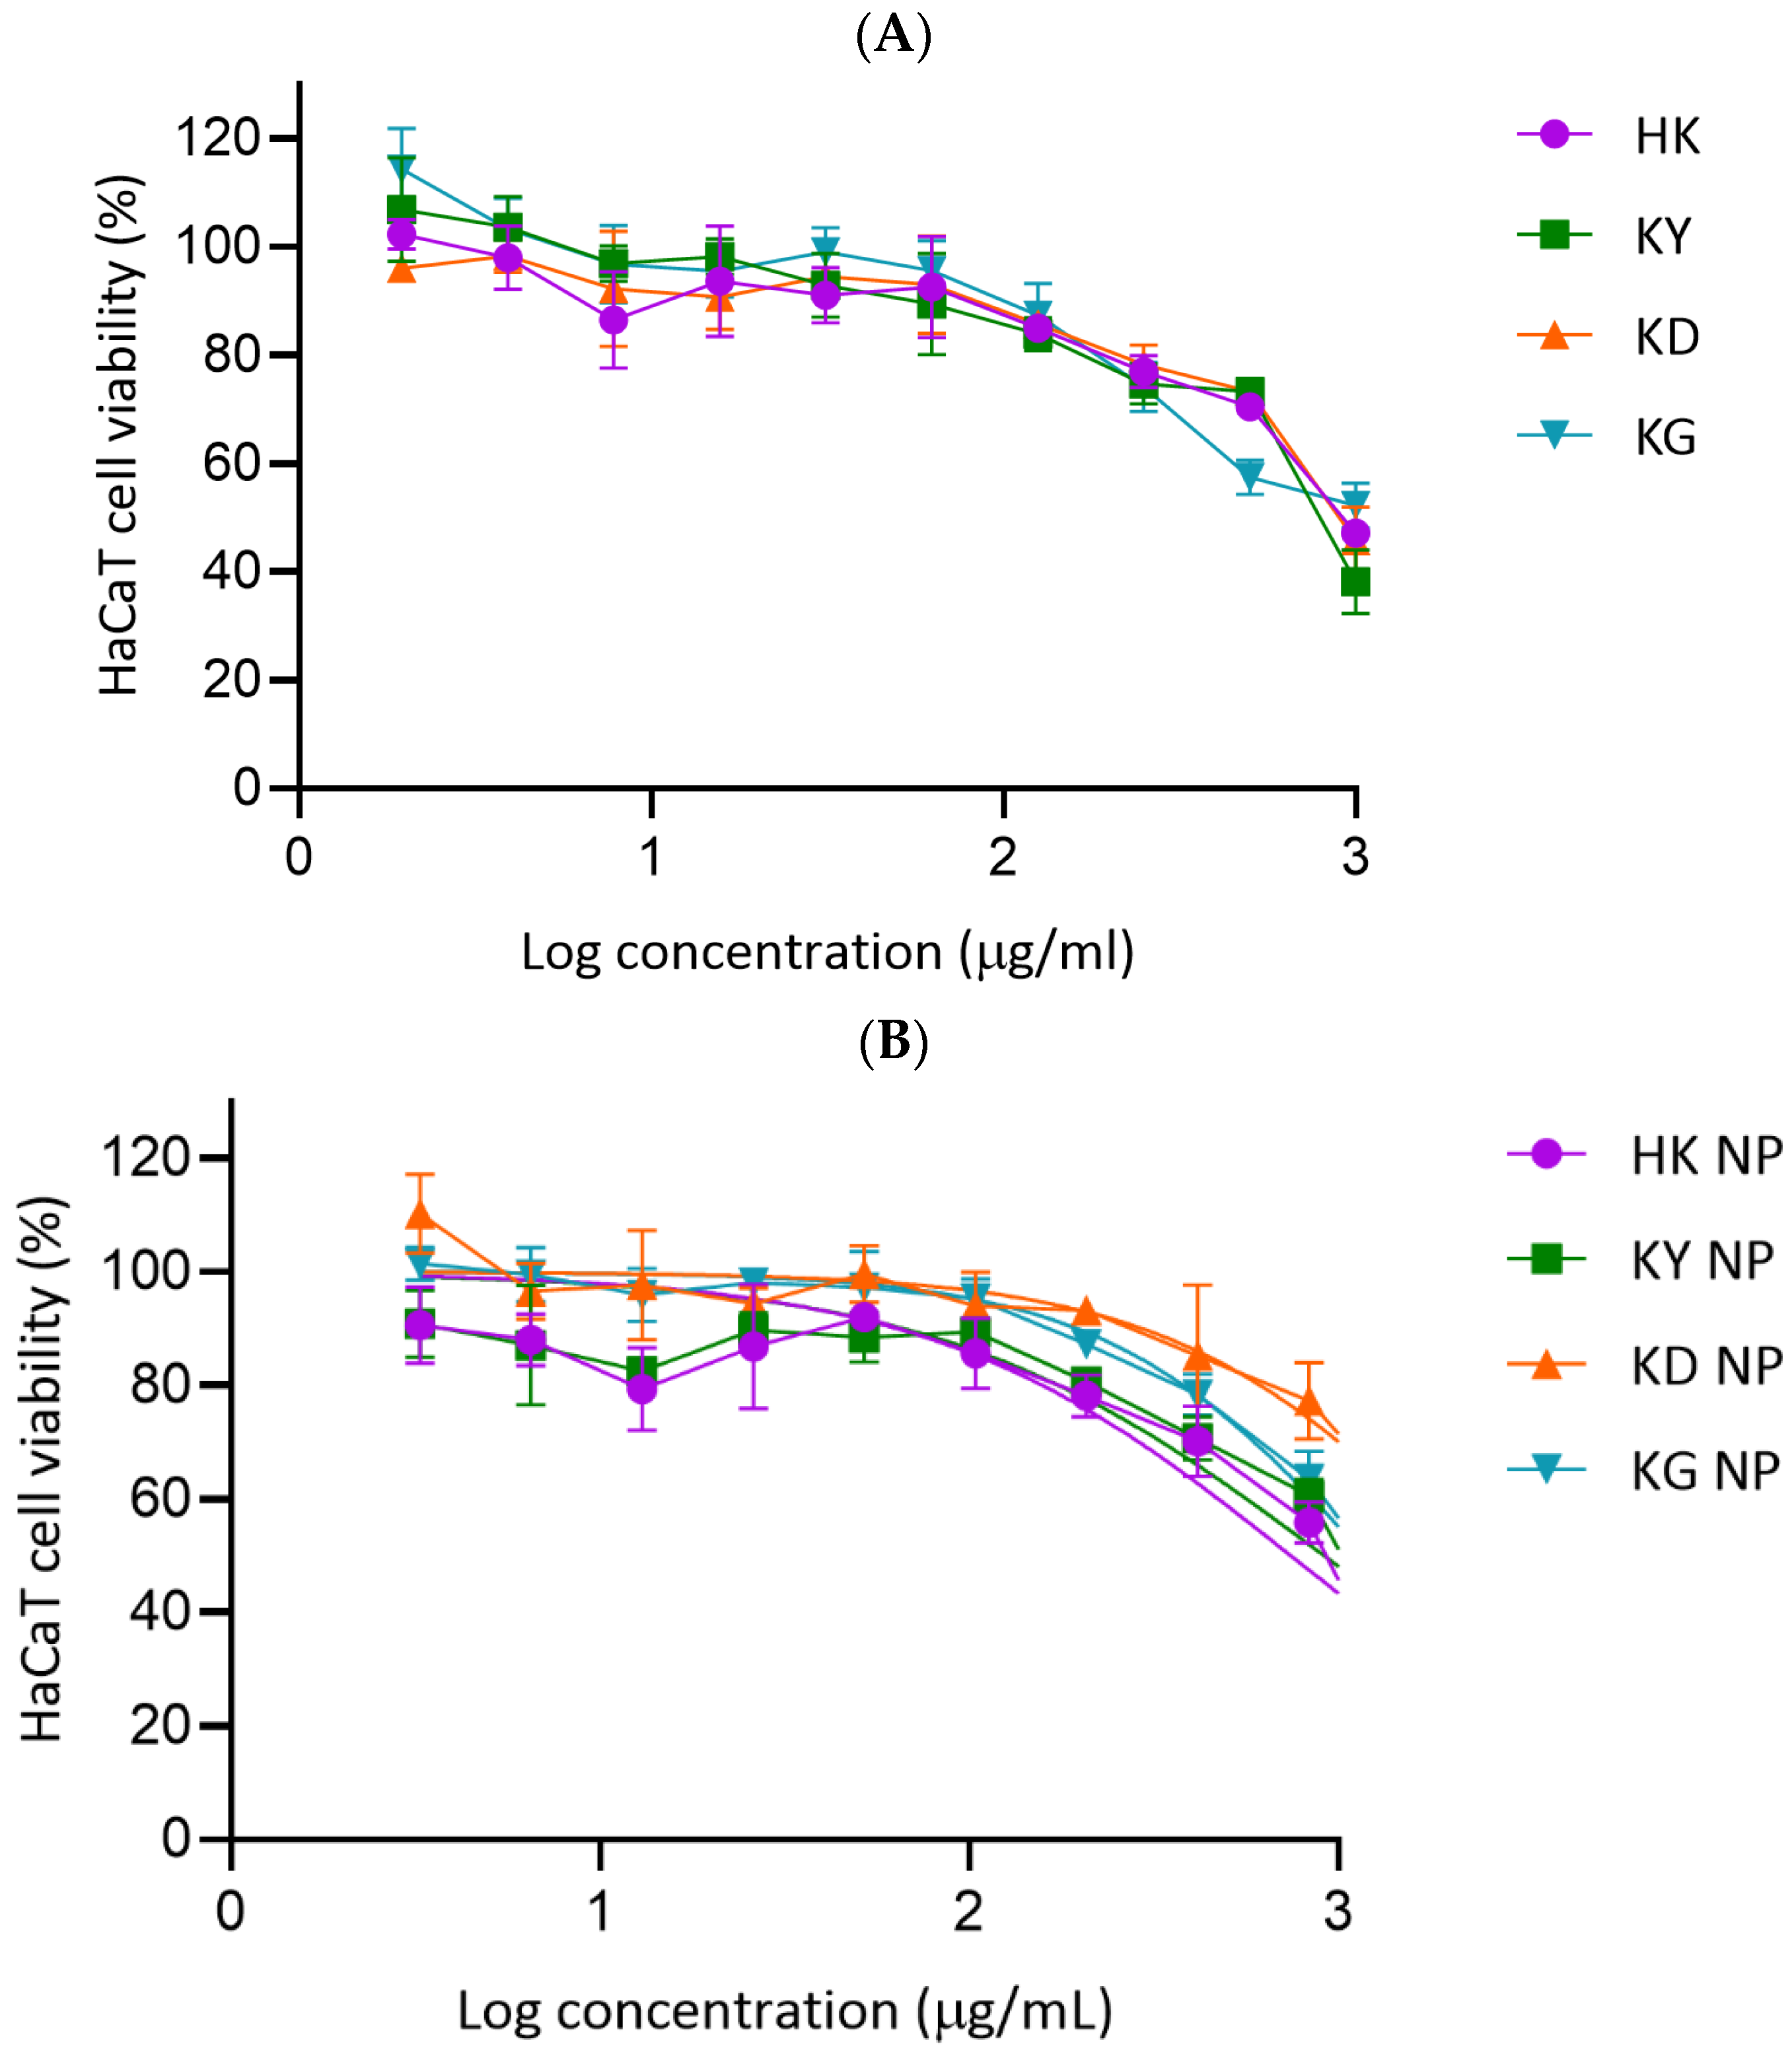
Cytotoxicity Evaluation on HaCaT Cells
The cytotoxicity of kratom leaf extracts and their NP formulations was evaluated using the MTT assay in HaCaT human keratinocyte cells across a range of log concentrations. As shown in
Figure 10A,B, both crude extracts and NP formulations demonstrated a dose-dependent reduction in cell viability, with varying IC
50 values. Among the crude extracts, HK and KD exhibited the highest IC
50 values (1265.20 ± 325.44 and 1252.57 ± 430.55 µg/mL, respectively), indicating a lower cytotoxicity. KG and KY extracts showed moderately lower IC
50 values (896.70 ± 37.65 and 762.55 ± 15.34 µg/mL, respectively), suggesting a comparatively higher cytotoxicity. For the NP formulations, KD NP exhibited the highest IC
50 value (1232.00 ± 140.50 µg/mL), followed by KG NP (718.33 ± 118.47 µg/mL), indicating an improved cytocompatibility relative to their respective crude extracts. In contrast, HK NP showed a reduced IC
50 (447.67 ± 77.88 µg/mL), suggesting a slightly higher cytotoxicity than its crude extract. KY NP had an intermediate IC
50 value of 550.87 ± 33.80 µg/mL. Overall, most extracts and NP formulations maintained over 80% cell viability at concentrations below 100 µg/mL. The findings suggest that kratom samples, particularly in nanoparticle form, are generally well tolerated by HaCaT cells at moderate concentrations. The improved IC
50 values observed for KD NP and KG NP support their potential for safer application in skin-related formulations.
The IC50 values derived from the cytotoxicity assay against HaCaT keratinocyte cells were statistically analyzed using Tukey’s multiple comparisons test. Comparisons among the crude extracts, HK, KD, KY, and KG, revealed no statistically significant differences (p > 0.05 for all pairwise comparisons), indicating comparable cytotoxicity profiles among these extracts. When comparing the nanoparticle formulations, significant differences were observed between KD NP and both KY NP and HK NP, suggesting that KY NP and HK NP exerted stronger cytotoxic effects than KD NP. However, no significant differences were found among the other nanoparticle groups, indicating a relatively similar cytotoxicity among KY NP, HK NP, and KG NP. When comparing each extract with its corresponding nanoparticle formulation, only HK NP demonstrated a significantly lower IC50 value compared to the HK extract (p = 0.0031), suggesting an enhanced cytotoxicity through nanoparticle delivery. In contrast, the differences between extract and nanoparticle forms for KD, KY, and KG were not statistically significant (p > 0.05). These findings suggest that nanoparticle encapsulation selectively enhanced the cytotoxic potential of the HK extract, while other formulations showed comparable activity to their crude counterparts.
Preliminary Physical and Sensory Evaluation of Kratom Nanoparticle-Loaded Gels
All four kratom NP-based gel formulations containing HK NP, KY NP, KD NP, and KG NP exhibited a clear to translucent, brownish appearance, indicating good clarity and the uniform dispersion of the NPs within the gel matrix (
Figure 11). The assessment of physical and sensory attributes such as texture, spreadability, and tackiness was performed subjectively by the researchers through visual inspection and manual handling. While this preliminary evaluation suggested acceptable characteristics for topical application, no formal sensory panel or instrumental texture analysis was conducted, and no human volunteer testing was performed.
Characterization of Kratom Nanoparticle-Loaded Gels and Their Stability
Physical characteristics
After six heating/cooling cycles in the stability assay, the physical characteristics of all four kratom NP-loaded gel formulations had favorable physical properties. Each gel appeared clear and brownish, with a uniform texture and no visible phase separation, indicating good homogeneity and proper dispersion of active ingredients.
pH Measurement
All freshly prepared kratom nanoparticle-loaded gel formulations demonstrated near-neutral to slightly alkaline pH values. KD NP and KY NP gels both exhibited the initial highest pH, averaging 7.83 ± 0.05 and 7.83 ± 0.03, respectively, followed by KG NP gel at 7.56 ± 0.04 and HK NP gel at 7.27 ± 0.06. After undergoing six cycles of heating and cooling in a stability assay, a slight increase in pH was observed in most formulations. KD NP and KY NP gels again recorded the highest pH values at 7.88, while HK NP gel increased marginally to 7.33 ± 0.18. KG NP gel maintained a stable pH of 7.56 ± 0.09. These findings suggest overall stability in pH across all formulations, with only minimal changes following thermal stress.
The pH values of the formulations ranged from 7.27 to 7.83, which are near-neutral and within the acceptable range for topical application (pH 5.3–7.6). These values suggest a low likelihood of skin irritation and support the potential for safe dermal use. Moreover, the low standard deviation among repeated measurements indicates good formulation consistency and batch reproducibility.
Rheological Evaluation
Upon fresh preparation, the KG NP-loaded gel displayed the highest viscosity (12.602 ± 0.294 Pa·s), followed closely by the KY NP-loaded gel (12.291 ± 0.038 Pa·s) and HK NP (11.898 ± 0.139 Pa·s). The KD NP-loaded gel had the lowest initial viscosity at 11.518 ± 0.072 Pa·s. After six cycles of heating and cooling in the stability assay, a slight reduction in viscosity was noted across all samples, though the relative order remained unchanged. The KG NP gel still showed the highest viscosity (11.674 ± 0.097 Pa·s), followed by HK NP (11.197 ± 0.163 Pa·s), KY NP (11.073 ± 0.233 Pa·s), and KD NP (10.719 ± 0.261 Pa·s). The blank gel formulation exhibited intermediate viscosity values at both time points (11.885 ± 0.225 Pa·s initially and 11.577 ± 0.071 Pa·s after thermal cycling), indicating that the presence of the kratom extract influenced the rheological behavior.
Collectively, these findings indicate that the kratom NP gel formulations maintained desirable physical characteristics under the studied conditions. The combination of stable appearance, acceptable pH, and consistent viscosity suggests that these formulations are suitable candidates for topical delivery. Nevertheless, accelerated and long-term stability testing under standard recommended storage conditions would be essential to confirm their robustness for commercial application.


 ,
, 


