2.1. Laboratory Tests
The study of the properties of FGC unexpectedly revealed that an increase in temperature to 60 °C practically does not affect the foam expansion ratio and the half-life of FGC could not be determined at all. The fact is that the structural and mechanical properties of gels in lamella films are so high that the resulting foam practically does not collapse (like solid foams).
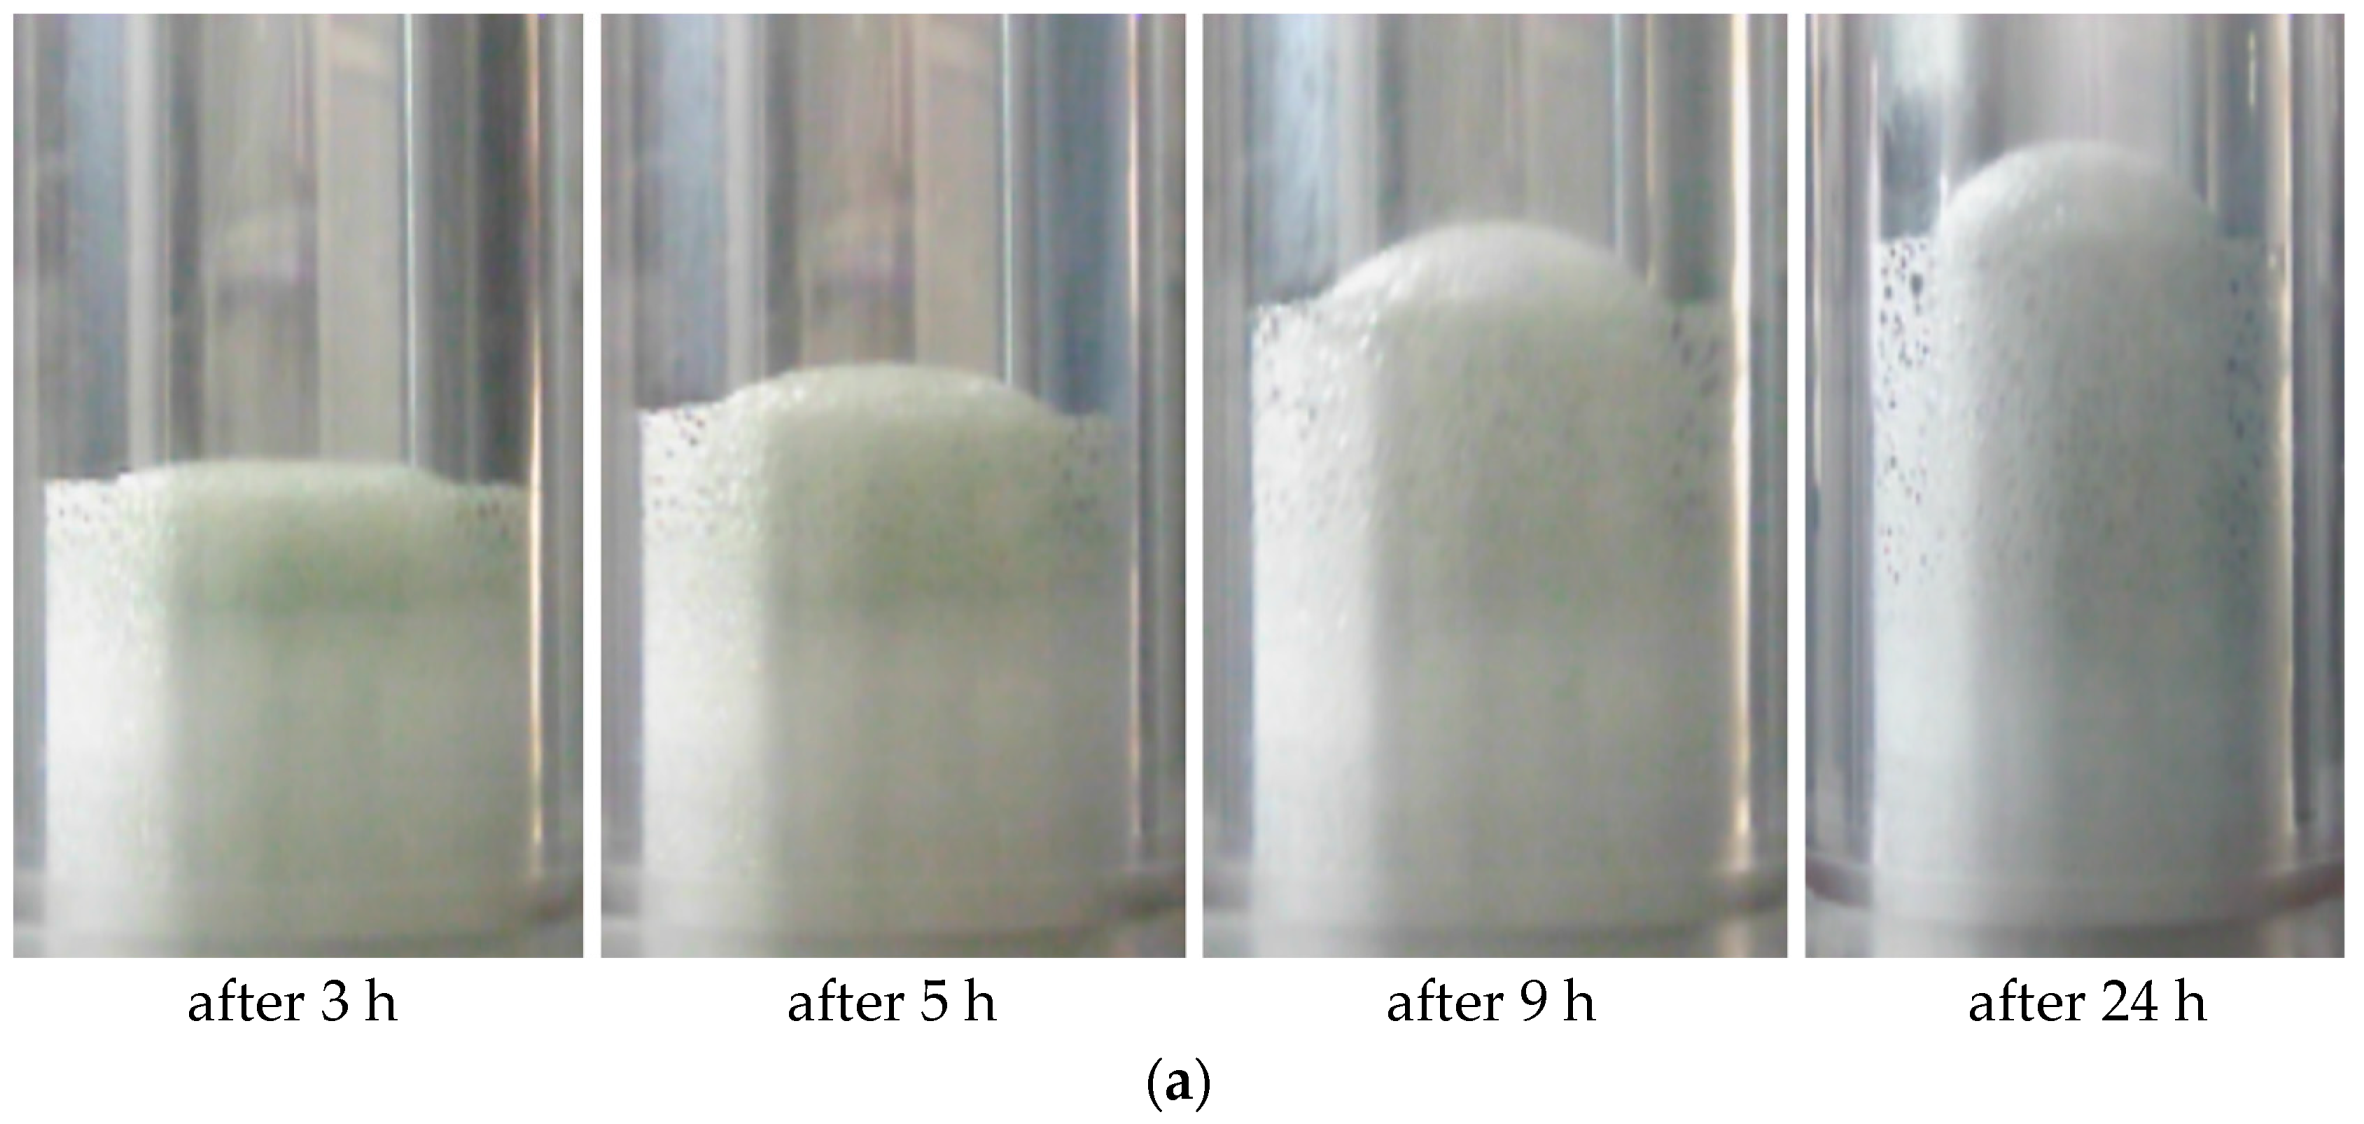
Experiments conducted using the Micro PVT apparatus showed that the increase in foam volume stops after 24 h at a pressure of 5 MPa (
Figure 1a).
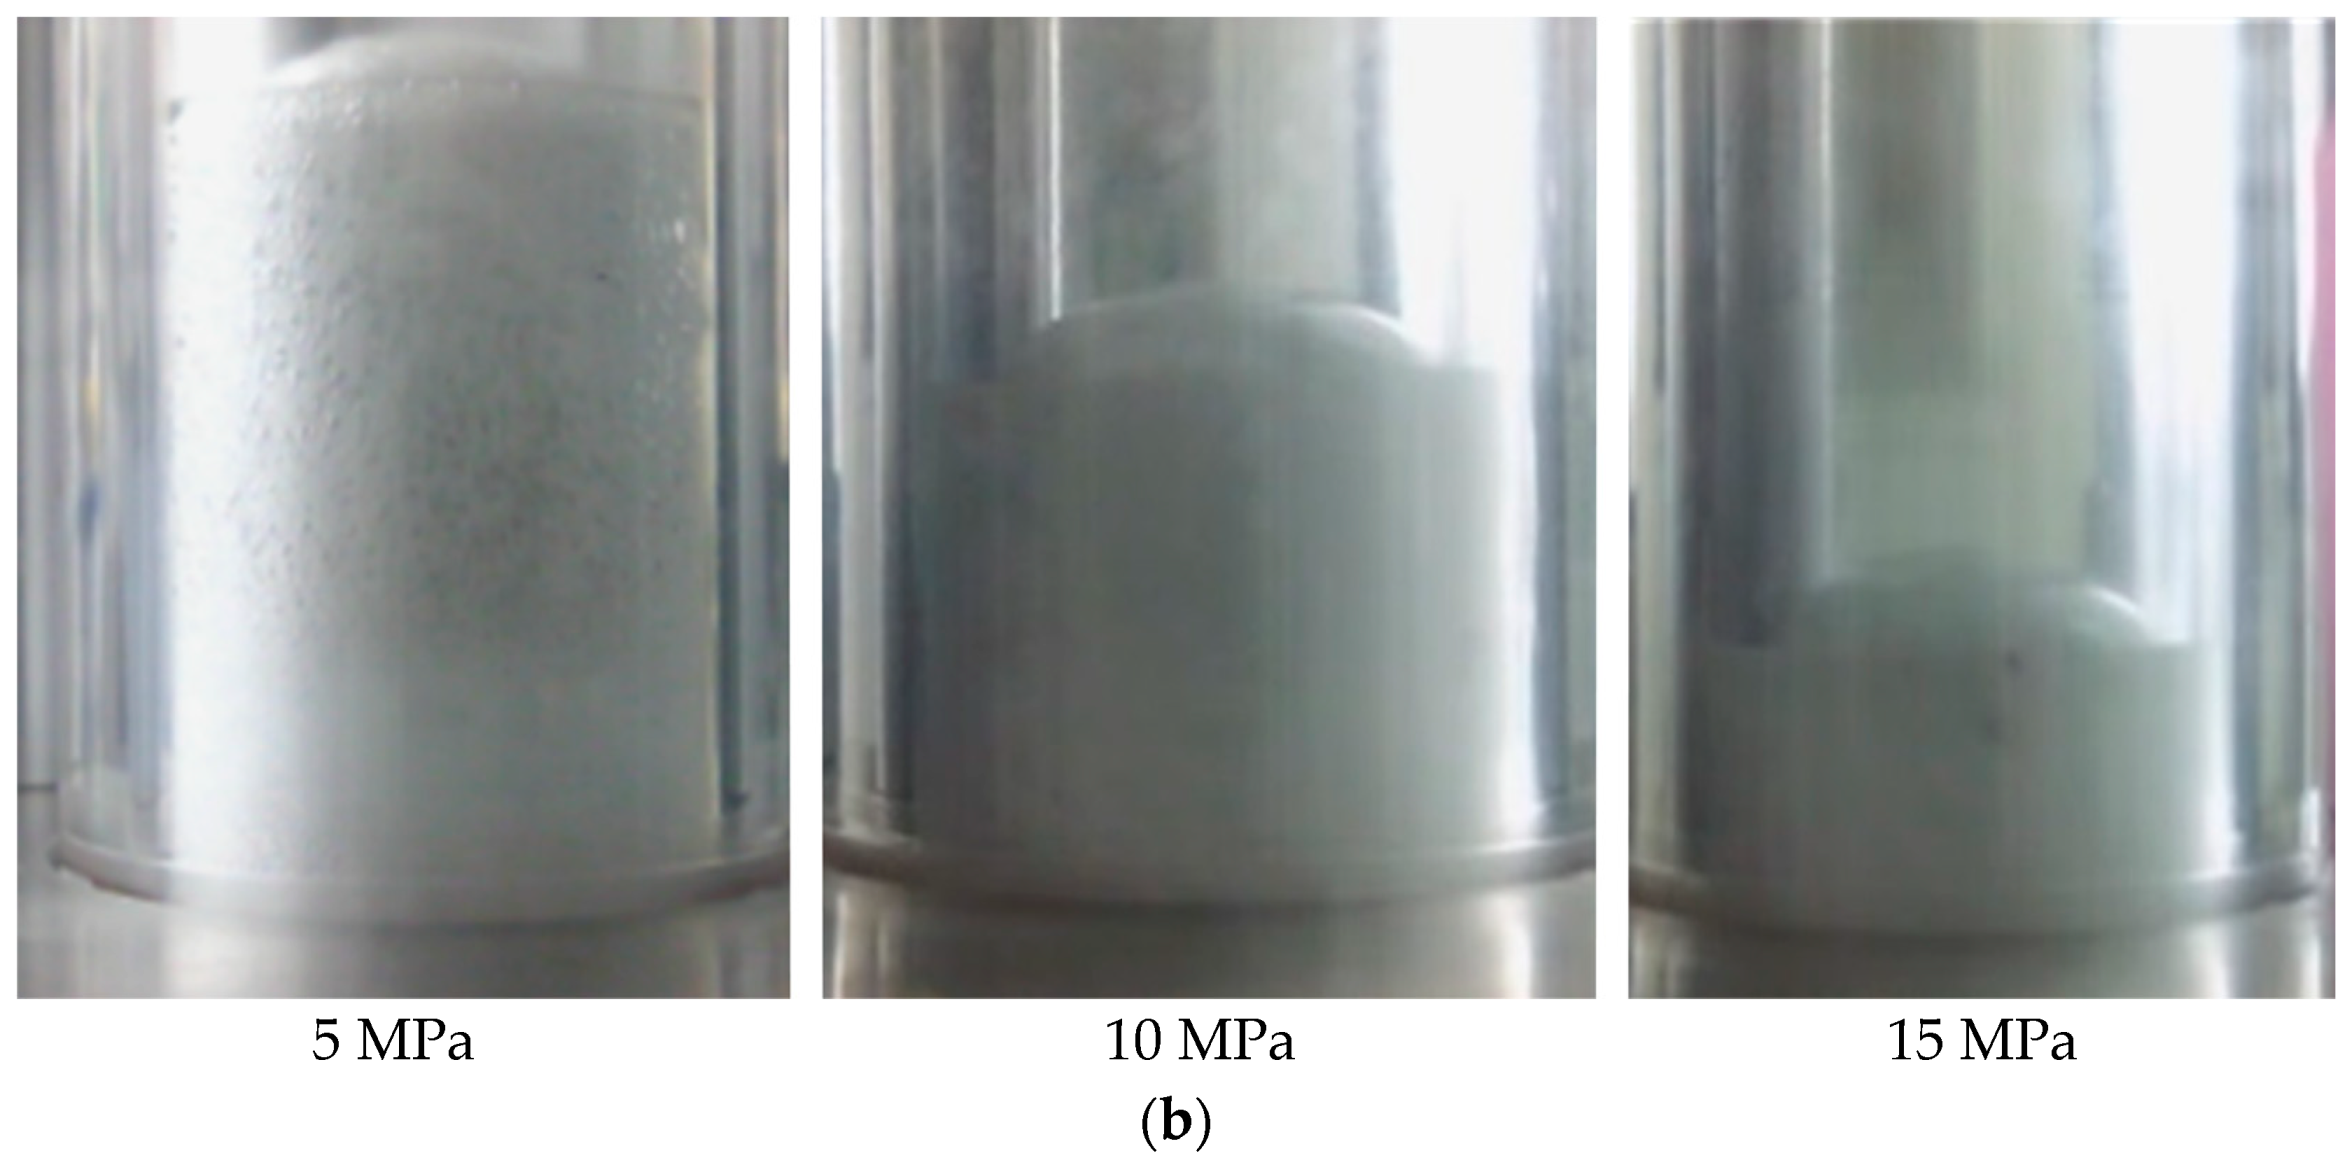
The pressure has an expected impact on the foam expansion ratio of self-generating FGC, namely, the foaming capacity of two-phase foam systems significantly decreases even with a slight increase in pressure. The foam structure failed to form in the fresh water when the pressure was increased to 2.5 MPa, given the following composition of FGC: [PAM A523 (0.6%) + sodium nitrite (2.7%) + ammonium chloride (2.3%) + chromium acetate (0.3%)]. It was possible to increase the foam expansion ratio to a value above 8 only in case of an increase in the concentration of gas-generating salts in the composition by 3 times (pressure 2.5 MPa). The foam expansion ratio decreased as follows with a further increase in pressure: to 3 at 5 MPa; to 2 at 10 MPa and to 1.5 at 15 MPa (
Figure 1b).
It should be noted that the foaming time and the time of loss of fluidity for compositions with a high content of the gas-generating mixture should provide sufficient time for injecting compositions into the isolated interval before crosslinking. The acceptable time for this process ranges from 2 to 6 h, and the composition should maintain a sufficient foam expansion ratio. In this study, the fluidity loss time ranged from 4 to 6.5 h.
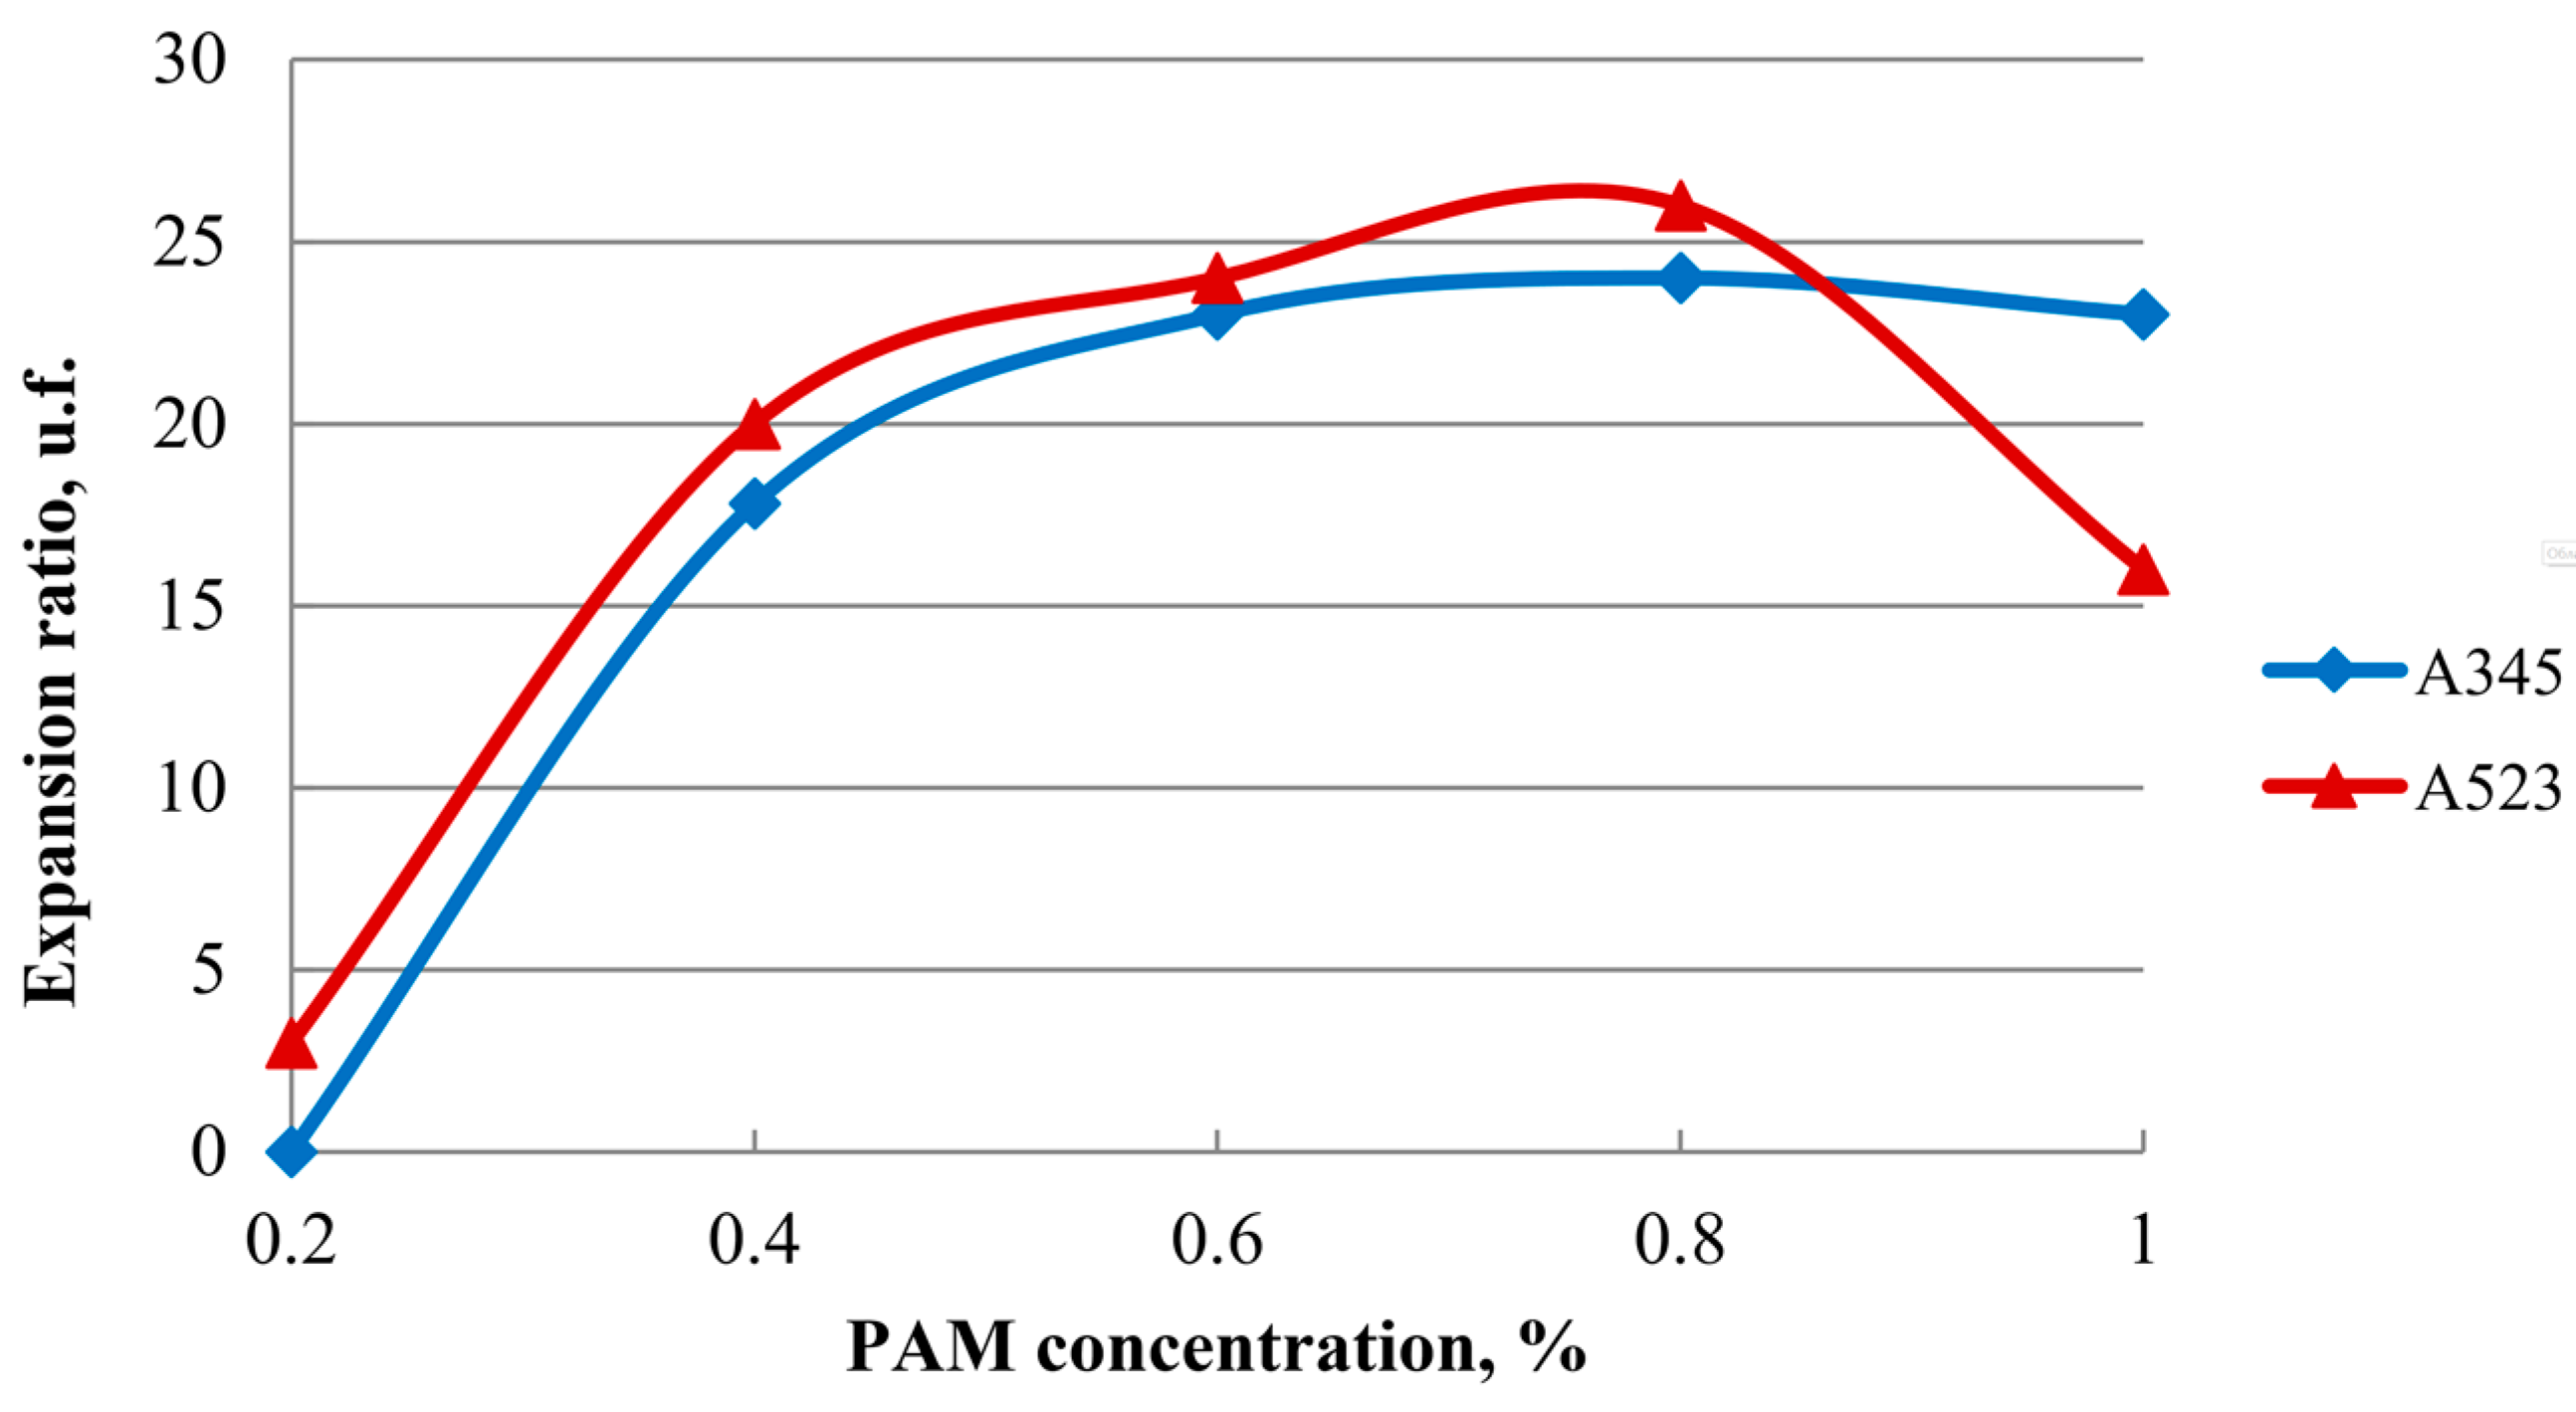
As can be seen from
Figure 2, compositions with a polymer concentration of 0.6% for both high-molecular-weight PAM (A345) and low-molecular-weight PAM (A523) have the necessary foam expansion ratio parameters. This is because both high- and low-molecular-weight polyacrylamides form a crosslinked polymer structure called a hydrogel. At this polymer concentration, the necessary structural and mechanical properties of the hydrogel are provided, which are manifested in the same foam expansion ratio parameters.
The results of rheological studies performed using the method in [
32] showed that the viscosity of FGC significantly exceeds the viscosity of the non-foamed gel (
Figure 3).
It should be noted that immediately after the mixing of foam components, the foam system has low effective viscosity values, which allows it to be delivered into the reservoir. The viscosity of the composition significantly increases at the time of its final crosslinking, which meets the requirements of effectively sealing the gas inflow filtration channels.
Oscillating stress tests (dynamic tests) allow the study of the viscous and elastic reactions of a liquid sample depending on the rate of impact on it, in other words, constructing the dependence of oscillating stress or strain on a given angular velocity or frequency.
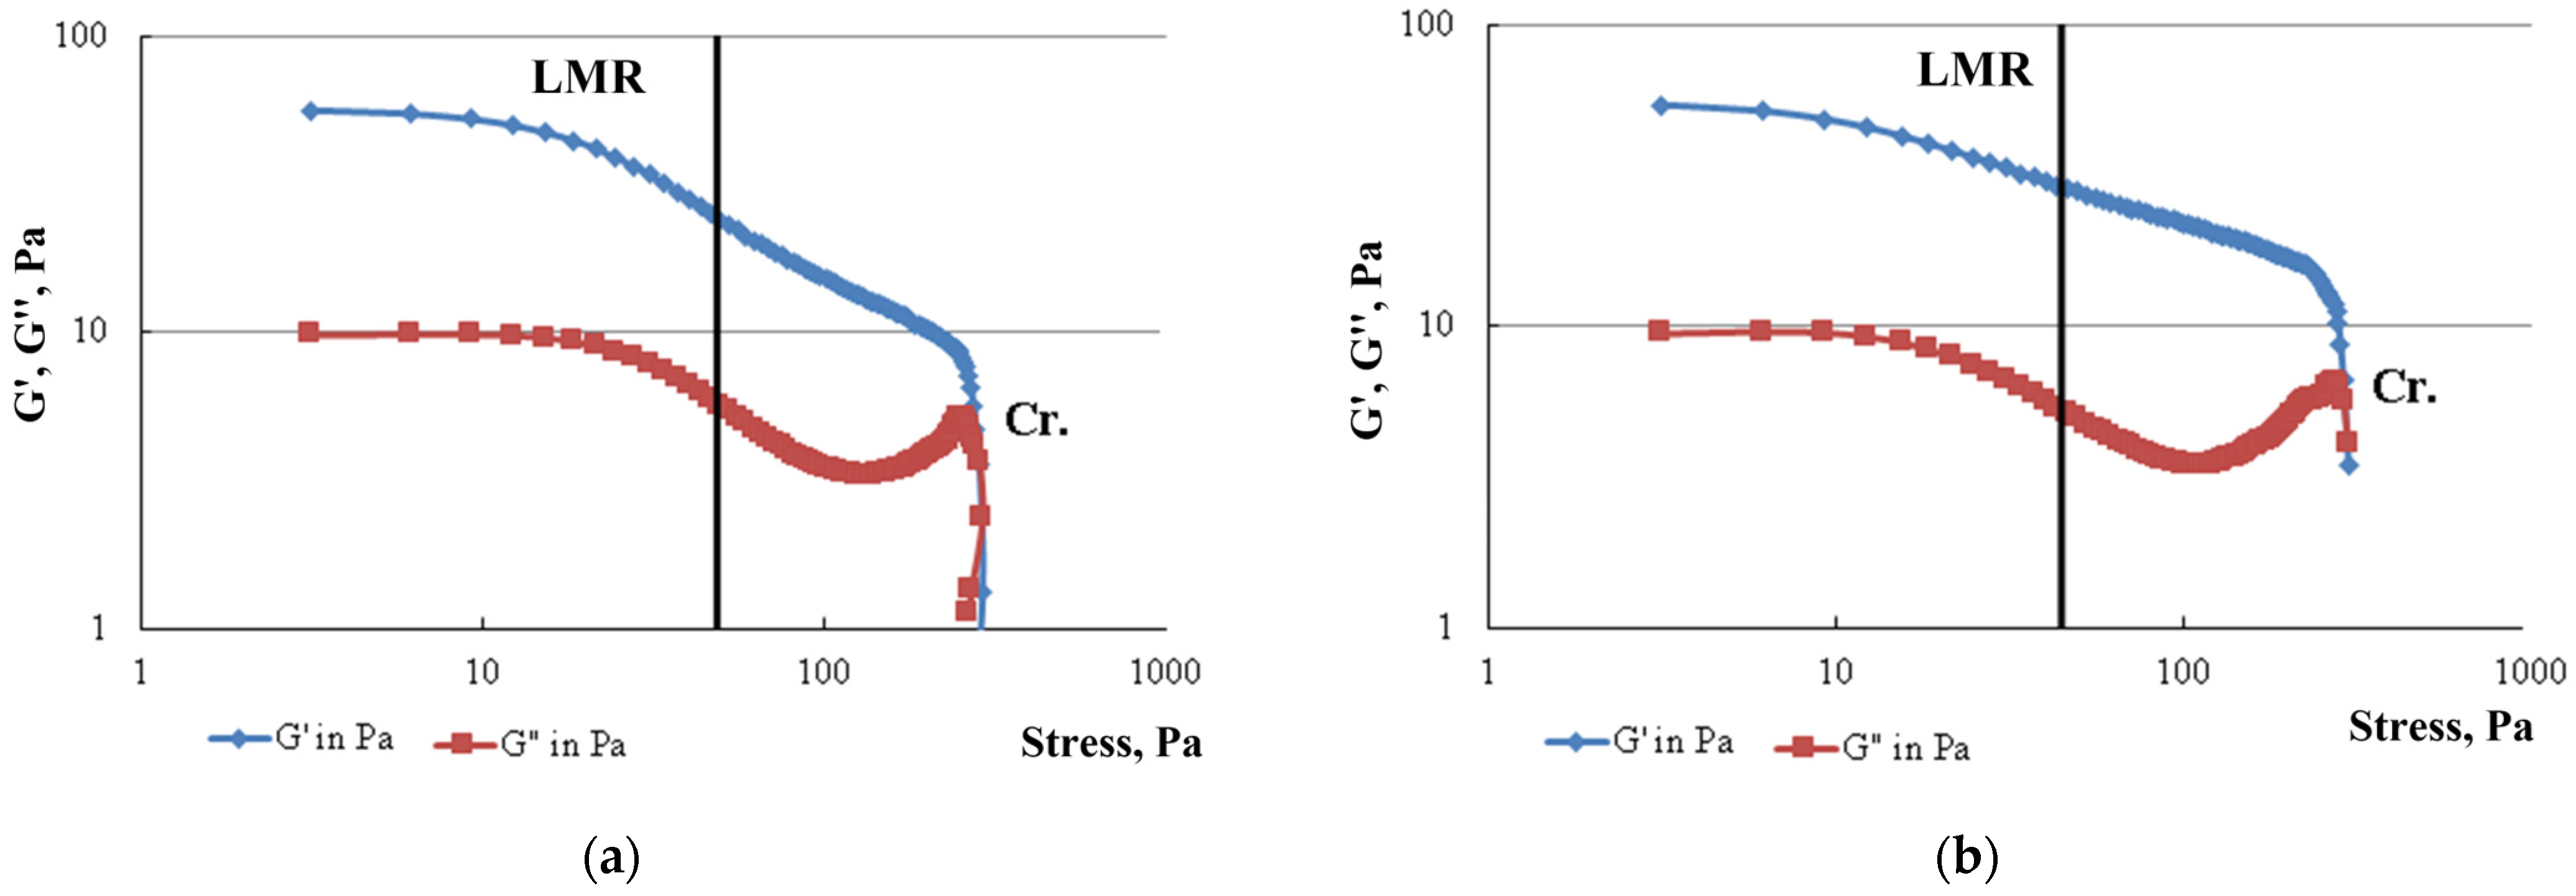
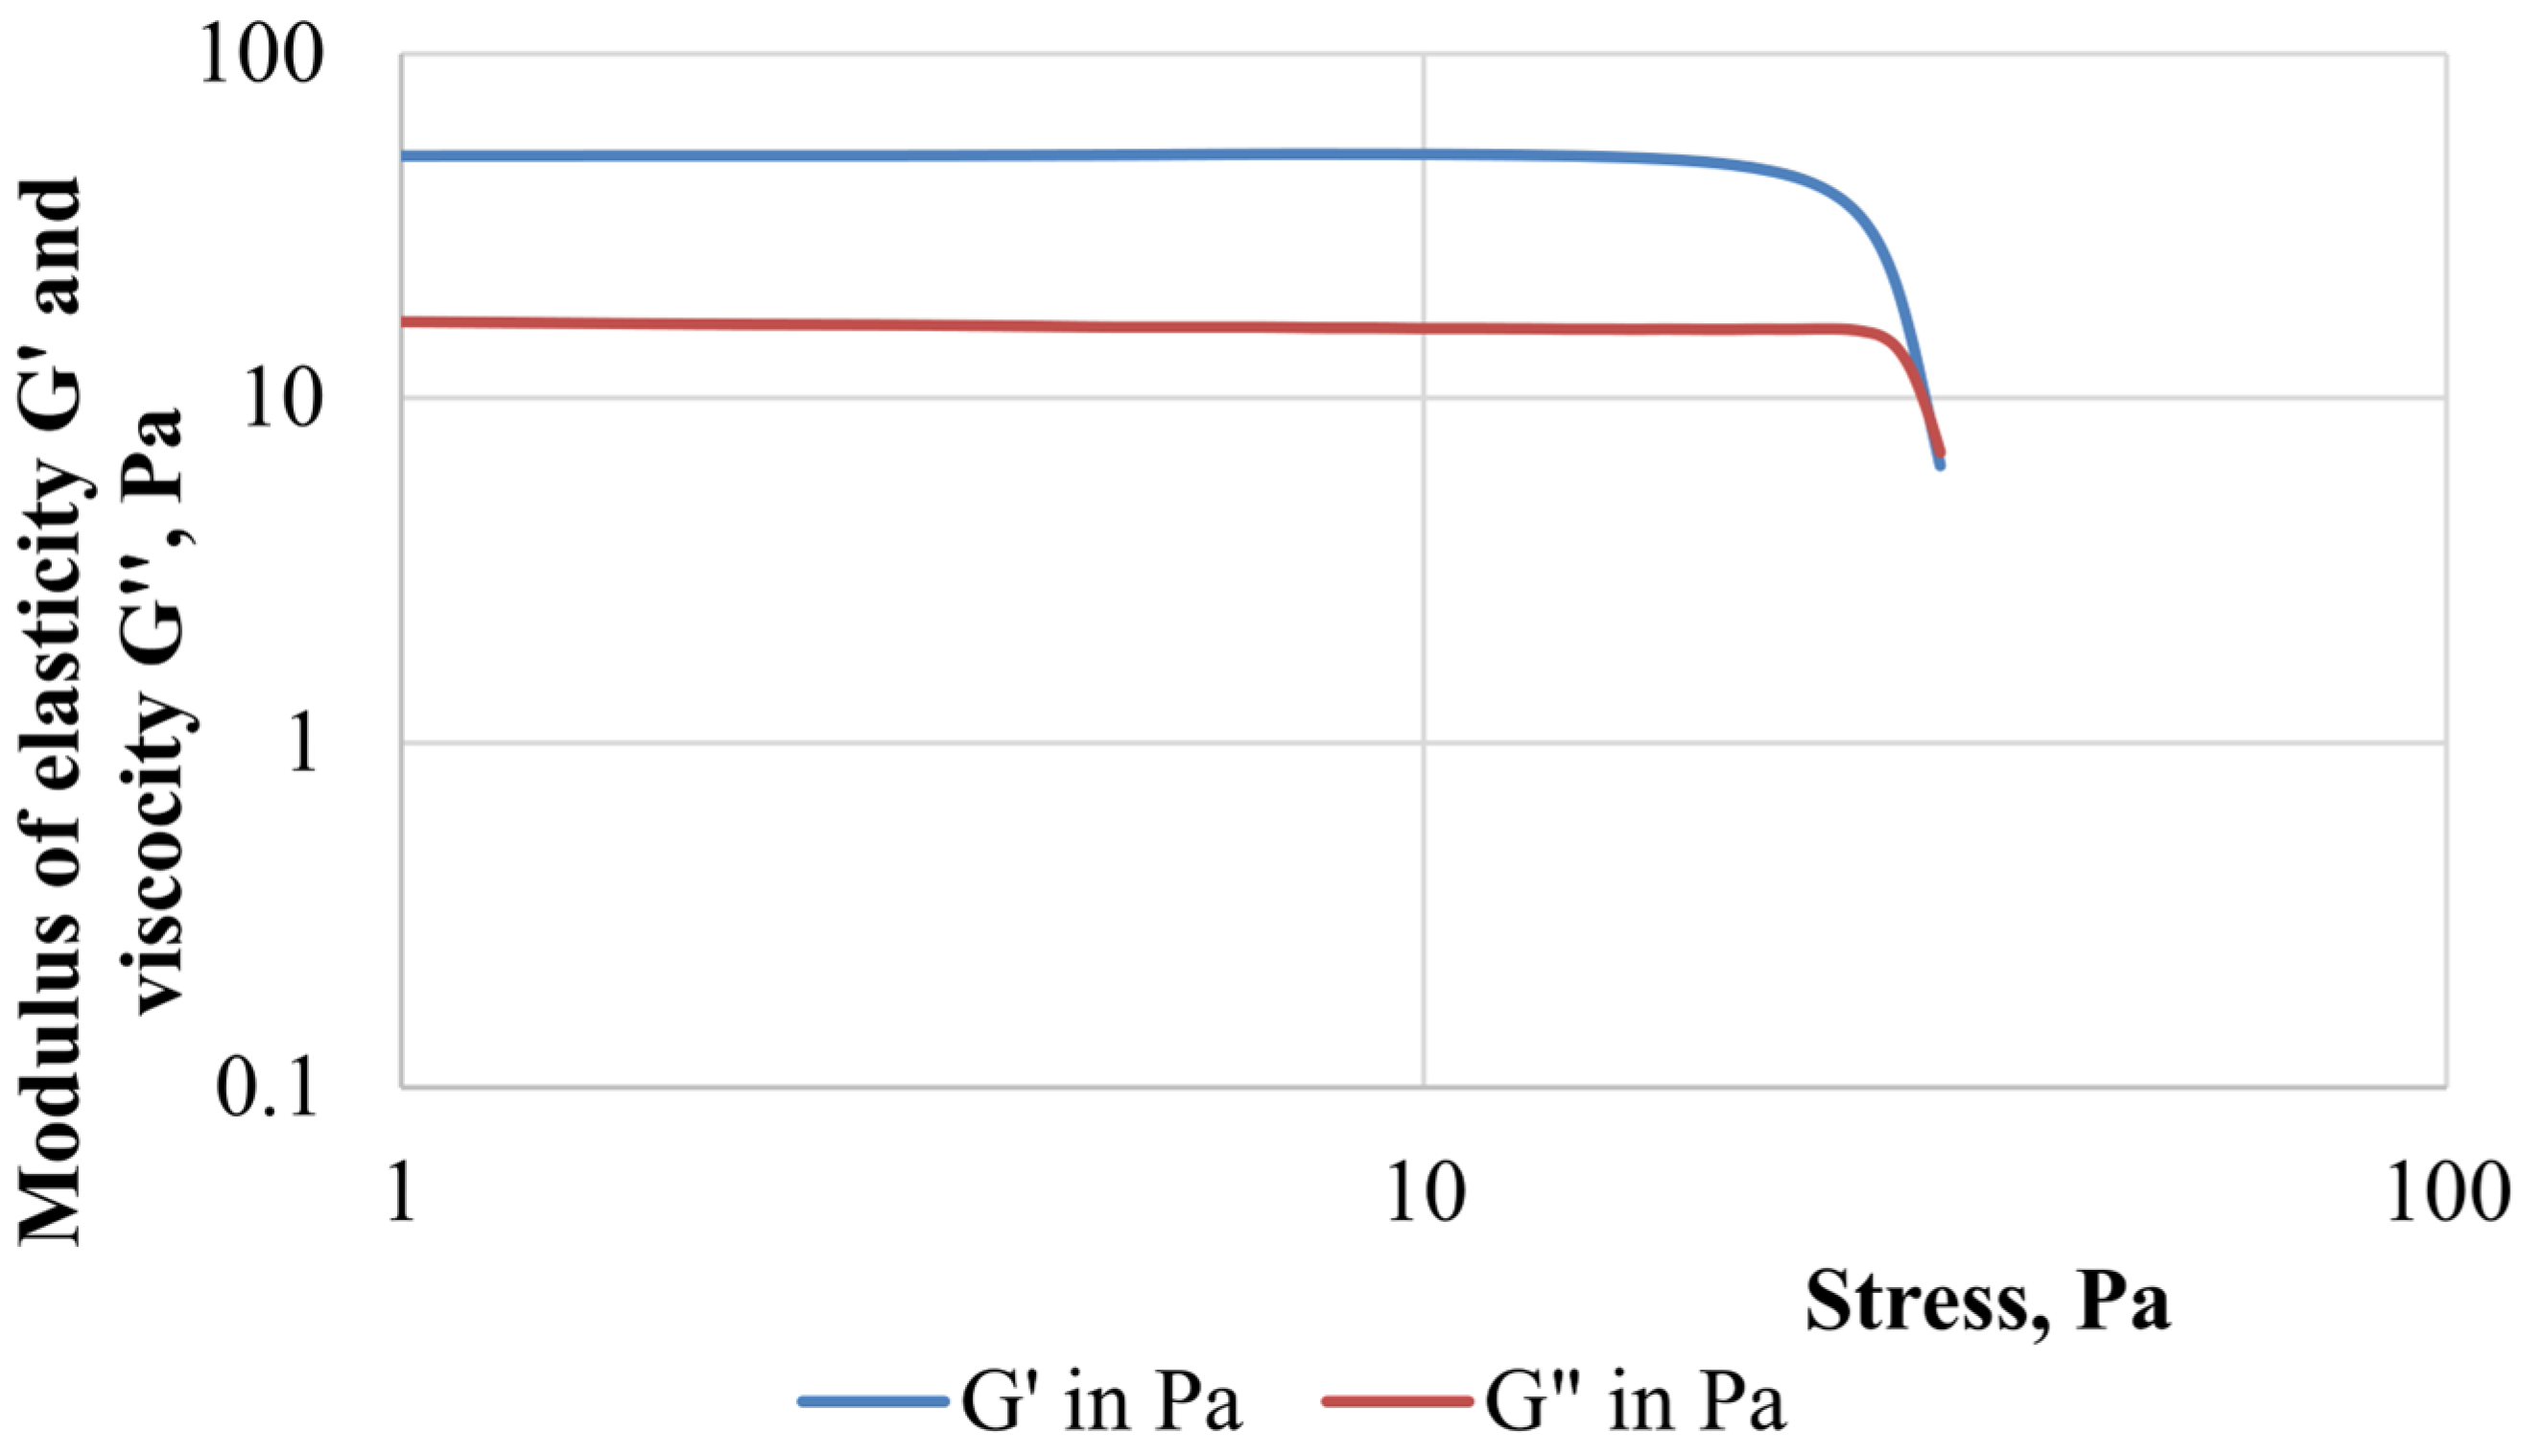
Figure 4 shows the results of the dynamic measurements of FGC samples, which provide information about rheological properties, due to the possibility of separating the elastic and viscous components.
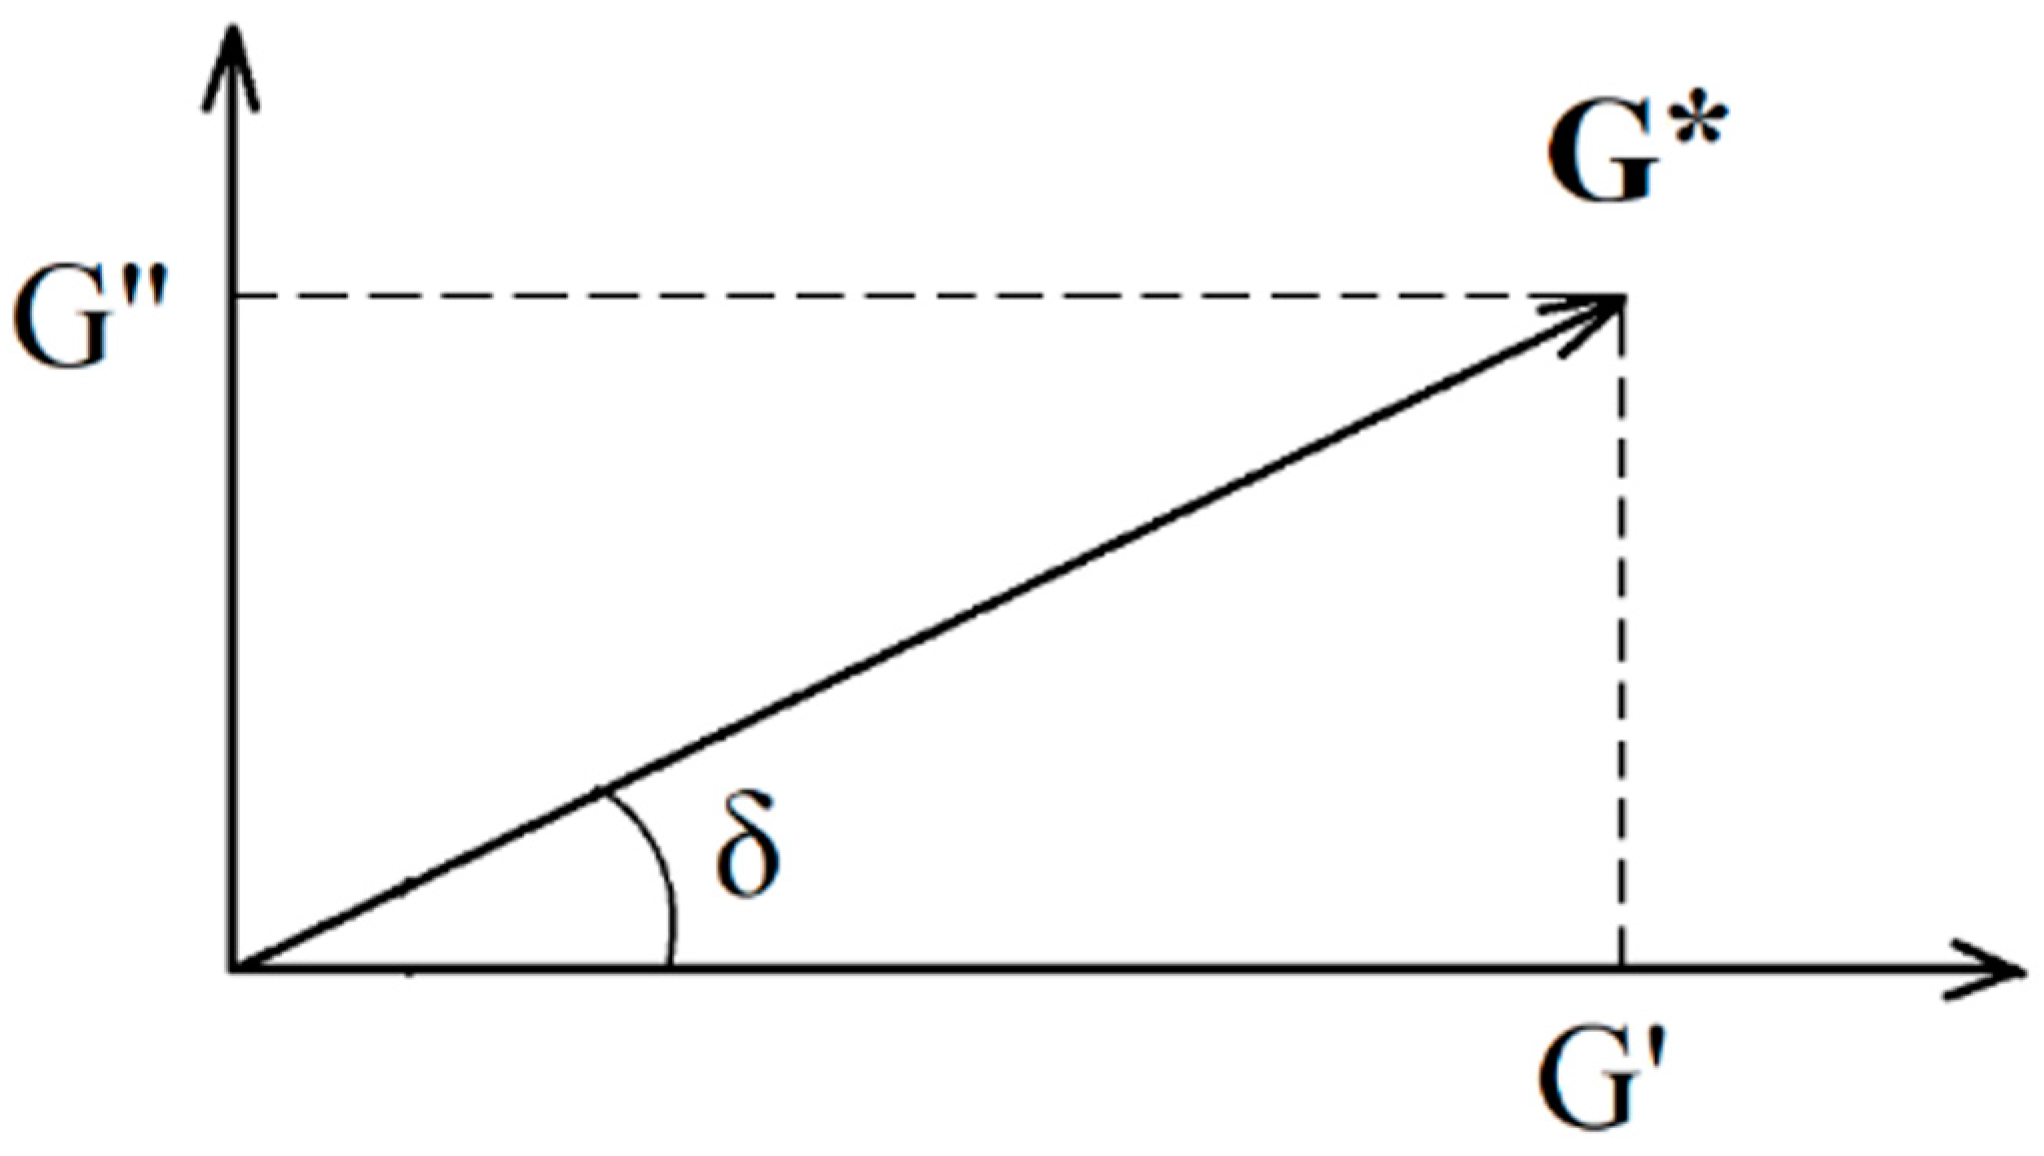
The elastic modulus (accumulation modulus) G′, Pa characterizes the accumulated strain energy in the system and reflects the characteristics of the sample as a solid (elastic component). The value of the viscous modulus (loss modulus) G″, Pa determines the energy dissipation and the behavior of the sample as a liquid (viscous component). The range of linear viscoelastic behavior (linear measurement range—LMR) is the area where both curves G′ and G″ have an area of constant values in the form of a plateau. This is the range of strain values in which the structure of the test sample does not collapse due to strain. The point of intersection of the modulus of elasticity and viscosity or the point of failure of the structure (crossover—Cr.) is the point of equality of the modulus of elasticity G′ and viscosity G″. Viscous behavior prevails over viscoelastic behavior after this point.
The studied samples of FGC—PAM A345 and PAM A523—are characterized by a small range of linear viscoelastic behavior. In both cases, no significant differences were found in determining the linear measurement range, the value of which would be more than 50 Pa. The ratio of the viscous component to the elastic component in the presence of both PAM A345 and A523 is approximately 4.5. However, the highest stress or strain value corresponding to the intersection point of the elastic and viscosity moduli (the crossover point), after which the transition of FGC to a viscous state occurs, is characteristic of a composition containing a sample of low-molecular-weight PAM. Therefore, the crossover point is 295.0 Pa in a composition containing PAM A523 and 285.7 Pa in the case of PAM A345 (
Table 1).
It should be noted that both the modulus of elasticity and the modulus of viscosity decrease when stress values exceed 30 Pa. This is likely attributed to the initiation of structural failure in foam systems, including the collapse of part of the cells in the formed foam gel. The complex modulus G*, Pa can be calculated using the value of the applied stress and the resulting strain: .
The corresponding measurements show that the values of the complex modulus G* in a composition with a low-molecular-weight PAM A523 are 1.6–1.8 times higher in the case of the stresses ranging from 50 to 250 Pa. This indicates greater stability of foam lamellae, which is manifested by the resistance of the FGC to external deforming forces through the recovery of the original shape (
Figure 5).
The viscosity measured in the oscillation experiment is called complex by analogy with the complex modulus. The complex viscosity includes an elastic component and an element similar to viscosity under steady flow conditions: η* = G*/ω.
Gas shutoff operations often employ a technological technique when the bulk of the grouting material (for example, hydrogel) is supported by a more rigid composition such as cement or curing resin [
1]. In this study, a fairly rigid hydrogel containing 1.7% PAM grade A345, 0.6% paraform and 0.2% resorcinol was chosen. This hydrogel composition has been successfully used for water-shutoff activities [
33]. A comparison of the elastic modulus of FGC and hydrogel showed that the elastic modulus of a hydrogel crosslinked with a complex organic crosslinker exceeds that of FGC: 4199 Pa for hydrogel and 3585 Pa for FGC. The dynamic definitions of the modulus of elasticity and the modulus of viscosity are provided in
Figure 6, which shows that the region of viscoelastic behavior is constant over a large range of applied stresses.
Consider that the gas shutoff properties of FGC were determined in previous studies [
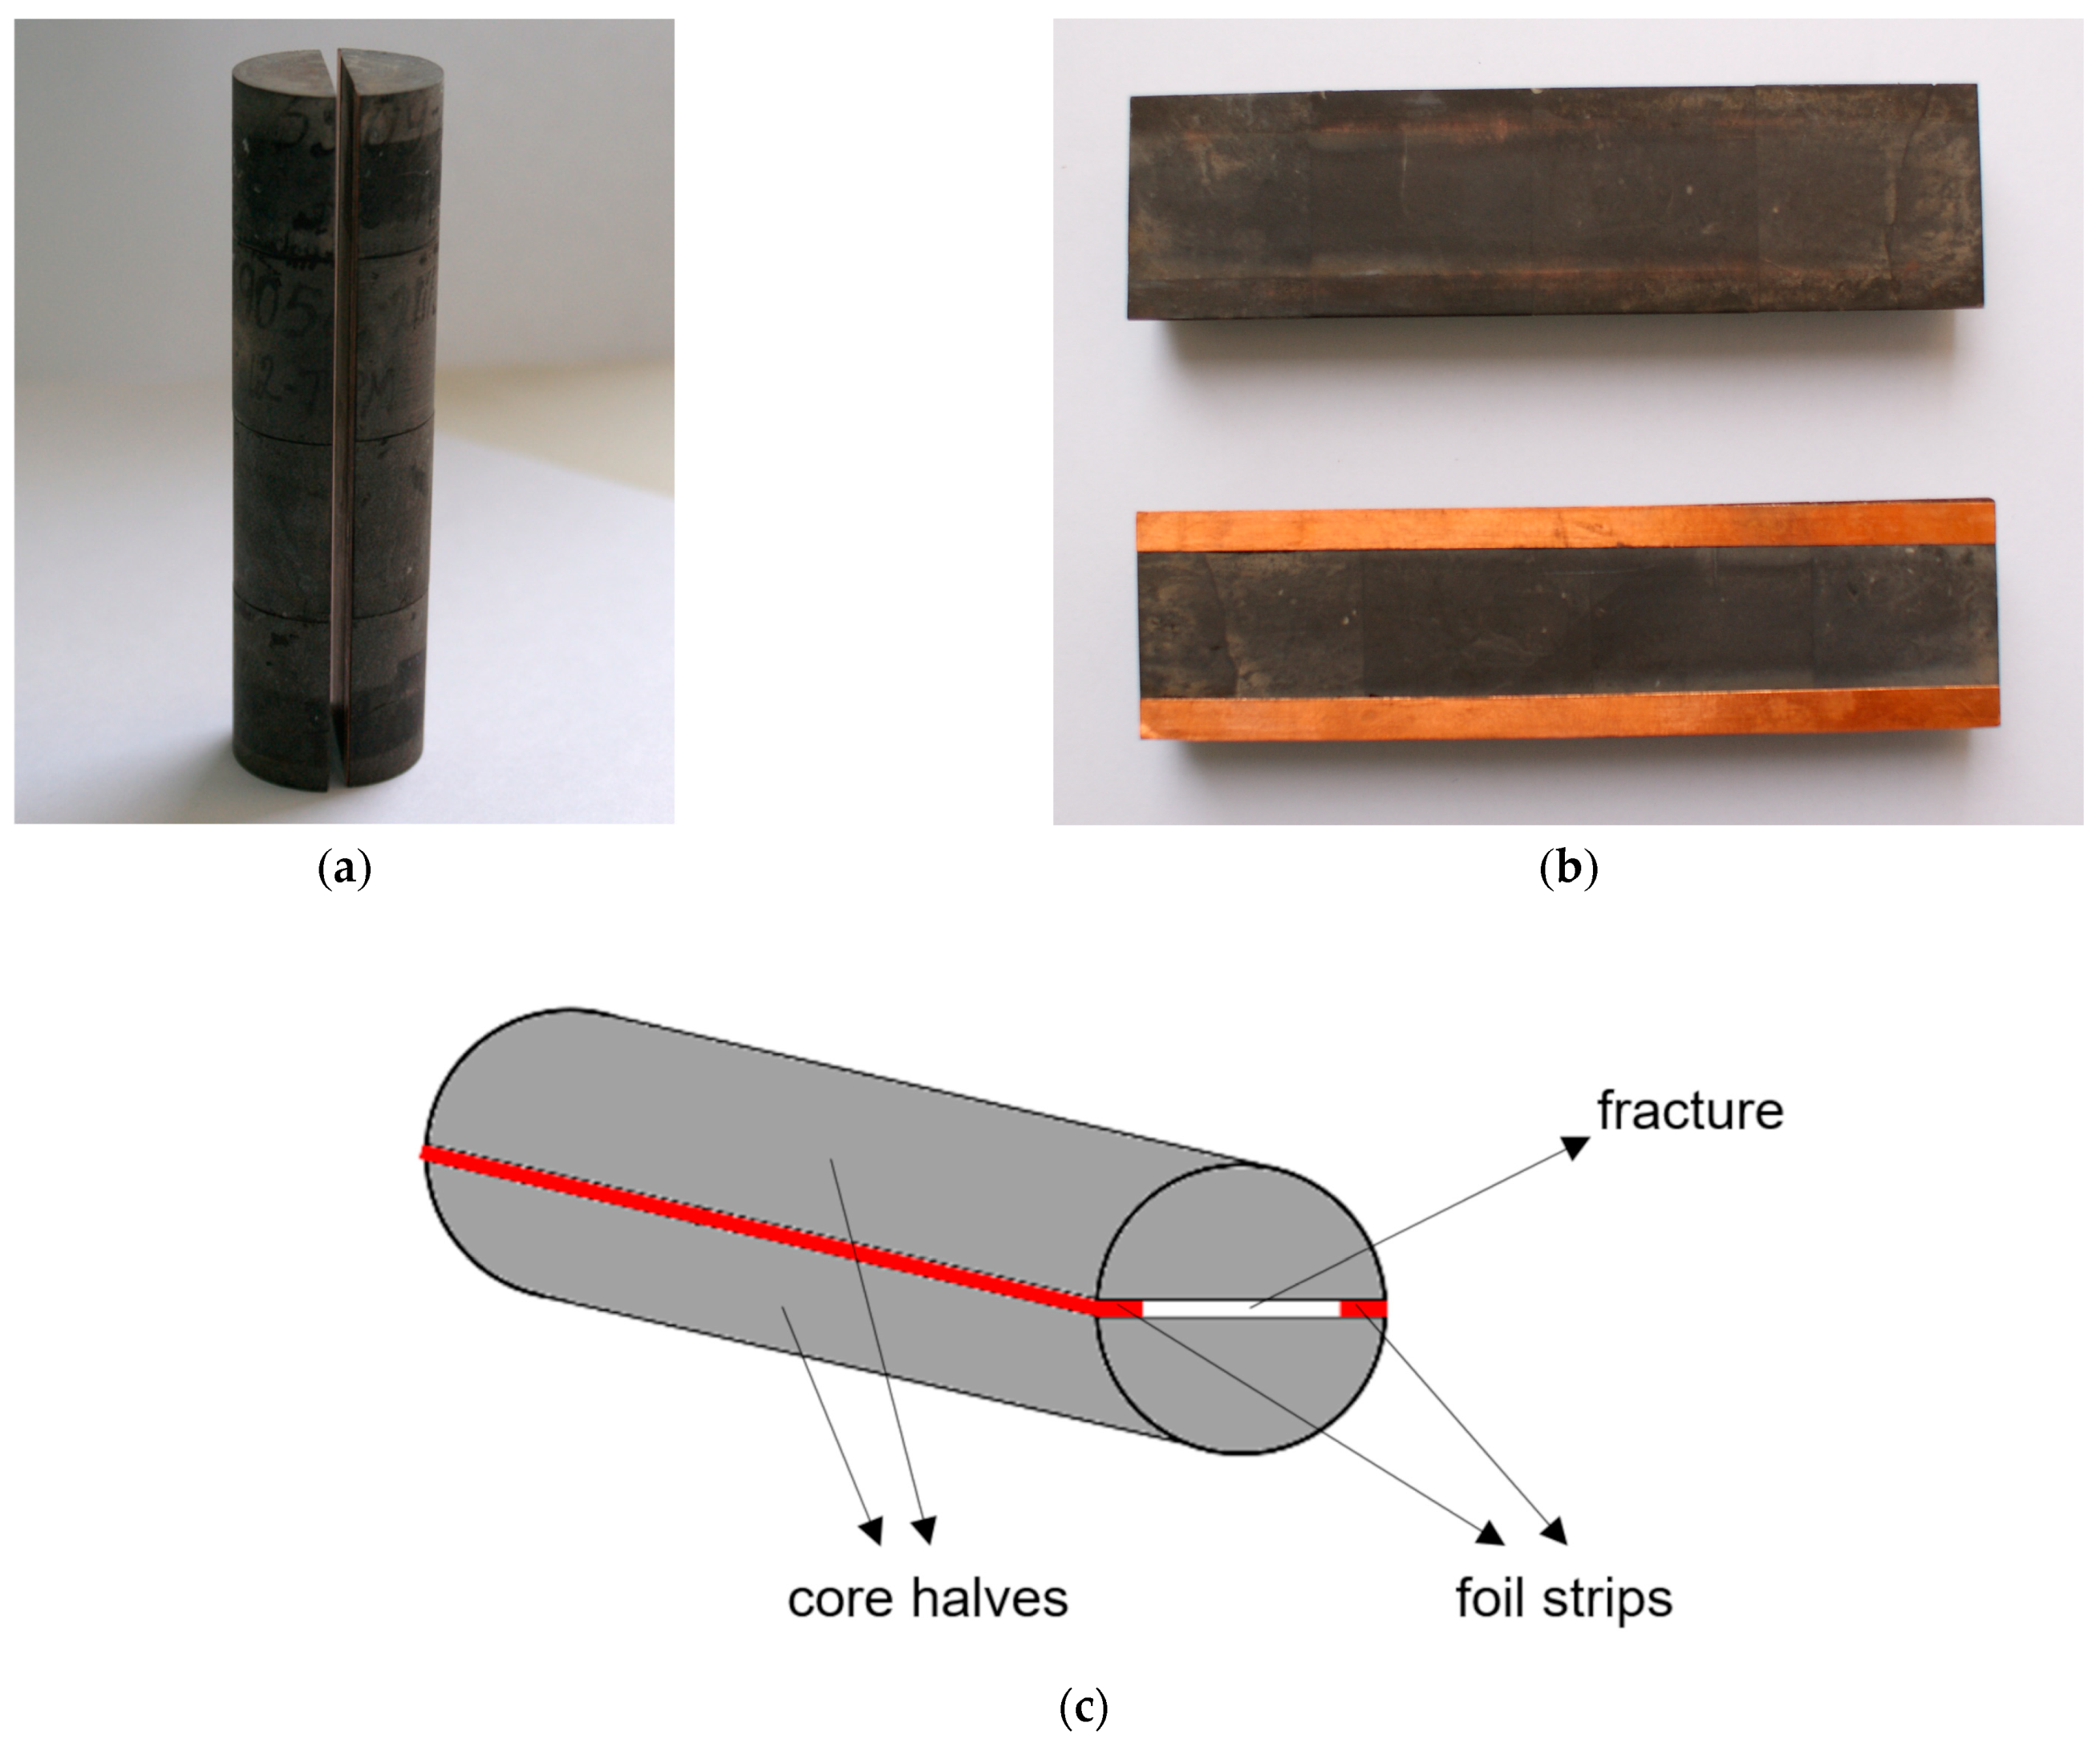
34], in which it was shown that the foam gel efficiency is many times higher than that of the foam polymer and hydrogel. Therefore, in this study, the water shutoff properties of FGC were clarified, and filtration experiments were conducted in the porous media of different natures and structures. The residual resistance factor (Frr) was chosen as the efficiency parameter; it was found that Frr has the highest value in the fracture and the lowest value in the sandstone (
Table 2). Perhaps this is due to the selectivity of the effect of gels on large pores and fractures [
2].
Consequently, self-generating FGC has water-isolating properties selective in permeability, the degree of manifestation of which depends on the size of the channels of the porous medium, which should be considered when selecting candidate wells for repair and sealing operations, as well as when determining the volume of the injected composition and the time of subsequent development of the well.
A hydrogel based on PAM, resorcinol and paraform was selected to reinforce the FGC, which has the necessary structural and mechanical properties [
35] and successfully passed field testing under various geological and physical conditions [
33].
2.2. Field Test
The work was carried out in three horizontal production wells with production casing diameters of 146, 168 and 178 mm, respectively. The wells are equipped with strainers and perforated filter liners, with a horizontal section length from 600 to 1500 m. Liner sizes for the wells under consideration are presented in
Table 3.
A distinctive feature of the use of FGC in field conditions is the addition of gas-generating components during the mixing of the composition at the wellhead with the generation of foam directly in the wellbore and in the bottomhole zone of the formation. Free nitrogen gas is released as a result of the interaction of the components of the gas-generating mixture, and the nitrogen bubbles are distributed in a viscous polymer solution. Moreover, the times of gas generation and polymer crosslinking are regulated depending on the reservoir temperature by varying the concentration of the components and acidifiers. Before injection, a qualitative determination of the properties of the FGC and hydrogel was performed.
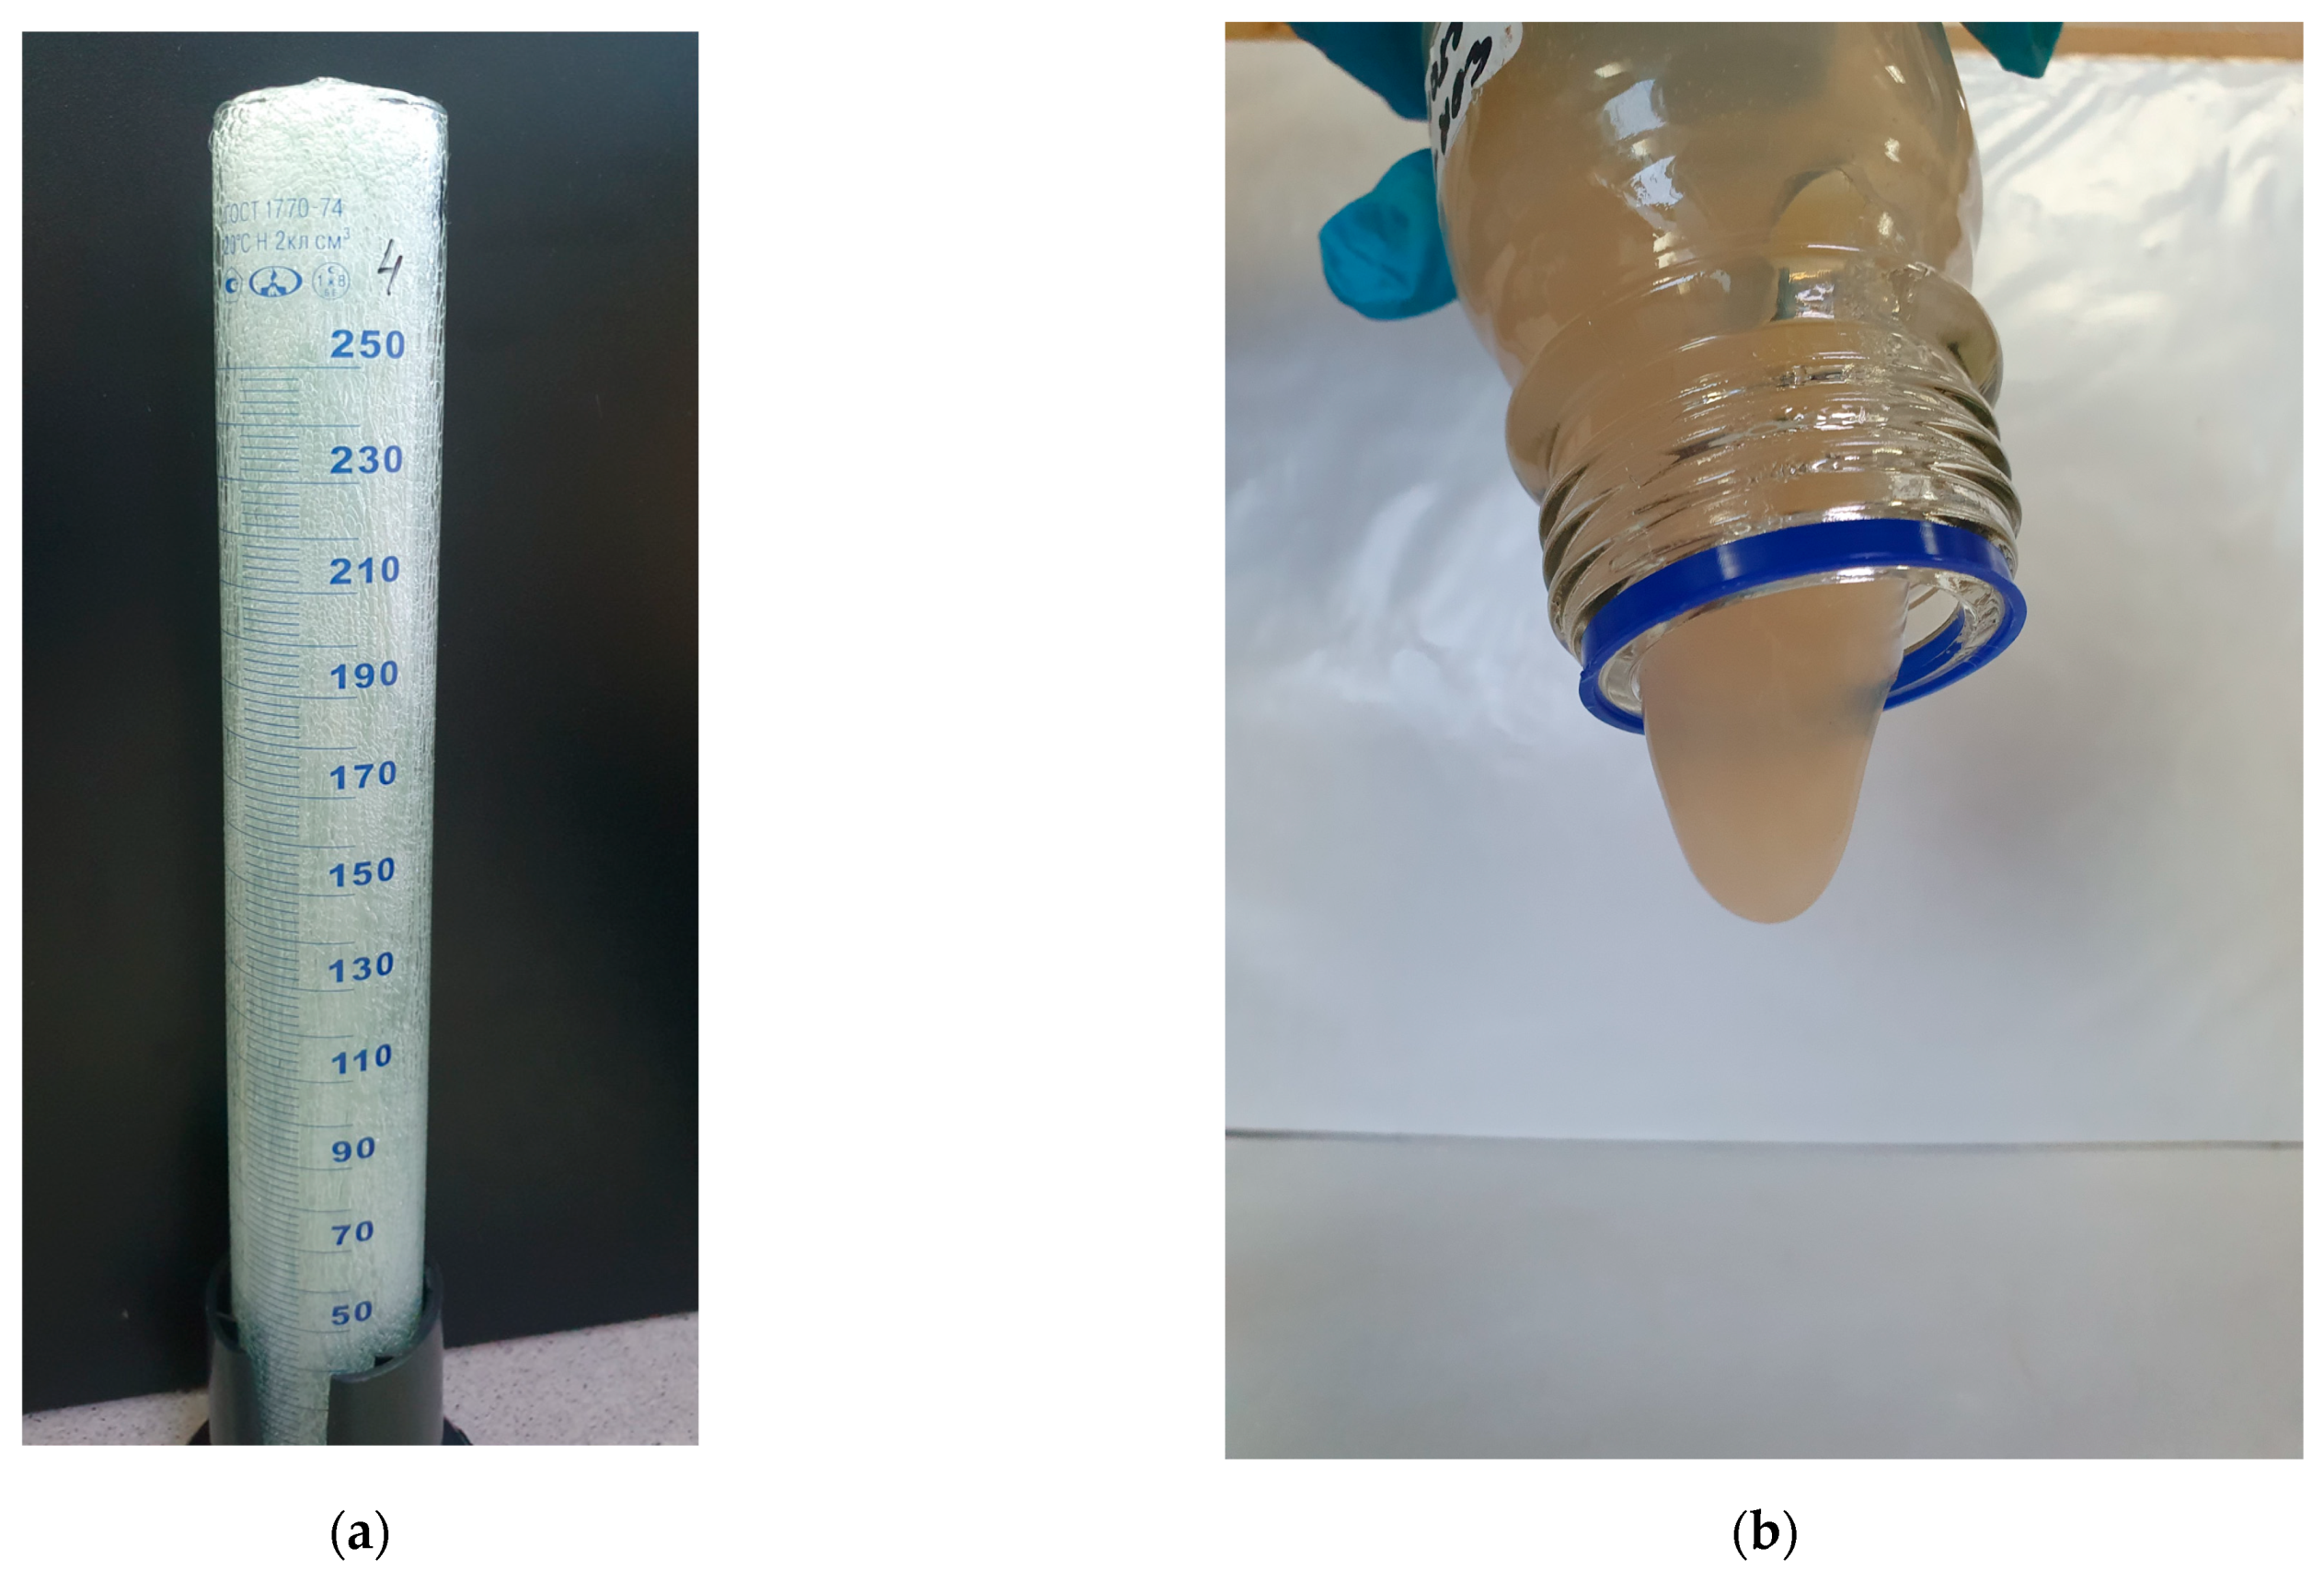
Figure 7 shows photographs taken just before injection. It can be seen that FGC (
Figure 7a) is formed in the entire volume of the measuring cylinder, and the mature hydrogel shows a tongue from the bottle (
Figure 7b).
A total of 100 m3 of FGC and 20 m3 of hydrogel with an organic crosslinker was injected in each well.
2.2.1. Well W1
Free gas appeared immediately at the beginning of the well operation. According to the data of inflow profiling on 11 July 2020, the primary gas inflow was found in the interval of 1280—1370 m (68% of the gas inflow), the second inflow in the interval of 1680–1760 m (22%) and the third inflow (about 10%) below the current total depth of 1925 m. The first two intervals are the closest to the gas–oil contact: only 5 m along the vertical.
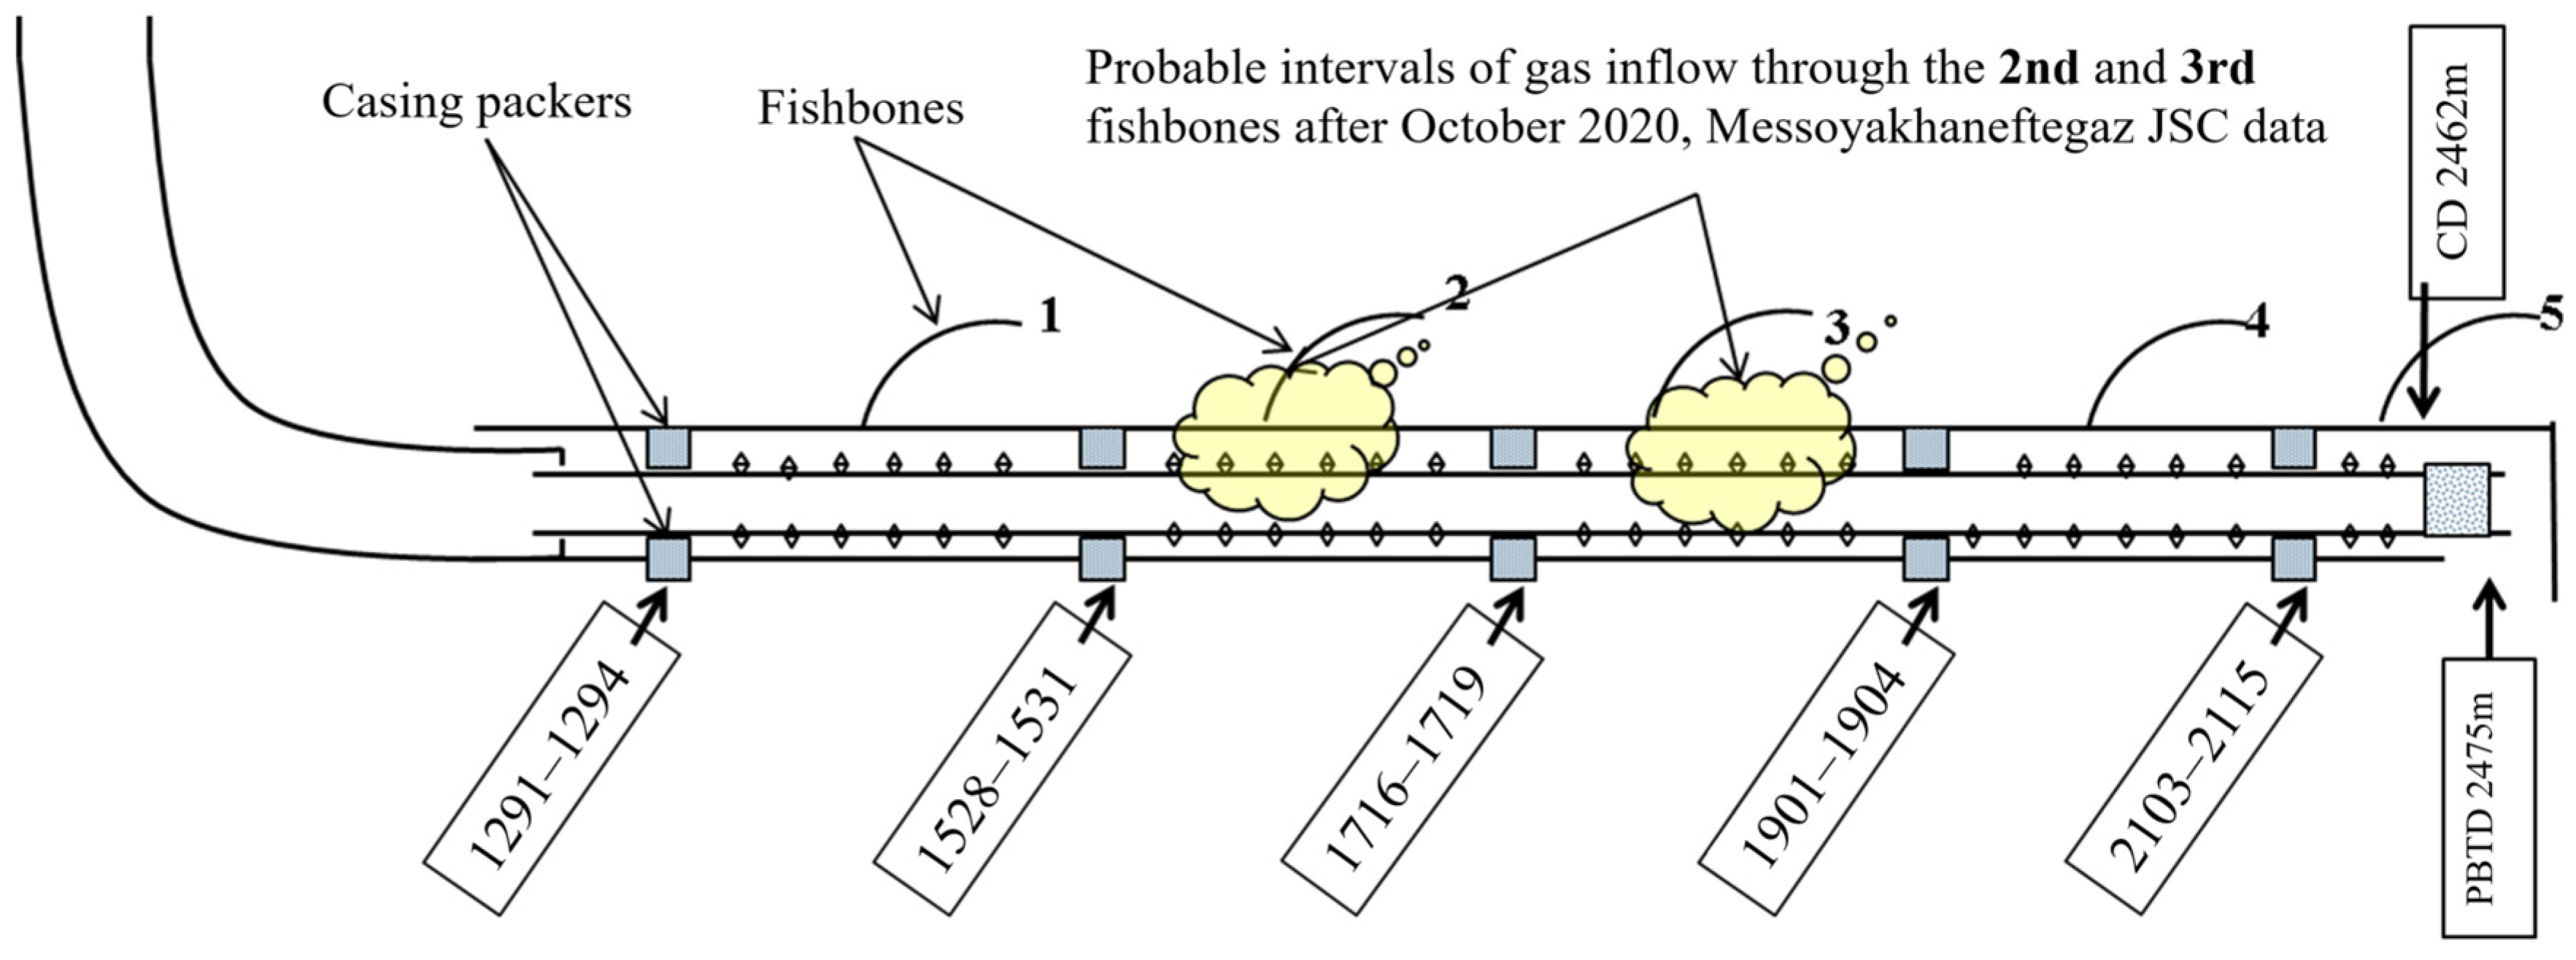
Figure 8 shows the design of the well with the sources of gas inflow. Thus, the liquid flows from the reservoir into the well through the inflow control valves, which are arranged in such a way that they are opened in underbalance conditions. The control valves are closed in overbalanced conditions to prevent the contamination of the bottomhole zone of the formation during the flushing of the well. Therefore, it was necessary to perforate special openings in the liner during the repair and sealing operation at the top of the gas inflow intervals by pumping sealing compounds.
It was decided to perform the treatment of the well in two stages with the determination of the required volume of sealing compounds to limit gas inflow (
Table 4). Each stage of treatment included, first, the injection of FGC to limit the gas inflow and then the injection of a viscoelastic hydrogel to reinforce the FGC and strengthen the created sealing screen.
Well W1 was shut-in for 24 h after each treatment stage. The well was shut-in after the second stage, and then the bottomhole was cleaned to the bridge plug at a depth of 1826 m. The bridge plug was not drilled, which reduced the length of the strainer by 119 m (by 18%). No polymer recovery was observed during the well flushing. This indicates its consolidation in the reservoir. The parameters of well operation (liquid rate Qliq, oil rate Qoil, watercut WC, bottomhole pressure Pbottom, dynamic level Hdyn, gas rate from gas cap Qg.c. and gas–oil ratio GOR) before and after gas shutoff treatment are presented in
Table 5.
Table 5 shows that the inflow of gas from the gas cap was practically stopped as a result of the treatment. That effect lasted for more than a year. Thus, the gas breakthrough from the gas cap was stopped in well W1. In addition, it was found that the created gel screen can withstand extremely low bottomhole pressures (27 atm) for an extended period.
It is known that the inevitable clogging of the productive reservoir occurs during repair and sealing operations, along with the remediation of water and gas entries, which often results in a reduction in the oil flow rate. Therefore, it was proposed to perform hydrochloric acid treatment to recover the liquid flow rate to the pre-treatment-level values, followed by the drilling of the bridge plug at 1826 m to increase the drainage area. However, this treatment was not implemented because of the fear of a new gas breakthrough.
2.2.2. Well W2
Free gas was found in well W2 fluid immediately after drilling. The well was shut-in on 9 August 2021 for inflow stimulation with hydrochloric acid. At the same time, the rate of gas inflow from the gas cap (Qg.c.) was approximately 20,000 m
3/day. A rapid gas breakthrough occurred at the rate of 151,963 m
3/day on 17 August 2021, during the well stabilization after inflow stimulation. A total of 20 m
3 of hydrochloric acid (HCL) was injected during inflow stimulation between the swellable packers in the interval of 1700–2000 m (
Figure 9) and, probably, the acid also entered into fishbones 2, 3 and 4.
Gas shutoff treatment was performed on 2 September 2021 in the interval of 1530 m (retainer packer)—1906 m (bridge plug) for the isolation of the gas inflow by the injection of 20 m3 of a PAM-based viscoelastic composition with a chrome cross-linker, followed by cementing with a volume of 7 m3. As a result, the cementing of the hole in the section of the second and third fishbones failed (the gas inflow from the gas cap was not completely isolated, and the isolation effect lasted only about one month). Well W2 had the following operating parameters at the date of the shutdown for well workover: Qliq—12.7 m3/day, Qoil—9.7 t/day, watercut—19.7%, Qg.c.—43,947 m3/day, dynamic level (Hdyn)—461 m, bottomhole pressure (Pbottom)—53 atm.
It was decided to inject sealing compounds using a foam gel composition reinforced with hydrogel in two stages (
Table 6).
The technology of the mixing and injection of chemicals was similar to the operations carried out in well W1. The well was ramped up quickly and without complications.
Well W2 was commissioned on 16 September 2022 with the following parameters: Qliq—10 m
3/day, Qoil—8.5 t/day, watercut—10.3%, Qg.c.—0 m
3/day, Hdyn—376 m, Pbottom—46.93 atm.
Table 7 shows that the gas inflow from the gas cap was completely stopped as a result of the field trial for 6 months until 25 March 2023, when the Qg.c. amounted to about 814 m
3/day.
The operating parameters of well W2 as of 1 September 2023: Qliq—13 m3/day, Qoil—10.3 t/day, watercut—12%, Qg.c.—6329 m3/day, Hdyn—633 m, Pbottom—42.7 atm.
Thus, the gas breakthrough from the gas cap was isolated as a result of the activities in well W2. At the same time, the flow rates of oil and liquid did not change and the watercut somehow decreased, which indicates the selectivity of the effect of sealing compounds. As a result, it was found that the created screen can withstand extremely low bottomhole pressures (42.4 atm) for a long time.
2.2.3. Well W3
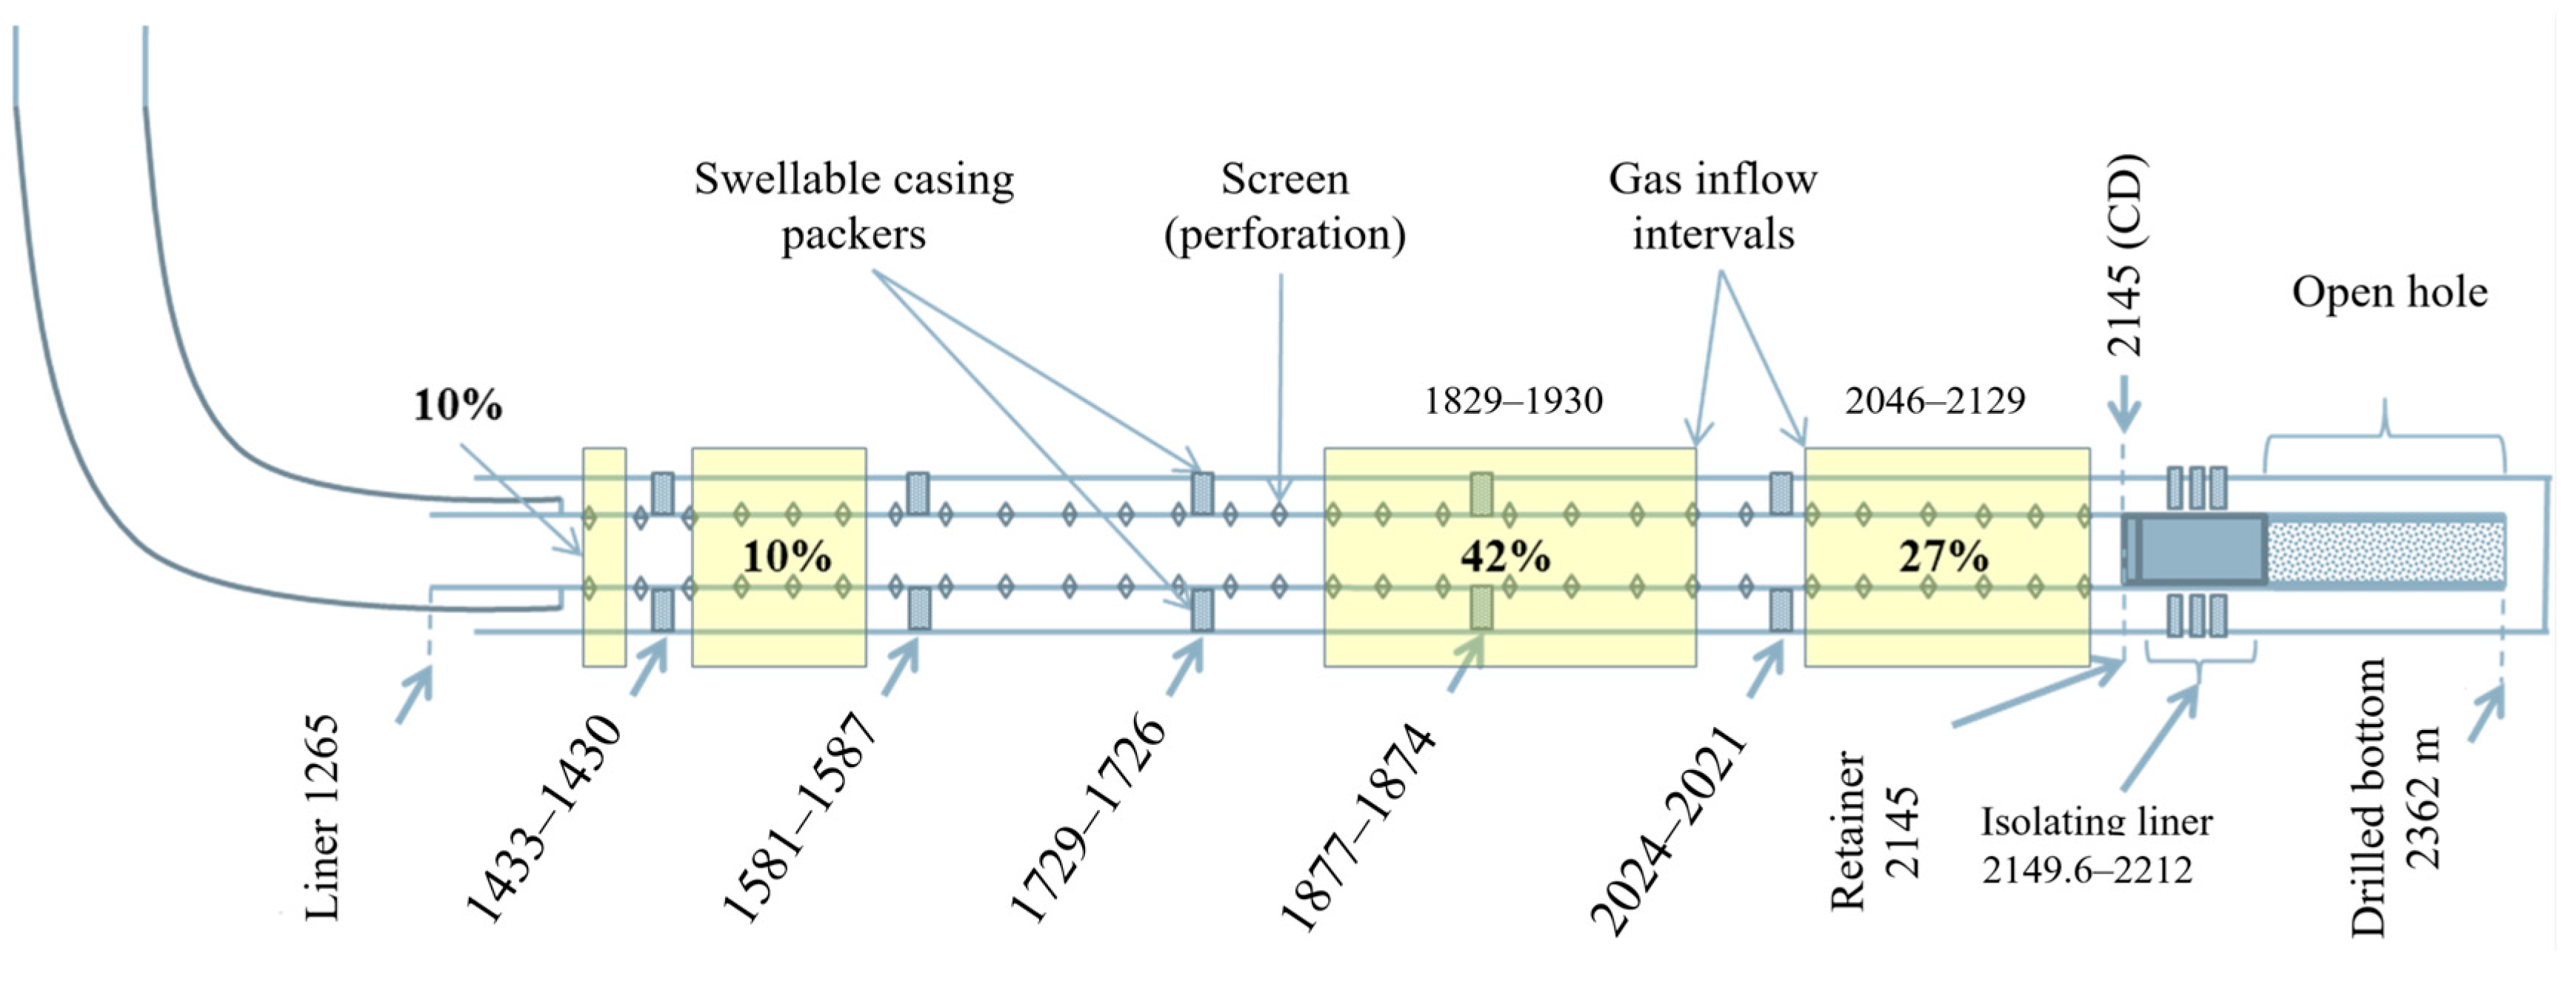
The presence of an isolating blind liner in the interval 2149.6–2212.0 m is a specific feature of well W3 that distinguishes it from wells considered previously. Well W3’s design is shown in
Figure 10.
An intensive gas breakthrough was observed starting from 14 June 2021, after well W3 was released from drilling: within a day, gas flow increased from 40,000 to 100,000 m3/day. The service contractor in October 2021 carried out repair and sealing operations to limit the gas inflow by shutting off the isolating liner in the interval of 2145–2221 m. The well was treated with a 30 m³ compound consisting of a PAM-based gel (PAM concentration—1.67%) and a chrome crosslinker after the packer retainer had been set at the depth of 2145 m. The gel treatment was followed by the injection of 4 m³ of cement. The reduction in gas flow rate (Qg.c.) lasted for a week, until 1 November 2021. After 5 November 2021, Qg.c. increased from 3000 to 26,000 m³/day, followed by a constant growth in Qg.c.
In order to plan the gas shutoff operations in the well, the inflow profile in the horizontal section of the wellbore was logged on 17–21 July 2023. An intensive inflow of gas from the PK1-3 formation in the interval of 1839–1935 m was observed in the dynamic mode according to the temperature logging data (according to the results of thermohydrodynamic modeling), and the share of gas inflow was 42% of the total inflow. A less intensive gas inflow, accounting for 27% of the total, was observed in the interval of 2046–2129 m. The gas inflow in the heel section of the well accounted for 20% of the total and corresponded to the intervals of 1310–1420 m and 1479–1573 m (
Figure 10). The producing intervals of the reservoir were determined based on spectral noise measurement data.
To achieve reliable isolation of the gas inflow into the well, it was necessary to carry out repair and sealing operations to limit the gas inflow in the inter-packer (behind casing) intervals, which corresponded to 1729–1874, 1877–2021, 2024–2145, 1302–1430 and 1433–1578 m. However, there was a risk of reducing the oil flow rate due to the productive reservoir potentially clogging. According to the well logging results, the main gas inflow occurred at the interval of 1840–1850 m. As for other intervals, gas produced through them just accumulated in the wellbore. Consequently, the engineers at Messoyakhaneftegaz JSC decided not to isolate the intervals of 2024–2145 m (toe part) and 1302–1430 m, 1433–1578 m (heel part). In order to minimize the risk of oil production loss, the repair and sealing operations were carried out specifically to limit the maximum gas inflow (42%), corresponding to the inter-packer interval of 1729–1874 m. However, after isolating that interval only, there remained a risk of gas breakthrough from the gas cap through other untreated intervals identified by logging. The parameters of the well before the workover were as follows: Qliq—8.7 m
3/day, Qoil—8.0 t/day, watercut—2.6%, Qg.c.—56393 m
3/day, GOR—7045 m
3/t, well liquid level—628 m, bottomhole pressure Pbottom—36.9 atm. The chemical treatment, similar to the treatments previously conducted on wells W1 and W2, was carried out in a single stage. The design of this operation is detailed in
Table 8.
Well W3 was commissioned on 22 August 2023 with the following parameters: Qliq—15 m3/day, Qoil—12 t/day, watercut—15.3%, Qg.c.—3901 m3/day, Hdyn—676 m, Pbottom—37.5 atm.
Table 9 shows that as a result of gas shutoff, the flow rates of liquid and oil increased from 8.7 and 8.0 t/day to 12.6 and 10.1 t/day, respectively, while the watercut slightly increased: from 2.6 to 15%. The inflow of gas from the gas cap significantly decreased, but it began to rapidly grow after 2 September 2023 and amounted to 53,716 m
3/day on 21 September 2023, i.e., it actually reached the gas flow rate value before the workover.
It seems that either the gas quickly bypassed the created gel screen and reached the neighboring intervals where gas inflow was also partially observed (according to the logging data) or it possibly broke through a leaky casing packer. These assumptions are also supported by that fact the breakthrough interval was close to the casing packer, i.e., the bypass distance was small.
