
Fluorescent Labeling of Peroxisome and Nuclear in Colletotrichum aenigma

 and
and 
Abstract
1. Introduction
2. Materials and Methods
2.1. Test Strains and Culture Conditions
2.2. Plasmids and AtMT
2.3. Fluorescence Stability and PCR Detection of Transformants
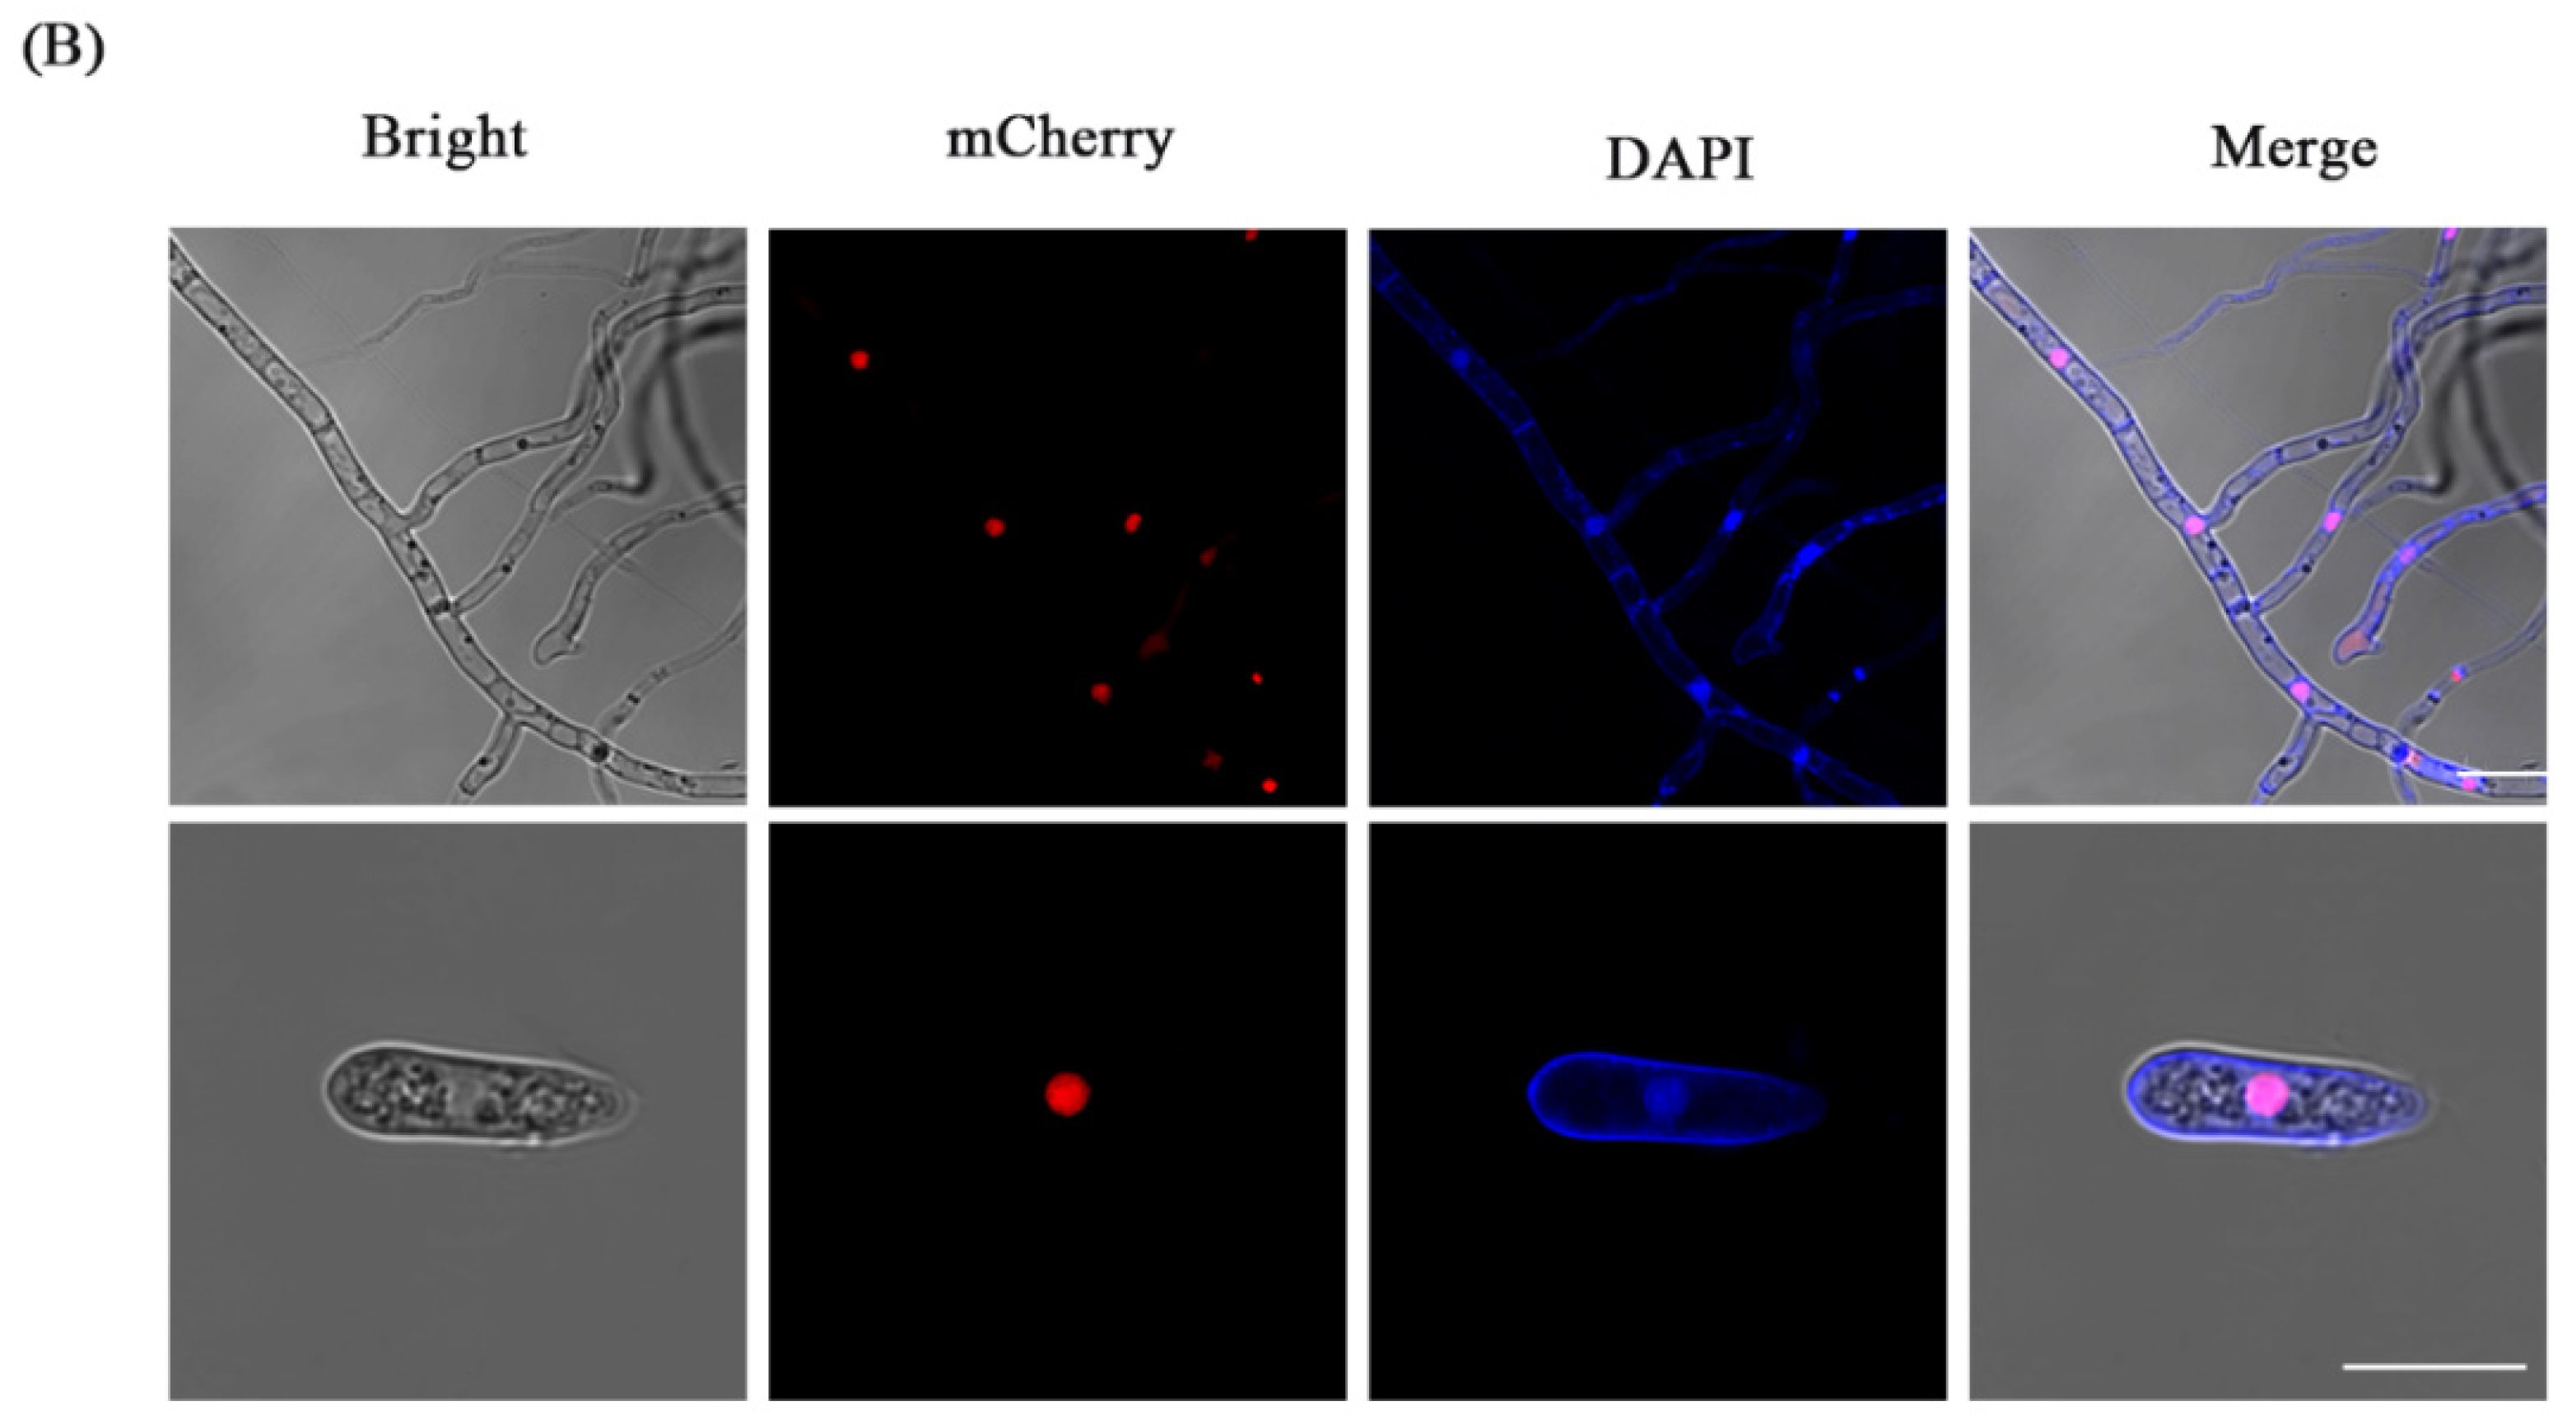
2.4. Laser Confocal Observation and Co-Localization with Fluorescent Dyes
2.5. Comparison of Phenotype and Spore Production of Transformants
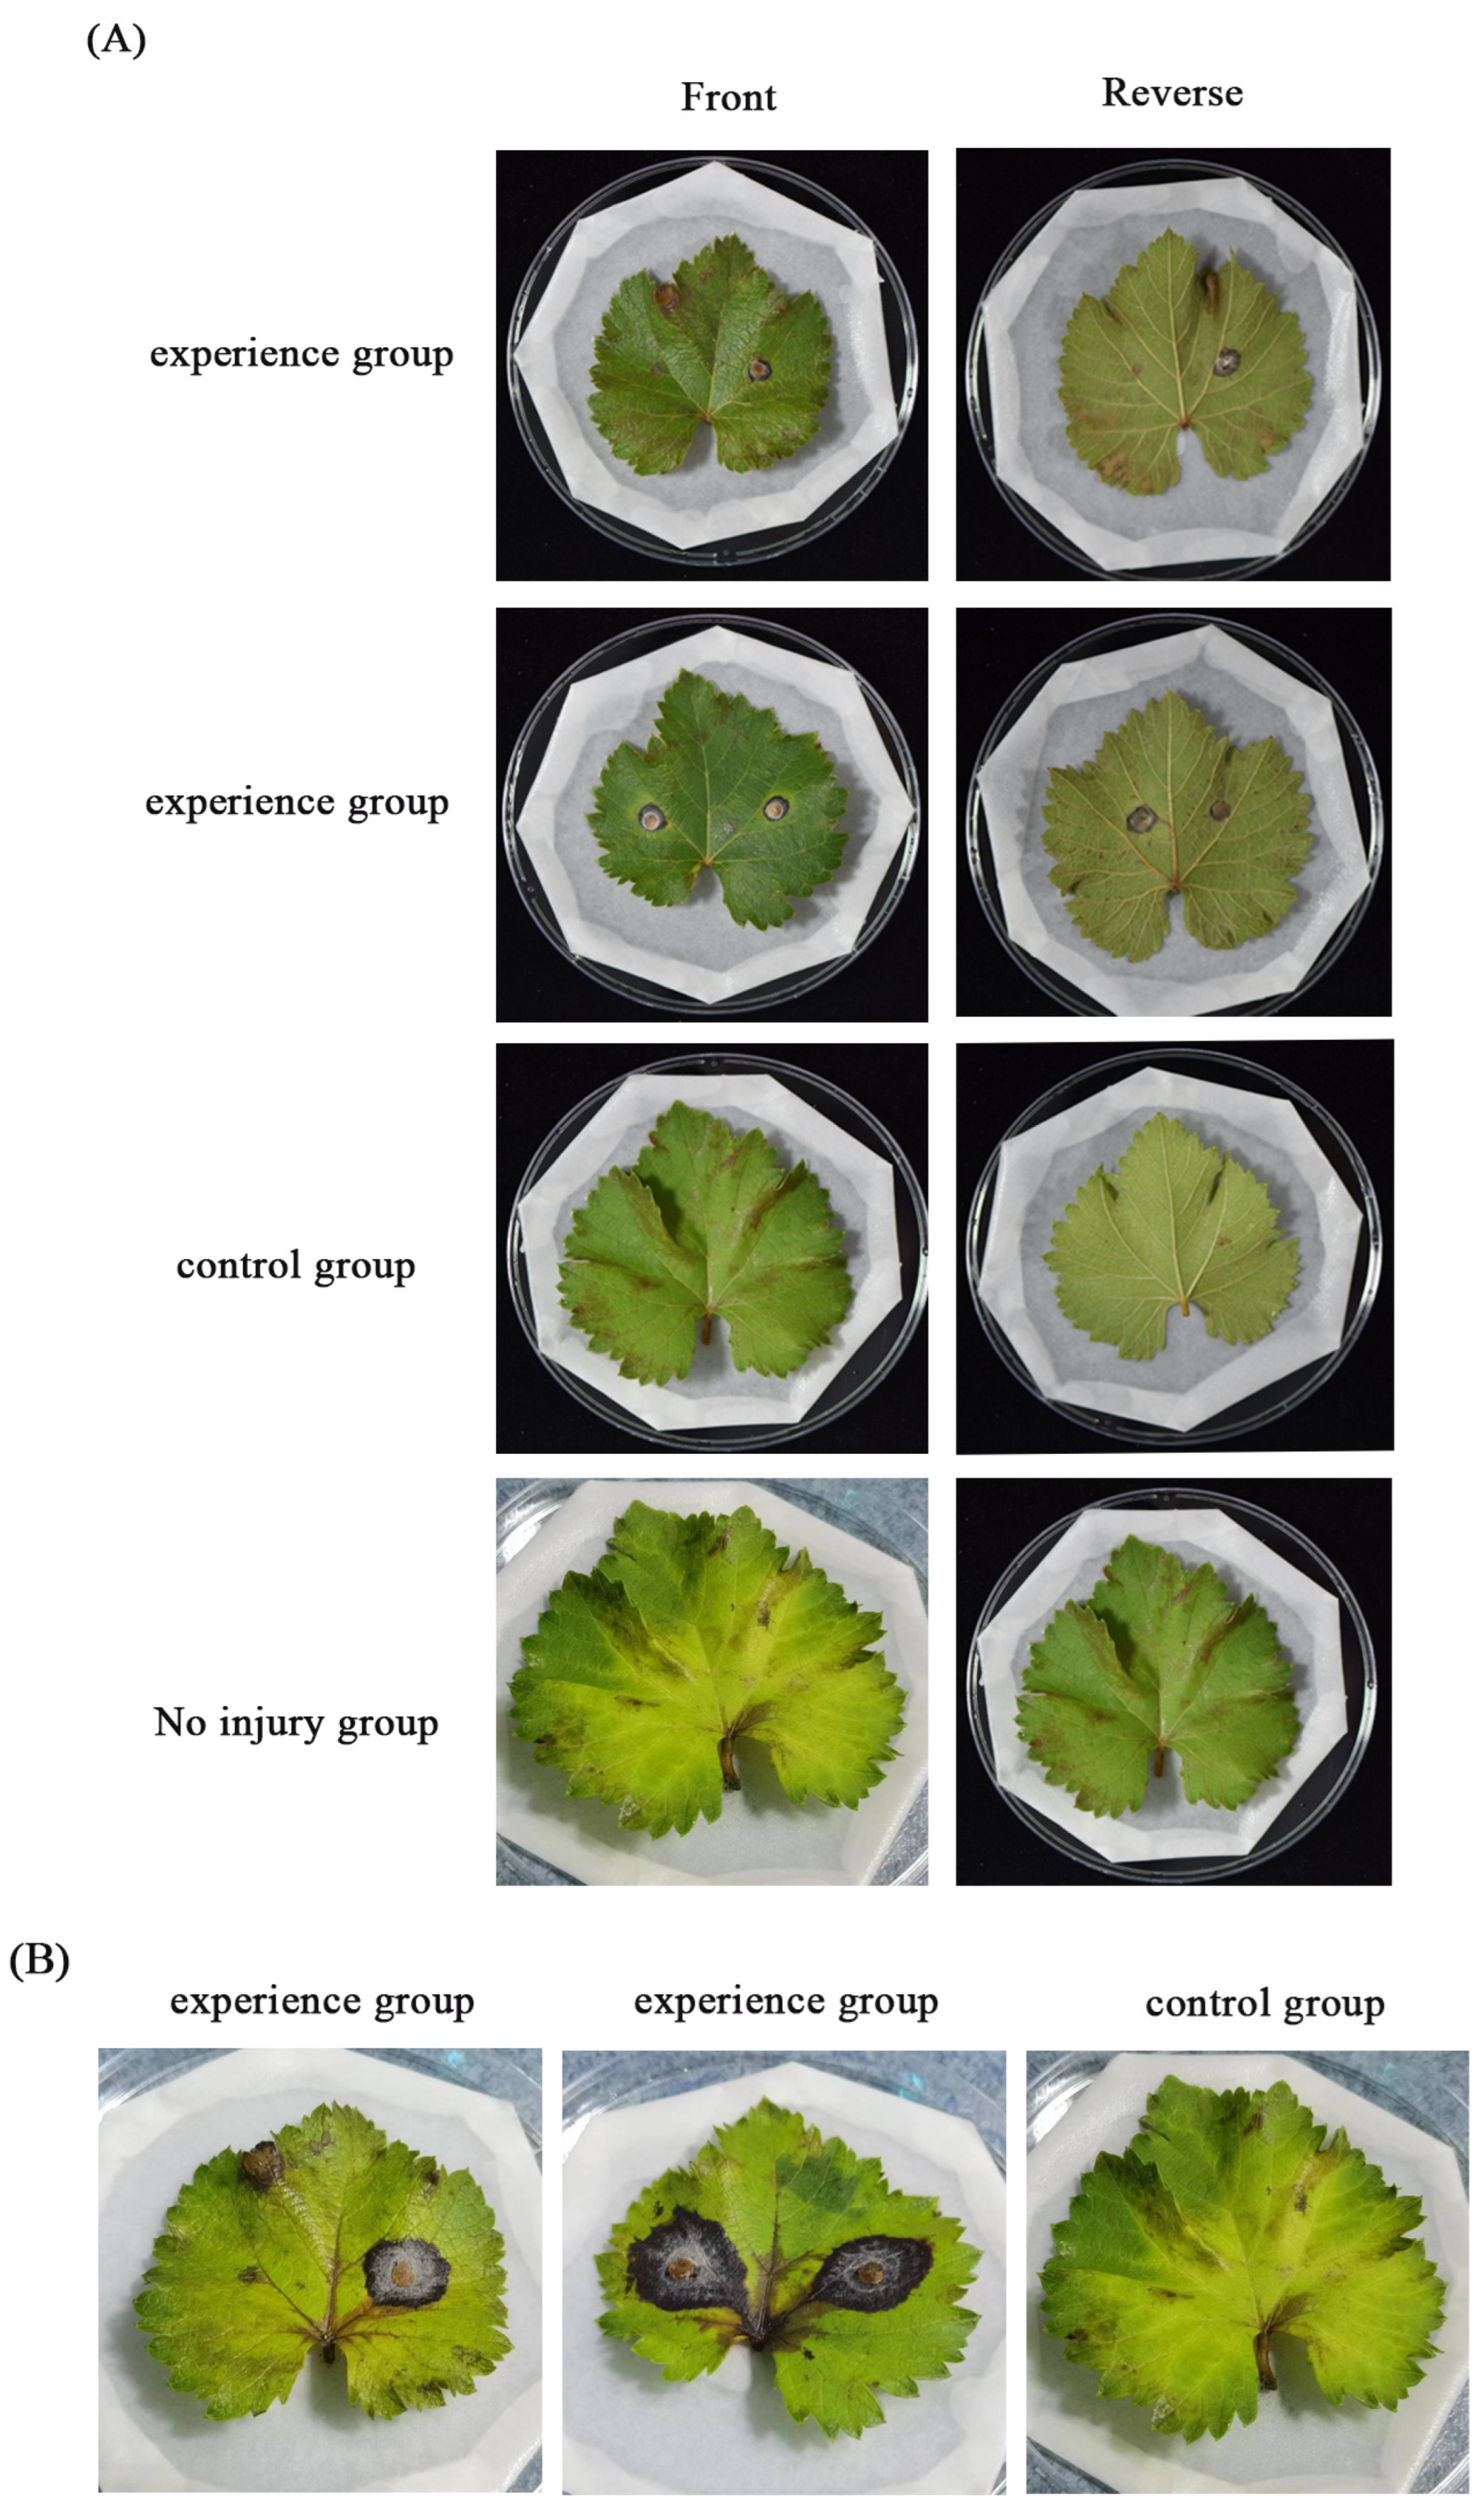
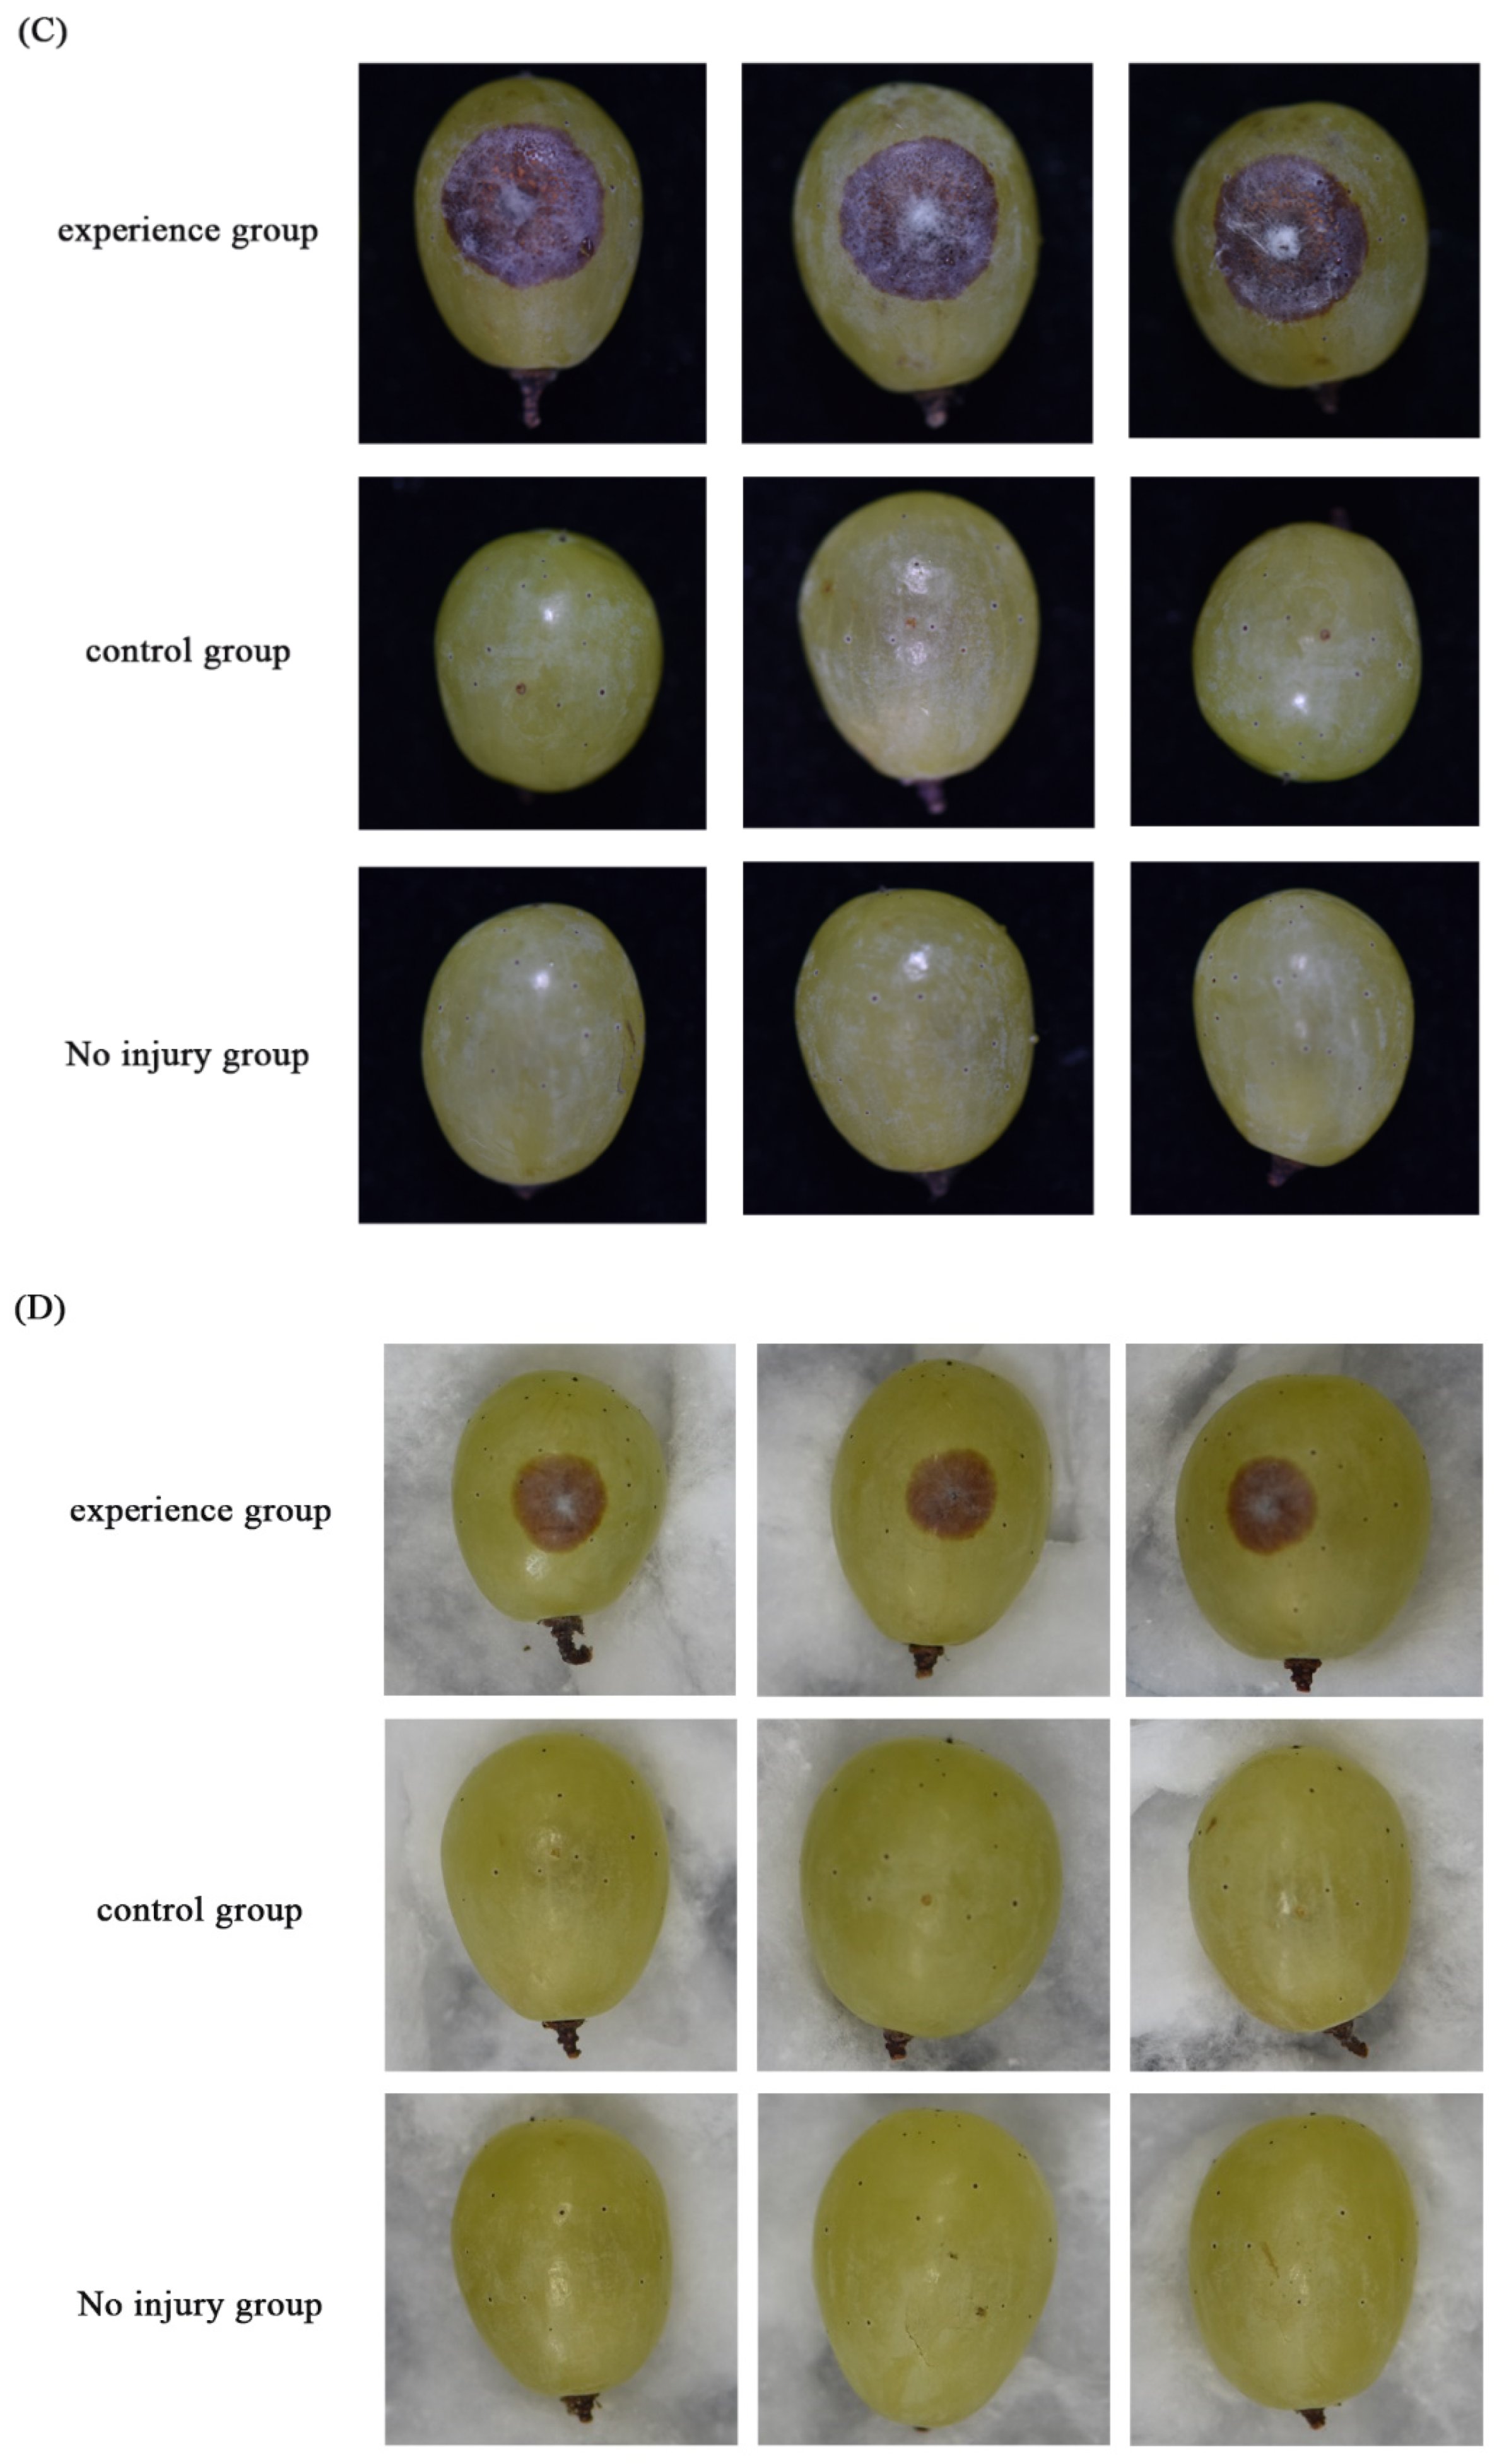
2.6. Pathogenicity Test
3. Results
3.1. Screening and Genetic Stability of Transformants
3.2. Growth, Sporulation, and Pathogenicity of Transformants
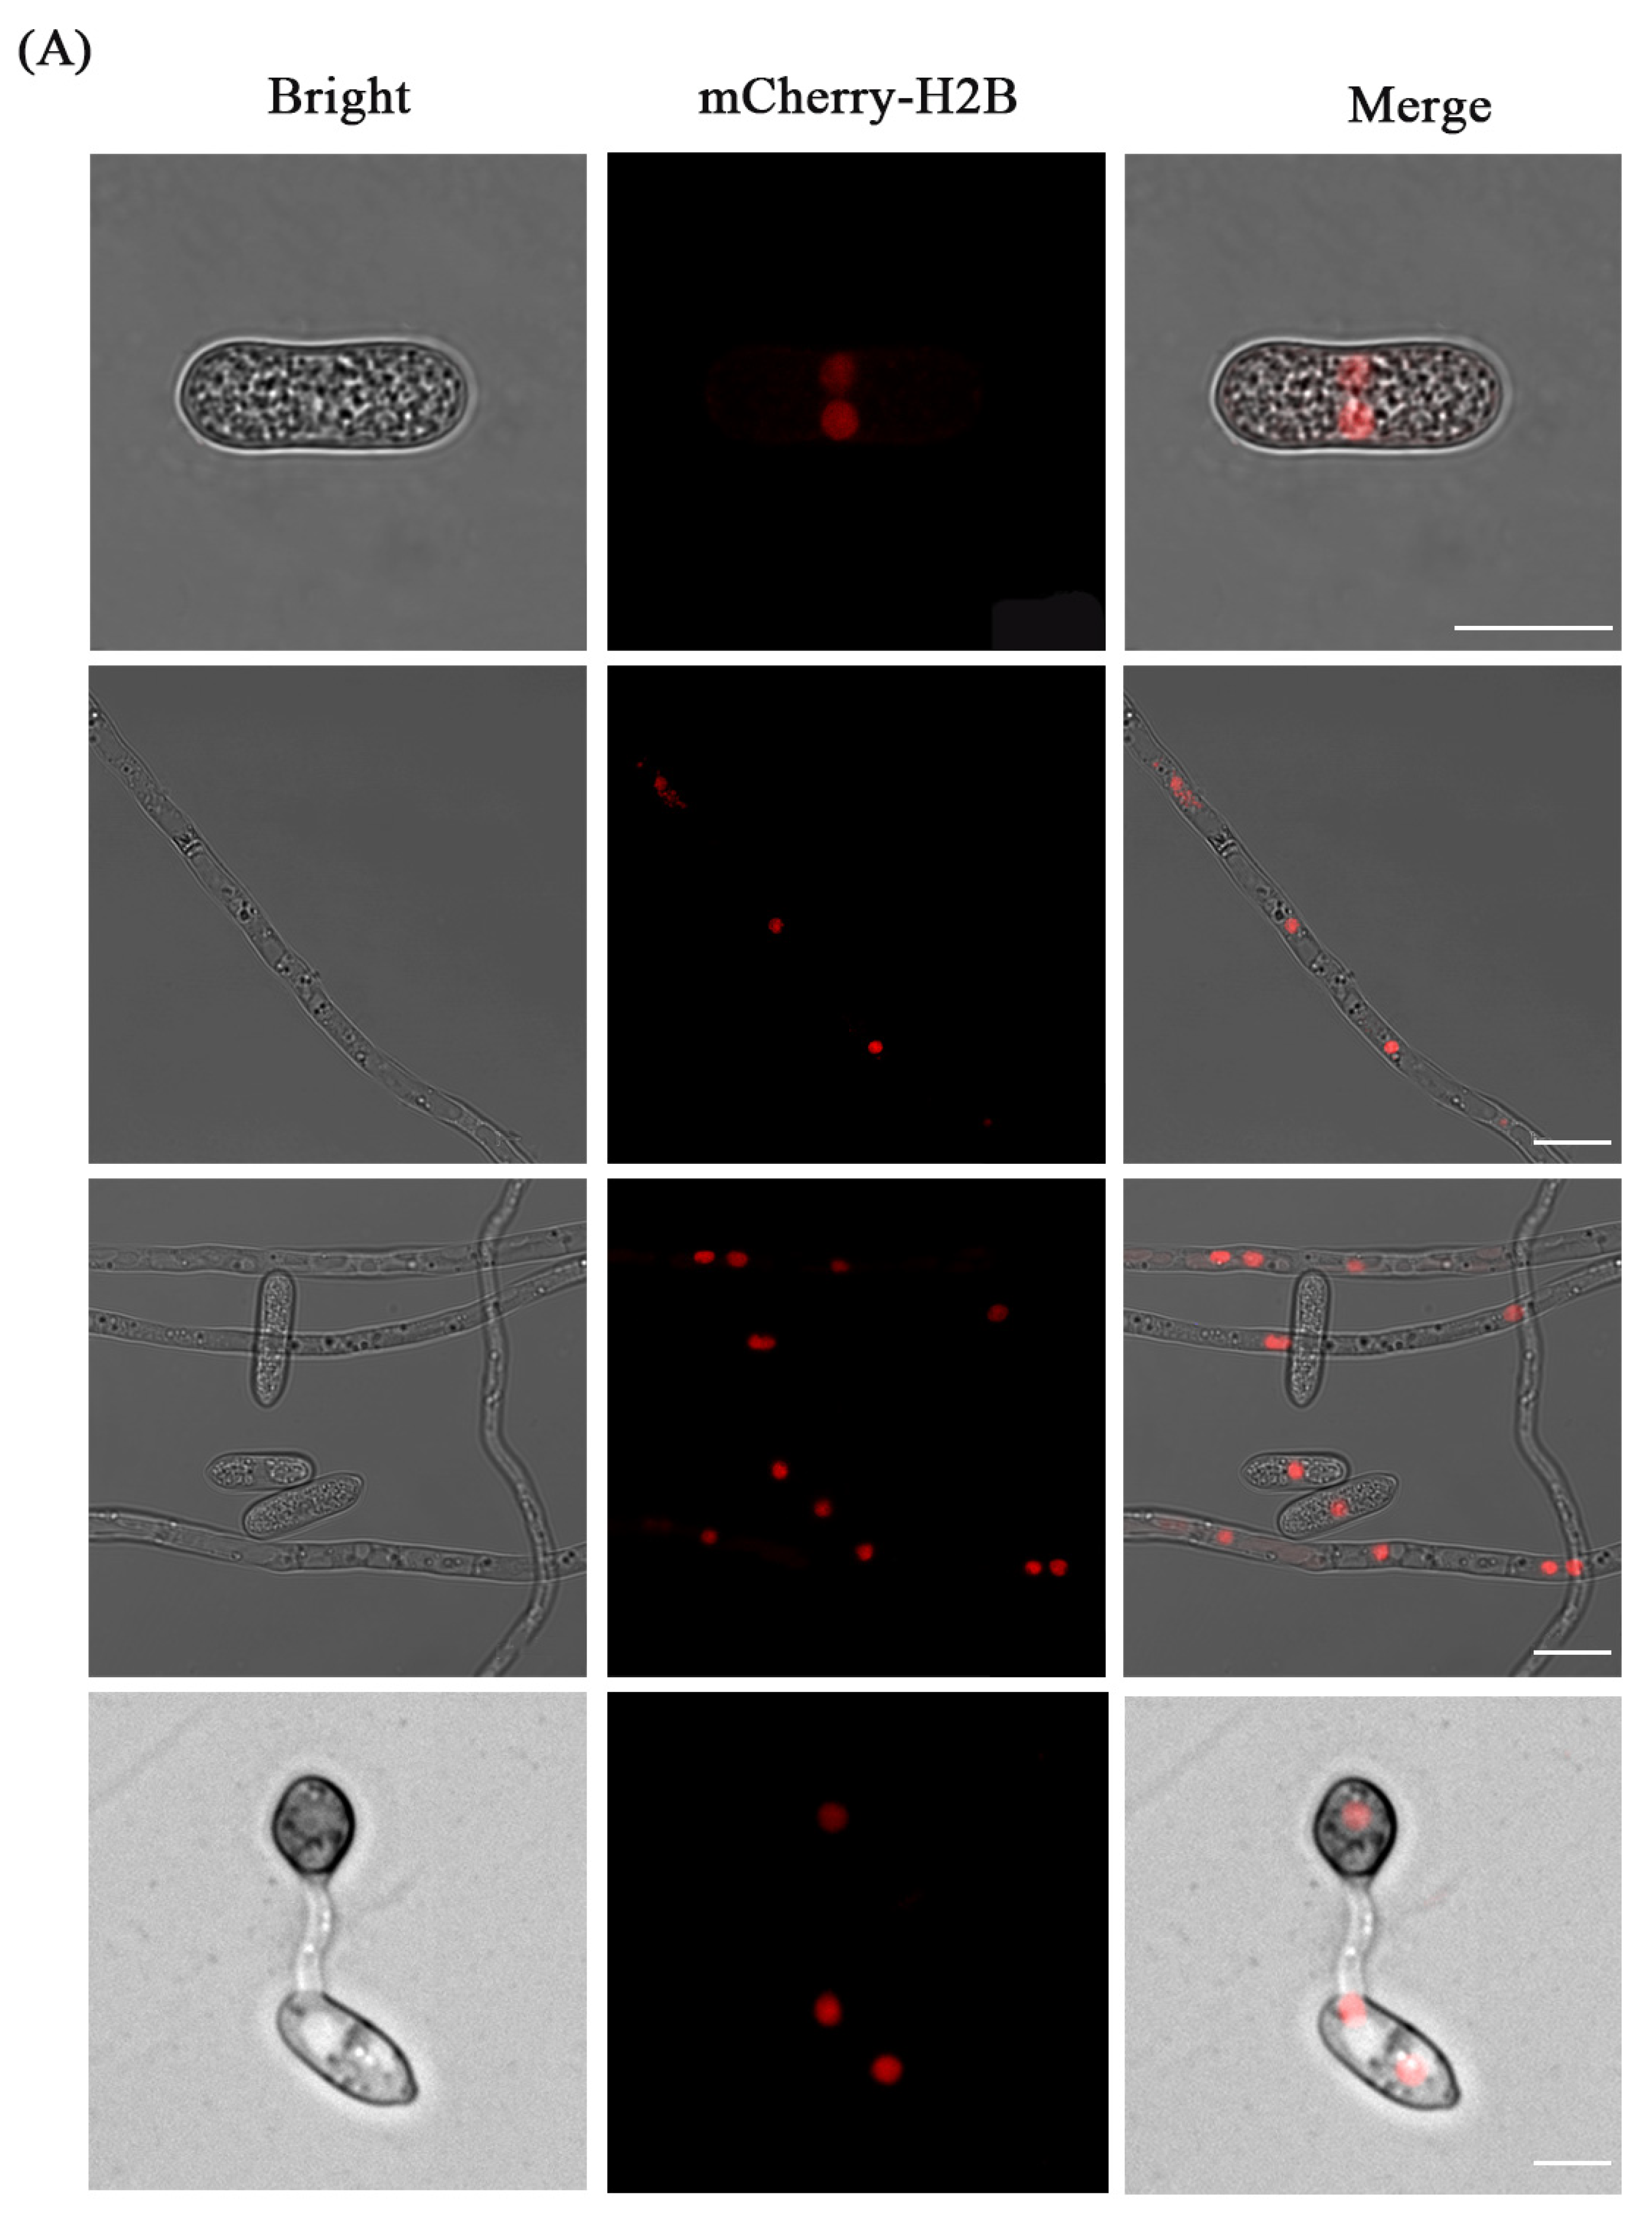
3.3. Fluorescence Localization of Nucleus
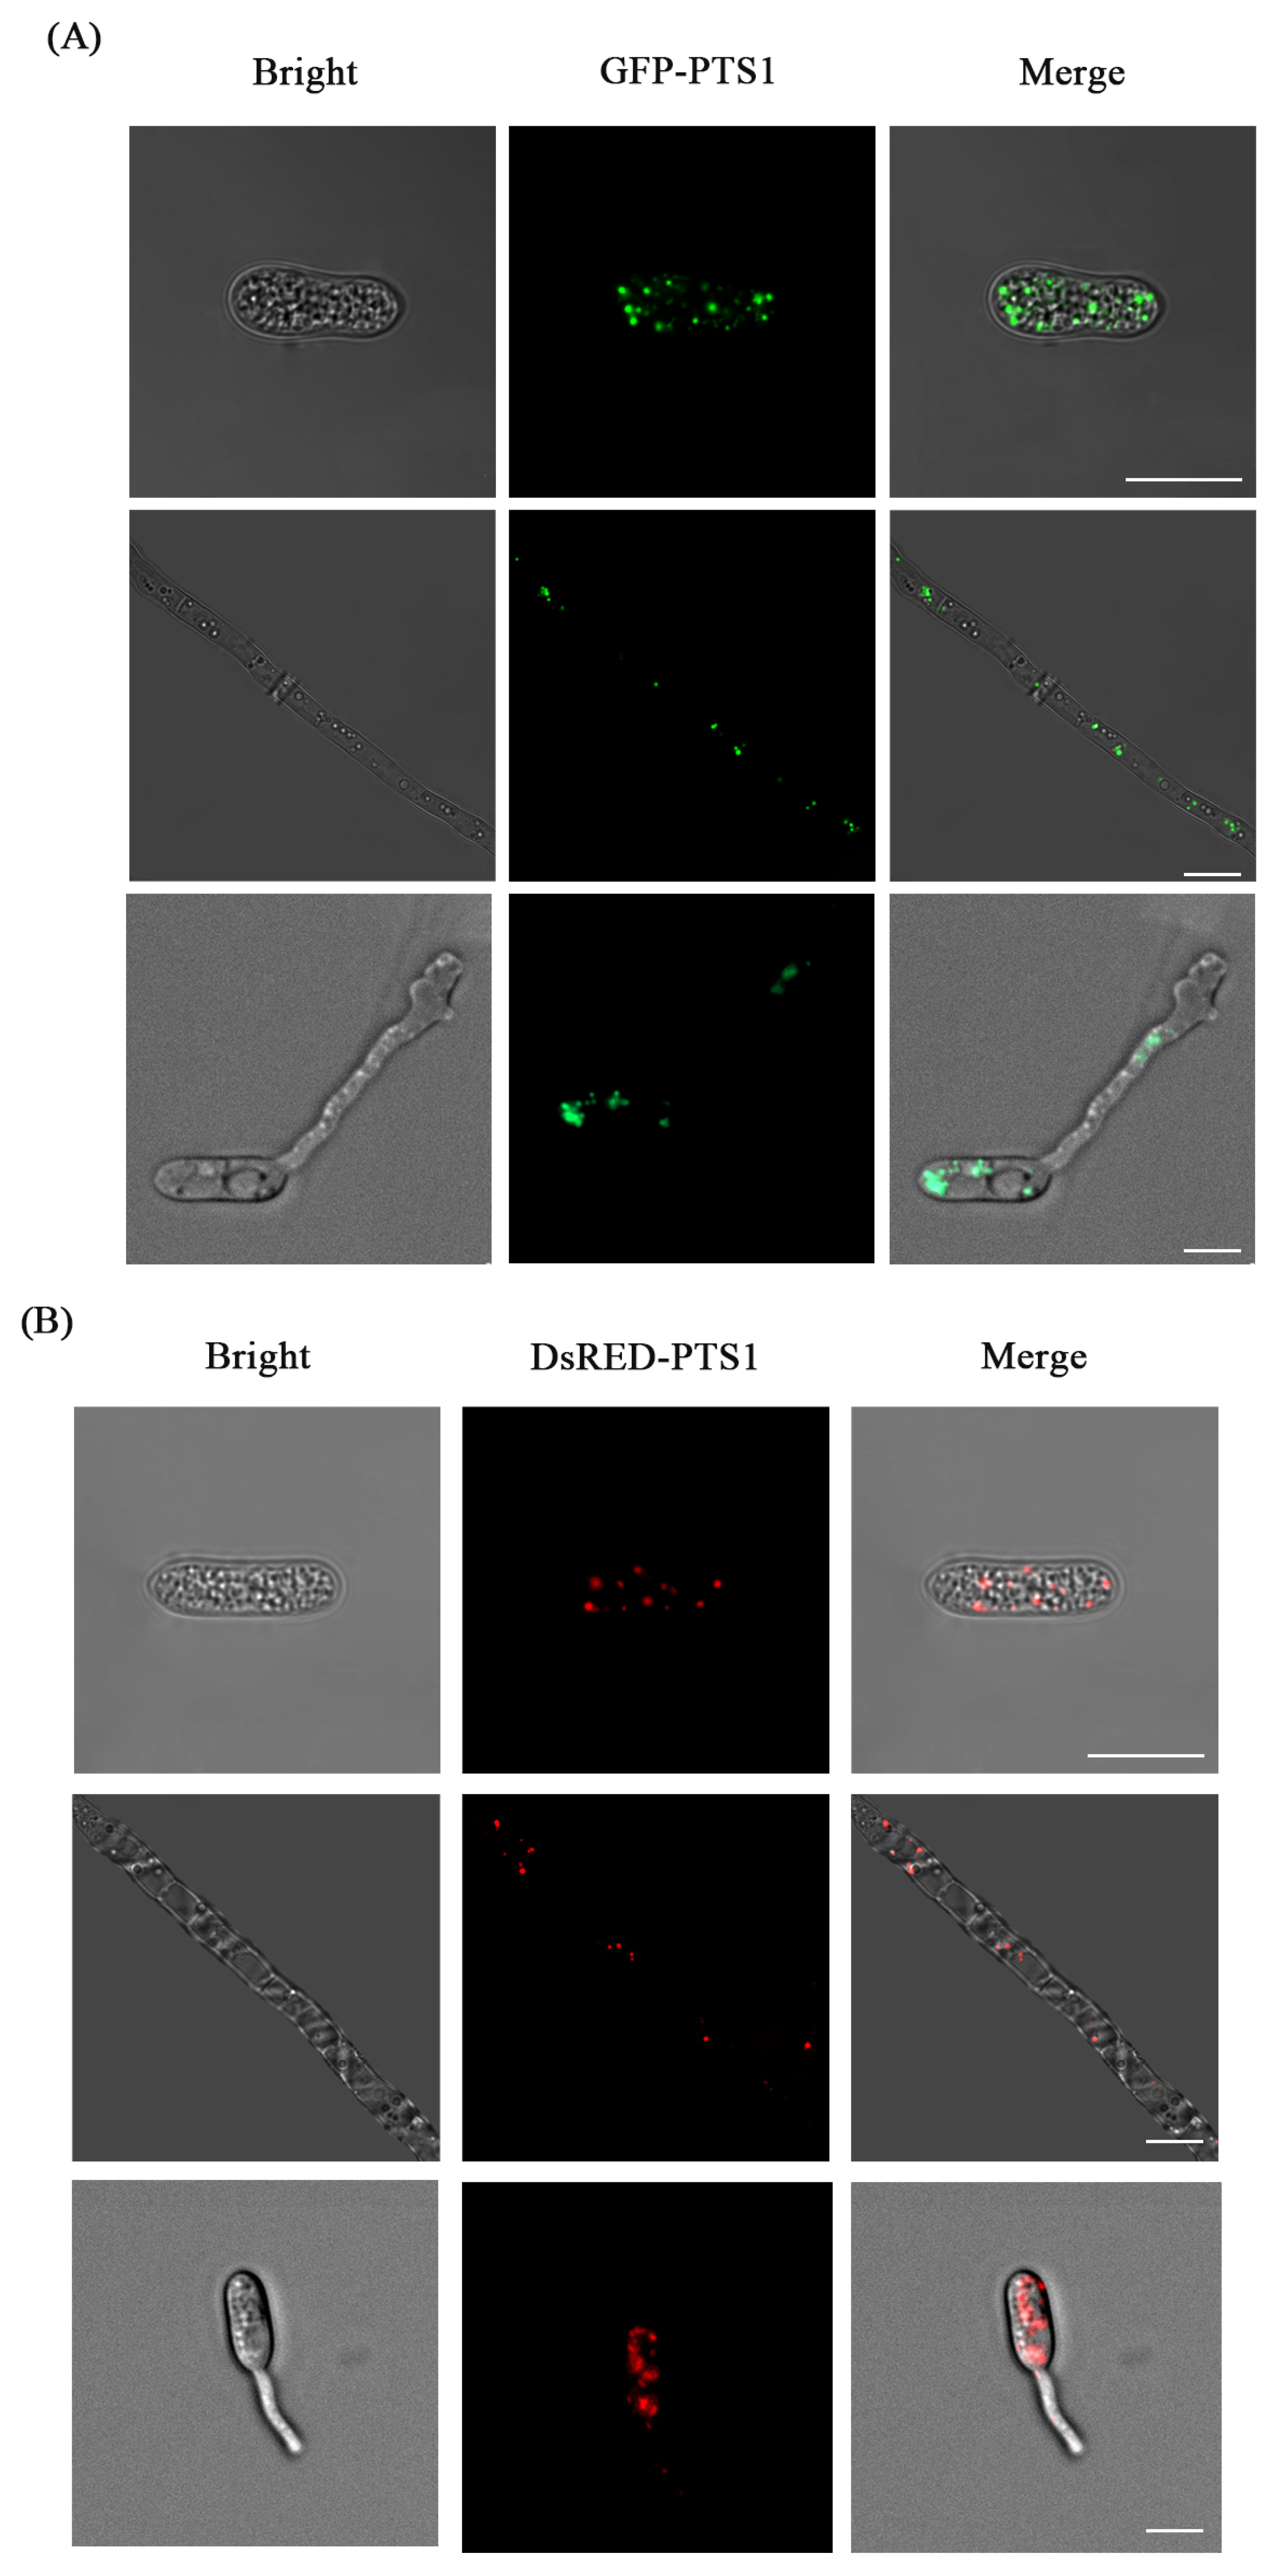
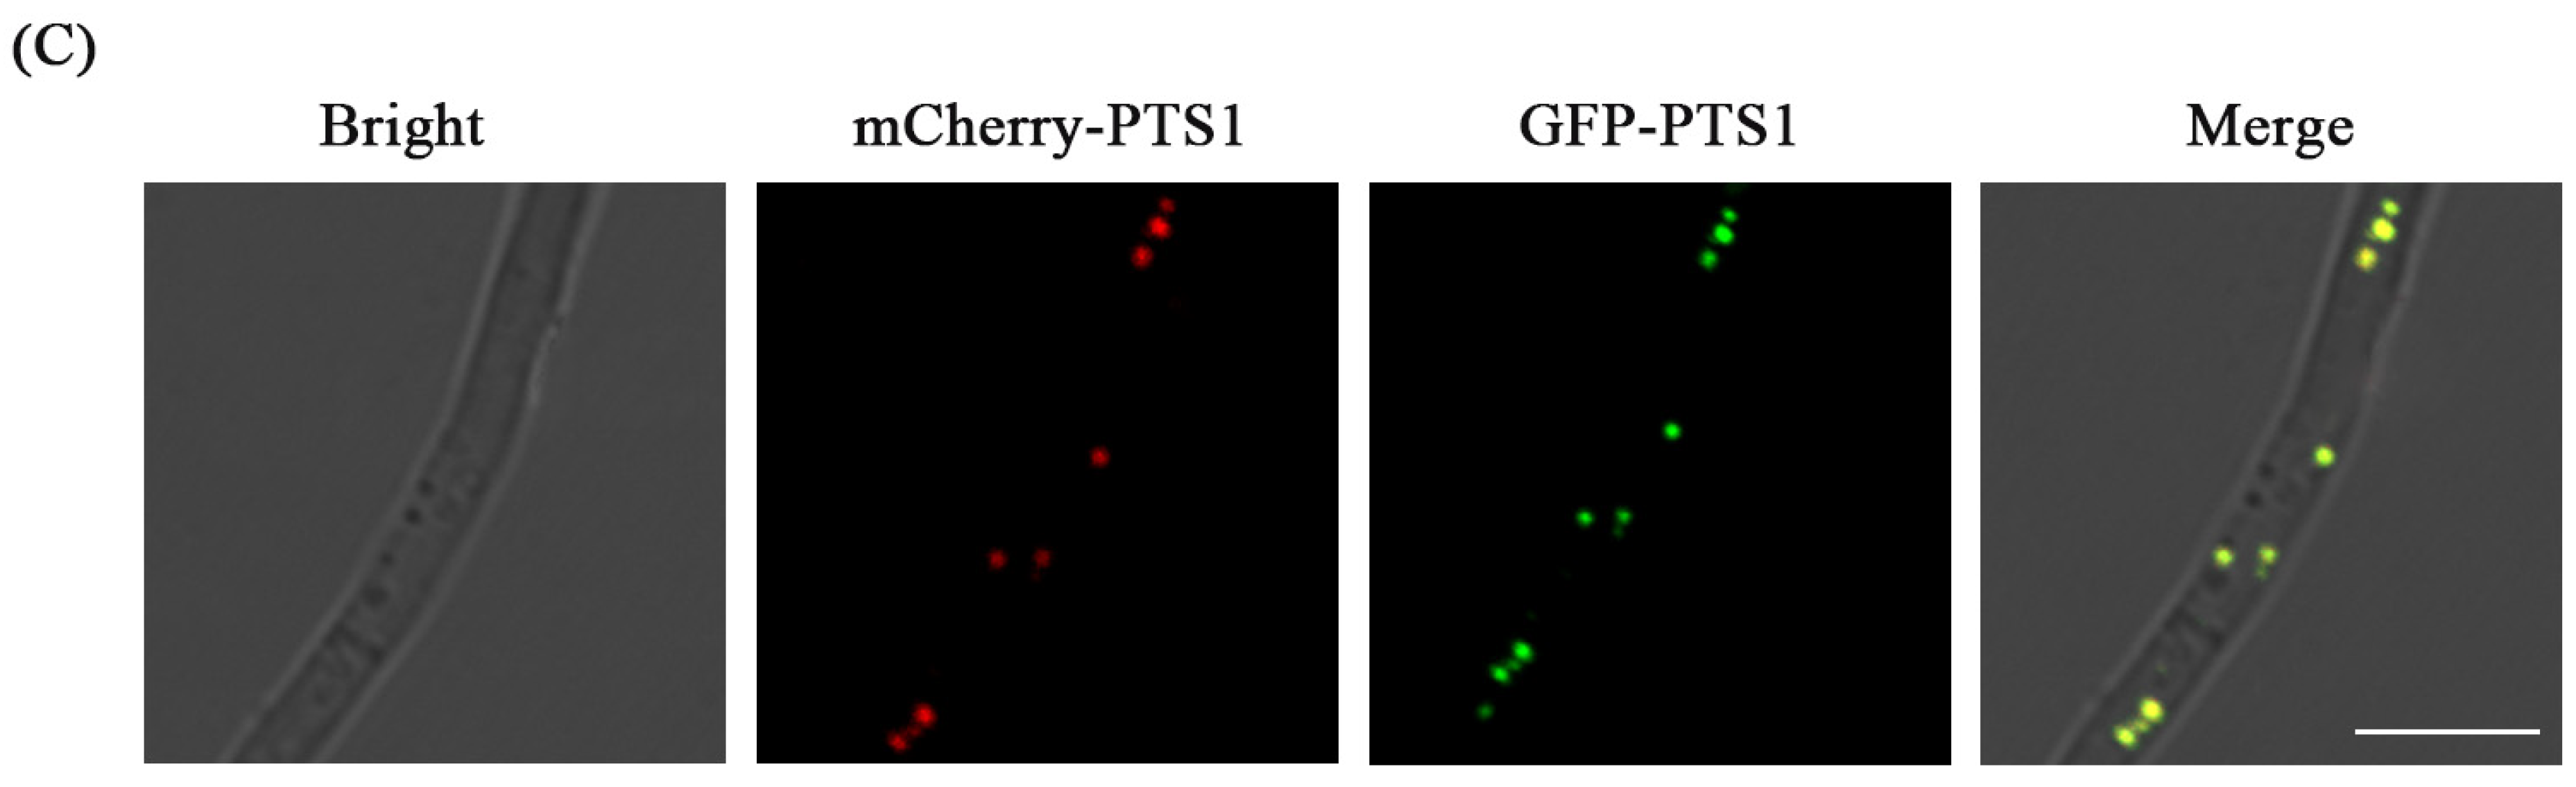
3.4. Fluorescence Labeling of Peroxisome
3.5. The CFW Staining of the Fluorescent Transformants
4. Discussion
Supplementary Materials
Author Contributions
Funding
Institutional Review Board Statement
Informed Consent Statement
Data Availability Statement
Conflicts of Interest
References
- Liu, X.Y.; Jing, Y.; Yang, J.X. Literature review of plant anthracnose. J. Northwest For. Coll. 1995, 4, 105–111. [Google Scholar]
- Lei, Y.; Lin, X.J.; Chen, T.; Liu, X.M.; Cai, S.H.; Fan, G.C. Pathogen identification and pathogenicity analysis of grape ripe rot in Fujian. J. Fruit. Sci. 2014, 31, 1123–1127. [Google Scholar]
- Deng, W.P.; Yang, M.; Du, F.; Yang, J.Z.; Zhu, S.S. Identification of the pathogen causing grape anthracnose in Yunnan and its pathogenicity. J. Plant. Prot. 2013, 40, 61–67. [Google Scholar]
- Wang, Y.; Qin, H.Y.; Liu, Y.X.; Fan, S.T.; Sun, D.; Yang, Y.M.; Li, C.Y.; Ai, J. First Report of Anthracnose Caused by Colletotrichum aenigma on Actinidia arguta in China. Plant. Dis. 2019, 103, 372. [Google Scholar] [CrossRef]
- Kim, J.S.; Hassan, O.; Chang, T. First Report of Colletotrichum aenigma Causing Anthracnose of Grape (Vitis vinifera) in Korea. Plant Dis. 2021, 105, 2729. [Google Scholar] [CrossRef] [PubMed]
- Marilou, R.P.; Naqvi, N.I. Host invasion during rice-blast disease requires carnitine-dependent transport of peroxisomal acetyl-CoA. Mol. Miceobiol. 2006, 61, 61–75. [Google Scholar]
- Yu, M.X.; Wang, J.Y.; Wang, S.Z.; Li, L.; Wang, Y.L.; Sun, G.C. Fluorescent labeling of peroxisome and nucleus in Botrytis cinerea. Acta Microbiol. Sin. 2021, 61, 1246–1256. [Google Scholar]
- Wu, C.Z.; Xu, F.; Gao, Y.L.; Jang, H. Application of fluorescent labeling technique in the research of biology and medicine. J. Chongqing Univ. Technol. 2014, 28, 55–62. [Google Scholar]
- Nagata, T.; Takebe, I. Cell wall regeneration and cell division in isolated tobacco mesophyll protoplasts. Planta 1970, 92, 301–308. [Google Scholar] [CrossRef] [PubMed]
- Xu, Y.P.; Zheng, X.H.; Fang, C.Z.; Weng, L.B.; Huang, L.Y. A methodology study on elimination the influence of dead cells stained with DAPI. Prog. Mod. Biomed. 2019, 19, 1660–1664. [Google Scholar]
- Freitag, M.; Hickey, P.C.; Raju, N.B.; Selker, E.U.; Read, N.D. GFP as a tool to analyze the organization, dynamics and function of nuclei and microtubules in Neurospora crassa. Fungal Genet. Biol. 2004, 41, 897–910. [Google Scholar] [CrossRef] [PubMed]
- Wang, J.Y.; Wu, X.Y.; Du, X.F.; Chai, R.Y.; Zhang, Z.; Mao, X.Q.; Qiu, H.P.; Wang, Y.L.; Sun, G.C. Construction and fluorescence localization of GFP-PTS1 GFP-PTS2 in Magnaporthe oryzae. In Proceedings of the 2008 Annual Academic Conference of the Chinese Society of Plant Pathology, Guangzhou, China, 21–27 July 2008; Chinese Society for Plant Pathology, CSPP: Beijing, China, 2008; p. 4. [Google Scholar]
- Shi, X.X.; Wang, J.Y.; Xiao, S.W.; Wang, Y.L.; Li, D.Y.; Chai, R.Y.; Sun, G.C. Fluorescent Labeling the Peroxisome and Nucleus in Fusarium oxysporum f. sp. Niveum. Chin. J. Cell Biol. 2020, 42, 195–203. [Google Scholar]
- Yeshitila, D.; Mubashir, H. Agrobacterium-tumefaciens-mediated transformation of Helminthosporium turcicum, the maize leaf-blight fungus. Arch. Microbiol. 2003, 180, 279–284. [Google Scholar]
- Rho, H.S.; Kang, S.; Lee, Y.H. Agrobacterium tumefaciens-mediated transformation of the plant pathogenic fungus, Magnaporthe-grisea. Mol. Cells 2001, 12, 407–411. [Google Scholar] [PubMed]
- Li, L.; Wang, J.Y.; Chen, H.L.; Chai, R.Y.; Zhang, Z.; Mao, X.Q.; Qiu, H.P.; Jiang, H.; Wang, Y.L.; Sun, G.C. Pex14/17, a filamentous fungus-specific peroxin, is required for the import of peroxisomal matrix proteins and full virulence of Magnaporthe oryzae. Mol. Plant. Pathol. 2017, 18, 1238–1252. [Google Scholar] [CrossRef] [PubMed]
- Li, H.J.; Lu, J.P.; Liu, X.H.; Zhang, L.L.; Lin, F.C. Vectors building and usage for gene knockout, protein expression and fluorescent fusion protein in the rice blast fungus. J. Agric. Biotechnol. 2012, 20, 94–104. [Google Scholar]
- Wang, J.Y.; Du, X.F.; Chai, R.Y.; Sun, G.C.; Lin, F.C. Strategies of targeted gene replacement in filamentous fungi. Hereditas 2007, 7, 898–904. [Google Scholar] [CrossRef]
- Zhou, Q.X. Establishment of Transformation Systems for Filamentous Fungi. Master’s Thesis, Shandong Agricultural University, Taian, China, 2007. [Google Scholar]
- Gao, B.D.; Zhong, J.; Zhao, H.R. Application of fluorescence protein reporter gene in research of plant parasitic fungi. Biotechnol. Bull. 2011, 9, 32–38. [Google Scholar]
- Guo, X.N.; Li, L.; Dong, B.; Wang, J.Y.; Chai, R.Y.; Zhang, Z.; Mao, X.Q.; Hao, Z.N.; Wang, Y.L.; Sun, G.C. Lighting the cellular structures of sexual generation in Magnaporthe oryzae with fluorescent proteins and fluorescent dyes. Chin. J. Cell. Biol. 2018, 40, 1138–1145. [Google Scholar]
- Rüdiger, S.; Nicole, S.; Reinhard, F. Nuclear traffic in fungal hyphae: In vivo study of nuclear migration and positioning in Aspergillus nidulans. Mol. Microbiol. 2003, 25, 757–769. [Google Scholar]
- Li, L.; Yu, M.X.; Guo, J.; Hao, Z.N.; Zhang, Z.; Lu, Z.Q.; Wang, J.Y.; Zhu, X.M.; Wang, Y.L.; Chen, J.; et al. The peroxins BcPex8, BcPex10, and BcPex12 are required for the development and pathogenicity of Botrytis cinerea. Front. Microbiol. 2022, 13, 962500. [Google Scholar] [CrossRef] [PubMed]


Disclaimer/Publisher’s Note: The statements, opinions and data contained in all publications are solely those of the individual author(s) and contributor(s) and not of MDPI and/or the editor(s). MDPI and/or the editor(s) disclaim responsibility for any injury to people or property resulting from any ideas, methods, instructions or products referred to in the content. |
© 2023 by the authors. Licensee MDPI, Basel, Switzerland. This article is an open access article distributed under the terms and conditions of the Creative Commons Attribution (CC BY) license (https://creativecommons.org/licenses/by/4.0/).
Share and Cite
Yu, S.; Wang, J.; Chai, R.; Qiu, H.; Lu, Z.; Zhang, Z.; Li, L.; Wang, J.; Sun, G. Fluorescent Labeling of Peroxisome and Nuclear in Colletotrichum aenigma. J. Fungi 2023, 9, 493. https://doi.org/10.3390/jof9040493
Yu S, Wang J, Chai R, Qiu H, Lu Z, Zhang Z, Li L, Wang J, Sun G. Fluorescent Labeling of Peroxisome and Nuclear in Colletotrichum aenigma. Journal of Fungi. 2023; 9(4):493. https://doi.org/10.3390/jof9040493
Chicago/Turabian StyleYu, Shendan, Jing Wang, Rongyao Chai, Haiping Qiu, Ziqi Lu, Zhen Zhang, Lin Li, Jiaoyu Wang, and Guochang Sun. 2023. "Fluorescent Labeling of Peroxisome and Nuclear in Colletotrichum aenigma" Journal of Fungi 9, no. 4: 493. https://doi.org/10.3390/jof9040493
APA StyleYu, S., Wang, J., Chai, R., Qiu, H., Lu, Z., Zhang, Z., Li, L., Wang, J., & Sun, G. (2023). Fluorescent Labeling of Peroxisome and Nuclear in Colletotrichum aenigma. Journal of Fungi, 9(4), 493. https://doi.org/10.3390/jof9040493