Article

Trichoderma harzianum Cellulase Gene thph2 Affects Trichoderma Root Colonization and Induces Resistance to Southern Leaf Blight in Maize

1
School of Agriculture and Biology, Shanghai Jiao Tong University, Shanghai 200240, China
2
Shanghai Yangtze River Delta Eco-Environmental Change and Management Observation and Research Station, Ministry of Science and Technology, Ministry of Education, 800 Dongchuan Rd., Shanghai 200240, China
3
The State Key Laboratory of Microbial Metabolism, Shanghai Jiao Tong University, Shanghai 200240, China
*
Author to whom correspondence should be addressed.
J. Fungi 2023, 9(12), 1168; https://doi.org/10.3390/jof9121168
Submission received: 18 September 2023 / Revised: 14 November 2023 / Accepted: 18 November 2023 / Published: 4 December 2023

Abstract

:
Trichoderma, widely distributed all over the world, is commonly found in soil and root ecosystems. It is a group comprising beneficial fungi that improve plant disease resistance and promote plant growth. Studies have shown that Trichoderma cellulases can also improve plant disease resistance. Based on previous studies, we reported that a C6 zinc finger protein (Thc6) regulates two cellulase genes, thph1 and thph2, to induce ISR responses in plants. Therefore, in this study, we focused on the role of thph2 in the colonization of maize roots by T. harzianum and the induction of systemic resistance against southern leaf blight. The results showed that thph2 had a positive regulatory effect on the Trichoderma colonization of maize roots. After the root was treated with Trichoderma, the leaf defense genes AOS, LOX5, HPL, and OPR1 were expressed to resist the attack of Cochliobolus heterostrophus. The pure Thph2 protein also resulted in a similar induction activity of the AOS, LOX5, HPL, and OPR1 expression in maize roots, further demonstrating that thph2 can induce plant defense responses and that signal transduction occurs mainly through the JA signaling pathway.

1. Introduction

Trichoderma is commonly found in root ecosystems and soil. As a well-known beneficial fungus, it can promote plant growth and improve plant disease resistance [1]. In addition, Trichoderma interacting with a root system enables the plant’s immune system to better resist pathogens [1,2,3]. Studies have also shown that Trichoderma can trigger a transient increase in the number of reactive oxygen species (ROS) and the calcium levels in maize leaves, thereby activating and enhancing plant immune defenses [2,3]. As a result of this induced systemic resistance, Trichoderma is able to protect plants from a number of foliar pathogens in addition to soil-borne pathogens.
At present, the mechanism of the antagonistic Trichoderma system inducing plant leaf spot resistance mainly focuses on the identification of effect factors (activators) and an expression analysis of defense-response-related genes [4,5]. So far, more than 20 kinds of resistance-inducible effector factors (activators) have been proven to be produced by Trichoderma, including proteins, enzymes, indoleacetic acids, polysaccharides, chitin, secondary metabolites, etc. [6].
For example, the hydrophobic proteins Sm1/EPl1 [7] and Sm2/EPl2 produced by T. virens can induce the upregulated expression of the JA signal in maize leaves by acting on the roots [8,9].
Plant-cell-wall-degrading enzymes (such as endogalacturonase, cellulase, xylanase, etc.) produced by Trichoderma can directly affect maize roots and promote root colonization (bio-priming), the release of cell wall oligosaccharides, and the induction of resistance. Therefore, the potential role of Trichoderma CWDE elicitors in ISR against foliar diseases is of great interest.
Early studies have shown that the endogalacturonase (ThPG1) produced by T. harzianum [10] can be used as an initiator to promote Trichoderma root colonization and enhance leaf resistance to Botrytis cinerea. The leaves of tobacco, soybeans, and corn were treated with Trichoderma cellulase, which induced an increase in the ethylene content in the leaves.
Cellulase is composed of three main components, namely endoglucanase (EG), extranose glucanase (CBH), and β-glucosidase (BG). CBH includes two isomerases, CBHI and CBHII [11]. CBHI acts on the reducing end of cellulose, while CBHII acts on the non-reducing end of cellulose [12] to generate fibrinose. In fungi, the secretion of CBHII is not as high as that of CBHI, but its degradation efficiency for microcrystalline cellulose is twice that of CBHI [13,14]. However, there is no known effect of CBHII on inducing plant resistance.
To resist pathogen invasions, plants have evolved complex defense mechanisms to protect themselves from pathogens. These mechanisms involve recognizing pathogen-associated molecular patterns (PAMPs) and activating an immune response called PAMP-triggered immunity (PTI). At the same time, pathogens have developed effector molecules that can inhibit PTI to spread and survive in the host. Plants have evolved resistance proteins (R) as a response to this challenge. These resistance proteins can detect pathogen effectors and activate effect-triggered immunity (ETI) [15,16]. Modern plant immunology suggests that a plant’s innate immunity, or basic defense response, is caused by molecules from microbially conserved microbial-associated molecular patterns (MAMPs) or a plant immune response (MTI/DTI) stimulated by endogenous damage-associated molecular pattern (DAMP) molecules released from the damaged host plant. Host cells on the surface of the pattern recognition receptors (PRRs) often have a typical leucine-rich repeat receptor-like kinase (LRR-RK) structure of leucine-repeated sequences [17]. Recognition with MAMPs/DAMPs triggers a range of cellular and physiological responses [18,19,20,21]. Such responses include systemic acquired resistance (SAR) and induced systemic resistance (ISR), which are phenotypically similar but differ significantly at the genetic and biochemical levels. SAR is associated with the accumulation of salicylic acid (SA) [22,23], while ISR is a response to the accumulation of jasmonic acid (JA) and ethylene (ET) [24].
In previous laboratory studies, we found that a C6 zinc finger protein (Thc6) in T. harzianum plays a major role in the ISR of maize against Curvularia leaf spot. We demonstrated that two hydrolases, thph1 and thph2, from T. harzianum are regulated by Thc6. However, thph1- and thph2-mediated signal transduction remain unknown. In this study, we demonstrate that thph2 has a positive regulatory role in the colonization ability of Trichoderma in maize roots, that thph2 is involved in the expression of systemic defense genes from root to leaf in maize, and that the jasmonic acid (JA)-mediated pathway induced by Trichoderma thph2 may play a dominant role in the resistance of maize to leaf diseases. This study provides new insights into the mechanisms by which the interaction between Trichoderma and plant roots triggers systemic defenses against C. heterostrophus infections in maize.

2. Materials and Methods

2.1. Plant Growth Conditions

Maize seeds (Zhengdan958) were surface-disinfected by shaking in 75% ethanol for 15 min, followed by shaking in 2% (w/v) sodium hypochlorite (NaClO) (active ingredient) for 7 min, and were then washed five times with sterile ddH2O (double-distilled water). The seeds were germinated on sterilized filter papers (90 × 90 mm) placed in a plant growth incubator at 25 °C and 80% relative humidity for 60 h.
After germination, the seedlings were grown under sterile hydroponic conditions in 530 mL tissue culture bottles containing 180 mL of sterile Hoagland’s solution with a piece of sterile support to support the seedlings [25]. Two seedlings were placed in each tissue culture bottle.
Sterile soil was used to grow the maize; 80 g of the substrate (organic seedling special substrate, Chuang De Li, China) was placed into a tissue culture bottle, 120 mL of water was added, and the seeds were planted 1 cm below the surface of the soil. Two seedlings were placed in each tissue culture bottle.

2.2. Fungal Strains and Culture

T. harzianum (T30), Fusarium graminearum, C. heterostrophus, and Fusarium verticilloides were provided by the Shanghai Jiao Tong University Culture Preservation Center. The fungi were stored in 25% glycerin. A 10 μL spore suspension was placed in a PDA plate. Next, the plates were placed in a 28 °C incubator for a period of 5 days to allow for activation. Following activation, the strains were then transferred onto a fresh PDA plate. The colony morphology was stabilized after being repeated 2–3 times [26,27].

2.3. Constructing the Vectors

The construction methods of the gene deletion and overexpression vector are shown in Figure 1. Using a pCambia-1300 vector as the skeleton, the knockout vector was constructed by adding the sequences on both sides of thph2 (thph2U and thph2L) and on both sides of G418 (including the Trpc promoter and Trpc terminator, with 1655 bp in total), and the target gene was knocked out by a homologous replacement. The anti-G418 mutant was obtained by screening. The overexpressed vector linked the TrpC promoter, thph2 ORF, eGFP ORF, and Trpc terminator successively, and the anti-G418 mutant was obtained by screening. The pCambia-1300 vector was also used as the skeleton, and hygromycin B resistance (hph) was used as the screening marker. The mutant was verified as the correct transformant by a series of PCRs. (1) The hph gene (for hygromycin B resistance) and g418 gene (for G418 resistance) were amplified with the primers Hph-F/Hph-R and G418-F/G418-R, respectively. (2) The thph2 deletions were verified by amplifying the thph2 genes [28].
The pCambia-1300 was inserted by the GAPDH promoter, eGFP, and Trpc terminator, followed by the NeoR (resistant to G418) or Hph. Then, we obtained pCambia-1300:eGFP:hph and pCambia-1300:eGFP:g418.

2.4. Transformation by ATMT and Screening of Transformants

An A. tumefaciens-mediated transformation (ATMT) was carried out according to the authors of [29] with some modifications. AGL1 containing a plasmid was grown in LB supplemented with kanamycin (50 μg/mL) and rifampin (20 μg/mL). After incubation at 28 °C for 24 h on a shaker (220 rpm), the bacterial cells were diluted to OD600 = 0.20, inoculated in an induction medium (IM) with MES (400 mM) and AS (200 μM), and cultured at 28 °C and 200 rpm for 6 h. Subsequently, the spores of T. harzianum and AGL1 cells were mixed in a ratio of 1:1, and a total of 200 μL of the mixture was spread onto a cellophane sheet and placed on an IM plate (90 mm in diameter) containing MES (400 mM) and AS (200 μM). After 48 h of incubation at 23 °C, the cellophane sheet was transferred to a CYA plate containing 300 μg/mL temetine and 200 μg/mL hygromycin B or G418 and incubated at 28 °C. Each putative mutant was then transferred to CYA media containing 300 μg/mL temetine and 200 μg/mL hygromycin B or G418 for five generations. The mitotic stability was tested by subculturing five generations on PDA media without hygromycin B [28]. After that, each mutant was transferred to PDA, the secured separation was carried out, and the obtained strains were detected and stored at minus 80 °C.
Firstly, we transferred deletion vector 1300:Δthph2 and overexpression vector 1300:oethph2:eGFP to T30 by ATMT, and we obtained transformants Δthph2 and OEthph2:GFP. We transferred pCambia-1300:eGFP:g418 and pCambia-1300:eGFP:hph into T30 and Δthph2, respectively, and then we obtained transformants T30:GFP and Δthph2:GFP.

2.5. Southern Blotting Analysis

The transformants were confirmed using PCR and then tested for homoplasmic status and copy number with Southern blot analysis. For Southern blot analysis, protocol of Edwin Southern was used [30]. Genomic DNA from both wildtype strains and mutant strains were extracted by CTAB and restricted with BamHI. The restricted DNA fragments were separated by gel electrophoresis on a 1% agarose gel and then transferred to a nylon membrane using a semidry transfer method. A probe of 795 bp (Gene G418) was used and was purified with a PCR purification kit. The probe was labelled and hybridized using the DIG High Prime DNA Labelling and Detection Starter kit II for chemiluminescent detection with NBT/BCIP (Roche, Mannheim, Germany), following the manufacturer’s instructions [31].

2.6. Determination of Trichoderma Growth and Reproductive Ability

An amount of 3 μL of the isolated strains were inoculated on PDA media; the inoculum concentration was 1 × 10⁶ cfu/mL. The PDA cultures were kept in a dark environment at a temperature of 28 °C for a period of 5 days. During this time, the diameter of the colonies and the area where spores were being produced were regularly observed and noted every 3 h. At the 5th day, a 5 mL of sterile water was used to wash off all the spores present on the medium surface. The count of Trichoderma spores was then determined using a hemocytometer. Each treatment was replicated three times.

2.7. Plate Confrontation Assay of Trichoderma and the Pathogen

Discs were removed from the edges of the Trichoderma and pathogen colonies using a sterile hole punch (5 mm diameter) and placed in turn on PDA plates 2.5 cm apart. All the plates were placed in an incubator at 28 °C for 5 days, and the pathogen was grown alone in PDA as a control. Then, Trichoderma was used to determine the inhibitory effect on pathogen growth by measuring the inhibited pathogen’s colony radius. Each counter measurement was set to 5 replicates. The inhibition rate was calculated as follows [32]: inhibition rate (%) = (colony radius of control group-colony radius of treatment group pointing to center of the plate)/colony radius of control group × 100.

2.8. Inoculum Preparation

T30, T30:GFP, ∆thph2:GFP, and OEthph2:GFP conidia were propagated on potato–dextrose agar (PDA) at 28 °C under a cycle of 12 h of light and 12 h of dark for 7 d to induce conidiation. The spores were collected using sterile ddH2O and filtered through a double layer of sterile Miracloth (Millipore Merck, Burlington, MA, USA).

2.9. Infection Assay

To evaluate the effect of the T. harzianum thph2 gene on the colonization of roots by Trichoderma, seedlings were grown under hydroponic conditions without aeration in 530 mL tissue culture bottles containing 180 mL of sterile Hoagland’s solution with a piece of sterile support to support the seedling for 48 h after germination [33]. After seven days of maize growth, the maize roots were inoculated with a suspension of Trichoderma spores. Samples were taken at 0 d, 1 d, 3 d, and 5 d after inoculation. For sampling, fresh root and stem tissues were gently washed with sterile ddH2O, and then a 2 cm segment of the primary roots closest to the seed and a 1 cm segment of the stem were cut. Uninoculated root samples were also taken.
Conidia were added into 10% sodium CMC-Na (carboxymethyl cellulose sodium) with an adjusted concentration of 1 × 10⁶ cfu/mL. The seedlings were coated and incubated in sterile soil after germination. After 15 days of growth, the leaves were inoculated with a C. heterostrophus spore suspension of 5 × 10⁵ cfu/mL. For sampling, the root and stem tissues were gently washed with sterile ddH2O, and then 2 cm of root tissue from the geminated seed and 1 cm each of stem tissue and the inoculated leaf were cut. Uninoculated root samples were also taken.

2.10. Quantification of Trichoderma Root Colonization

To quantify the fungal biomass in maize roots, plant tissues were collected at the required time points, rapidly frozen in liquid N2, and finely ground into powder in a bead beater. Genomic DNA (gDNA) was extracted using a modified chloroform:octanol extraction protocol [34] and the fungal biomass was quantified using real-time quantitative polymerase chain reaction (RT-qPCR). The cycling conditions were 30 s at 95 °C, followed by 40 cycles at 95 °C for 10 s and 65 °C for 30 s each, 60 s at 60 °C, and 15 s at 95 °C, and the cooling step was 37 °C for 5 s. By calculating the ratio of the plant housekeeper gene actin (maize) to the specific gene g418 (G418), the ∆∆Ct method was used to analyze the data [35]. The primers used for the qPCR analysis are shown in Table S1.

2.11. Analysis of Gene Expression Using RT-qPCR

To determine the transcription levels of the fungal and plant genes in Trichoderma and maize, respectively, the total RNA was isolated from three bioreplicates of rapidly frozen tissues and used for an RT-qPCR analysis. Briefly, the RNA was extracted and purified using a FastPure Plant Total RNA Isolation Kit (Vazyme, Nanjing, China). The RT-qPCR was performed using the LightCycler 96 (Roche). The primers used for the RT-qPCR analysis of different plant stress marker genes are listed in Table S1. The data were analyzed using the ∆∆Ct method (Livak and Schmittgen, 2001) by calculating the relative transcript levels of the stress marker genes in relation to that of the housekeeping reference gene 18Ss (maize). For the expression analysis of fungal genes, actin (Trichoderma) was used as the reference.
First-strand cDNA was synthesized from 1 mg of RNA using the HiScript III RT SuperMix for qPCR (+gDNA wiper) (Vazyme, Nanjing, China) according to the manufacturer’s instructions. The ChamQ Universal SYBR qPCR Master Mix (Vazyme, Nanjing, China) was used for qPCR amplification. The quantitative PCR was performed in a 96-well optical plate 7500 real-time PCR system by following the protocol in the instruction book (30 s at 95 °C, followed by 40 cycles at 95 °C for 10 s and 65 °C for 30 s each, 60 s at 60 °C, and 15 s at 95 °C, and the cooling step was 37 °C for 5 s). The data analysis was performed using three replicates of the biological samples. The error line represents the standard deviation (SD). In all cases, the measurements represent the ratio of the expression levels between each sample shown in each experiment and the control. All samples were normalized according to the housekeeper gene 18 s (maize) or actin (Trichederma), and all experiments were performed three times with similar results.

2.12. Data Analysis

All experiments were based on different replicates and were repeated at least 3 times. The graphs were built using Microsoft Office Excel and GraphPad Prism9 with standard error bars. The results show the repeated mean and the standard error of the mean.

3. Results

3.1. Construction and Identification of thph2-Deletion and -Overexpression Transformants

In early studies, we found that the T30 cellulase gene thph2, from a T. harzianum strain, was responsible for Trichoderma’s systemically induced plant defense responses against Curvularina lunata, a foliar pathogen, when plant roots were colonized by Trichoderma [3]. To determine the role of thph2 in the T. harzianum-T30-induced systemic resistance in maize, we constructed thph2-deletion (KO) and -overexpression (OE) strains. We used the vector transformed by the State Key Laboratory of Microbial Metabolism, Shanghai Jiao Tong University, for gene replacement. The vector pCambia-1300:G418 was constructed to replace the entire thph2 open reading frame (ORF) with a hygromycin B marker (Figure 1A). The OE strains transformed the TrpC promoter, thph2 ORF, eGFP fusion protein, and TrpC terminator into Trichoderma using pCambia-1300:G418 (Figure 1B). We screened out some KO and OE strains using PCR gene detection and then transferred eGFP into the T30 and KO strains using pCambia-1300:eGFP.
Finally, we selected these three strains, T30:GFP, ∆thph2:GFP, and OEthph2:GFP, for subsequent experiments. Southern blotting was used to verify the copy number of the convertor, with G418 as the probe. The transformants with a single copy of the gene were selected for subsequent experiments (Figure 1C).

3.2. Expression of thph2 in Transformants

In order to verify whether the transformations were successful, a gene expression analysis was used to test whether the deletion or overexpression of the thph2 gene would lead to the accumulation of transcripts resulting in the desired changes. The results showed that the expression level of thph2 in ∆thph2:GFP was lower than that in the wildtype strain T30:GFP, whereas the expression level of OEthph2:GFP was higher than that of T30:GFP (Figure 2). The result was consistent with what we expected.

3.3. Evaluation of Growth, Reproduction, and Phenotype of thph2 Mutants

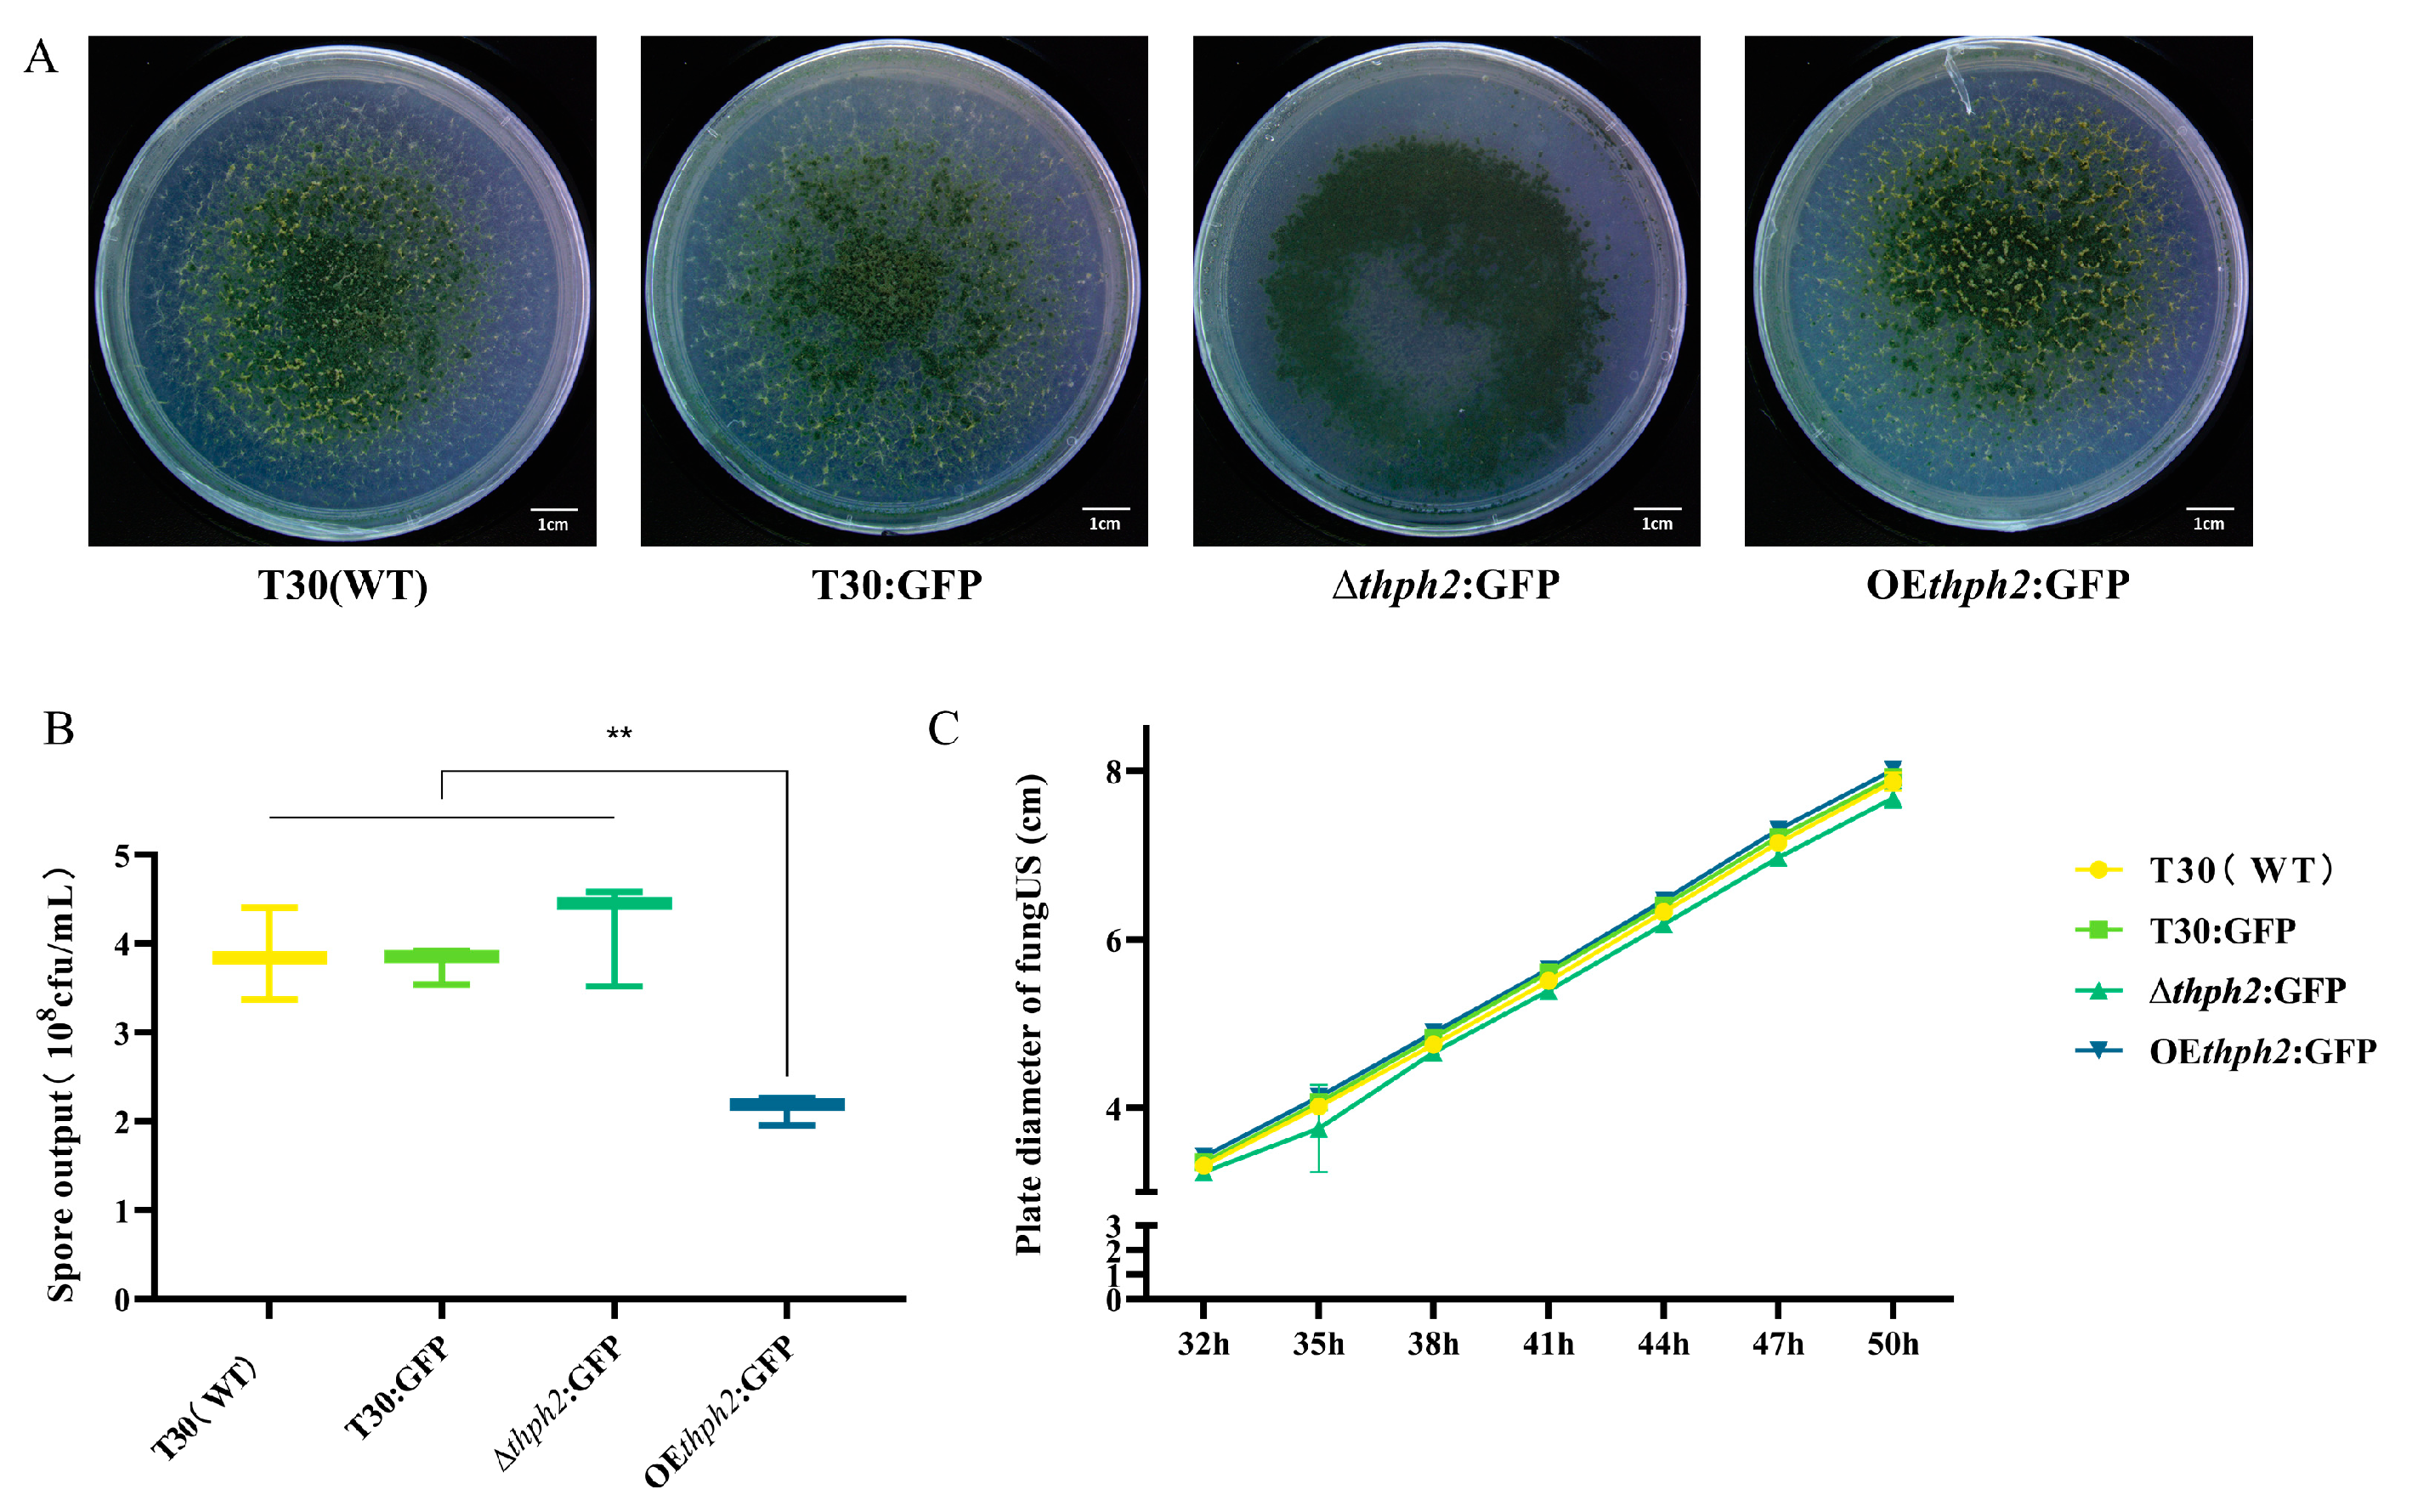
The mycelium growth, sporulation, and phenotype of T30, T30:GFP, ∆thph2:GFP, and OEthph2:GFP were evaluated using a plate assay. The phenotype showed no significant difference among these five strains, and the mycelium growth of ∆thph2:GFP was significantly lower than that of T30 (Figure 3A). After 5 days of growth, the spores were washed with the same amount of water to calculate the sporulation amount. The results showed that the number of spores of OEthph2:GFP, 2.2 × 10⁸ cfu/mL, was significantly less than that of other strains. In addition, the number of spores of ∆thph2:GFP was slightly higher than that for T30 and T30:GFP (Figure 3B). In the test of mycelium growth rate, there was no significant difference among the strains, although the mycelium growth rate of OEthph2:GFP was slightly faster, while that of ∆thph2:GFP was slightly slower (Figure 3C).

3.4. Evaluation of Trichoderma Strain Antagonism

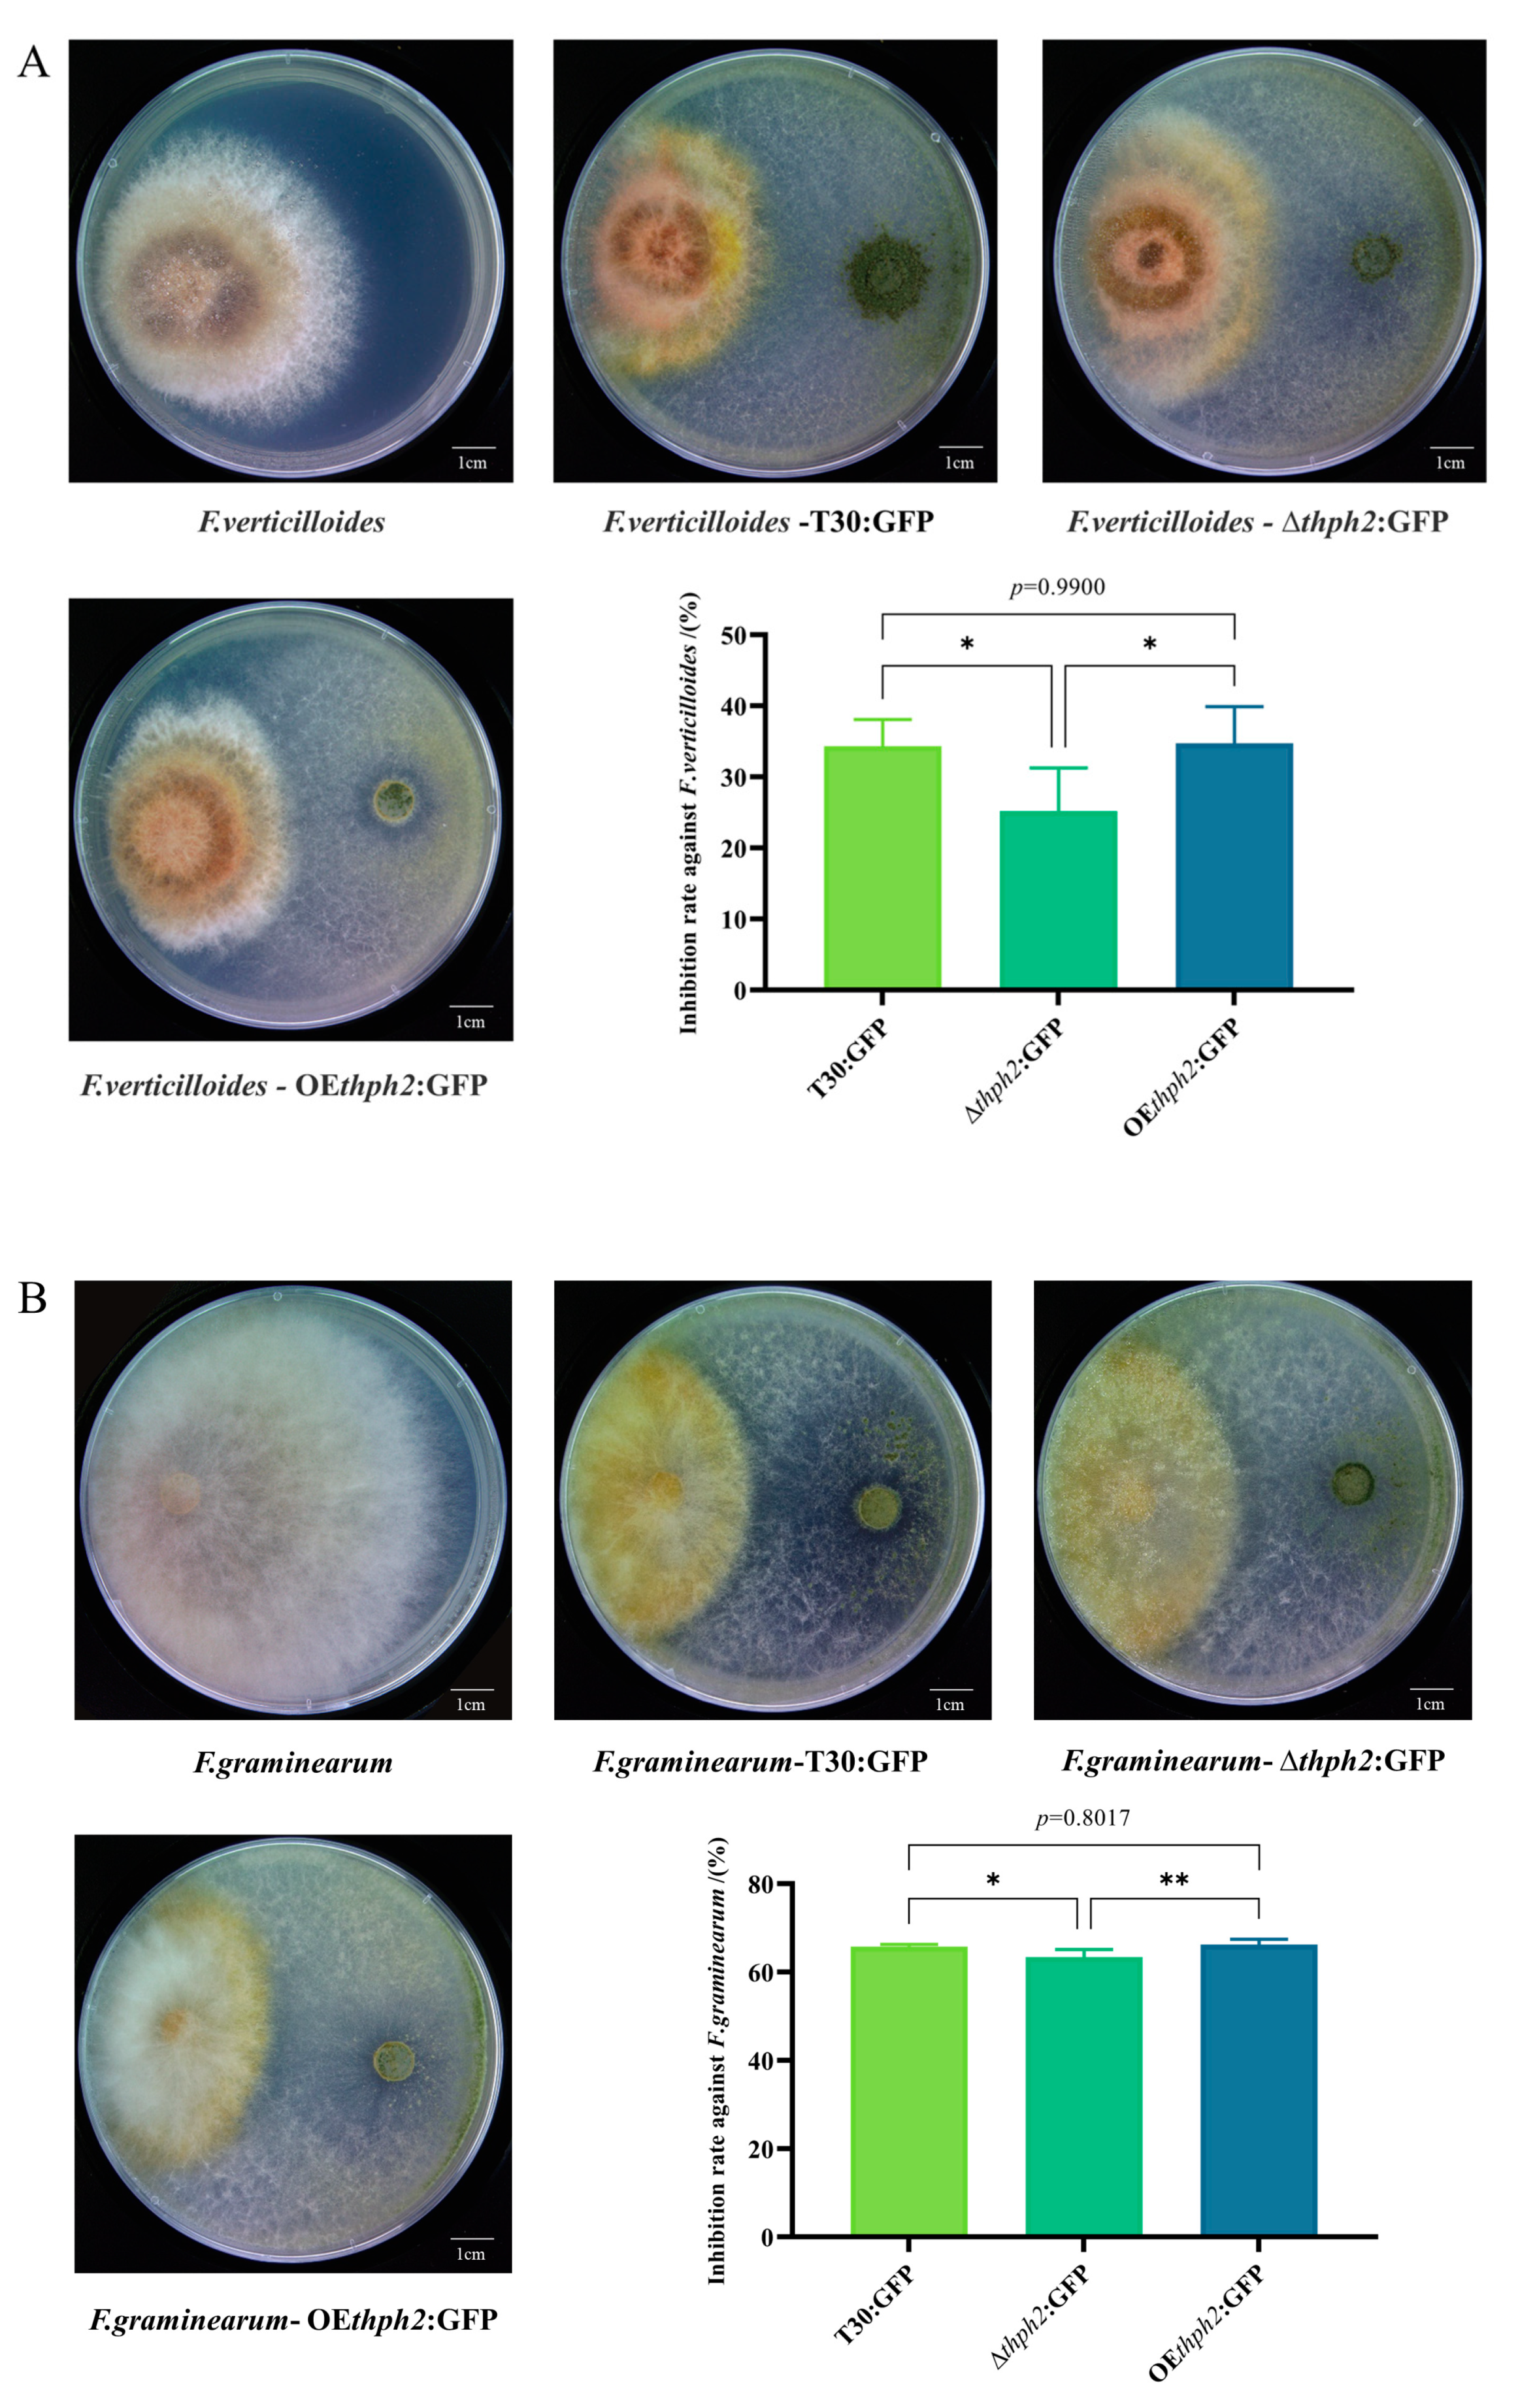
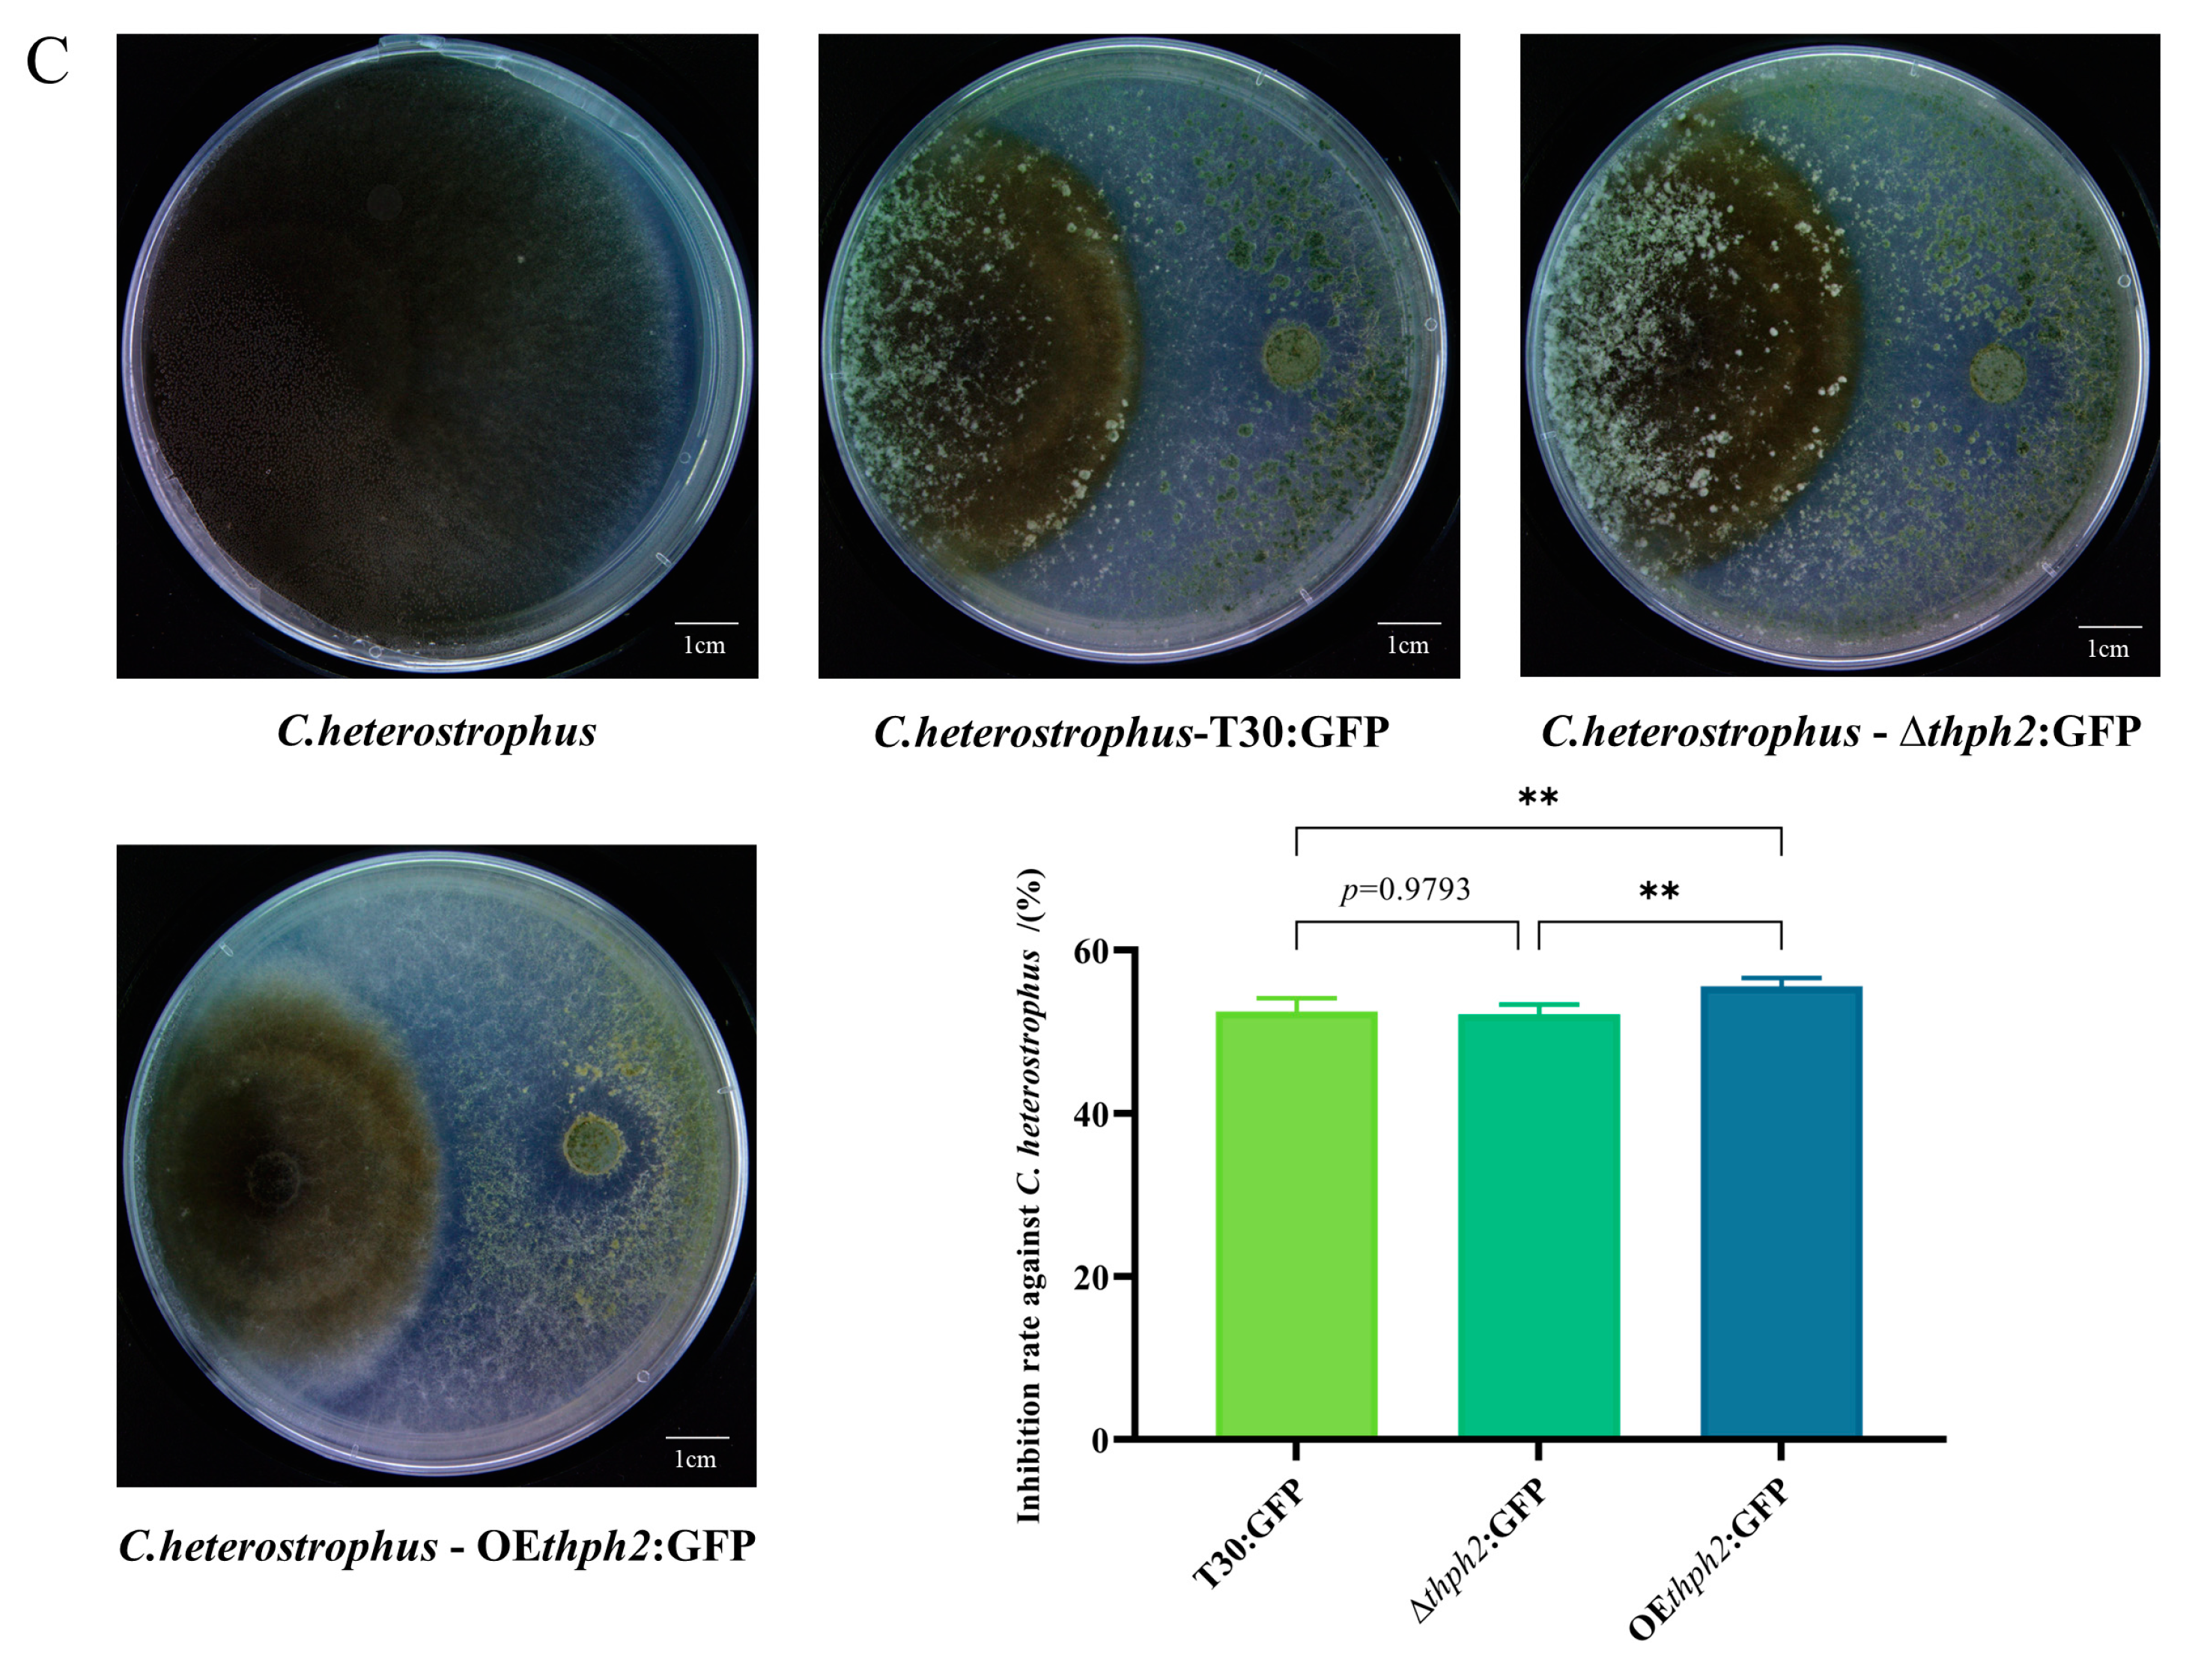
In order to explore the broad-spectrum antagonism of Trichoderma mutants against pathogens, we selected F. verticilloides (causal pathogen of maize root disease), F. graminearum (causal pathogen of maize stem disease), and C. heterostrophus (causal pathogen of maize southern leaf blight) for confrontation cultures against T30:GFP, ∆thph2:GFP, and OEthph2:GFP, respectively. As with the inhibition of F. verticilloides, the inhibition rate of ∆thph2:GFP was 25.79%, which was lower than that of T30:GFP at 34.32%. The inhibition rate of OEthph2:GFP was 35.72%, which was higher than that of T30:GFP (Figure 4A). In addition, the inhibition of F. graminearum (Figure 4B) and C. heterostrophus (Figure 4C) showed a similar pattern, in which the antagonistic rate of OEthph2:GFP to the pathogens reached 66.25% and 55.57%, respectively, which was higher than T30:GFP and much higher than ∆thph2:GFP.

3.5. The Analysis of the Effects of thph2 on Trcihoderma Root Colonization and Host Defense Response Induction

In the hydroponics system, the colonization amount was detected at 1 day, 3 days, and 5 days after inoculation. The results showed that each strain did not colonize the root of maize 1 day after inoculation. At 3 days after inoculation, the colonization of each strain was greatly improved. Regarding the difference among strains in the root colonization ability, the colonization of OEthph2:GFP was significantly higher than that of T30:GFP and ∆thph2:GFP, and the colonization of ∆thph2:GFP was slightly lower than that of T30:GFP. At 5 days after inoculation, the colonization of each strain decreased and tended to be stable, and the colonization pattern was similar to that at 3 d after inoculation (Figure 5).
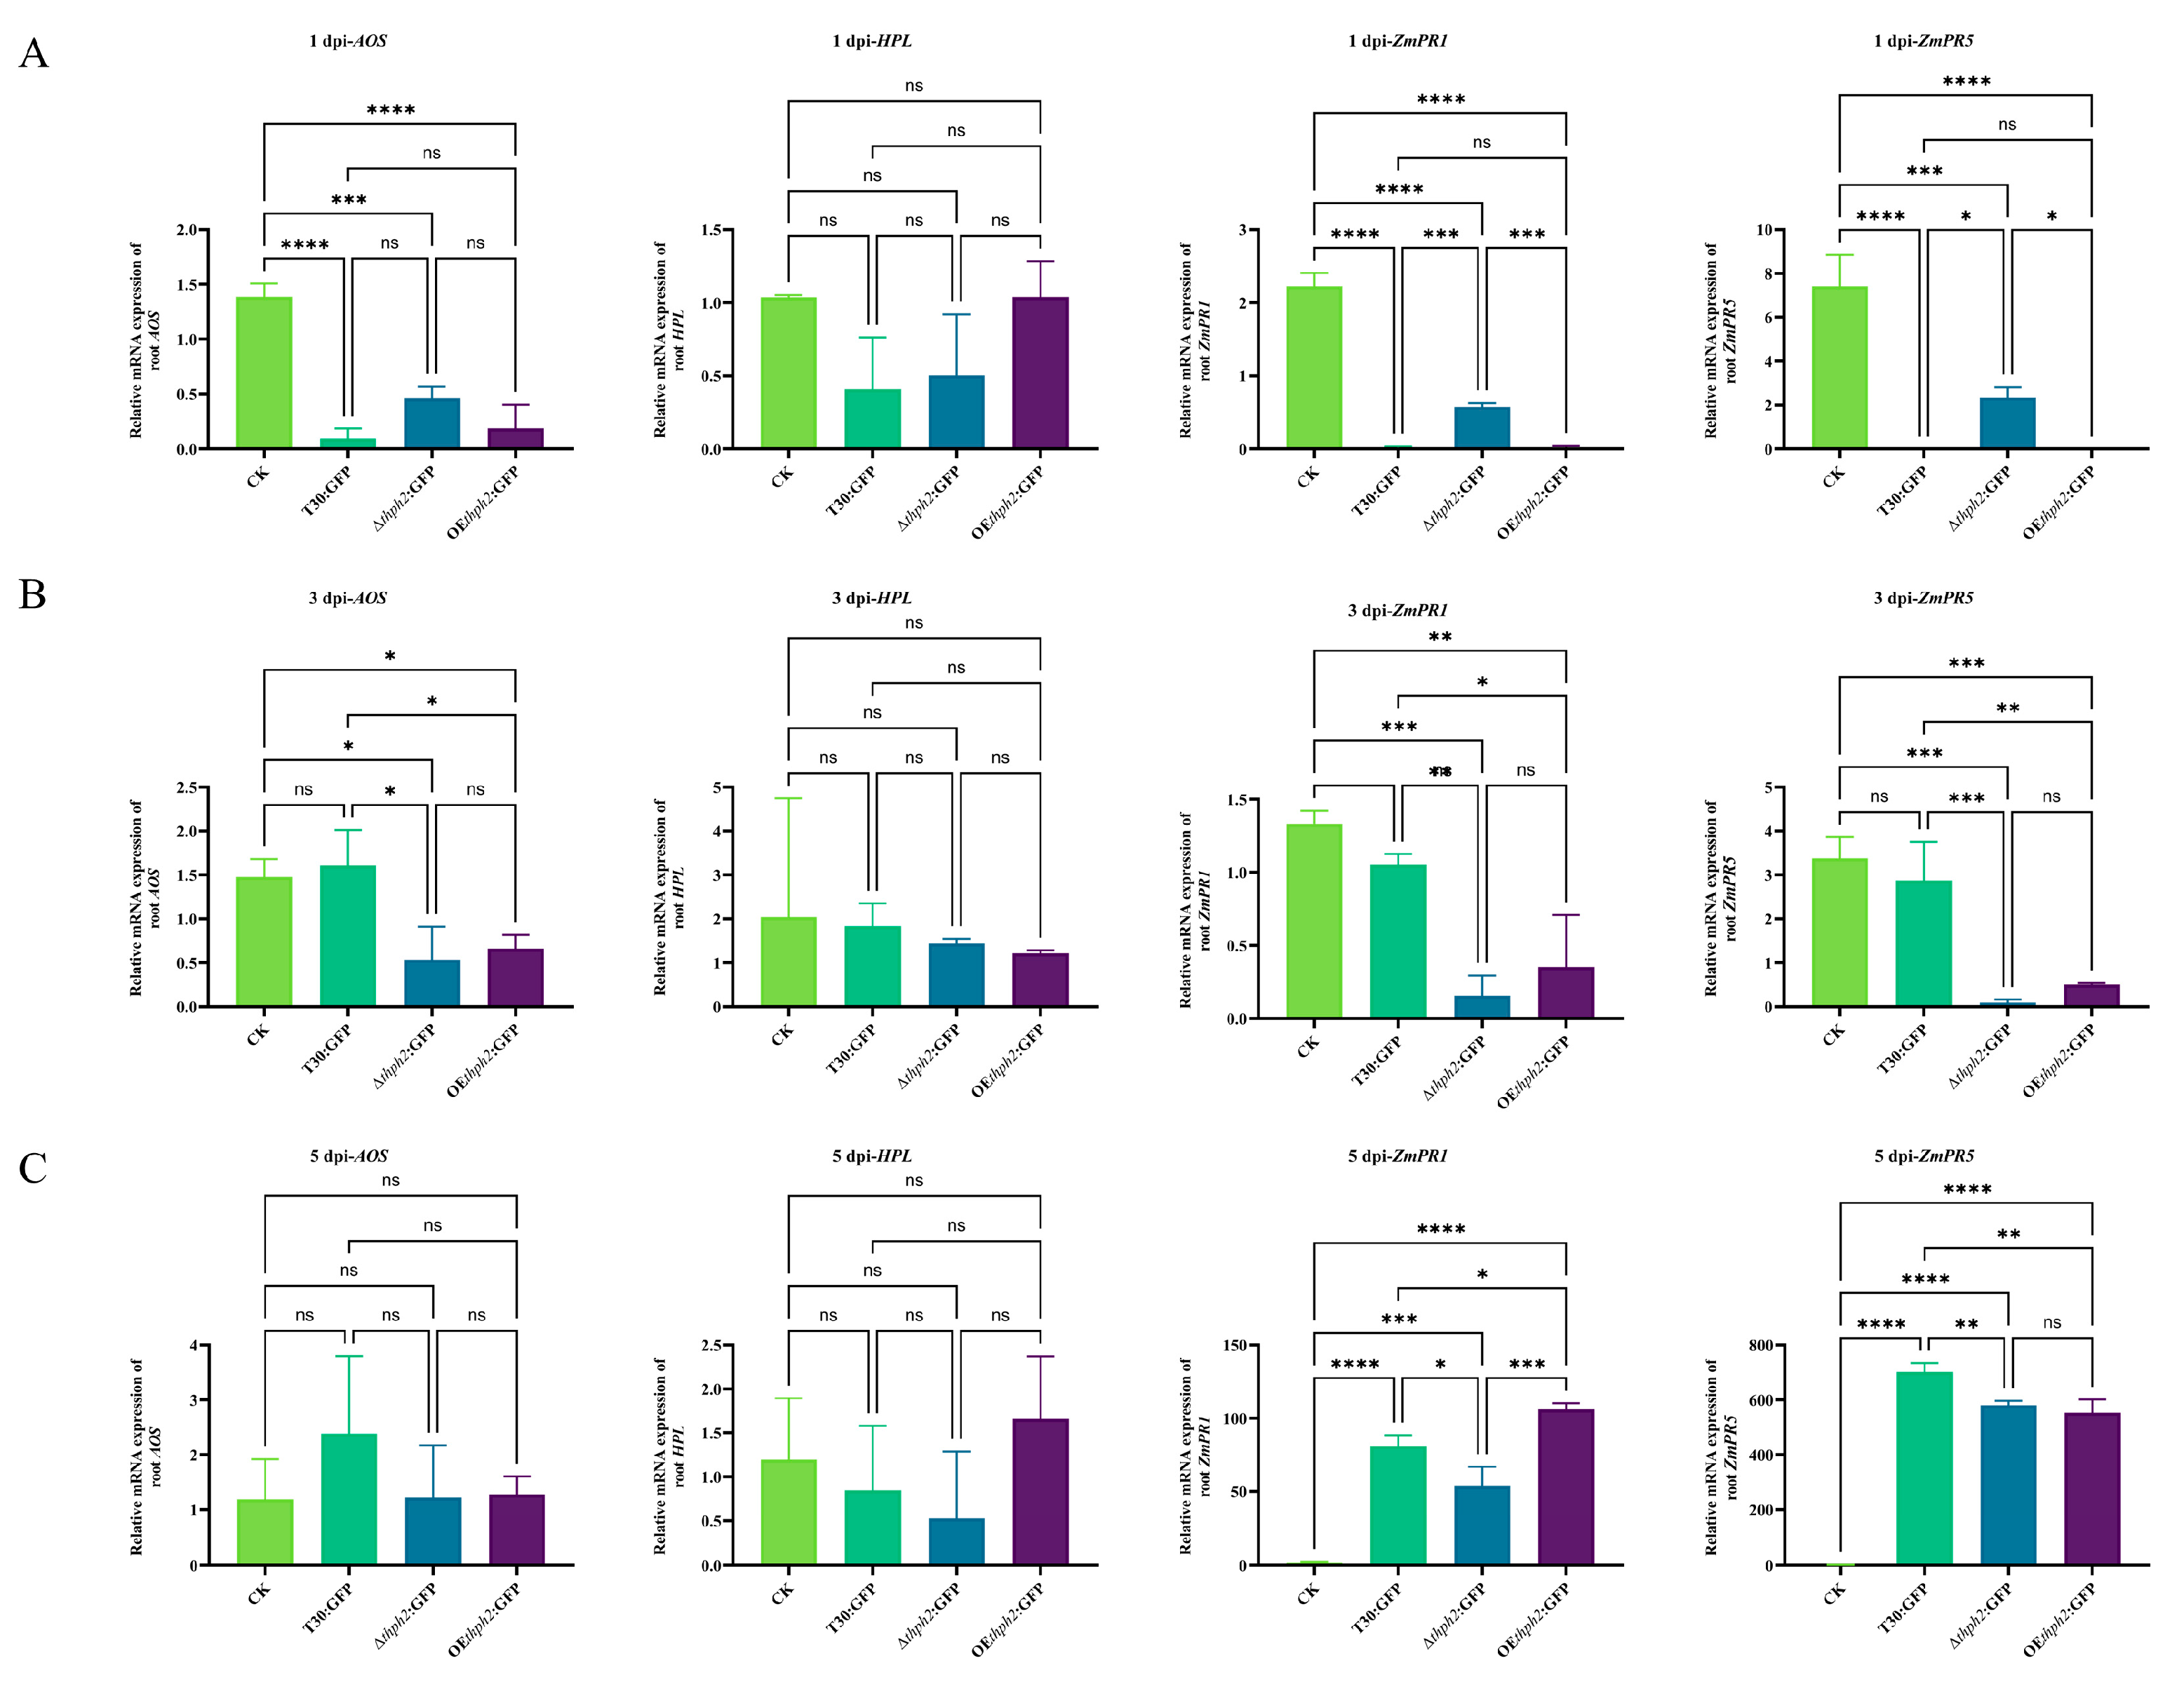
The four genes, ZmAOS (JA), ZmHPL (JA), ZmPR1 (SA), and ZmPR5 (SA), were selected for the evaluation of thph2’s contribution to the host defense response. In the early colonization period, at 1 day after inoculation (Figure 6A), all the tested hallmark defense genes were negatively expressed in the roots treated with the strains as compared to the control. At 3 days after inoculation (Figure 6B), the downregulation tendency of the defense genes was alleviated. AOS and HPL began to be positively expressed in the root, interestingly. At 5 days after inoculation (Figure 6C), ZmPR1 and ZmPR5 were upregulated in the root, particularly ZmPR5, as compared to the expression of both genes in the early days after inoculation. As to the leaf defense genes (Figure 7), most of the defense genes were upregulated to some extent as compared to the control. In particular, ZmPR1 was the most prominently expressed, and ZmPR5 at 5 d after inoculation was expressed to a greater extent in the OEthph2:GFP treatment than in the T30:GFP treatment and was also expressed more for T30:GFP than for ∆thph2:GFP (Figure 7C).

3.6. Thph2-Induced Resistance against C. heterostrophus in Maize, Mainly through ISR

In this part, we focus on the role of thph2 in the induction of resistance in maize by a root treatment with T. harzianum. The effect of T30:GFP, ∆thph2:GFP, and OEthph2:GFP on the resistance of maize leaves to the maize leaf pathogen C. heterostrophus after infecting the Trichoderma roots for 2 weeks was compared. At four days after inoculation, the maize seedlings were inoculated with pathogen spores for the defense evaluation. The foliar lesions appeared earlier in the plants without T. harzianum or treated with ∆thph2:GFP, whereas the lesion size changed significantly and became smaller in plants treated with either the T30:GFP strain or OEthph2:GFP, which was revealed by the results shared in the detached leaf test (Figure 8A) and the living plant test (Figure 8B).
In order to elucidate the role of SA- and JA-mediated signaling pathways in T30:GFP-, ∆thph2:GFP-, and OEthph2:GFP-induced maize resistance, we detected the expression of seven well-defined defense-related genes in maize. Lipoxygenase (LOX) products, such as jasmonates and other oxygenated fatty acids, called oxylipins, are regarded as signals in ISR [36], and the best branches of this pathway are those started by the oxygenation of linolenic acid by 13-LOXs: the allene oxide synthase (AOS) branch and the hydroperoxide lyase (HPL) branch [37]. Therefore, the LOX5 AOS and HPL expression evaluations related to ISR were underlined in leaves grown from roots treated with the strains. In the infected OEthph2:GFP maize root, the AOS expression was significantly upregulated, while a basal expression level was detected in plants treated with T30:GFP or ∆thph2:GFP, and the ZmPR4 expression was similar to that of AOS. For HPL, the expression level for OEthph2:GFP was higher than for ∆thph2:GFP and T30:GFP (Figure 8C).
Meanwhile, we detected the SA-mediated signaling pathway genes ZmPR1, ZmPR5, and PAL in maize [38]. ZmPR1 and PAL in the treated plants were expressed at similar levels to the untreated (control) plants. For ZmPR5, the expression level of each treatment was increased, but there was no significant difference from the control group (Figure 8D).

3.7. Thph2 Protein Induces Defense Response Gene Expression in Maize

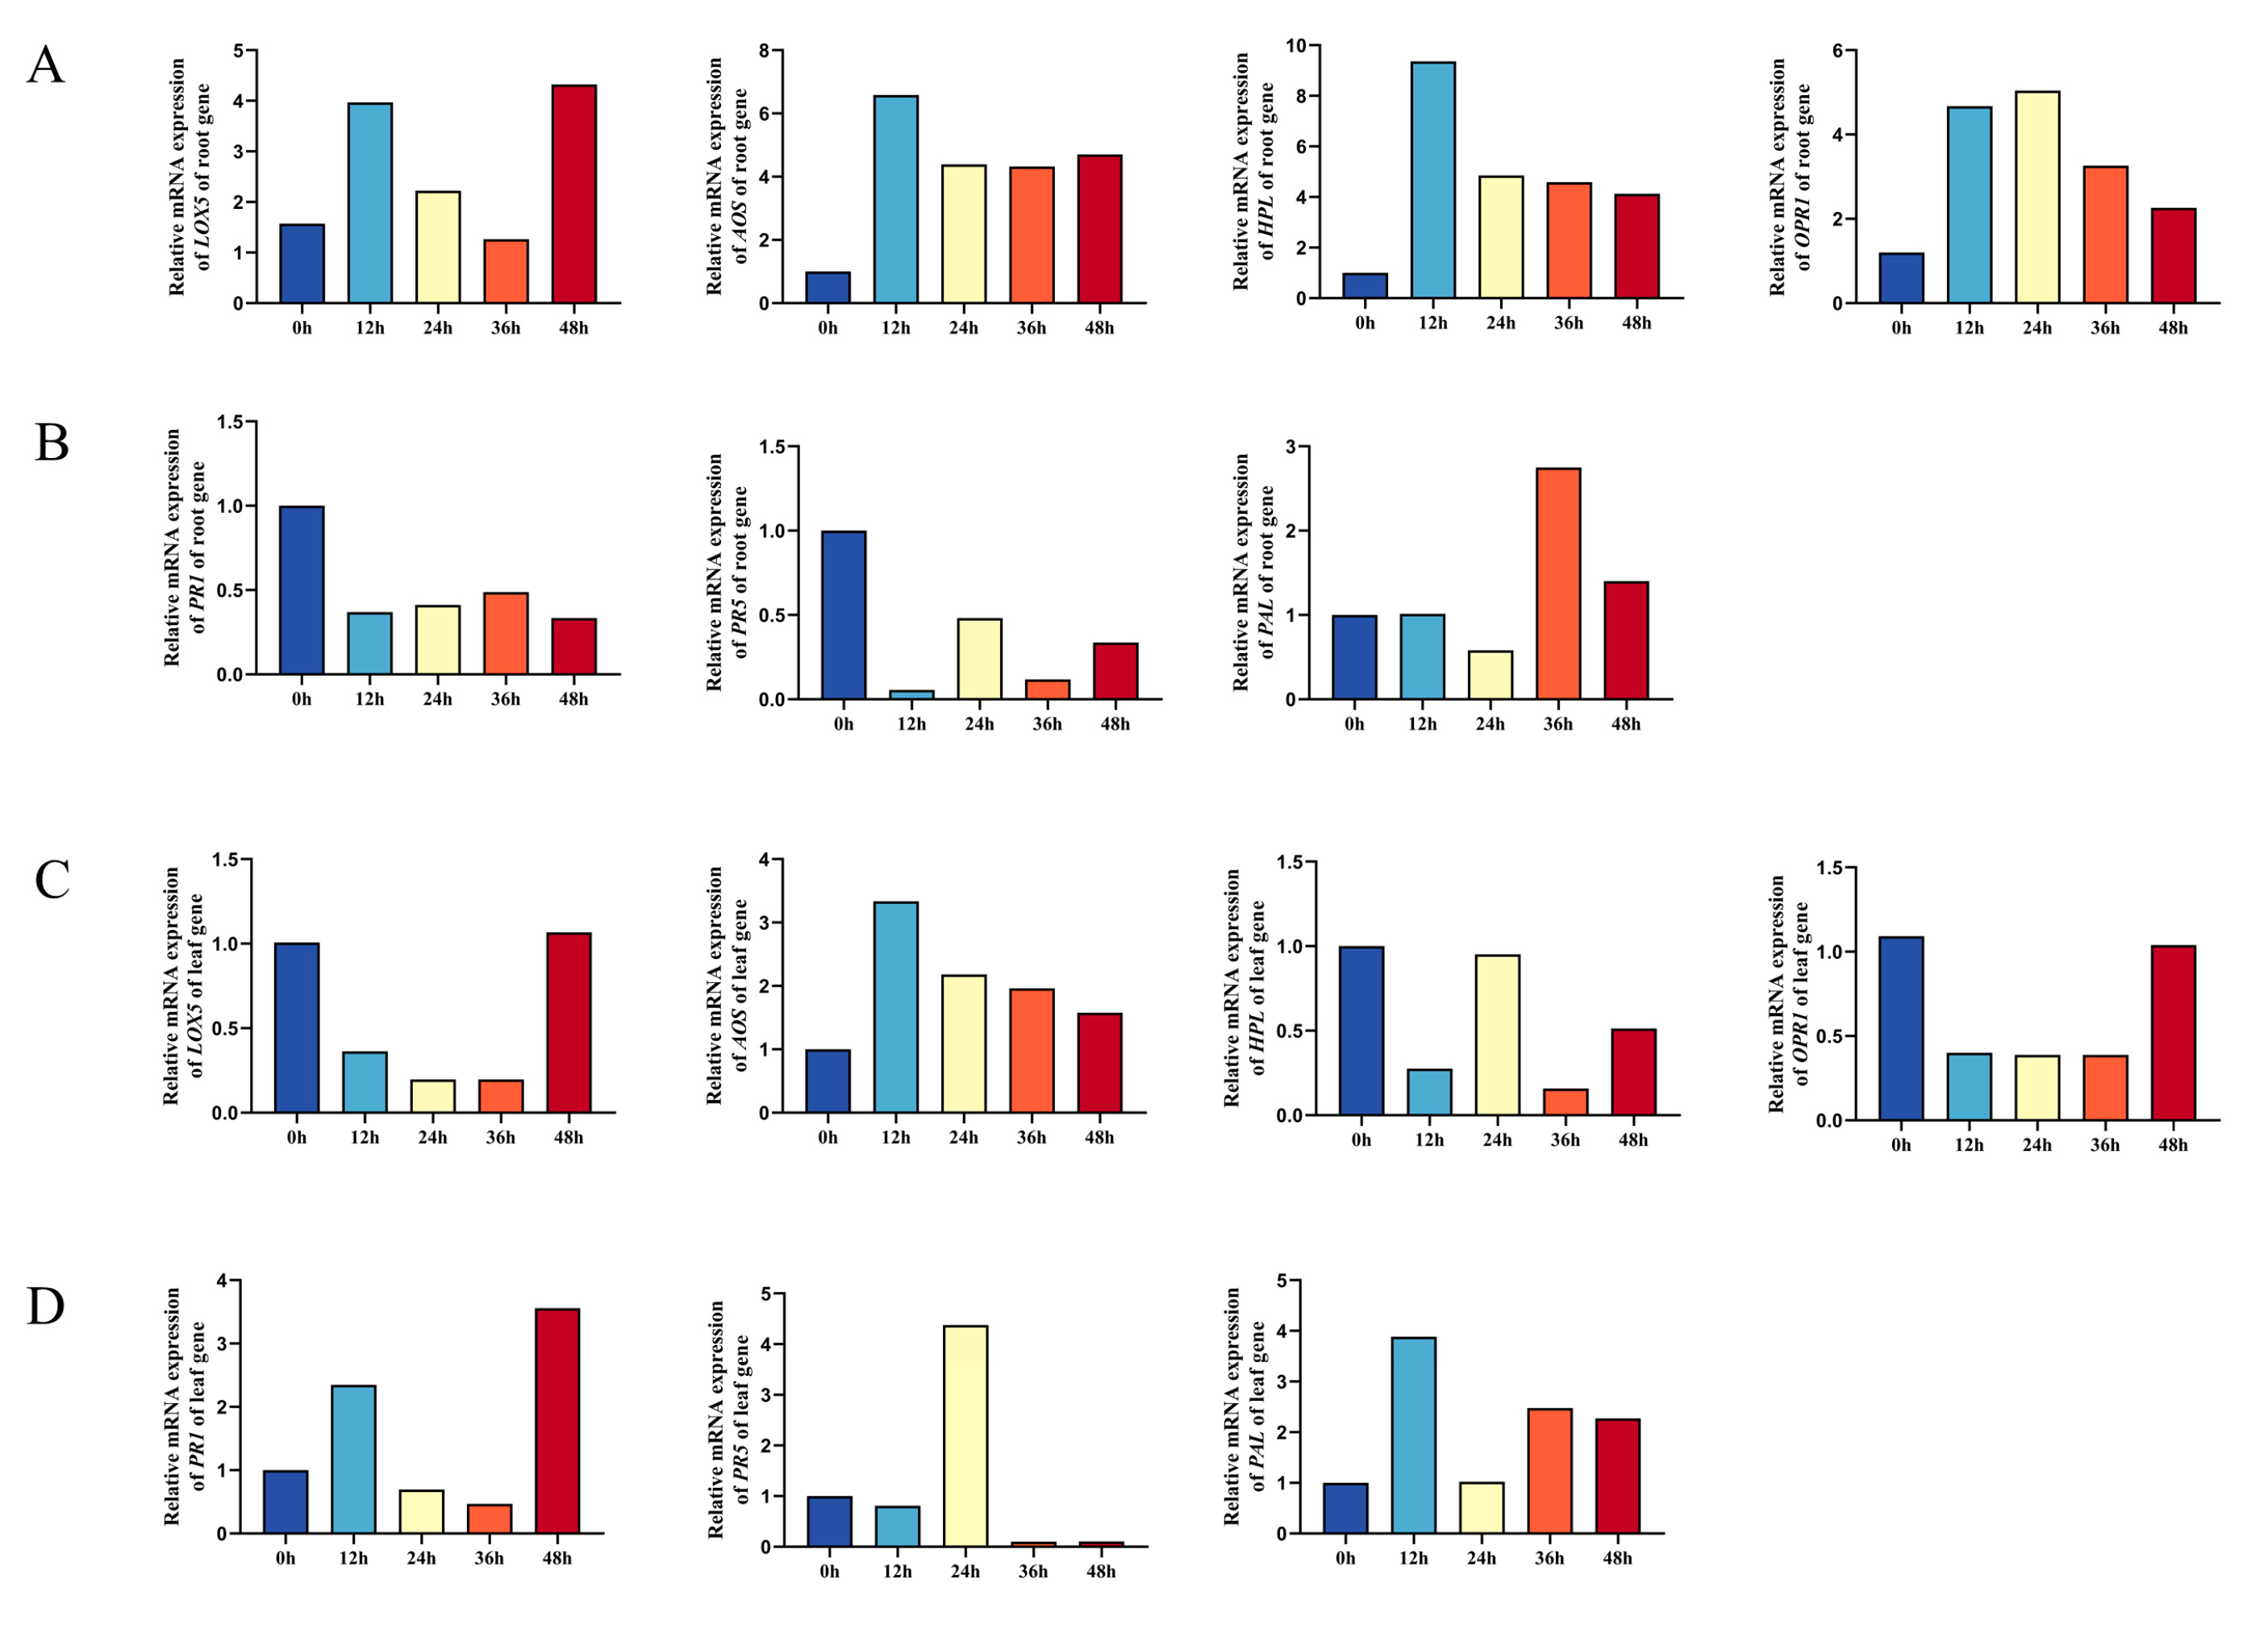
To further determine the function of thph2, we purified the pure Thph2 protein with a concentration of 10 μg/mL and inoculated each plant with 100 μL. The roots and leaves were sampled every 12 h after the inoculation. The results showed that the expression levels of AOS, HPL, LOX5, and OPR1 were significantly increased at 12 h after the inoculation, and the expression levels were the highest at 12 h (Figure 9A). The SA pathway marker genes ZmPR1, ZmPR5, and PAL were expressed very little (Figure 9B). Furthermore, it was indicated that the expression levels of AOS and LOX5 in the leaves increased but were lower than those in the roots. ZmPR1, ZmPR5, and PAL in the leaves were expressed to varying degrees. As a result, it was concluded that the Thph2 protein mainly induces high expression levels of the JA pathway genes AOS and HPL in the roots, which is similar to the results obtained for the thph2-overexpressed strains. Therefore, this confirms the role of thph2 in the ISR of maize plants against pathogen infections.

4. Discussion

Trichoderma spp. are widely distributed fungi and are commonly used as biocontrols against a range of plant diseases affecting corn [39], wheat [40], cucumbers, etc. [41]. At the same time, Trichoderma can produce resistance by secreting inductance effectors and interacting with plant roots. Based on previous studies, we previously reported that a C6 zinc finger protein (Thc6) regulates two hydrolase genes, thph1 and thph2, to induce ISR responses in maize from the roots to the leaves. In this study, we constructed the T. harzianum mutants T30:GFP, ∆thph2:GFP, and OEthph2:GFP, representing the wildtype, thph2-deletion, and thph2-overexpression strains, respectively.
By detecting the sporulation level of the thph2 mutants, it was determined that the OEthph2:GFP mutant yielded significantly fewer spores than T30:GFP, and the spore number yielded by ∆thph2:GFP was slightly higher than that of T30:GFP. It may be related to random integration with the OEthph2:GFP vector. In the plate confrontation assays of Trichoderma with F. graminearum, C. heterostrophus, and F. verticilloides, it was found that the inhibition rate of OEthph2:GFP was higher than that of T30:GFP and significantly higher than that of ∆thph2:GFP against the different tested pathogens.
A high expression of celluase may benefit the cell-wall-cellulose degradation of some pathogens. Even though there are fewer cellulose components in fungal pathogens, the comparatively high cellulase gene expression of Trichoderma would be more significant for breaking down oomycete cell walls, where cellulose is the dominant component. However, it may by possible that Trichoderma thph2 indirectly improves the antagonistic substance production by obtaining more glucose from the medium. Since fungal-cell-wall-degrading enzymes include glucanase [42], chitinase [43], mannanase [44,45], etc., it was speculated that the overexpression of thph2 may increase the activities of several CWDEs, such as chitinase and glucanase, in some unknown ways, which can promote the degradation of the cell wall of pathogens and inhibit their growth.
In previous studies, we observed that deletion of thph1 and thph2 reduced the colonization of Trichoderma by confocal observations [3], which was consistent with qPCR results (Figure 4C). The secretion of Thph1 cellulase in maize root was observed by immunogold electron microscopy. No detection was found in maize root treated with Δthph1 [3]. We speculate that this is the main reason for the decrease of Trichoderma colonized in maize roots. In our study, we found an interesting phenomenon where, in the interaction between Trcihoderma and the host roots, the root defense or immunity gene was first downregulated and then upregulated; interestingly, the thph2 gene was closely involved in the shift in the down- and upregulation of the defense genes in the roots. This phenomenon has already been found in other authors’ work [46]. It was implied that overexpressed thph2 in Trichoderma can somehow inhibit the host plant’s immune system at an early stage of the Trichoderma–host plant interaction, which would allow Trichoderma to colonize the roots more easily. Once Trichoderma successfully colonized the root, the thph2 gene would shift its function to support Trichoderma-induced host defense gene expression against pathogen infections. However, it is still unknown in what way thph2 is involved in the function shift.
In previous studies, we detected the lesion areas in maize leaves that were infected with Curvularia lunata, treated with WT and mutant strains in the early stage. The results showed that the area of leaf lesions increased when treated with single or double mutations of Δthph1 or Δthph2. However, the area of lesions decreased when treated with the WT strain [3]. In this study, similar results were obtained by infecting maize leaf with C. heterostrophus (Figure 8A,B). These results suggest that these genes have a significant impact on the disease resistance of maize leaves.
A group of researchers demonstrated that Trichoderma-induced resistance mainly depends on the JA/ET pathway. Opr7, ZmPr4, Aoc1, and Erf1 are confirmed to be involved in the induced resistance of maize triggered by T. harzianum [3]. The hyd1-induced systemic resistance is mainly related to brassinolactin-mediated signaling, possibly mediated by jasmonic acid/ethylene (JA/ET) signaling [47]. A series of enzymes involved in the AOS branch, including allene oxide cyclase 12-oxo-phytodienoic acid reductase (OPR) and the production of different jasmonates, is associated with plant resistance [37]. Some products of the HPL branch, including many volatile C-6 aldehydes and alcohols, or so-called green leaf volatiles (GLVs), are associated with plant disease resistance, and they act as signaling molecules in response to pathogens and pests [48,49,50]. Our study suggests that AOS may be involved in thph2-mediated defense responses in maize because AOS transcripts were upregulated by the T30:GFP and OEthph2:GFP strains but remained low in the untreated and ∆thph2:GFP-strain-treated plants. In addition, after the plants were treated with the Thph2 protein, the AOS and HPL expression levels significantly increased, while ZmPR1, ZmPR5, and PAL were almost not expressed.
Furthermore, our study showed that, in the early stages of root colonization by Trichoderma regulated by thph2, AOS and HPL were significantly expressed in the leaves when the roots were treated with the thph2-overexpressed Trichoderma strain, which indicated that thph2 contributed to the induced systemic resistance achieved by promoting long-distance signal transduction from the roots to the leaves. The phenomenon has also been confirmed by the work conducted by Chuanjin Yu et al. [47]. In summary, the experimental results suggest that T. harzianum thph2 induced systemic resistance in maize through an ISR mechanism of the JA/ET-mediated signaling pathway.

5. Conclusions

In this study, we found that thph2 was negatively correlated with the number of spores produced by fungi and positively correlated with the growth rate of mycelia. At the same time, we also found that thph2 could affect the colonization of T. harzianum in plant roots through two stages of interaction: in the early stage, Trichoderma inhibited the defense gene expression of maize roots, allowing Trichoderma to achieve fast colonization inside the root tissue, and in the second stage, thph2 shifted its function to elicit maize root defense against pathogen infections. AOS and HPL were the main defense genes in maize that were sensitive to the thph2 of the Trichoderma action. Therefore, we preliminarily concluded that thph2 could promote the colonization of maize roots by T. harzianum and promote ISR at the same time. In the later colonization period, the expression of the SA pathway marker genes ZmPR1, ZmPR5, and PAL increased. The JA pathway marker genes AOS and HPL were expressed in maize leaves when the roots were inoculated with different Trichoderma mutants. The treatment of maize roots with the Thph2 protein also confirmed that the thph2 of T. harzianum is involved in the systemic defense gene expression from the roots to the leaves in maize, where the Trichoderma-thph2-induced and JA-mediated pathways in maize might be dominant against foliar diseases.

Supplementary Materials

The following supporting information can be downloaded at: https://www.mdpi.com/article/10.3390/jof9121168/s1, Table S1, Primers used in this study.

Author Contributions

Conceptualization, review, and editing, J.C. and B.L.; methodology and writing—original draft preparation, J.C. and B.L. All authors have read and agreed to the published version of the manuscript.

Funding

Funding was provided by the Shanghai Science and Technology Innovation Action Program of the Shanghai Science and Technology Commission (21N41900200); the Shanghai Agriculture Applied Technology Development Program (2022-02-08-00-12-F0-01143); and the China Agriculture Research System of MOF and MAR, the National Key R&D Program of China (2017YFD0200403).

Institutional Review Board Statement

Not applicable.

Informed Consent Statement

Not applicable.

Data Availability Statement

Data will be available upon request.

Acknowledgments

The authors acknowledge the technical support by the State Key Laboratory of Microbial Metabolism, Shanghai Jiao Tong University.

Conflicts of Interest

The authors declare no conflict of interest. The funders had no role in the design of the study; in the collection, analyses, or interpretation of data; in the writing of the manuscript; or in the decision to publish the results.

References

  1. Harman, G.E.; Howell, C.R.; Viterbo, A.; Chet, I.; Lorito, M. Trichoderma Species-Opportunistic, Avirulent Plant Symbionts. Nat. Rev. Microbiol. 2004, 2, 43–56. [Google Scholar] [CrossRef]
  2. Hermosa, R.; Viterbo, A.; Chet, I.; Monte, E. Plant-Beneficial Effects of Trichoderma and of Its Genes. Microbiology 2012, 158, 17–25. [Google Scholar] [CrossRef]
  3. Saravanakumar, K.; Fan, L.; Fu, K.; Yu, C.; Wang, M.; Xia, H.; Sun, J.; Li, Y.; Chen, J. Cellulase from Trichoderma harzianum Interacts with Roots and Triggers Induced Systemic Resistance to Foliar Disease in Maize. Sci. Rep. 2016, 6, 35543. [Google Scholar] [CrossRef]
  4. Nawrocka, J.; Małolepsza, U. Diversity in Plant Systemic Resistance Induced by Trichoderma. Biol. Control 2013, 67, 149–156. [Google Scholar] [CrossRef]
  5. Fernández, E.; Segarra, G.; Trillas, M.I. Physiological Effects of the Induction of Resistance by Compost or Trichoderma asperellum Strain T34 against Botrytis cinerea in Tomato. Biol. Control 2014, 78, 77–85. [Google Scholar] [CrossRef]
  6. Chen, J. Recent progress in studies on disease resistance induced by Trichoderma. Chin. J. Biol. Control 2015, 31, 733–741. [Google Scholar] [CrossRef]
  7. Salas-Marina, M.A.; Isordia-Jasso, M.I.; Islas-Osuna, M.A.; Delgado-Sánchez, P.; Jiménez-Bremont, J.F.; RodrÃguez-Kessler, M.; Rosales-Saavedra, M.T.; Herrera-Estrella, A.; Casas-Flores, S. The Epl1 and Sm1 Proteins from Trichoderma atroviride and Trichoderma virens Differentially Modulate Systemic Disease Resistance against Different Life Style Pathogens in Solanum Lycopersicum. Front. Plant Sci. 2015, 6, 77. [Google Scholar] [CrossRef]
  8. Djonović, S.; Vargas, W.A.; Kolomiets, M.V.; Horndeski, M.; Wiest, A.; Kenerley, C.M. A Proteinaceous Elicitor Sm1 from the Beneficial Fungus Trichoderma virens Is Required for Induced Systemic Resistance in Maize. Plant Physiol. 2007, 145, 875–889. [Google Scholar] [CrossRef] [PubMed]
  9. Gaderer, R.; Lamdan, N.L.; Frischmann, A.; Sulyok, M.; Krska, R.; Horwitz, B.A.; Seidl-Seiboth, V. Sm2, a Paralog of the Trichoderma Cerato-Platanin Elicitor Sm1, Is Also Highly Important for Plant Protection Conferred by the Fungal-Root Interaction of Trichoderma with Maize. BMC Microbiol. 2015, 15, 2. [Google Scholar] [CrossRef] [PubMed]
  10. Morán-Diez, E.; Hermosa, R.; Ambrosino, P.; Cardoza, R.E.; Gutiérrez, S.; Lorito, M.; Monte, E. The ThPG1 Endopolygalacturonase Is Required for the Trichoderma harzianum-Plant Beneficial Interaction. MPMI 2009, 22, 1021–1031. [Google Scholar] [CrossRef]
  11. Bhat, M.K. Cellulases and Related Enzymes in Biotechnology. Biotechnol. Adv. 2000, 18, 355–383. [Google Scholar] [CrossRef]
  12. Boisset, C.; Fraschini, C.; Schülein, M.; Henrissat, B.; Chanzy, H. Imaging the Enzymatic Digestion of Bacterial Cellulose Ribbons Reveals the Endo Character of the Cellobiohydrolase Cel6A from Humicola Insolens and Its Mode of Synergy with Cellobiohydrolase Cel7A. Appl. Environ. Microbiol. 2000, 66, 1444–1452. [Google Scholar] [CrossRef] [PubMed]
  13. Cheng, C.; Tsukagoshi, N.; Udaka, S. Nucleotide Sequence of the Cellobiohydrolase Gene from Trichoderma viride. Nucl. Acids Res. 1990, 18, 5559. [Google Scholar] [CrossRef] [PubMed]
  14. Wang, B.; Xia, L. High Efficient Expression of Cellobiase Gene from Aspergillus Niger in the Cells of Trichoderma reesei. Bioresour. Technol. 2011, 102, 4568–4572. [Google Scholar] [CrossRef] [PubMed]
  15. Chisholm, S.T.; Coaker, G.; Day, B.; Staskawicz, B.J. Host-Microbe Interactions: Shaping the Evolution of the Plant Immune Response. Cell 2006, 124, 803–814. [Google Scholar] [CrossRef] [PubMed]
  16. Katiyar-Agarwal, S.; Jin, H. Role of Small RNAs in Host-Microbe Interactions. Annu. Rev. Phytopathol. 2010, 48, 225–246. [Google Scholar] [CrossRef] [PubMed]
  17. Boller, T.; Felix, G. A Renaissance of Elicitors: Perception of Microbe-Associated Molecular Patterns and Danger Signals by Pattern-Recognition Receptors. Annu. Rev. Plant Biol. 2009, 60, 379–406. [Google Scholar] [CrossRef]
  18. Jones, J.D.G.; Dangl, J.L. The Plant Immune System. Nature 2006, 444, 323–329. [Google Scholar] [CrossRef]
  19. Rubartelli, A.; Lotze, M.T. Inside, Outside, Upside down: Damage-Associated Molecular-Pattern Molecules (DAMPs) and Redox. Trends. Immunol. 2007, 28, 429–436. [Google Scholar] [CrossRef]
  20. Lorito, M.; Woo, S.L.; Harman, G.E.; Monte, E. Translational Research On Trichoderma: From ’Omics to the Field. Annu. Rev. Phytopathol. 2010, 48, 395–417. [Google Scholar] [CrossRef]
  21. Wu, S.; Shan, L.; He, P. Microbial Signature-Triggered Plant Defense Responses and Early Signaling Mechanisms. Plant. Sci. 2014, 228, 118–126. [Google Scholar] [CrossRef] [PubMed]
  22. Conrath, U. Systemic Acquired Resistance. Plant Signal. Behav. 2006, 1, 179–184. [Google Scholar] [CrossRef]
  23. Glazebrook, J. Contrasting Mechanisms of Defense Against Biotrophic and Necrotrophic Pathogens. Annu. Rev. Phytopathol. 2005, 43, 205–227. [Google Scholar] [CrossRef]
  24. Ton, J.; Van Pelt, J.A.; Van Loon, L.C.; Pieterse, C.M.J. Differential Effectiveness of Salicylate-Dependent and Jasmonate/Ethylene-Dependent Induced Resistance in Arabidopsis. MPMI 2002, 15, 27–34. [Google Scholar] [CrossRef] [PubMed]
  25. Nogueira-Lopez, G.; Greenwood, D.R.; Middleditch, M.; Winefield, C.; Eaton, C.; Steyaert, J.M.; Mendoza-Mendoza, A. The Apoplastic Secretome of Trichoderma virens during Interaction with Maize Roots Shows an Inhibition of Plant Defence and Scavenging Oxidative Stress Secreted Proteins. Front. Plant Sci. 2018, 9, 409. [Google Scholar] [CrossRef]
  26. Karuppiah, V.; Sun, J.; Li, T.; Vallikkannu, M.; Chen, J. Co-Cultivation of Trichoderma asperellum GDFS1009 and Bacillus amyloliquefaciens 1841 Causes Differential Gene Expression and Improvement in the Wheat Growth and Biocontrol Activity. Front. Microbiol. 2019, 10, 1068. [Google Scholar] [CrossRef] [PubMed]
  27. Contreras-Cornejo, H.A.; Macías-Rodríguez, L.; del-Val, E.; Larsen, J. Ecological Functions of Trichoderma spp. and Their Secondary Metabolites in the Rhizosphere: Interactions with Plants. FEMS Microbiol. Ecol. 2016, 92, fiw036. [Google Scholar] [CrossRef] [PubMed]
  28. Fu, K.; Fan, L.; Li, Y.; Gao, S.; Chen, J. Tmac1, a Transcription Factor Which Regulated High Affinity Copper Transport in Trichoderma reesei. Microbiol. Res. 2012, 167, 536–543. [Google Scholar] [CrossRef]
  29. de Groot, M.J.; Bundock, P.; Hooykaas, P.J.; Beijersbergen, A.G. Agrobacterium tumefaciens-mediated transformation of filamentous fungi. Nat. Biotechnol. 1998, 16, 839–842. [Google Scholar] [CrossRef]
  30. Southern, E. Southern Blotting. Nat. Protoc. 2006, 1, 518–525. [Google Scholar] [CrossRef]
  31. Latif, S.; Gottschamel, J.; Syed, T.; Younus, I.; Gull, K.; Sameeullah, M.; Batool, N.; Lössl, A.G.; Mariz, F.; Müller, M.; et al. Inducible Expression of Human Papillomavirus-16 L1 Capsomeres in the Plastomes of Nicotiana Tabacum: Transplastomic Plants Develop Normal Flowers and Pollen. Biotechnol. Appl. Biochem. 2021, 69, 596–611. [Google Scholar] [CrossRef]
  32. Hao, D.; Lang, B.; Wang, Y.; Wang, X.; Liu, T.; Chen, J. Designing Synthetic Consortia of Trichoderma Strains That Improve Antagonistic Activities against Pathogens and Cucumber Seedling Growth. Microb. Cell Fact. 2022, 21, 234. [Google Scholar] [CrossRef]
  33. Lawry, R. Cross-Communication between Trichoderma and Plants during Root Colonisation. Ph.D. Thesis, Lincoln University, Philadelphia, PA, USA, 2016. [Google Scholar]
  34. Torres, A.M.; Weeden, N.F.; Martín, A. Linkage among Isozyme, RFLP and RAPD Markers in Vicia Faba. Theoret. Appl. Genet. 1993, 85, 937–945. [Google Scholar] [CrossRef]
  35. Livak, K.J.; Schmittgen, T.D. Analysis of Relative Gene Expression Data Using Real-Time Quantitative PCR and the 2−ΔΔCT Method. Methods 2001, 25, 402–408. [Google Scholar] [CrossRef]
  36. Conrath, U.; Beckers, G.J.M.; Flors, V.; García-Agustín, P.; Jakab, G.; Mauch, F.; Newman, M.-A.; Pieterse, C.M.J.; Poinssot, B.; Pozo, M.J.; et al. Priming: Getting Ready for Battle. MPMI 2006, 19, 1062–1071. [Google Scholar] [CrossRef] [PubMed]
  37. Feussner, I.; Wasternack, C. The Lipoxygenase Pathway. Annu. Rev. Plant Biol. 2002, 53, 275–297. [Google Scholar] [CrossRef] [PubMed]
  38. Farag, M.A.; Fokar, M.; Abd, H.; Zhang, H.; Allen, R.D.; Par, P.W. (Z)-3-Hexenol Induces Defense Genes and Downstream Metabolites in Maize. Planta 2004, 220, 900–909. [Google Scholar] [CrossRef]
  39. Tang, S. Study on the Application of Trichoderma in Biological Control of Maize Diseases. Agric. Technol. Equip. 2022, 3, 91–92+95. [Google Scholar]
  40. Li, L.; Liu, B.; Yang, K.; Zhao, Z.; Chen, K.; Li, H.; Li, S. Control Effects of Trichoderma Strains against Wheat Powdery Mildew in Field. Shandong Agric. Sci. 2021, 53, 96–100. [Google Scholar] [CrossRef]
  41. Ma, G.; Liang, N.; Li, M.; Liu, M.; Chen, Y.; Lian, H. Effect of Trichoderma on Cucumber Damping-off and Physiological Characteristics. Chin. J. Biol. Control 2021, 37, 277–285. [Google Scholar] [CrossRef]
  42. Balasubramanian, V.; Vashisht, D.; Cletus, J.; Sakthivel, N. Plant β-1,3-Glucanases: Their Biological Functions and Transgenic Expression against Phytopathogenic Fungi. Biotechnol. Lett. 2012, 34, 1983–1990. [Google Scholar] [CrossRef] [PubMed]
  43. Grover, A. Plant Chitinases: Genetic Diversity and Physiological Roles. CRC. Crit. Rev. Plant. Sci. 2012, 31, 57–73. [Google Scholar] [CrossRef]
  44. Chauhan, P.S.; Puri, N.; Sharma, P.; Gupta, N. Mannanases: Microbial Sources, Production, Properties and Potential Biotechnological Applications. Appl. Microbiol. Biotechnol. 2012, 93, 1817–1830. [Google Scholar] [CrossRef]
  45. Dhawan, S.; Kaur, J. Microbial Mannanases: An Overview of Production and Applications. Crit. Rev. Biotechnol. 2007, 27, 197–216. [Google Scholar] [CrossRef]
  46. Zhou, X.; Wang, J.; Liu, F.; Liang, J.; Zhao, P.; Tsui, C.K.M.; Cai, L. Cross-Kingdom Synthetic Microbiota Supports Tomato Suppression of Fusarium Wilt Disease. Nat. Commun. 2022, 13, 7890. [Google Scholar] [CrossRef] [PubMed]
  47. Jin, Y.; Dou, K.; Wang, S.; Wu, Q.; Ni, M.; Zhang, T.; Lu, Z.; Tang, J.; Chen, J. Elicitor Hydrophobin Hyd1 Interacts with Ubiquilin1-like to Induce Maize Systemic Resistance. J. Integr. Plant Biol. 2019, 62, 509–526. [Google Scholar] [CrossRef]
  48. Matsui, K. Green Leaf Volatiles: Hydroperoxide Lyase Pathway of Oxylipin Metabolism. Curr. Opin. Plant. Biol. 2006, 9, 274–280. [Google Scholar] [CrossRef]
  49. Zhang, J.; Simmons, C.; Yalpani, N.; Crane, V.; Wilkinson, H.; Kolomiets, M. Genomic Analysis of the 12-Oxo-Phytodienoic Acid Reductase Gene Family of Zea Mays. Plant Mol. Biol. 2005, 59, 323–343. [Google Scholar] [CrossRef]
  50. Mei, C.; Qi, M.; Sheng, G.; Yang, Y. Inducible Overexpression of a Rice Allene Oxide Synthase Gene Increases the Endogenous Jasmonic Acid Level, PR Gene Expression, and Host Resistance to Fungal Infection. MPMI 2006, 19, 1127–1137. [Google Scholar] [CrossRef]
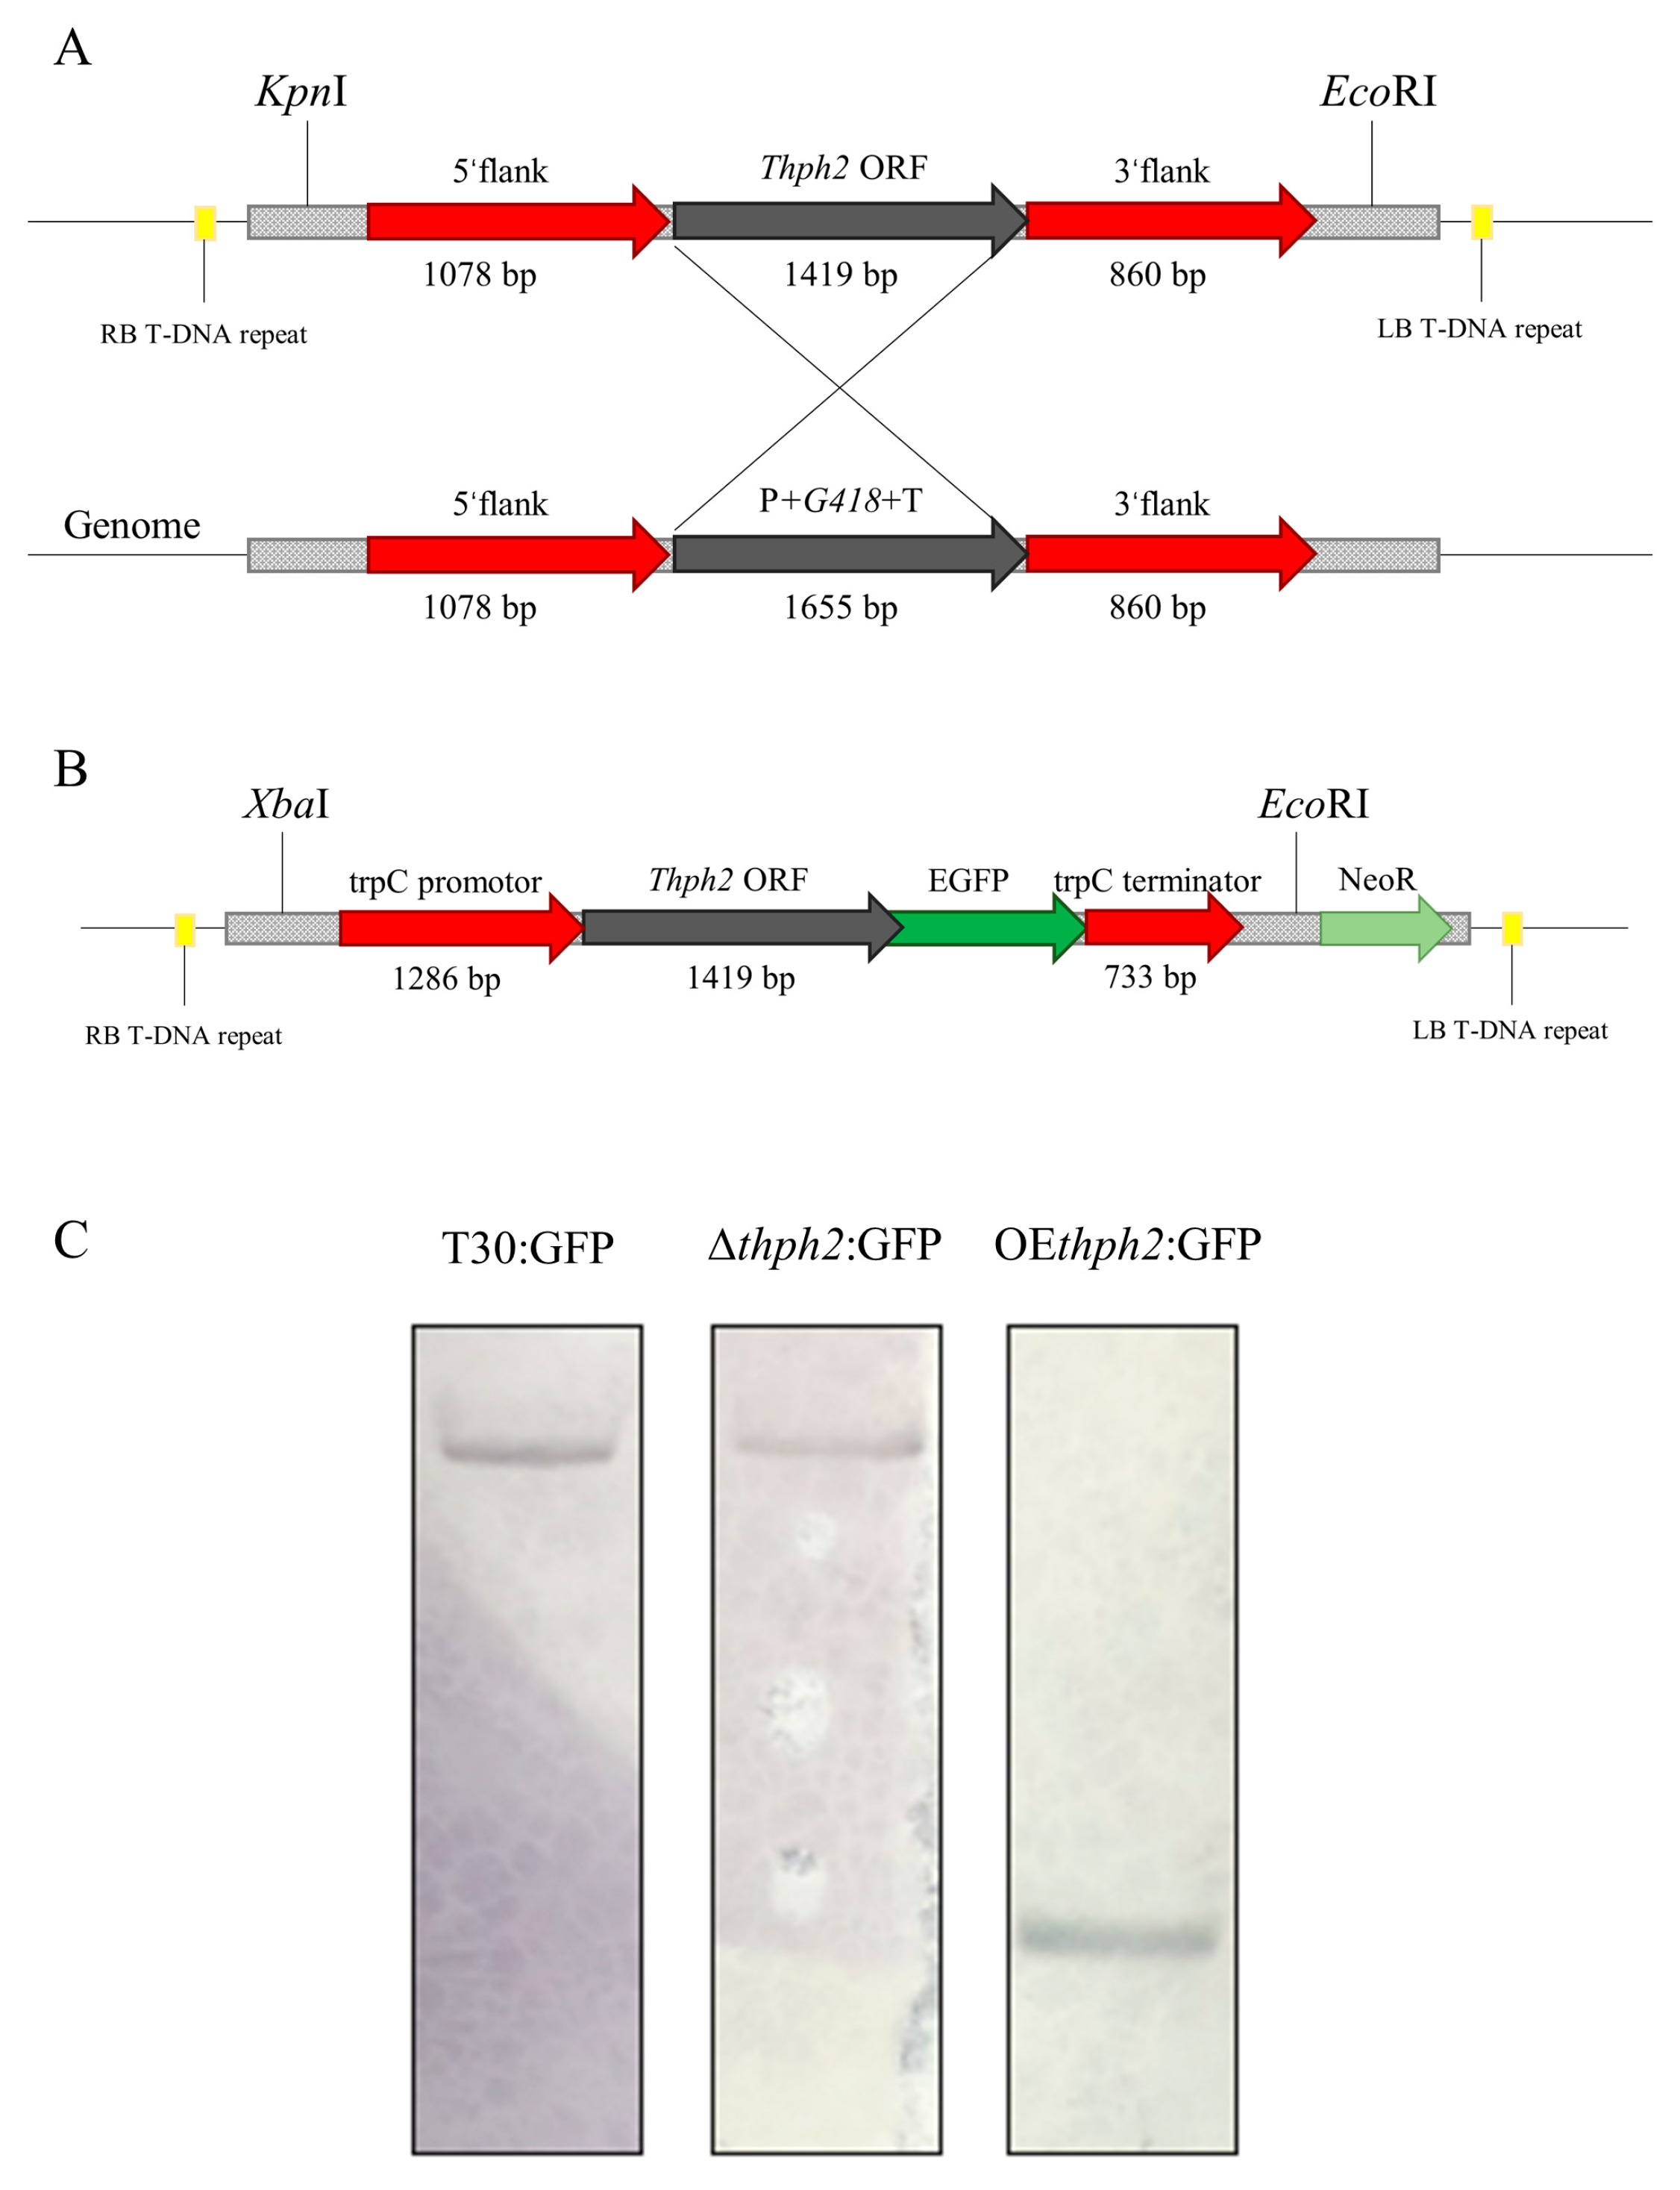
Figure 1. Construction and identification of thph2-deletion and -overexpression transformants. (A) Schematic diagram of gene-deletion scheme construction. (B) Schematic diagram of gene-overexpression scheme construction. (C) Southern blotting detected the copy number of G418. All the transformed strains contained the marker gene G418 on the plasmid, which could be used as a probe to verify the copy number of the transformed strains.
Jof 09 01168 g001
Figure 2. Expression of thph2 in transformants. The expression of thph2 was different in different mutants. The data are the means of 5 replicates for each treatment. The asterisk (*) represents a significant difference between the transformants and T30:GFP based on ANOVA (significance: **** p ≤ 0.0001).
Jof 09 01168 g002
Figure 3. Evaluation of growth, reproduction, and phenotype. (A) The growth phenotype difference among different strains. (B) The spore output difference among different strains. (C) Rate of mycelium growth difference among different strains. The data are the means of 15 replicates for each treatment. The asterisk (*) represents a significant difference between the transformants and T30:GFP based on ANOVA (significance: ** p ≤ 0.01).
Jof 09 01168 g003
Figure 4. Evaluation of the antagonism of different Trichederma mutant strains toward pathogens. (A) Antagonistic plate and data analysis of T30:GFP, ∆thph2:GFP, and OEthph2:GFP against F. verticilloides. (B) Antagonistic plate and data analysis of T30:GFP, ∆thph2:GFP, and OEthph2:GFP against F. graminearum. (C) Antagonistic plate and data analysis of T30:GFP, ∆thph2:GFP, and OEthph2:GFP against C. heterostrophus. The results are the means of 5 replicates for each treatment. The asterisk (*) represents a significant difference between the transformants and T30:GFP (p < 0.05) based on ANOVA (significance: * p ≤ 0.05, ** p ≤ 0.01).
Jof 09 01168 g004aJof 09 01168 g004b
Figure 5. Colonization by T30:GFP, ∆thph2:GFP, and OEthph2:GFP in the roots of maize plants. (A) After 3 days of inoculation, the colonization rate of fungal DNA and plant DNA was determined by qRT-PCR. (B) After 1 day, 3 days, and 5 days of inoculation, the heat map of the colonization rate of fungal DNA and plant DNA was determined by qRT-PCR. The results are the means of 6 replicates for each treatment, and 3 biological replicates were performed (significance: **** p ≤ 0.0001; ns: no significance).
Jof 09 01168 g005
Figure 6. Expression of defense response genes in maize roots after colonization by Trichoderma. (A) Expression analysis of maize-root-related defense response genes ZmAOS and ZmHPL (JA) and ZmPR1 and ZmPR5 (SA) 1 day after inoculation. (B) Expression analysis of maize-root-related defense response genes ZmAOS and ZmHPL (JA) and ZmPR1 and ZmPR5 (SA) 3 days after inoculation. (C) Expression analysis of maize-root-related defense response genes ZmAOS and ZmHPL (JA) and ZmPR1 and ZmPR5 (SA) 5 days after inoculation. The results are the means of 6 replicates for each treatment, and 3 biological replicates were performed (significance: * p ≤ 0.05, ** p ≤ 0.01, *** p ≤ 0.001, **** p ≤ 0.0001; ns: no significance).
Jof 09 01168 g006
Figure 7. Expression of defense response genes in maize leaves after colonization by Trichoderma. (A) Expression analysis of maize-root-related defense response genes ZmAOS and ZmHPL (JA) and ZmPR1 and ZmPR5 (SA) 1 day after inoculation. (B) Expression analysis of maize-root-related defense response genes ZmAOS and ZmHPL (JA) and ZmPR1 and ZmPR5 (SA) 3 days after inoculation. (C) Expression analysis of maize-root-related defense response genes ZmAOS and ZmHPL (JA) and ZmPR1 and ZmPR5 (SA) 5 days after inoculation. The results are the means of 6 replicates for each treatment, and 3 biological replicates were performed (significance: * p ≤ 0.05, ** p ≤ 0.01, *** p ≤ 0.001; ns: no significance).
Jof 09 01168 g007
Figure 8. Effect of T30:GFP, ∆thph2:GFP, and OEthph2:GFP strains on ISR in maize seedlings to C. heterostrophus and expression of defense-related genes in the leaves of T30:GFP-, ∆thph2:GFP-, and OEthph2:GFP-strain-induced maize plants challenged with C. heterostrophus. (A) Phenotypic map and data analysis of maize leaves inoculated in vitro with different mutant strains. (B) Phenotypic map and data analysis of maize leaves inoculated with different mutant strains by a live inoculation. (C) LOX5, HPL, AOS, and OPR1 gene expression at 36 h after the inoculation of C. heterostrophus. (D) ZmPR1, ZmPR5, and PAL gene expression at 36 h after the inoculation of C. heterostrophus. The results are the means of 5 replicates for each treatment; the value is the standard error of the mean. Different letters above the bars indicate significant differences based on ANOVA (significance: * p ≤ 0.05, ** p ≤ 0.01, **** p ≤ 0.0001; ns: no significance).
Jof 09 01168 g008
Figure 9. Thph2 protein induced defense response gene expression in maize roots and leaves. (A) Thph2 protein induced the expression of the defense response genes LOX5, AOS, HPL, and OPR1 in maize roots. (B) Thph2 protein induced the expression of the defense response genes ZmPR1, ZmPR5, and PAL in maize roots. (C) Thph2 protein induced the expression of the defense response genes LOX5, AOS, HPL, and OPR1 in maize leaves. (D) Thph2 protein induced the expression of the defense response genes ZmPR1, ZmPR5, and PAL in maize leaves. The results are the means of 6 replicates for each treatment, and 3 biological replicates were performed.
Jof 09 01168 g009
Disclaimer/Publisher’s Note: The statements, opinions and data contained in all publications are solely those of the individual author(s) and contributor(s) and not of MDPI and/or the editor(s). MDPI and/or the editor(s) disclaim responsibility for any injury to people or property resulting from any ideas, methods, instructions or products referred to in the content.