
Volatile Organic Compound Profile Fingerprints Using DART–MS Shows Species-Specific Patterns in Fusarium Mycotoxin Producing Fungi


Abstract
:
1. Introduction
2. Materials and Methods
2.1. Fungal Isolates
2.2. Cultivation of Fusarium Isolates for VOC Profile Analysis
2.3. DART–MS Apparatus
2.4. DART–MS Analysis
2.5. Data Analysis
3. Results
3.1. DART–MS Sampling of the Headspace above Fungal Cultures Yielded Intense Ions
3.2. Inspection of Spectra from Control Cracked Maize Bottles Yielded a Distinctive Ion for the Cracked Maize Substrate
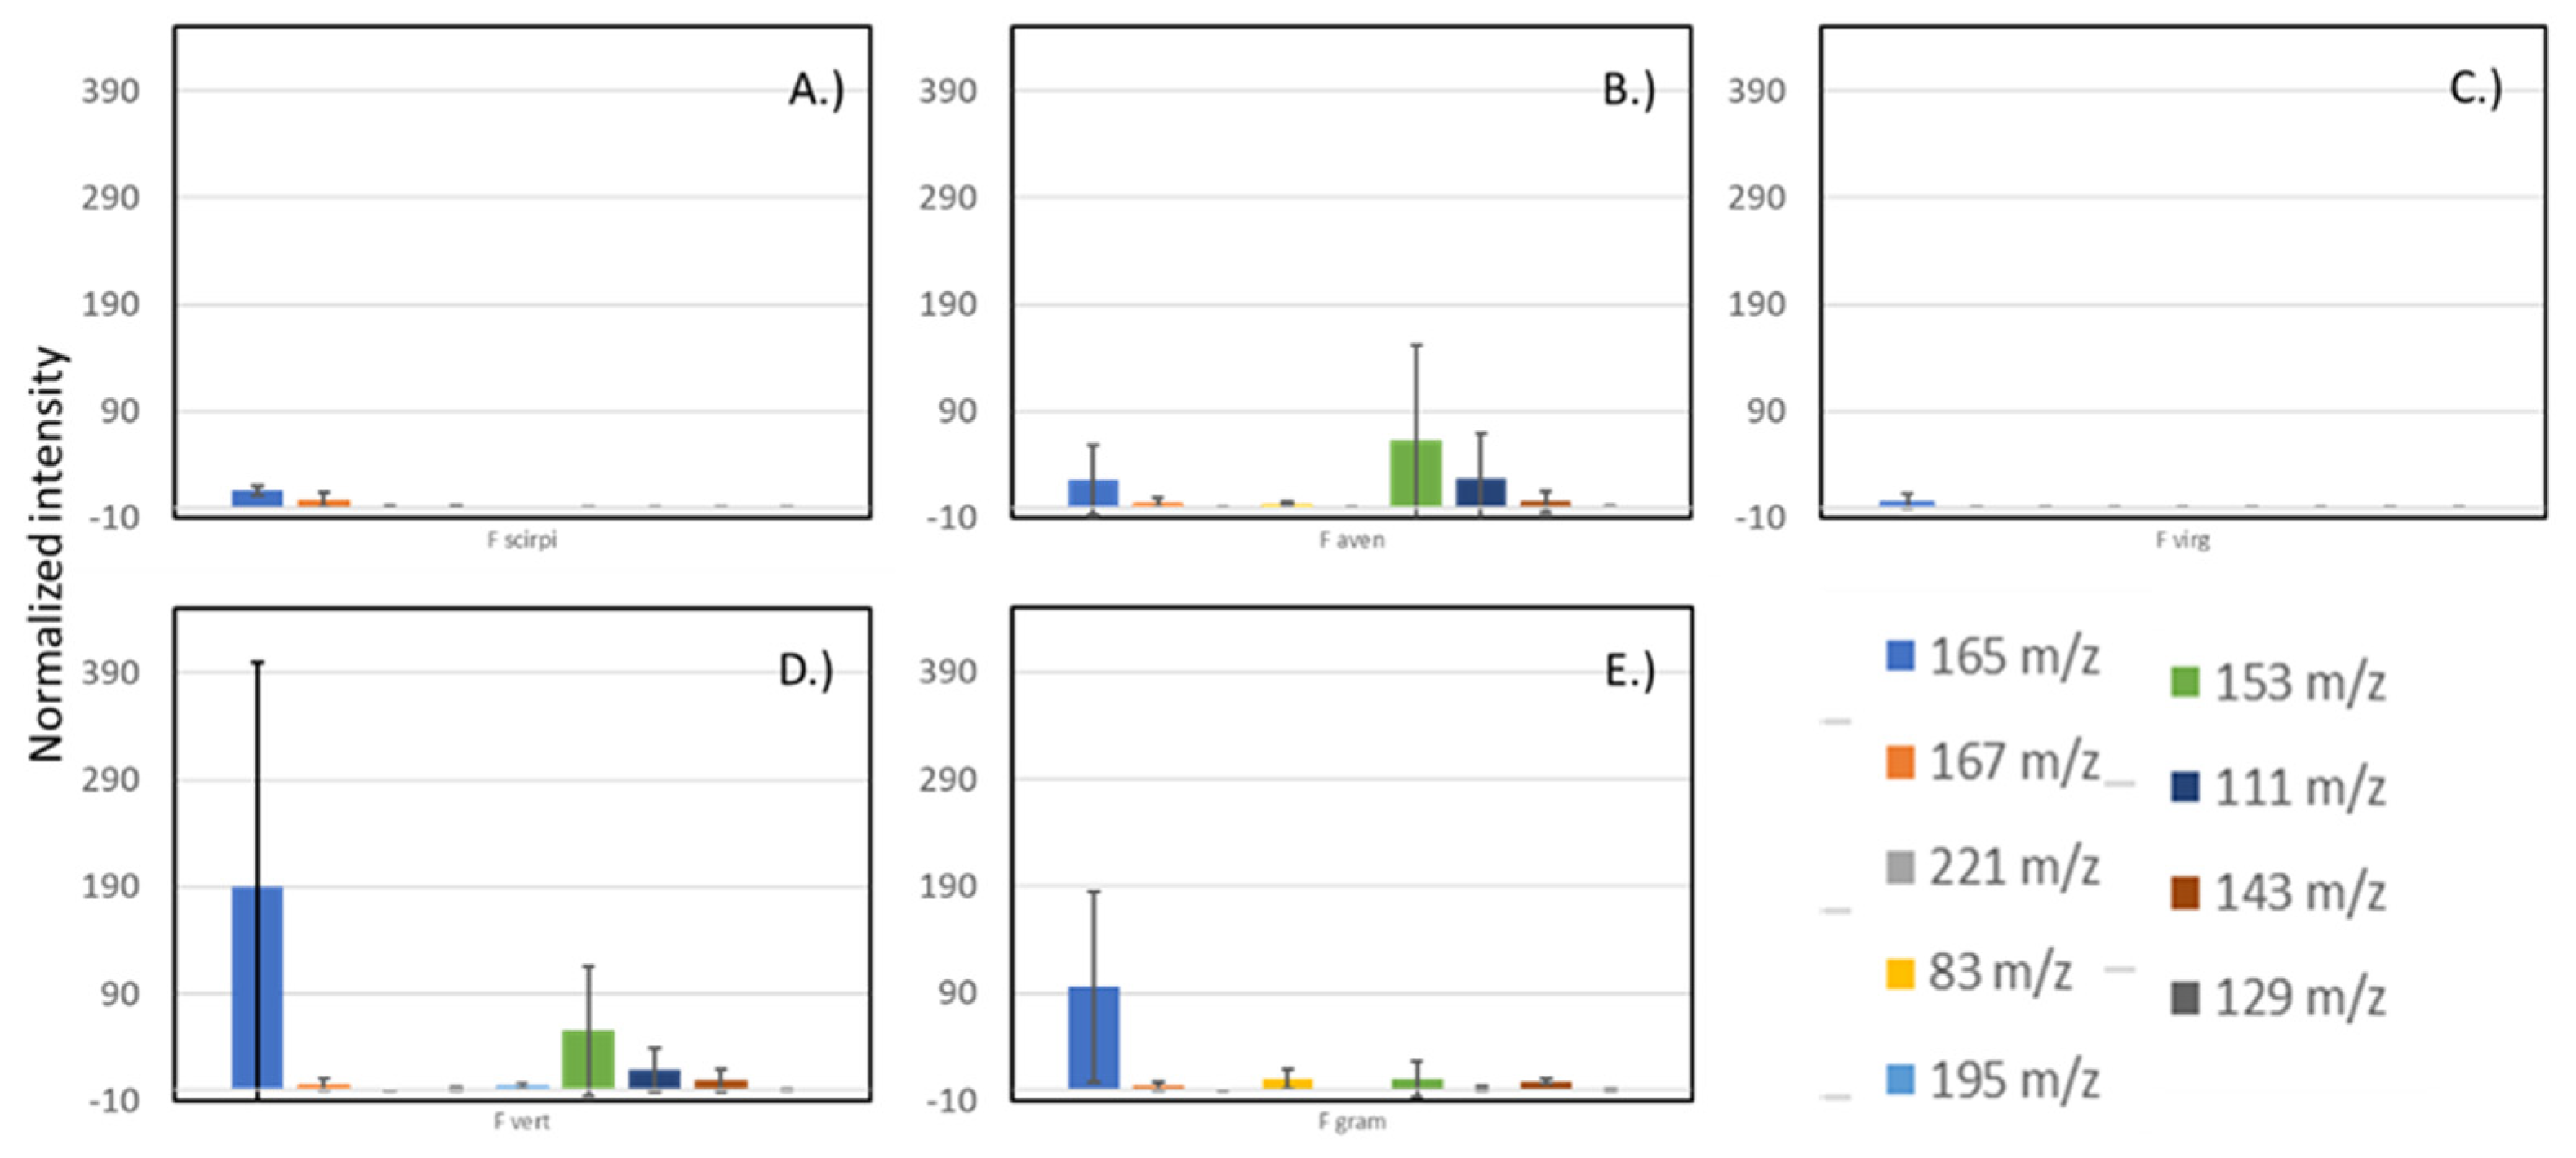
3.3. Across the Fusarium Species Sampled, There Were a Few Common Volatile Compounds Detected
4. Discussion
4.1. DART–MS as a Real Time Method for VOC Detection
4.2. All Fusarium Species May Produce a Variety of VOCs, but VOC Ion Profiles Are Species-Specific
4.3. Rapid Characterization of Fusarium Species Based upon Detected VOCs
5. Conclusions
Author Contributions
Funding
Institutional Review Board Statement
Informed Consent Statement
Data Availability Statement
Acknowledgments
Conflicts of Interest
References
- Demyttenaere, J.C.; Morina, R.M.; De Kimpe, N.; Sandra, P. Use of headspace solid-phase microextraction and headspace sorptive extraction for the detection of the volatile metabolites produced by toxigenic Fusarium species. J. Chromatogr. A 2004, 1027, 147–154. [Google Scholar] [CrossRef]
- Girotti, J.R.; Malbran, I.; Lori, G.A.; Juarez, M.P. Early detection of toxigenic Fusarium graminearum in wheat. World Mycotoxin J. 2012, 5, 143–152. [Google Scholar] [CrossRef]
- Usseglio, V.L.; Pizzolitto, R.P.; Rodriguez, C.; Zunino, M.P.; Zygadlo, J.A.; Areco, V.A.; Dambolena, J.S. Volatile organic compounds from the interaction between Fusarium verticillioides and maize kernels as a natural repellents of Sitophilus zeamais. J. Stored Prod. Res. 2017, 73, 109–114. [Google Scholar] [CrossRef]
- Busko, M.; Kulik, T.; Ostrowska, A.; Goral, T.; Perkowski, J. Quantitative volatile compound profiles in fungal cultures of three different Fusarium graminearum chemotypes. FEMS Microbiol. Lett. 2014, 359, 85–93. [Google Scholar] [CrossRef] [PubMed] [Green Version]
- Desjardins, A.E. Fusarium Mycotoxins: Chemistry, Genetics, and Biology; American Phytopathological Society Press: St Paul, MN, USA, 2006. [Google Scholar]
- Summerell, B.A. Resolving Fusarium: Current Status of the Genus. Annu. Rev. Phytopathol. 2019, 57, 323–339. [Google Scholar] [CrossRef]
- Jacobs-Venter, A.; Laraba, I.; Geiser, D.M.; Busman, M.; Vaughan, M.M.; Proctor, R.H.; McCormick, S.P.; O’Donnell, K. Molecular systematics of two sister clades, the Fusarium concolor and F. babinda species complexes, and the discovery of a novel microcycle macroconidium-producing species from South Africa. Mycologia 2018, 110, 1189–1204. [Google Scholar] [CrossRef] [PubMed]
- Varga, J.; Tóth, B.; Mesterházy, Á. Molecular detection of mycotoxin-producing fungi. Cereal Res. Commun. 2004, 32, 193–200. [Google Scholar] [CrossRef]
- Calla-Quispe, E.; Fuentes-Rivera, H.L.; Ramirez, P.; Martel, C.; Ibanez, A.J. Mass Spectrometry: A Rosetta Stone to Learn How Fungi Interact and Talk. Life 2020, 10, 89. [Google Scholar] [CrossRef]
- Telagathoti, A.; Probst, M.; Khomenko, I.; Biasioli, F.; Peintner, U. High-Throughput Volatilome Fingerprint Using PTR-ToF-MS Shows Species-Specific Patterns in Mortierella and Closely Related Genera. J. Fungi 2021, 7, 66. [Google Scholar] [CrossRef]
- Guo, Y.; Jud, W.; Ghirardo, A.; Antritter, F.; Benz, J.P.; Schnitzler, J.P.; Rosenkranz, M. Sniffing fungi—Phenotyping of volatile chemical diversity in Trichoderma species. New Phytol. 2020, 227, 244–259. [Google Scholar] [CrossRef]
- Erler, A.; Riebe, D.; Beitz, T.; Lohmannsroben, H.G.; Grothusheitkamp, D.; Kunz, T.; Methner, F.J. Characterization of volatile metabolites formed by molds on barley by mass and ion mobility spectrometry. J. Mass Spectrom. 2020, 55, e4501. [Google Scholar] [CrossRef] [Green Version]
- Tholl, D.; Hossain, O.; Weinhold, A.; Rose, U.S.R.; Wei, Q. Trends and applications in plant volatile sampling and analysis. Plant J. 2021, 106, 314–325. [Google Scholar] [CrossRef]
- Girotti, J.R.; Malbran, I.; Lori, G.A.; Juarez, M.P. Use of solid phase microextraction coupled to capillary gas chromatography-mass spectrometry for screening Fusarium spp. based on their volatile sesquiterpenes. World Mycotoxin J. 2010, 3, 121–128. [Google Scholar] [CrossRef]
- Hewitt, C.N.; Hayward, S.; Tani, A. The application of proton transfer reaction-mass spectrometry (PTR-MS) to the monitoring and analysis of volatile organic compounds in the atmosphere. J. Environ. Monit. 2003, 5, 1–7. [Google Scholar] [CrossRef]
- Lovett, A.M.; Reid, N.M.; Buckley, J.A.; French, J.B.; Cameron, D.M. Real-time analysis of breath using an atmospheric pressure ionization mass spectrometer. Biomed. Mass Spectrom. 1979, 6, 91–97. [Google Scholar] [CrossRef] [PubMed]
- Erler, A.; Riebe, D.; Beitz, T.; Lohmannsroben, H.G.; Grothusheitkamp, D.; Kunz, T.; Methner, F.J. Detection of volatile organic compounds in the headspace above mold fungi by GC-soft X-radiation-based APCI-MS. J. Mass Spectrom. 2018, 53, 911–920. [Google Scholar] [CrossRef] [PubMed]
- Scotter, J.M.; Langford, V.S.; Wilson, P.F.; McEwan, M.J.; Chambers, S.T. Real-time detection of common microbial volatile organic compounds from medically important fungi by Selected Ion Flow Tube-Mass Spectrometry (SIFT-MS). J. Microbiol. Methods 2005, 63, 127–134. [Google Scholar] [CrossRef] [PubMed]
- Smith, D.; Spanel, P. SIFT-MS and FA-MS methods for ambient gas phase analysis: Developments and applications in the UK. Analyst 2015, 140, 2573–2591. [Google Scholar] [CrossRef] [Green Version]
- Tejero Rioseras, A.; Garcia Gomez, D.; Ebert, B.E.; Blank, L.M.; Ibanez, A.J.; Sinues, P.M. Comprehensive Real-Time Analysis of the Yeast Volatilome. Sci. Rep. 2017, 7, 14236. [Google Scholar] [CrossRef] [PubMed]
- Cody, R.B.; Dane, A.J. Direct Analysis in Real Time (DART). In Ambient Ionization Mass Spectrometry; Domin, M., Cody, R.B., Eds.; Royal Society of Chemistry: London, UK, 2015; pp. 23–57. [Google Scholar]
- Busman, M. Quantitation of Mycotoxins Using Direct Analysis in Real Time Mass Spectrometry (DART–MS). J. AOAC Int. 2018, 101, 643–646. [Google Scholar] [CrossRef]
- Sagawa, T.; Kudou, Y.; Nishiguchi, T.; Kawamukai, T.; Sakakura, M.; Shiota, A.; Hoshi, T.; Matsumoto, K.; Watanabe, J. Continuous Analysis of Volatile Compounds from Foods During Flavor Release Using Direct Analysis in Real Time Mass Spectrometry. J. Jpn. Soc. Food Sci. 2015, 62, 335–340. [Google Scholar] [CrossRef] [Green Version]
- Sakakura, M. Application Development of Flavor Analysis Using Real Time Mass Spectrometry. J. Mass Spectrom. Soc. Jpn. 2018, 66, 15–24. [Google Scholar] [CrossRef] [Green Version]
- Patel, R. A Moldy Application of MALDI: MALDI-ToF Mass Spectrometry for Fungal Identification. J. Fungi 2019, 5, 4. [Google Scholar] [CrossRef] [Green Version]
- Wen, Q.; Boshier, P.; Myridakis, A.; Belluomo, I.; Hanna, G.B. Urinary Volatile Organic Compound Analysis for the Diagnosis of Cancer: A Systematic Literature Review and Quality Assessment. Metabolites 2021, 11, 17. [Google Scholar] [CrossRef]


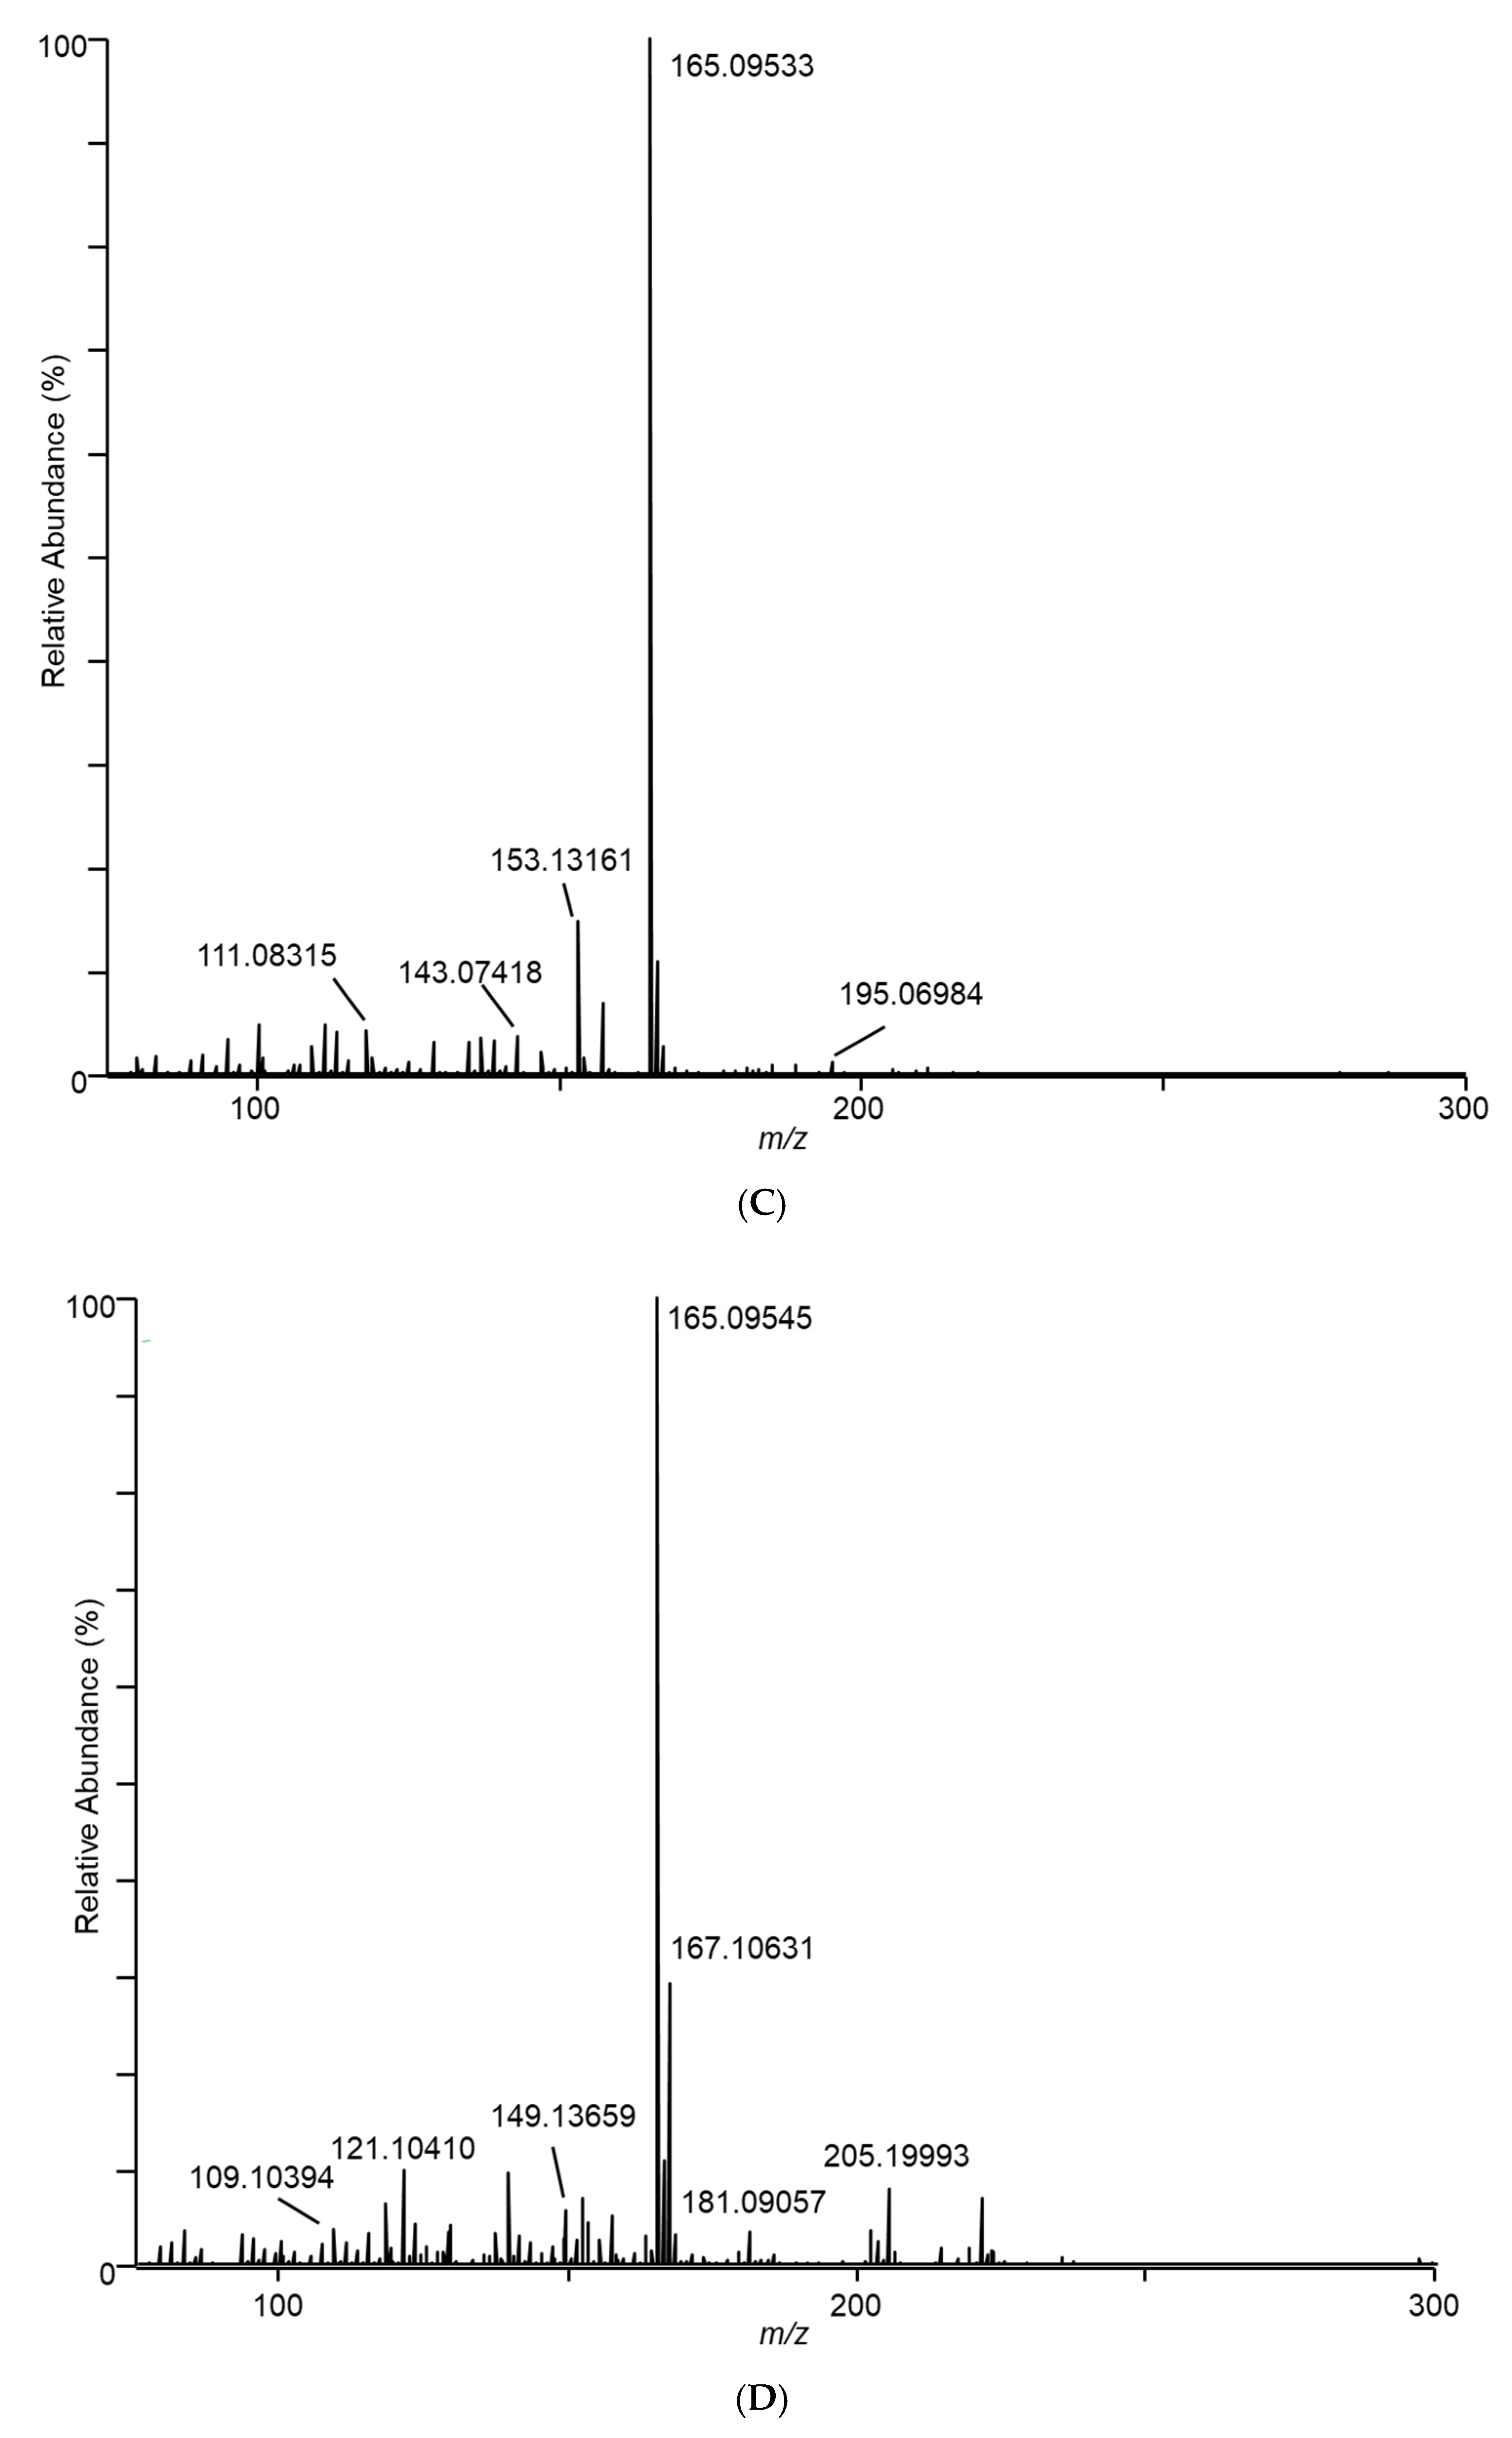


 ” icon. Spectra represent averaging of the 3 min acquisition period for each sample.
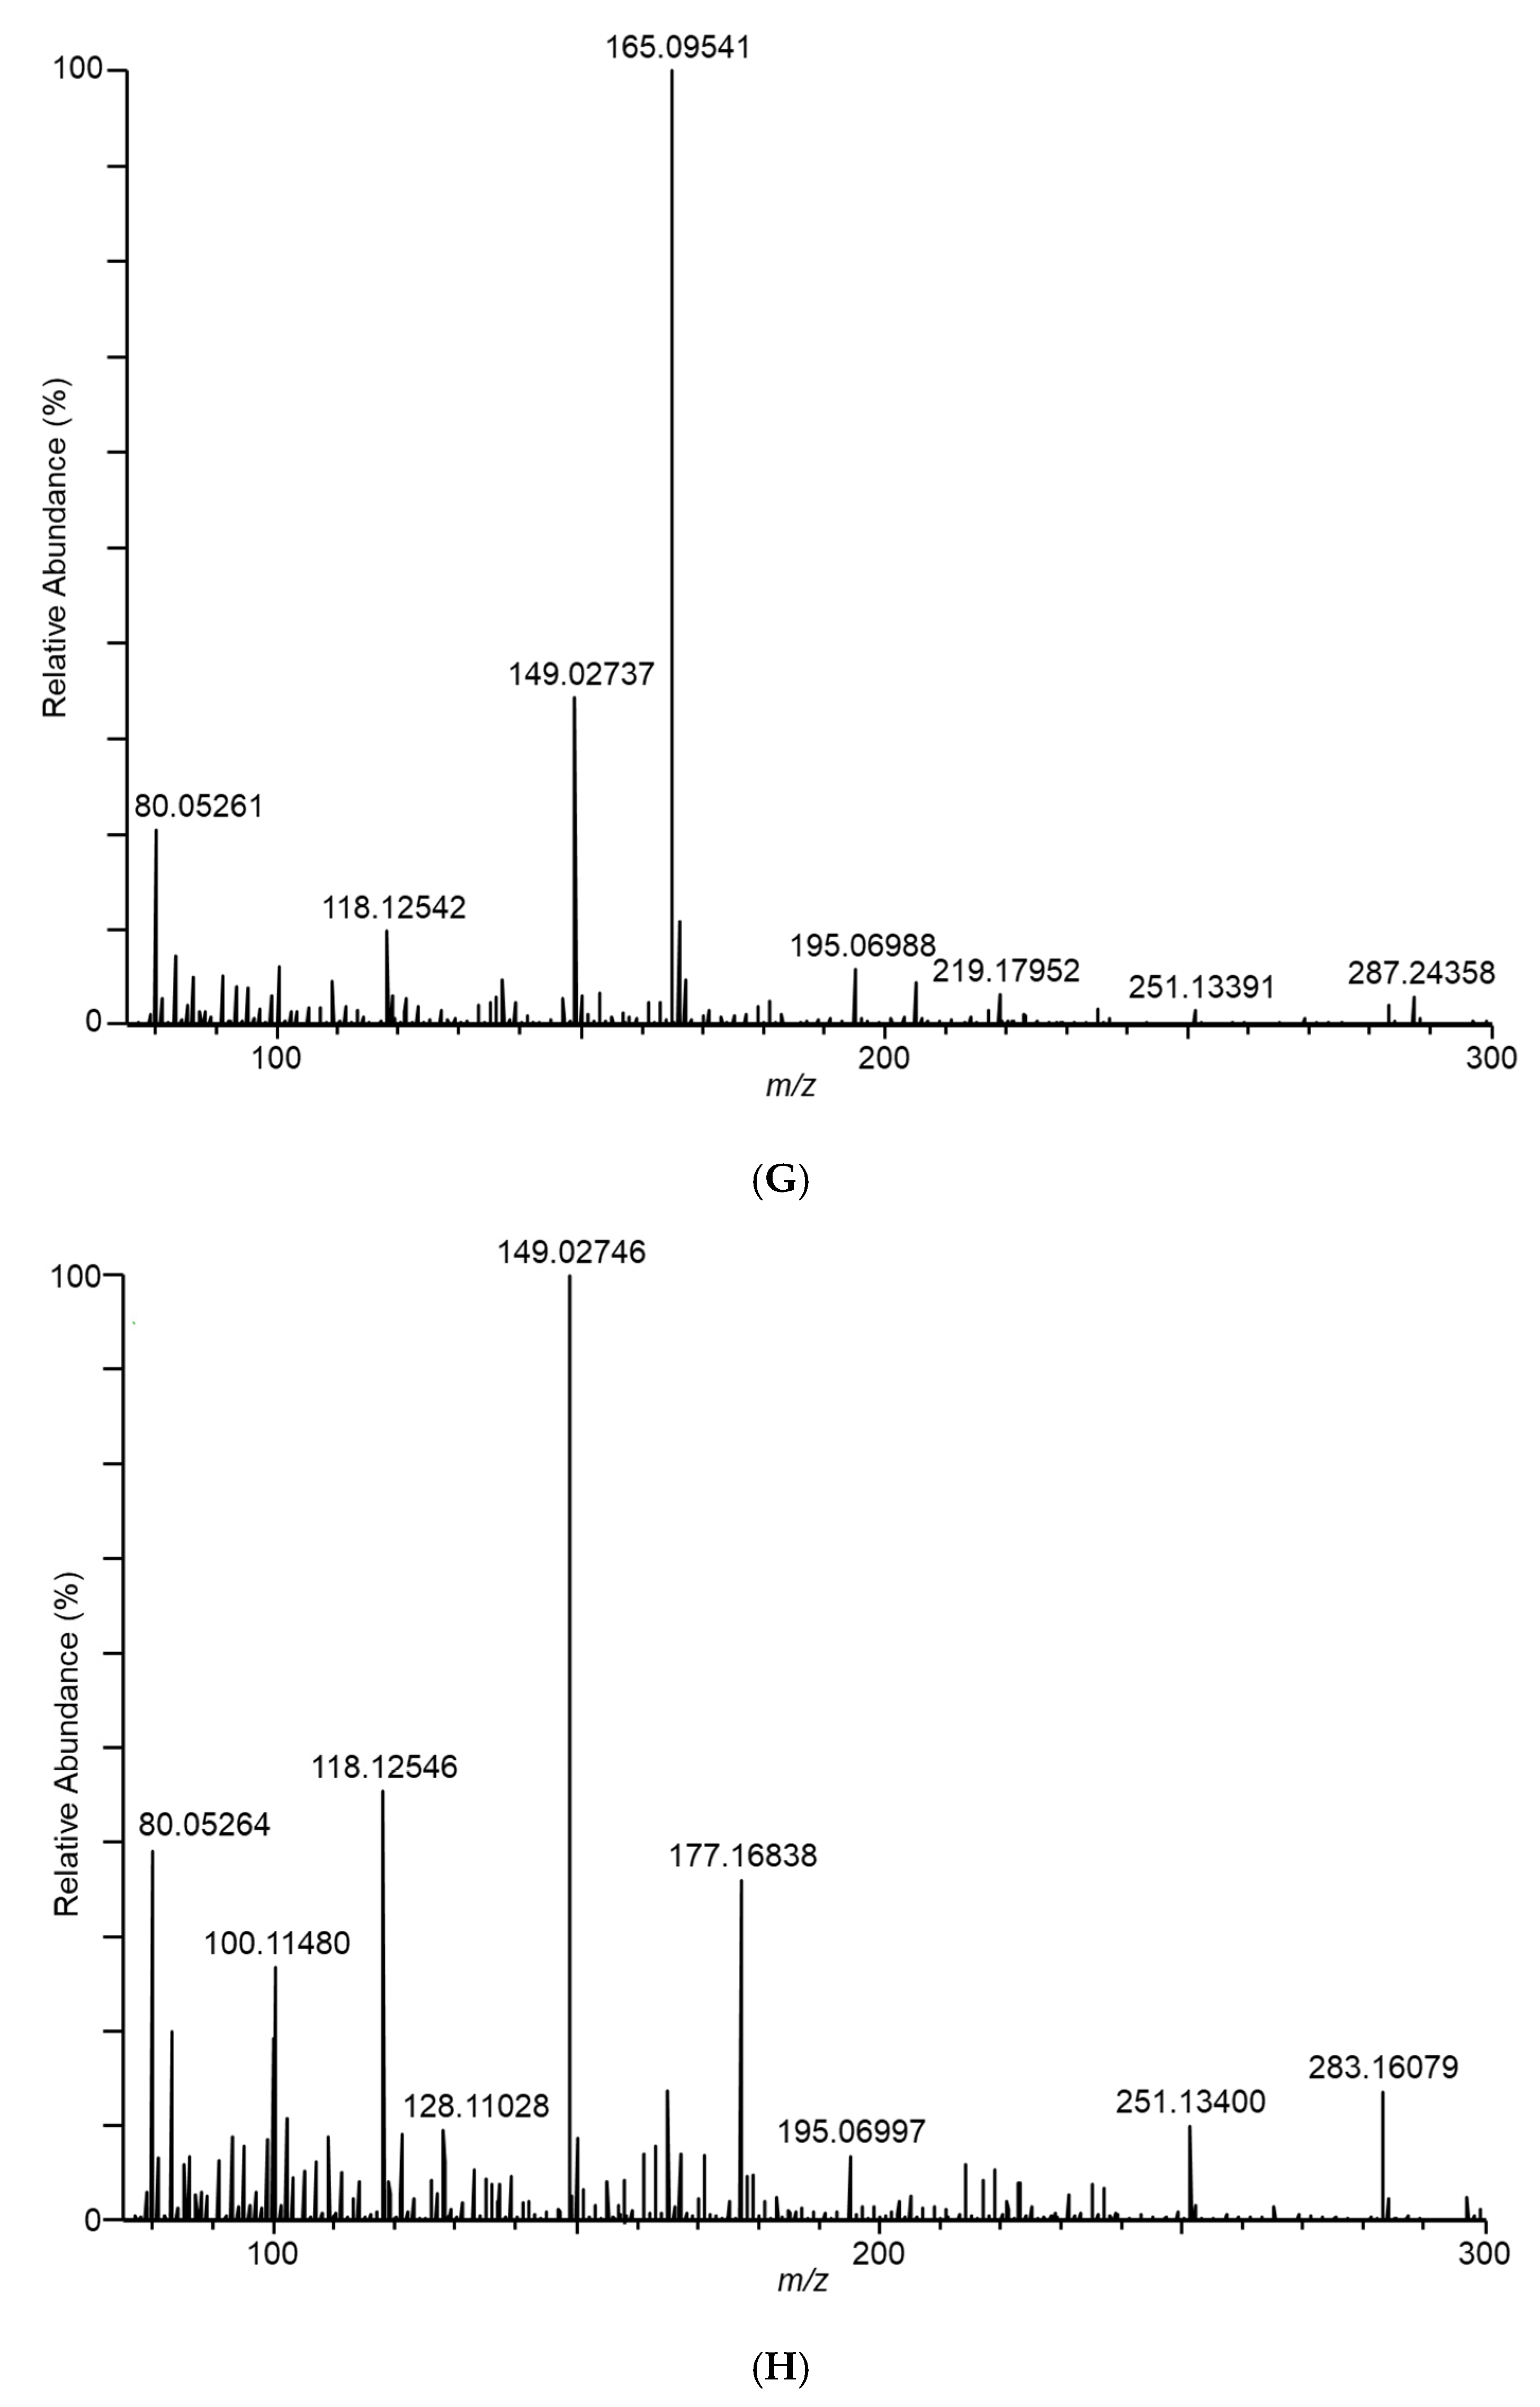
” icon. Spectra represent averaging of the 3 min acquisition period for each sample.
” icon. Spectra represent averaging of the 3 min acquisition period for each sample.


| Species | Fusarium Species Complex | NRRL Number |
|---|---|---|
| Fusarium scirpi | F. incarnatum–equiseti | 66328 |
| Fusarium avenaceum | F. tricinctum | 4939 |
| Fusarium virguliforme | F. solani | 31041 |
| Fusarium verticillioides | F. fujikuroi | (M3125) 20956 |
| Fusarium graminearum | F. ambucinum | 31084 |
| Aspergillus flavus | – | 26466 |
| Species | Diagnostic Ion #1 | Diagnostic Ion #2 |
|---|---|---|
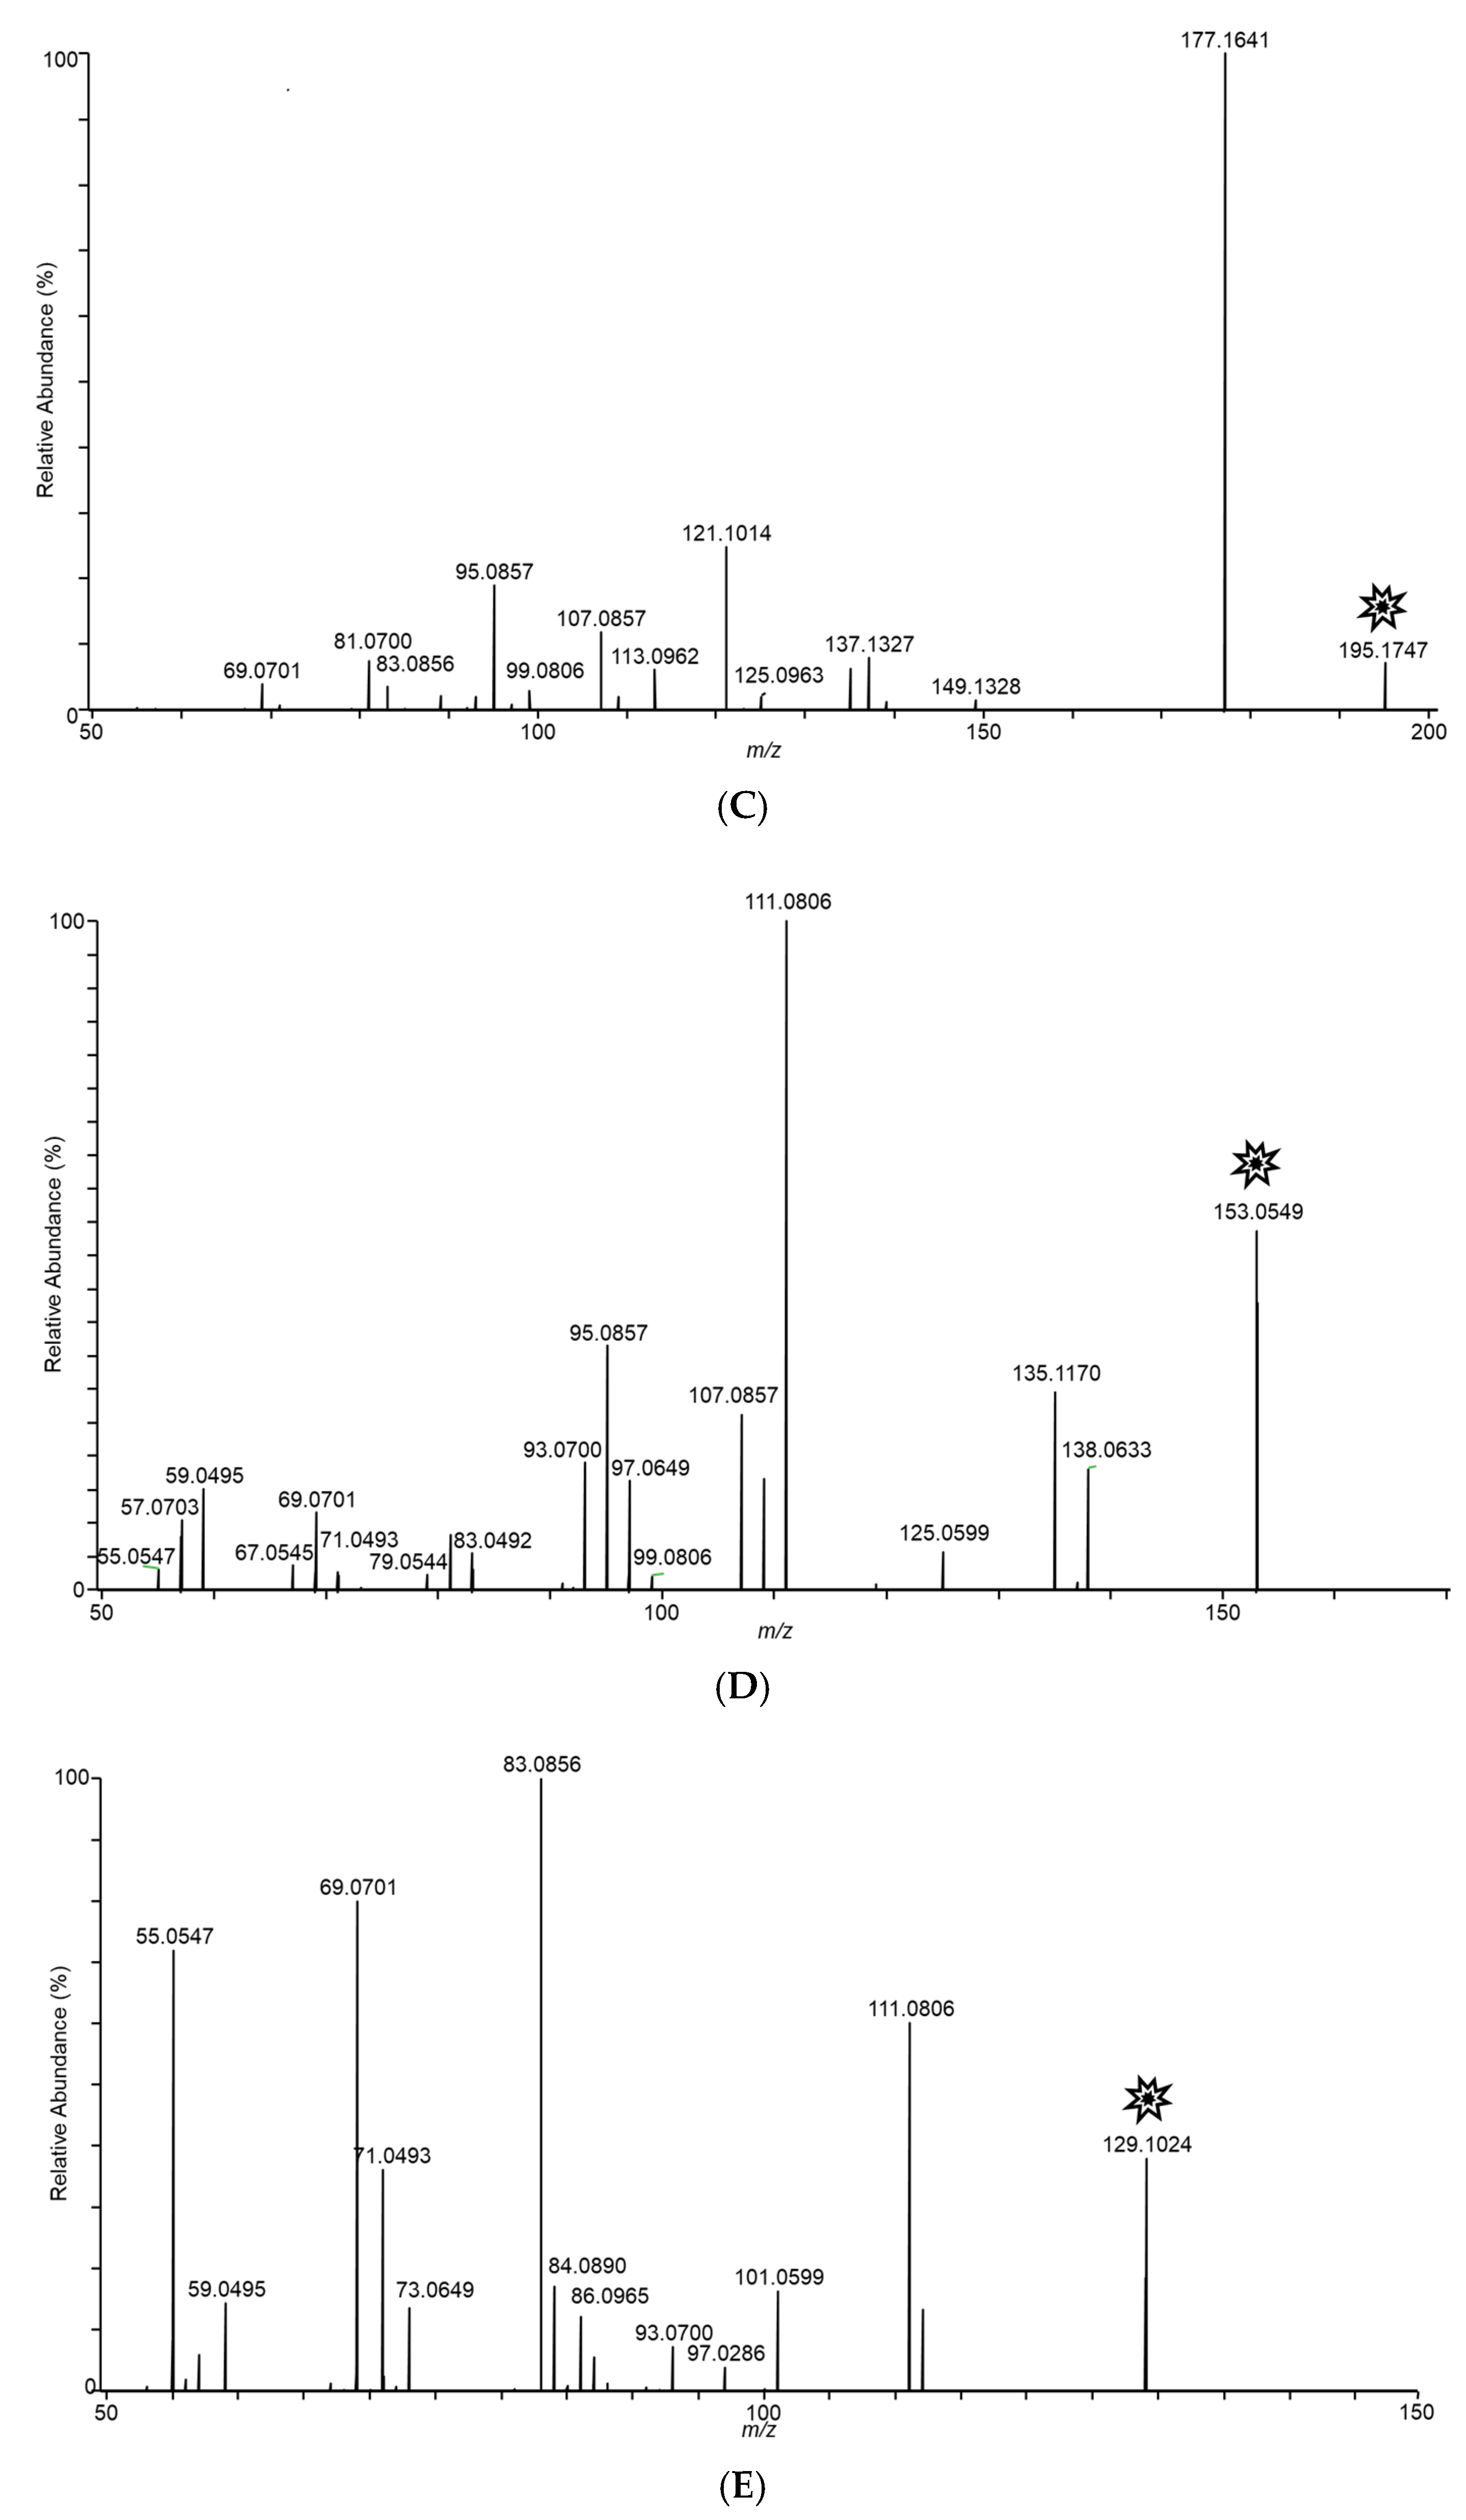
| Fusarium scirpi | 167.10631 (C10H14O2) | 221.19533 (C15H24O) |
| Fusarium avenaceum | 83.08611 (C6H10) | – |
| Fusarium virguliforme | – | – |
| Fusarium verticillioides | 195.06412() | 153.12706 (C10H16O) |
| Fusarium graminearum | 129.05443 (C6H8O3) | 143.07032 (C7H10O3) |
| Aspergillus flavus | 251.13402 (C10H21O6N) | 283.16080 (C11H25O7N) |
Publisher’s Note: MDPI stays neutral with regard to jurisdictional claims in published maps and institutional affiliations. |
© 2021 by the authors. Licensee MDPI, Basel, Switzerland. This article is an open access article distributed under the terms and conditions of the Creative Commons Attribution (CC BY) license (https://creativecommons.org/licenses/by/4.0/).
Share and Cite
Busman, M.; Roberts, E.; Proctor, R.H.; Maragos, C.M. Volatile Organic Compound Profile Fingerprints Using DART–MS Shows Species-Specific Patterns in Fusarium Mycotoxin Producing Fungi. J. Fungi 2022, 8, 3. https://doi.org/10.3390/jof8010003
Busman M, Roberts E, Proctor RH, Maragos CM. Volatile Organic Compound Profile Fingerprints Using DART–MS Shows Species-Specific Patterns in Fusarium Mycotoxin Producing Fungi. Journal of Fungi. 2022; 8(1):3. https://doi.org/10.3390/jof8010003
Chicago/Turabian StyleBusman, Mark, Ethan Roberts, Robert H. Proctor, and Chris M. Maragos. 2022. "Volatile Organic Compound Profile Fingerprints Using DART–MS Shows Species-Specific Patterns in Fusarium Mycotoxin Producing Fungi" Journal of Fungi 8, no. 1: 3. https://doi.org/10.3390/jof8010003
APA StyleBusman, M., Roberts, E., Proctor, R. H., & Maragos, C. M. (2022). Volatile Organic Compound Profile Fingerprints Using DART–MS Shows Species-Specific Patterns in Fusarium Mycotoxin Producing Fungi. Journal of Fungi, 8(1), 3. https://doi.org/10.3390/jof8010003