
Physcomitrium patens Infection by Colletotrichum gloeosporioides: Understanding the Fungal–Bryophyte Interaction by Microscopy, Phenomics and RNA Sequencing

 ,
,  , ,
, ,  ,
,  , and
, and 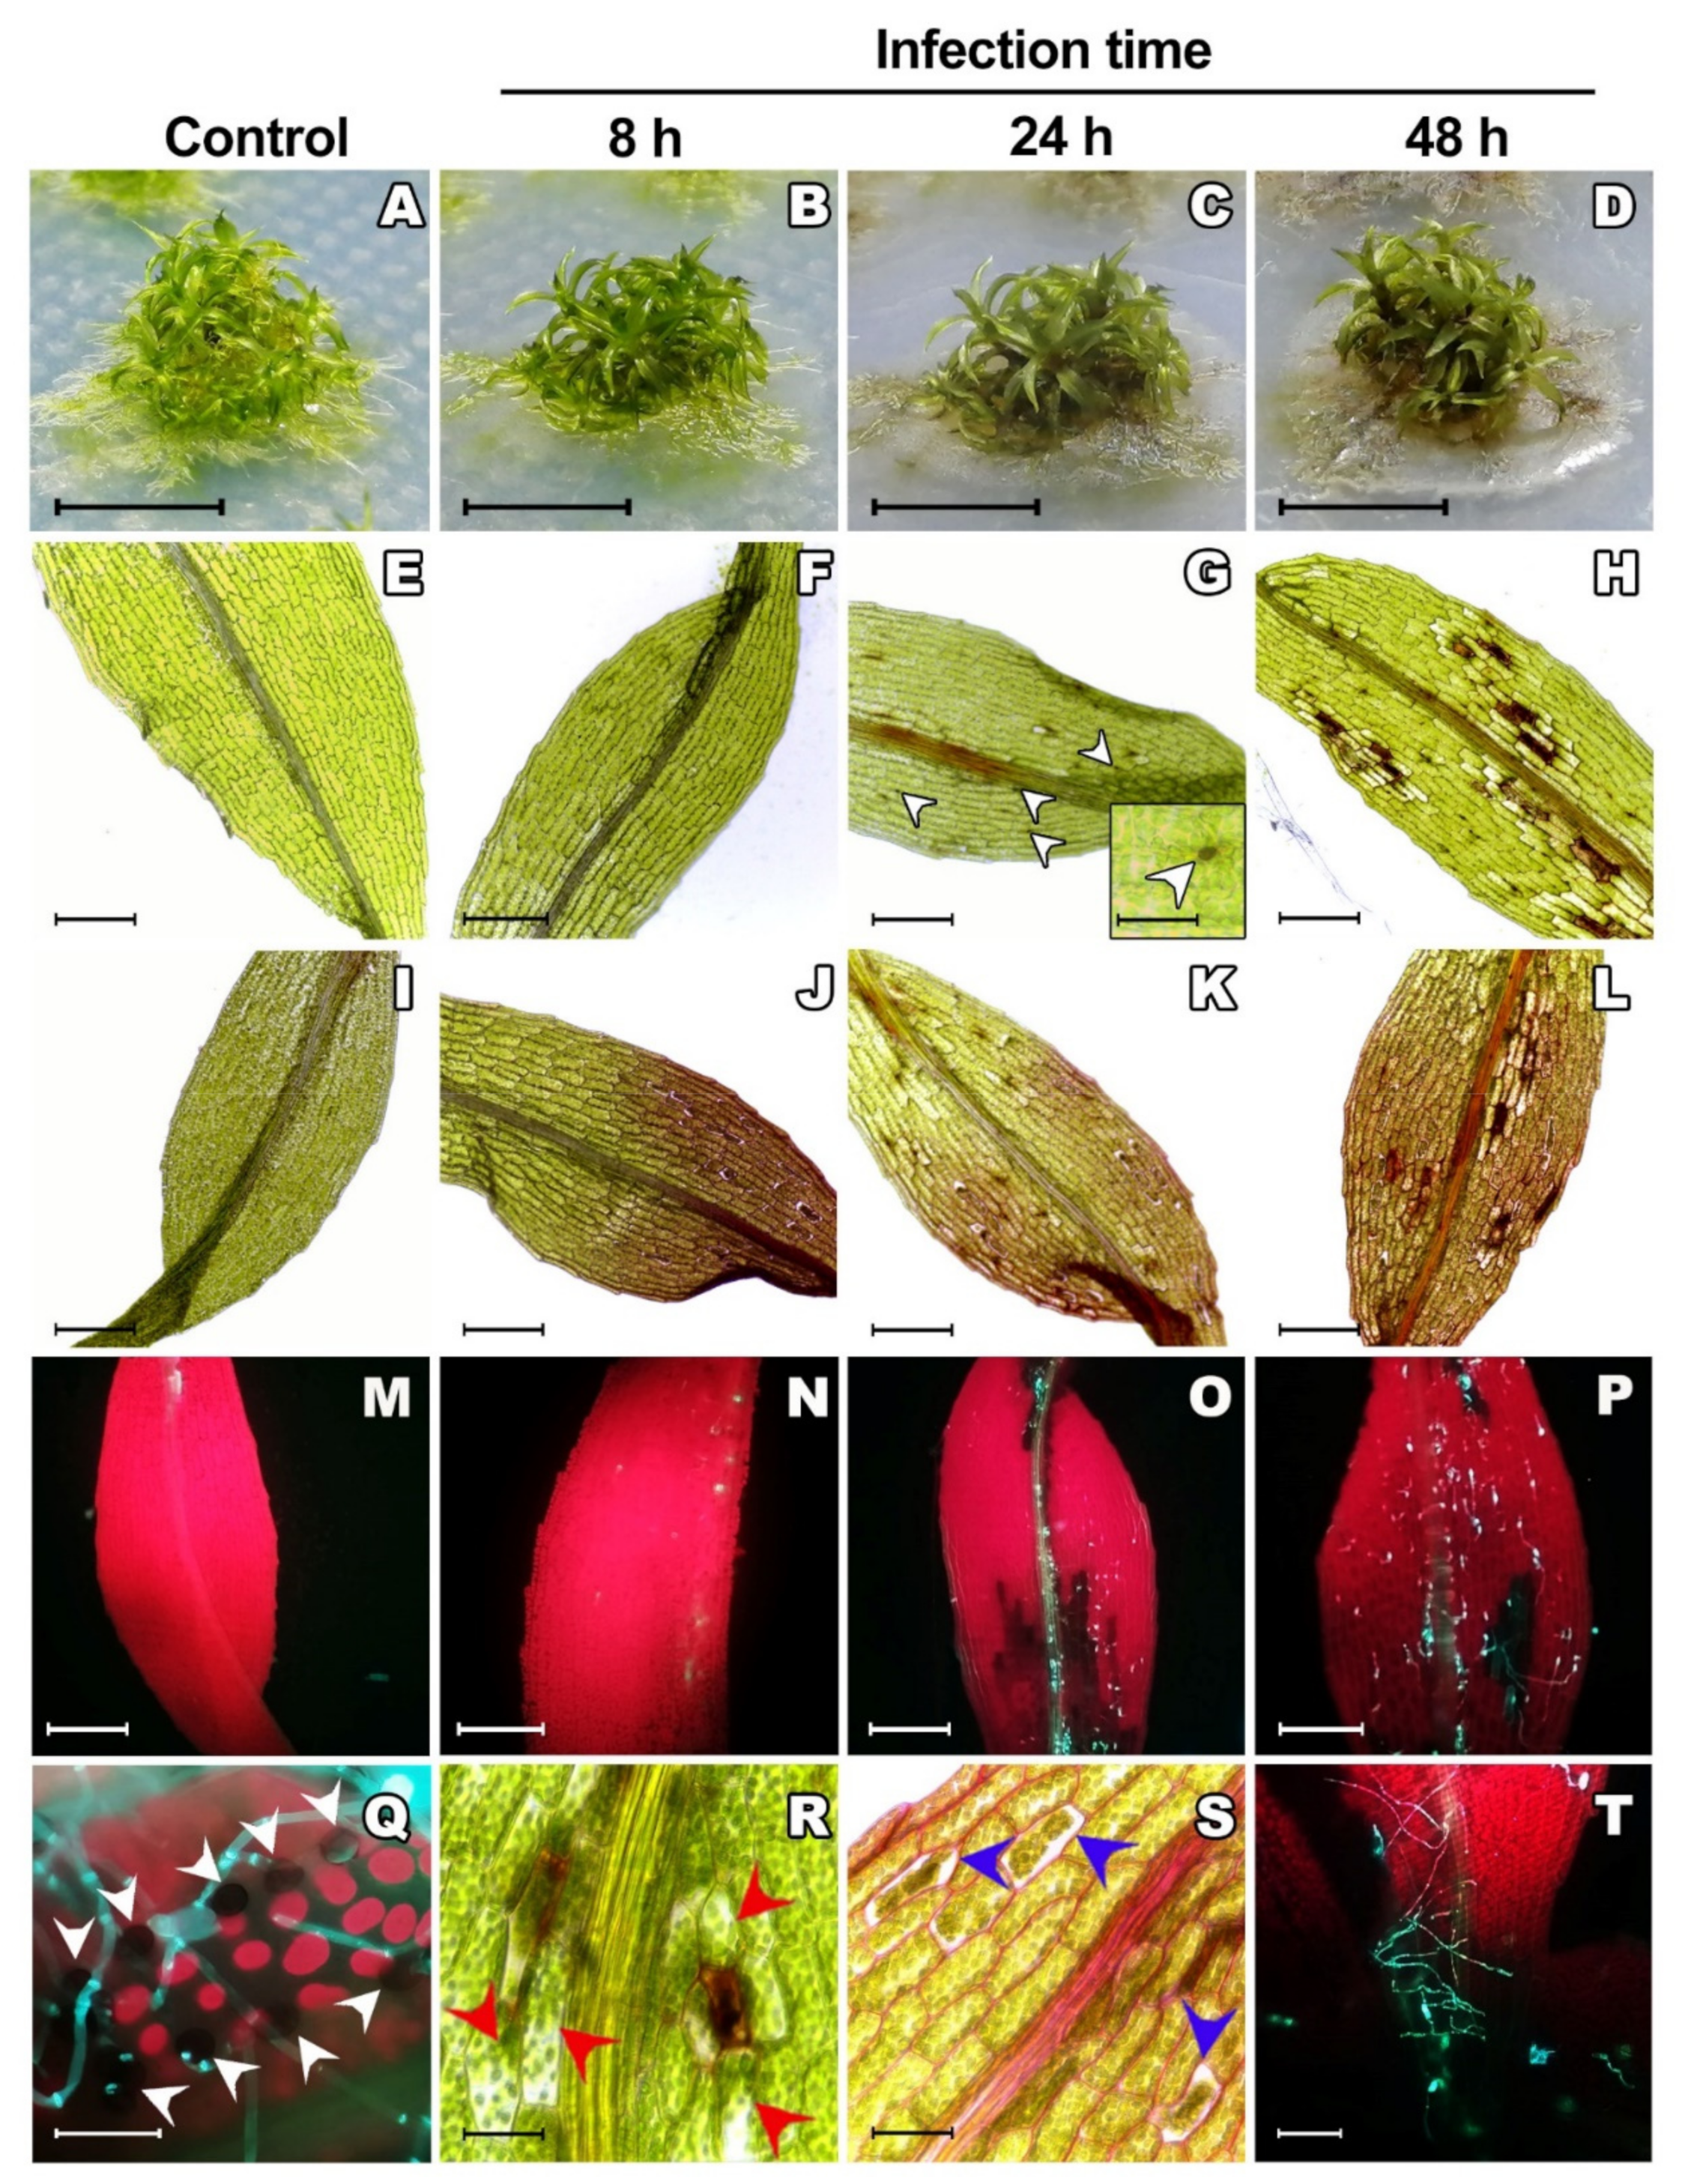
Abstract
1. Introduction
2. Results and Discussion
2.1. Colletotrichum gloeosporioides Successfully Infects Physcomitrium patens
2.2. Phenomics Characterization of the Colletotrichum gloeosporioides–Physcomitrium patens Interaction
2.3. Salicylic Acid and Jasmonic Acid Improved Resistance of Physcomitrium patens to Infection by Colletotrichum gloeosporioides
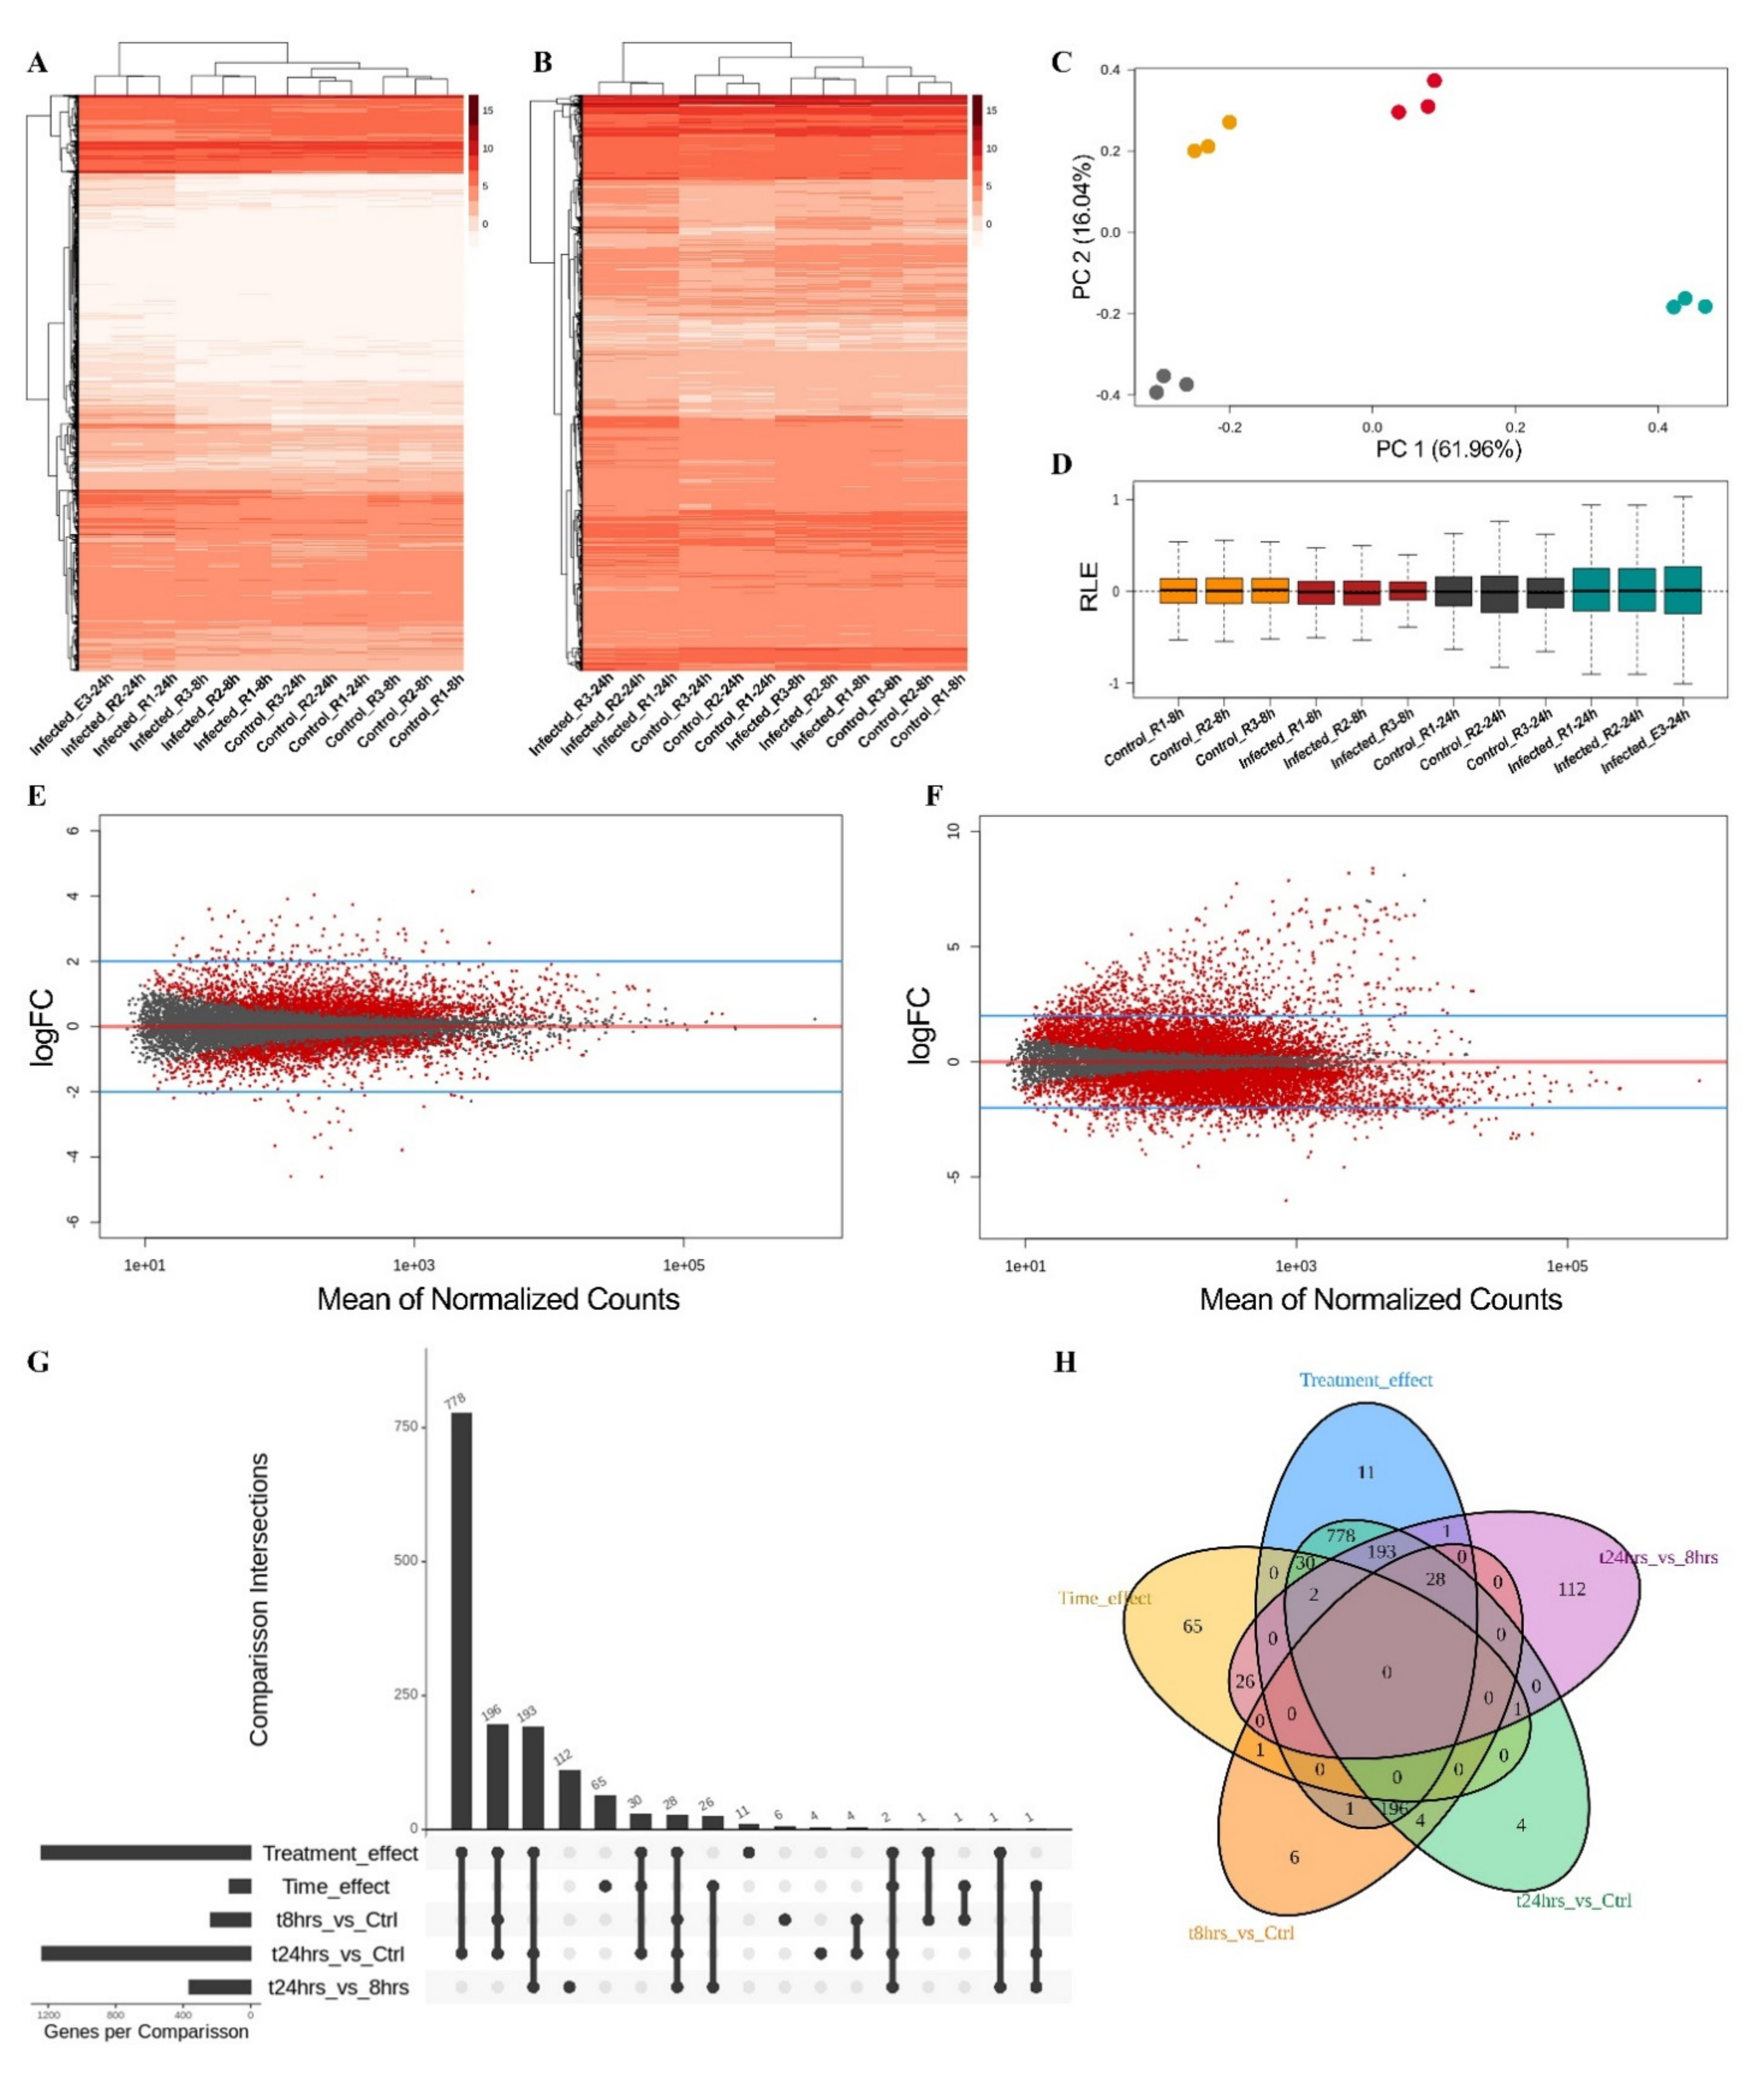
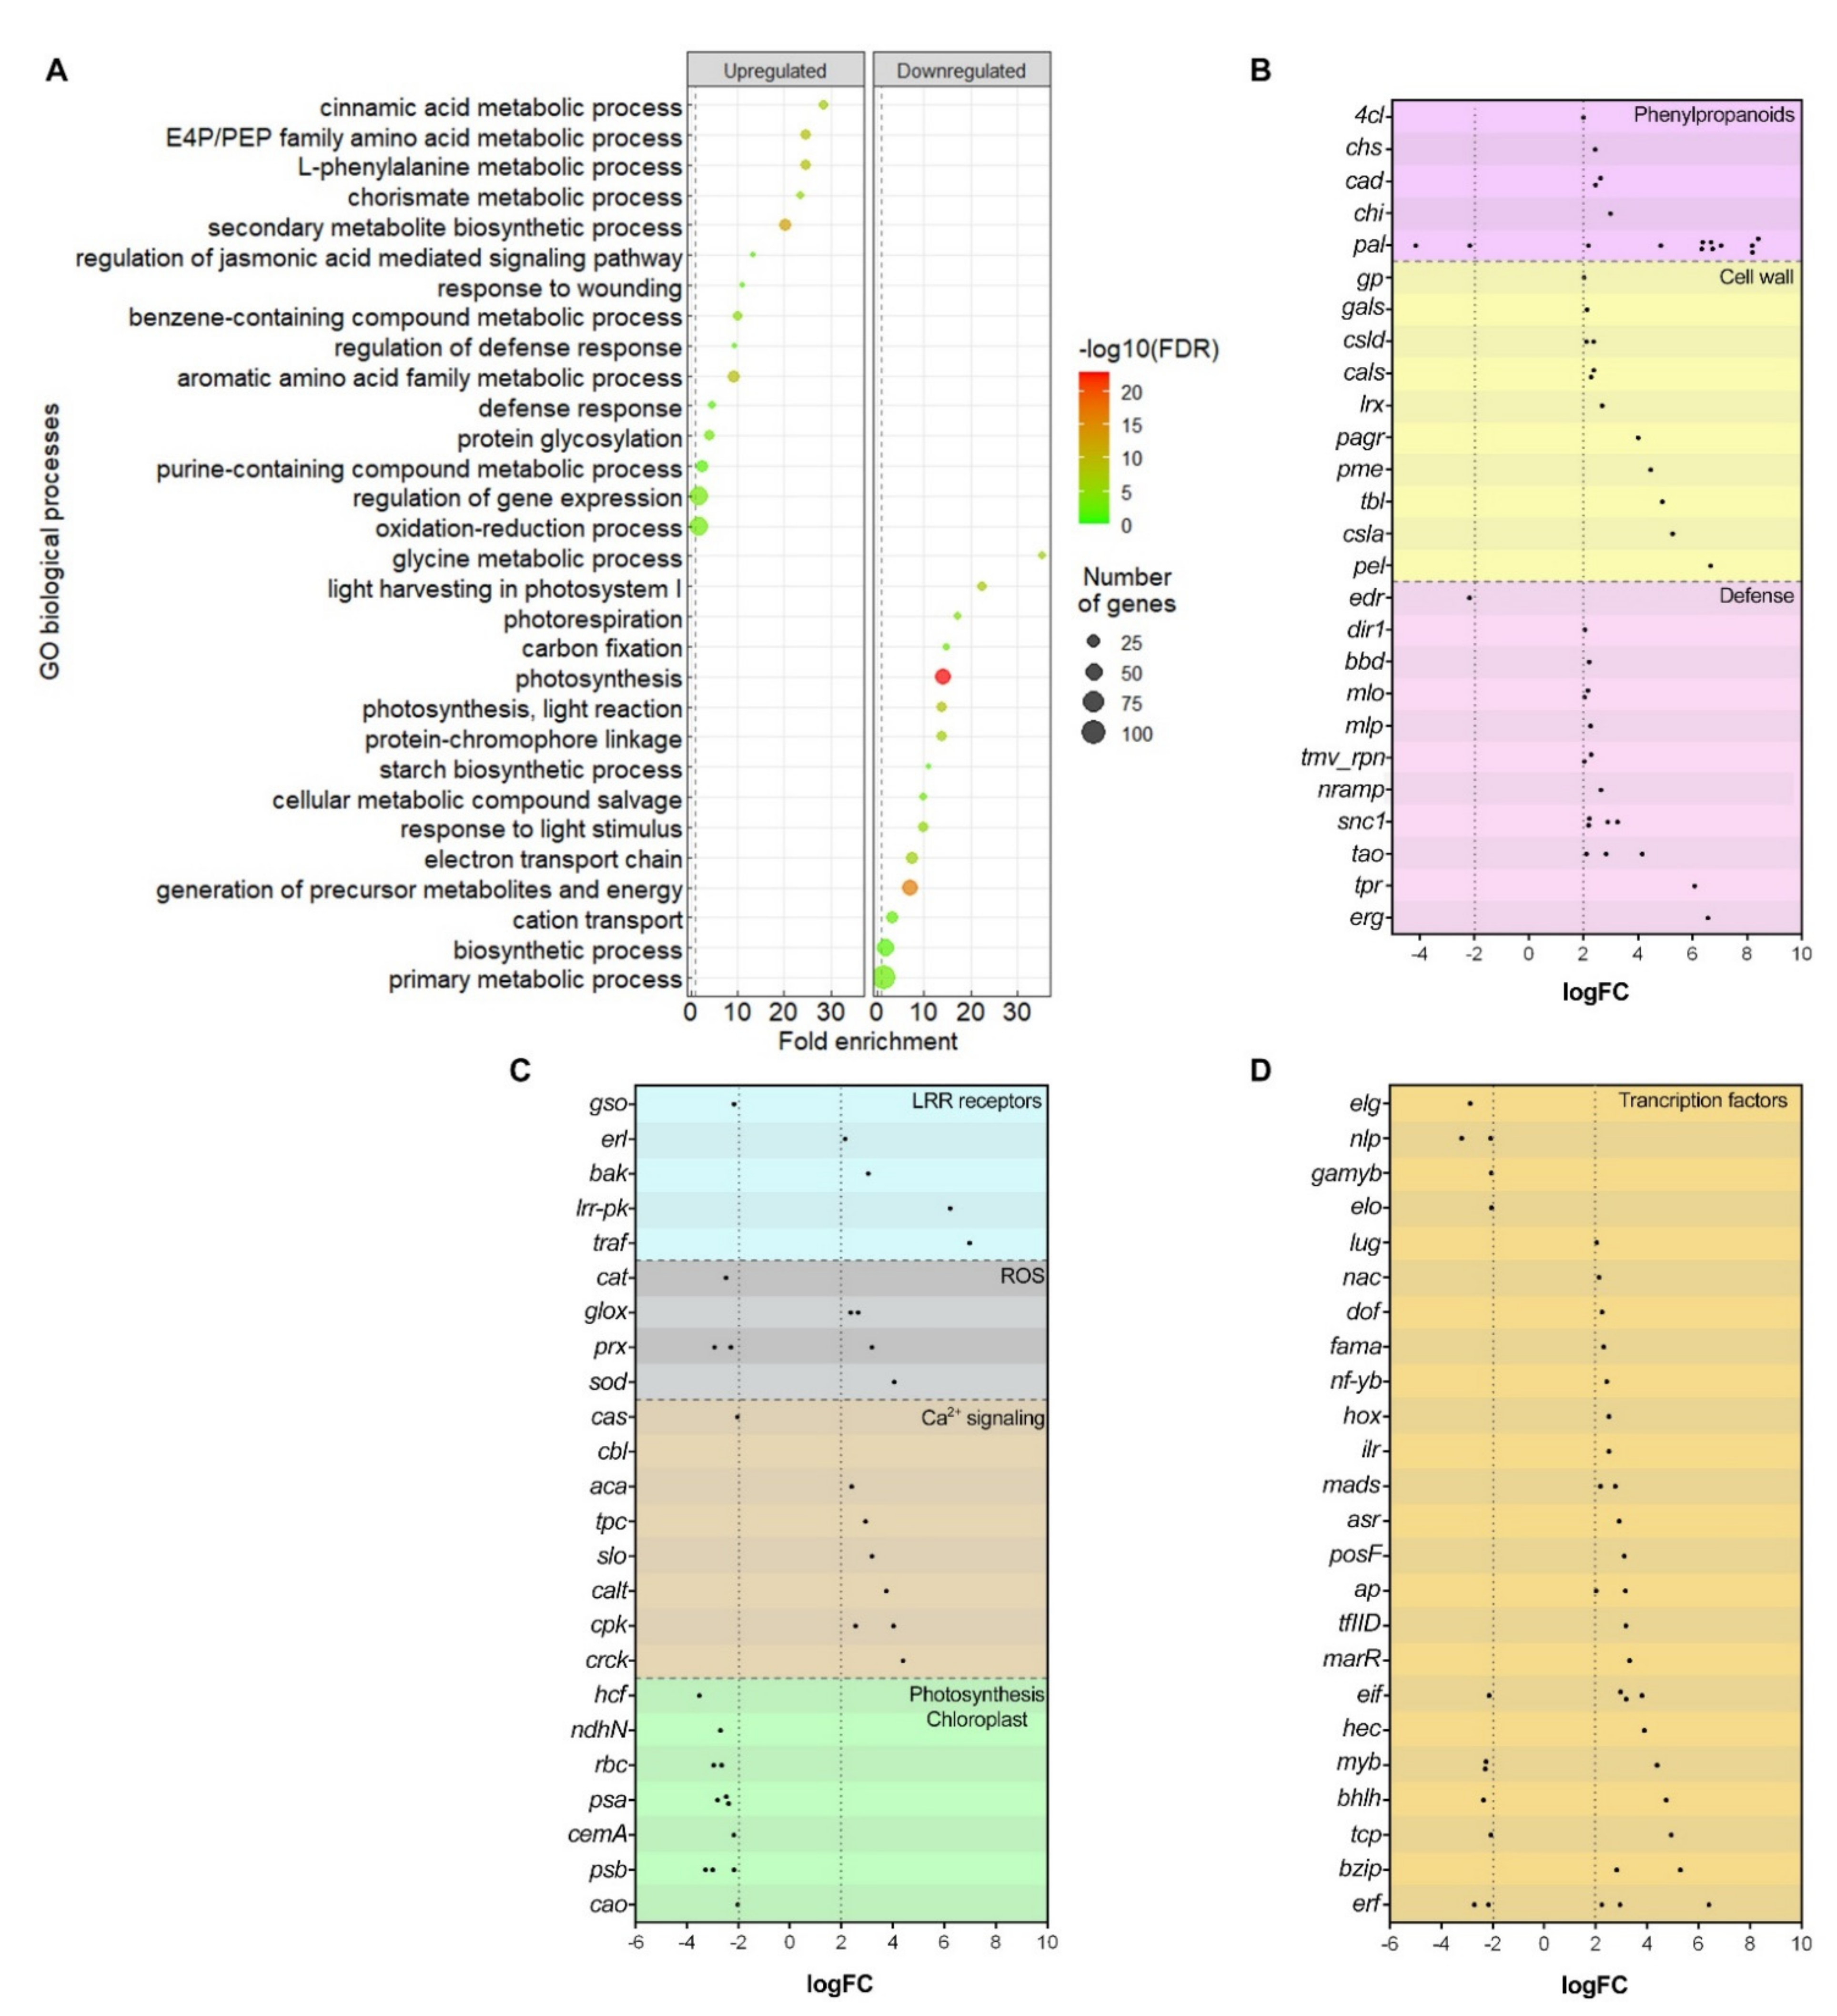
2.4. Transcriptomic Analysis in Physcomitrium patens
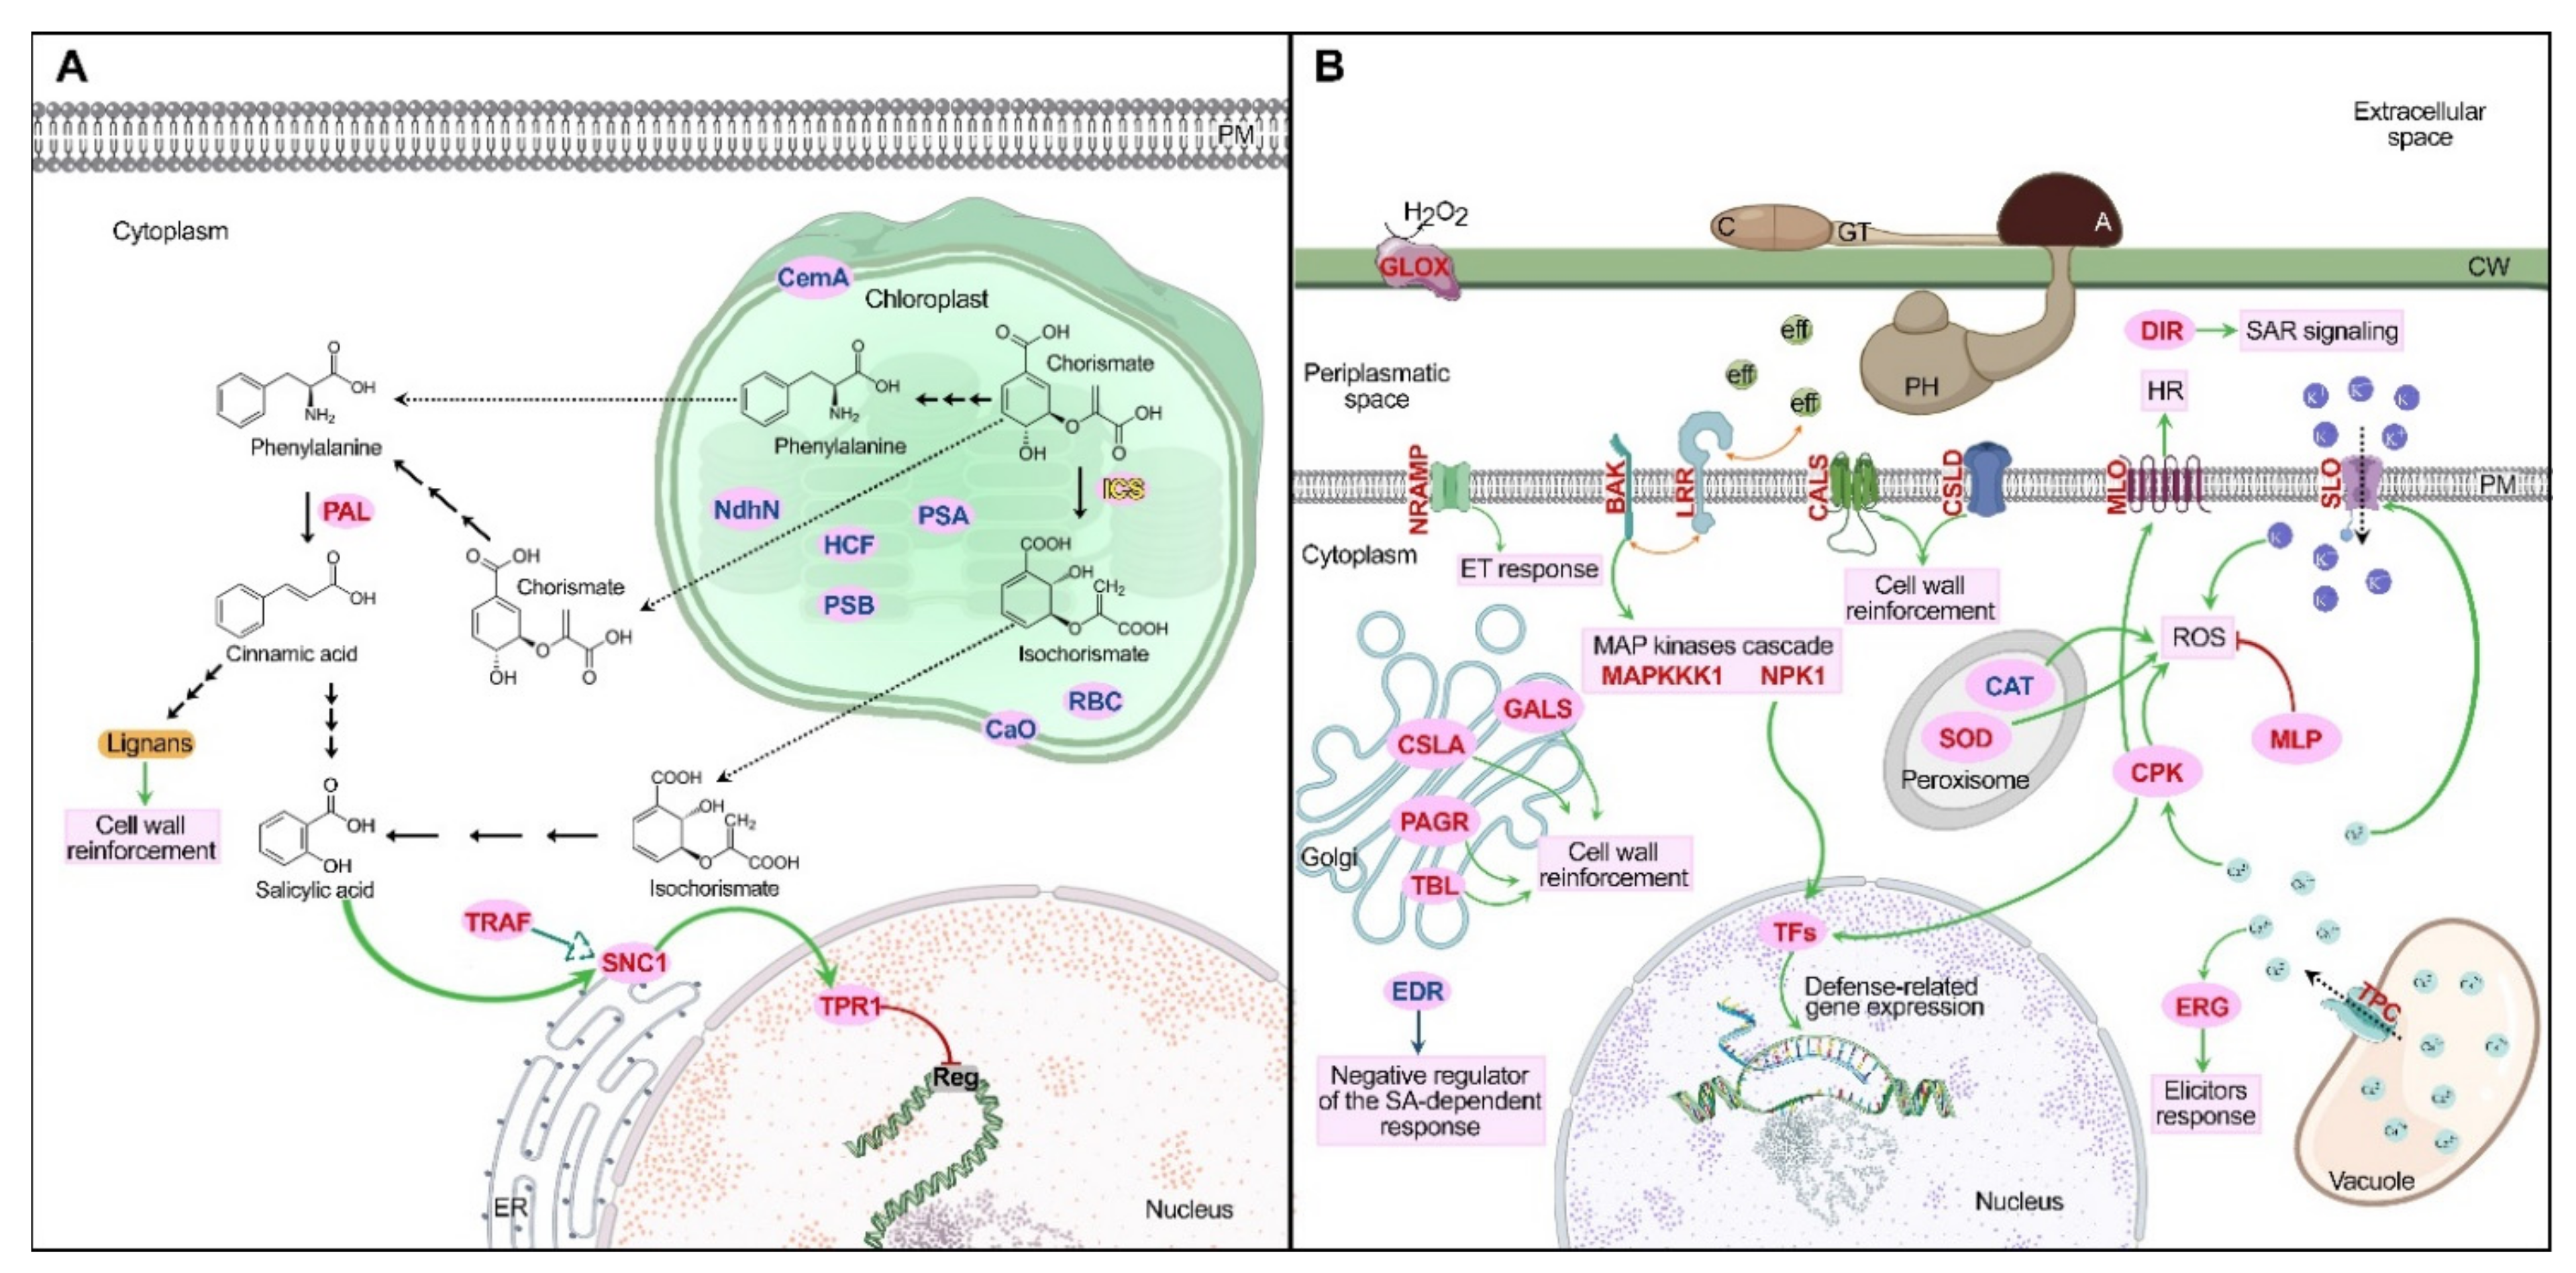
2.4.1. Phenylpropanoids Pathway and Cell Wall Reinforcement
2.4.2. Defense-Related Genes Expression
2.4.3. Leucine-Rich Repeat Receptors
2.4.4. Reactive Oxygen Species
2.4.5. Other Differentially Expressed Genes
3. Materials and Methods
3.1. Colletotrichum gloeosporioides and Physcomitrium patens Co-Inoculation Assay
3.2. Moss and Fungal Staining
3.3. Phenomics Analysis
3.4. Hormone Testing Assay and Moss Cell Damage Evaluation
3.5. RNA Extraction, cDNA Library Preparation and Sequencing
3.6. RNA-Seq Processing, Differential Expression Analysis and Gene Ontology Enrichment
4. Final Remarks
Supplementary Materials
Author Contributions
Funding
Institutional Review Board Statement
Informed Consent Statement
Data Availability Statement
Acknowledgments
Conflicts of Interest
References
- Hyde, K.D.; Cai, L.; Cannon, P.F.; Crouch, J.A.; Crous, P.W.; Damm, U.; Goodwin, P.H.; Chen, H.; Johnston, P.R.; Jones, E.B.G. Colletotrichum—Names in current use. Fungal Divers. 2009, 39, 147–182. [Google Scholar]
- Siddiqui, Y.; Ali, A. Colletotrichum gloeosporioides (Anthracnose). In Postharvest Decay: Control Strategies; Elsevier: Amsterdam, The Netherlands, 2014; pp. 337–371. ISBN 9780124115682. [Google Scholar] [CrossRef]
- Rex, B.; Sheela, J.; Theradimani, M.; Ebenezar, E.G.; Vanniarajan, C.; Swaminathan, V. Survey, isolation and morphological variation of different isolates of anthurium anthracnose disease incited by Colletotrichum gloeosporioides. J. Pharmacogn. Phytochem. 2019, 8, 355–357. [Google Scholar]
- Fu, F.F.; Hao, Z.; Wang, P.; Lu, Y.; Xue, L.J.; Wei, G.; Tian, Y.; Hu, B.; Xu, H.; Shi, J.; et al. Genome sequence and comparative analysis of Colletotrichum gloeosporioides isolated from liriodendron leaves. Phytopathology 2020, 110, 1260–1269. [Google Scholar] [CrossRef]
- Banerjee, A.; Islam, S.; Middya, R. Colletotrichum gloeosporioides Causing Leaf Spot Disease on Ixora coccinea in West Bengal. J. Pharmacogn. Phytochem. 2017, 6, 1730–1732. [Google Scholar]
- Elmer, W.H.; Yang, H.A.; Sweetingham, M.W. Characterization of Colletotrichum gloeosporioides isolates from ornamental lupines in Connecticut. Plant Dis. 2001, 85, 216–219. [Google Scholar] [CrossRef]
- Peng, Y.; Van Wersch, R.; Zhang, Y. Convergent and divergent signaling in PAMP-triggered immunity and effector-triggered immunity. Mol. Plant-Microbe Interact. 2018, 31, 403–409. [Google Scholar] [CrossRef]
- Ngou, B.P.M.; Ahn, H.K.; Ding, P.; Jones, J.D.G. Mutual potentiation of plant immunity by cell-surface and intracellular receptors. Nature 2021, 592, 110–115. [Google Scholar] [CrossRef]
- Alkan, N.; Friedlander, G.; Ment, D.; Prusky, D.; Fluhr, R. Simultaneous transcriptome analysis of Colletotrichum gloeosporioides and tomato fruit pathosystem reveals novel fungal pathogenicity and fruit defense strategies. New Phytol. 2015, 205, 801–815. [Google Scholar] [CrossRef] [PubMed]
- Zhang, L.; Huang, X.; He, C.; Zhang, Q.Y.; Zou, X.; Duan, K.; Gao, Q. Novel fungal pathogenicity and leaf defense strategies are revealed by simultaneous transcriptome analysis of Colletotrichum fructicola and strawberry infected by this fungus. Front. Plant Sci. 2018, 9, 434. [Google Scholar] [CrossRef] [PubMed]
- Jeyaraj, A.; Wang, X.; Wang, S.; Liu, S.; Zhang, R.; Wu, A.; Wei, C. Identification of Regulatory Networks of MicroRNAs and Their Targets in Response to Colletotrichum gloeosporioides in Tea Plant (Camellia sinensis L.). Front. Plant Sci. 2019, 10, 1096. [Google Scholar] [CrossRef]
- Nelson, J.M.; Hauser, D.A.; Hinson, R.; Shaw, A.J. A novel experimental system using the liverwort Marchantia polymorpha and its fungal endophytes reveals diverse and context-dependent effects. New Phytol. 2018, 218, 1217–1232. [Google Scholar] [CrossRef]
- Martin, F.M.; Uroz, S.; Barker, D.G. Ancestral alliances: Plant mutualistic symbioses with fungi and bacteria. Science 2017, 356, 6340. [Google Scholar] [CrossRef]
- Krings, M.; Taylor, T.N.; Hass, H.; Kerp, H.; Dotzler, N.; Hermsen, E.J. Fungal endophytes in a 400-million-yr-old land plant: Infection pathways, spatial distribution, and host responses. New Phytol. 2007, 174, 648–657. [Google Scholar] [CrossRef] [PubMed]
- Delaux, P.M.; Hetherington, A.J.; Coudert, Y.; Delwiche, C.; Dunand, C.; Gould, S.; Kenrick, P.; Li, F.W.; Philippe, H.; Rensing, S.A.; et al. Reconstructing trait evolution in plant evo–devo studies. Curr. Biol. 2019, 29, R1110–R1118. [Google Scholar] [CrossRef]
- Fürst-Jansen, J.M.R.; De Vries, S.; De Vries, J.; De Vries, J. Evo-physio: On stress responses and the earliest land plants. J. Exp. Bot. 2020, 71, 3254–3269. [Google Scholar] [CrossRef]
- Nelson, J.; Shaw, A.J. Exploring the natural microbiome of the model liverwort: Fungal endophyte diversity in Marchantia polymorpha L. Symbiosis 2019, 78, 45–59. [Google Scholar] [CrossRef]
- Lehtonen, M.T.; Marttinen, E.M.; Akita, M.; Valkonen, J.P.T. Fungi infecting cultivated moss can also cause diseases in crop plants. Ann. Appl. Biol. 2012, 160, 298–307. [Google Scholar] [CrossRef]
- Mittag, J.; Šola, I.; Rusak, G.; Ludwig-Müller, J. Physcomitrella patens auxin conjugate synthetase (GH3) double knockout mutants are more resistant to Pythium infection than wild type. J. Plant Physiol. 2015, 183, 75–83. [Google Scholar] [CrossRef] [PubMed]
- Ponce de León, I. The Moss Physcomitrella patens as a Model System to Study Interactions between Plants and Phytopathogenic Fungi and Oomycetes. J. Pathog. 2011, 2011, 1–6. [Google Scholar] [CrossRef]
- Ponce de León, I.; Montesano, M. Activation of defense mechanisms against pathogens in mosses and flowering plants. Int. J. Mol. Sci. 2013, 14, 3178–3200. [Google Scholar] [CrossRef]
- Racovitza, A. Etude systématique et biologique des champignons bryophites. In Mémoires du Muséum National d’Histoire Naturelle; Sér. B—Botanique (1950–1992); Edition du Muséum: Paris, France, 1959; p. 288. [Google Scholar]
- Reboledo, G.; Agorio, A.; Vignale, L.; Batista, R.A.; Ponce de León, I. Botrytis cinerea transcriptome during the infection process of the early divergent land plant Physcomitrium patens and angiosperms. J. Fungi 2021, 7, 11. [Google Scholar] [CrossRef] [PubMed]
- Reboledo, G.; Agorio, A.D.; Vignale, L.; Batista-García, R.A.; Ponce De León, I. Transcriptional profiling reveals conserved and species-specific plant defense responses during the interaction of Physcomitrium patens with Botrytis cinerea. Plant Mol. Biol. 2021, 1–21. [Google Scholar] [CrossRef]
- Reboledo, G.; del Campo, R.; Alvarez, A.; Montesano, M.; Mara, H.; Ponce de León, I. Physcomitrella patens activates defense responses against the pathogen colletotrichum gloeosporioides. Int. J. Mol. Sci. 2015, 16, 22280–22298. [Google Scholar] [CrossRef]
- Ponce De León, I.; Oliver, J.P.; Castro, A.; Gaggero, C.; Bentancor, M.; Vidal, S. Erwinia carotovora elicitors and Botrytis cinerea activate defense responses in Physcomitrella patens. BMC Plant Biol. 2007, 7, 52. [Google Scholar] [CrossRef] [PubMed]
- Kleemann, J.; Rincon-Rivera, L.J.; Takahara, H.; Neumann, U.; van Themaat, E.V.L.; van der Does, H.C.; Hacquard, S.; Stüber, K.; Will, I.; Schmalenbach, W.; et al. Sequential delivery of host-induced virulence effectors by appressoria and intracellular hyphae of the phytopathogen Colletotrichum higginsianum. PLoS Pathog. 2012, 8, e1002643. [Google Scholar] [CrossRef]
- Zhang, Q.Y.; Zhang, L.Q.; Song, L.L.; Duan, K.; Li, N.; Wang, Y.X.; Gao, Q.H. The different interactions of Colletotrichum gloeosporioides with two strawberry varieties and the involvement of salicylic acid. Hortic. Res. 2016, 3, 16007. [Google Scholar] [CrossRef]
- Wei, Y.; Pu, J.; Zhang, H.; Liu, Y.; Zhou, F.; Zhang, K.; Liu, X. The laccase gene (LAC1) is essential for Colletotrichum gloeosporioides development and virulence on mango leaves and fruits. Physiol. Mol. Plant Pathol. 2017, 99, 55–64. [Google Scholar] [CrossRef]
- Ponce De León, I.; Schmelz, E.A.; Gaggero, C.; Castro, A.; Álvarez, A.; Montesano, M. Physcomitrella patens activates reinforcement of the cell wall, programmed cell death and accumulation of evolutionary conserved defence signals, such as salicylic acid and 12-oxo-phytodienoic acid, but not jasmonic acid, upon Botrytis cinerea infection. Mol. Plant Pathol. 2012, 13, 960–974. [Google Scholar] [CrossRef] [PubMed]
- Schüßler, A. Glomus claroideum forms an arbuscular mycorrhiza-like symbiosis with the hornwort Anthoceros punctatus. Mycorrhiza 2000, 10, 15–21. [Google Scholar] [CrossRef]
- Field, K.J.; Rimington, W.R.; Bidartondo, M.I.; Allinson, K.E.; Beerling, D.J.; Cameron, D.D.; Duckett, J.G.; Leake, J.R.; Pressel, S. Functional analysis of liverworts in dual symbiosis with Glomeromycota and Mucoromycotina fungi under a simulated Palaeozoic CO2 decline. ISME J. 2016, 10, 1514–1526. [Google Scholar] [CrossRef]
- Zurbriggen, M.D.; Carrillo, N.; Hajirezaei, M.R. ROS signaling in the hypersensitive response: When, where and what for? Plant Signal. Behav. 2010, 5, 393–396. [Google Scholar] [CrossRef]
- Eloy, Y.R.G.; Vasconcelos, I.M.; Barreto, A.L.H.; Freire-Filho, F.R.; Oliveira, J.T.A. H2O2 plays an important role in the lifestyle of Colletotrichum gloeosporioides during interaction with cowpea [Vigna unguiculata (L.) Walp.]. Fungal Biol. 2015, 119, 747–757. [Google Scholar] [CrossRef] [PubMed]
- Djami-Tchatchou, A.T.; Allie, F.; Straker, C.J. Expression of defence-related genes in avocado fruit (cv. Fuerte) infected with Colletotrichum gloeosporioides. S. Afr. J. Bot. 2013, 86, 92–100. [Google Scholar] [CrossRef]
- Adikaram, N.N.K.B.; Retrieved, A. Differential defence responses expressed in Mango (Mangifera indica L.) Cultivars Resistant and Susceptible to Colletotrichum gloeosporioides. Indian Phytopathol 2016, 66, 34–40. [Google Scholar]
- Spinedi, N.; Storb, R.; Aranda, E.; Romani, F.; Svriz, M.; Varela, S.A.; Moreno, J.E.; Fracchia, S.; Cabrera, J.; Batista-García, R.A.; et al. ROS-Scavenging Enzymes as an Antioxidant Response to High Concentration of Anthracene in the Liverwort Marchantia polymorpha L. Plants 2021, 10, 1478. [Google Scholar] [CrossRef] [PubMed]
- Furbank, R.T.; Tester, M. Phenomics—Technologies to relieve the phenotyping bottleneck. Trends Plant Sci. 2011, 16, 635–644. [Google Scholar] [CrossRef]
- Leal-Delgado, R.; Peña-Valdivia, C.B.; García-Nava, R.; García-Esteva, A.; Martínez-Barajas, E.; Padilla-Chacón, D. Phenotypical, physiological and biochemical traits of the vegetative growth of wild tepary bean (Phaseolus acutifolius) under restricted water conditions. S. Afr. J. Plant Soil 2019, 36, 261–270. [Google Scholar] [CrossRef]
- Ivanov, D.A.; Bernards, M.A. Chlorophyll fluorescence imaging as a tool to monitor the progress of a root pathogen in a perennial plant. Planta 2016, 243, 263–279. [Google Scholar] [CrossRef]
- Ajigboye, O.O.; Bousquet, L.; Murchie, E.H.; Ray, R.V. Chlorophyll fluorescence parameters allow the rapid detection and differentiation of plant responses in three different wheat pathosystems. Funct. Plant Biol. 2016, 43, 356–369. [Google Scholar] [CrossRef]
- Dias, C.S.; Araujo, L.; Alves Chaves, J.A.; DaMatta, F.M.; Rodrigues, F.A. Water relation, leaf gas exchange and chlorophyll a fluorescence imaging of soybean leaves infected with Colletotrichum truncatum. Plant Physiol. Biochem. 2018, 127, 119–128. [Google Scholar] [CrossRef]
- Mihailova, G.; Stoyanova, Z.; Rodeva, R.; Bankina, B.; Bimšteine, G.; Georgieva, K. Physiological changes in winter wheat genotypes in response to the Zymoseptoria tritici infection. Photosynthetica 2019, 57, 428–437. [Google Scholar] [CrossRef]
- Castro, G.L.S.; Júnior, D.D.S.; Bueno, A.C.S.O.; Silva, G.B. Anthracnose in açaí palm leaves reduces leaf gas exchange and chlorophyll a fluorescence. Trop. Plant Pathol. 2017, 42, 13–20. [Google Scholar] [CrossRef]
- Bari, R.; Jones, J.D.G. Role of plant hormones in plant defence responses. Plant Mol. Biol. 2009, 69, 473–488. [Google Scholar] [CrossRef] [PubMed]
- Robert-Seilaniantz, A.; Grant, M.; Jones, J.D.G. Hormone crosstalk in plant disease and defense: More than just jasmonate-salicylate antagonism. Annu. Rev. Phytopathol. 2011, 49, 317–343. [Google Scholar] [CrossRef]
- Spence, C.; Bais, H. Role of plant growth regulators as chemical signals in plant-microbe interactions: A double edged sword. Curr. Opin. Plant Biol. 2015, 27, 52–58. [Google Scholar] [CrossRef]
- Andersson, R.A.; Akita, M.; Pirhonen, M.; Gammelgård, E.; Valkonen, J.P.T. Moss-Erwinia pathosystem reveals possible similarities in pathogenesis and pathogen defense in vascular and nonvascular plants. J. Gen. Plant Pathol. 2005, 71, 23–28. [Google Scholar] [CrossRef]
- Winter, P.S.; Bowman, C.E.; Villani, P.J.; Dolan, T.E.; Hauck, N.R. Systemic acquired resistance in moss: Further evidence for conserved defense mechanisms in plants. PLoS ONE 2014, 9, e101880. [Google Scholar] [CrossRef]
- Ponce de León, I.; Montesano, M. Adaptation mechanisms in the evolution of moss defenses to microbes. Front. Plant Sci. 2017, 8, 366. [Google Scholar] [CrossRef]
- Matsui, H.; Iwakawa, H.; Hyon, G.S.; Yotsui, I.; Katou, S.; Monte, I.; Nishihama, R.; Franzen, R.; Solano, R.; Nakagami, H. Isolation of Natural Fungal Pathogens from Marchantia polymorpha Reveals Antagonism between Salicylic Acid and Jasmonate during Liverwort-Fungus Interactions. Plant Cell Physiol. 2020, 61, 442. [Google Scholar] [CrossRef]
- Betsuyaku, S. The Rise of Evolutionary Molecular Plant-Microbe Interactions (EvoMPMI). Plant Cell Physiol. 2020, 61, 223–224. [Google Scholar] [CrossRef]
- Ponce de León, I.; Hamberg, M.; Castresana, C. Oxylipins in moss development and defense. Front. Plant Sci. 2015, 6, 483. [Google Scholar] [CrossRef]
- Oliver, J.P.; Castro, A.; Gaggero, C.; Cascón, T.; Schmelz, E.A.; Castresana, C.; Ponce De León, I. Pythium infection activates conserved plant defense responses in mosses. Planta 2009, 230, 569–579. [Google Scholar] [CrossRef]
- Mareya, C.R.; Tugizimana, F.; Di Lorenzo, F.; Silipo, A.; Piater, L.A.; Molinaro, A.; Dubery, I.A. Adaptive defence-related changes in the metabolome of Sorghum bicolor cells in response to lipopolysaccharides of the pathogen Burkholderia andropogonis. Sci. Rep. 2020, 10, 7626. [Google Scholar] [CrossRef]
- Zhou, X.T.; Jia, L.J.; Wang, H.Y.; Zhao, P.; Wang, W.Y.; Liu, N.; Song, S.W.; Wu, Y.; Su, L.; Zhang, J.; et al. The potato transcription factor StbZIP61 regulates dynamic biosynthesis of salicylic acid in defense against Phytophthora infestans infection. Plant J. 2018, 95, 1055–1068. [Google Scholar] [CrossRef] [PubMed]
- Wang, L.; Li, Q.; Liu, Z.; Surendra, A.; Pan, Y.; Li, Y.; Irina Zaharia, L.; Ouellet, T.; Fobert, P.R. Integrated transcriptome and hormone profiling highlight the role of multiple phytohormone pathways in wheat resistance against fusarium head blight. PLoS ONE 2018, 13, e0207036. [Google Scholar] [CrossRef]
- Verma, V.; Ravindran, P.; Kumar, P.P. Plant hormone-mediated regulation of stress responses. BMC Plant Biol. 2016, 16, 86. [Google Scholar] [CrossRef]
- Alvarez, A.; Montesano, M.; Schmelz, E.; Ponce de León, I. Activation of shikimate, phenylpropanoid, oxylipins, and auxin pathways in Pectobacterium carotovorum elicitors-treated moss. Front. Plant Sci. 2016, 7, 328. [Google Scholar] [CrossRef]
- Tufan, H.A.; McGrann, G.R.D.; Magusin, A.; Morel, J.B.; Miché, L.; Boyd, L.A. Wheat blast: Histopathology and transcriptome reprogramming in response to adapted and nonadapted Magnaporthe isolates. New Phytol. 2009, 184, 473–484. [Google Scholar] [CrossRef] [PubMed]
- Cano, L.M.; Raffaele, S.; Haugen, R.H.; Saunders, D.G.O.; Leonelli, L.; MacLean, D.; Hogenhout, S.A.; Kamoun, S. Major Transcriptome Reprogramming Underlies Floral Mimicry Induced by the Rust Fungus Puccinia monoica in Boechera stricta. PLoS ONE 2013, 8, e75293. [Google Scholar] [CrossRef]
- Manzo, D.; Ferriello, F.; Puopolo, G.; Zoina, A.; D’Esposito, D.; Tardella, L.; Ferrarini, A.; Ercolano, M.R. Fusarium oxysporum f.sp. radicislycopersici induces distinct transcriptome reprogramming in resistant and susceptible isogenic tomato lines. BMC Plant Biol. 2016, 16, 53. [Google Scholar] [CrossRef] [PubMed]
- Czolpinska, M.; Rurek, M. Plant glycine-rich proteins in stress response: An emerging, still prospective story. Front. Plant Sci. 2018, 9, 302. [Google Scholar] [CrossRef] [PubMed]
- Mangeon, A.; Junqueira, R.M.; Sachetto-Martins, G. Functional diversity of the plant glycine-rich proteins superfamily. Plant Signal. Behav. 2010, 5, 99–104. [Google Scholar] [CrossRef]
- Fu, Z.Q.; Guo, M.; Jeong, B.R.; Tian, F.; Elthon, T.E.; Cerny, R.L.; Staiger, D.; Alfano, J.R. A type III effector ADP-ribosylates RNA-binding proteins and quells plant immunity. Nature 2007, 447, 284–288. [Google Scholar] [CrossRef] [PubMed]
- Souza Cândido, E.; Pinto, M.F.S.; Pelegrini, P.B.; Lima, T.B.; Silva, O.N.; Pogue, R.; Grossi-de-Sá, M.F.; Franco, O.L. Plant storage proteins with antimicrobial activity: Novel insights into plant defense mechanisms. FASEB J. 2011, 25, 3290–3305. [Google Scholar] [CrossRef] [PubMed]
- Francini, A.; Giro, A.; Ferrante, A. Biochemical and molecular regulation of phenylpropanoids pathway under abiotic stresses. In Plant Signaling Molecules: Role and Regulation under Stressful Environments; Iqbal, M., Khan, R., Reddy, P.S., Ferrante, A., Khan, N.A., Eds.; Elsevier: Amsterdam, The Netherlands, 2019; pp. 183–192. ISBN 9780128164518. [Google Scholar]
- Dong, N.Q.; Lin, H.X. Contribution of phenylpropanoid metabolism to plant development and plant–environment interactions. J. Integr. Plant Biol. 2021, 63, 180–209. [Google Scholar] [CrossRef] [PubMed]
- Wen, P.F.; Chen, J.Y.; Wan, S.B.; Kong, W.F.; Zhang, P.; Wang, W.; Zhan, J.C.; Pan, Q.H.; Huang, W.D. Salicylic acid activates phenylalanine ammonia-lyase in grape berry in response to high temperature stress. Plant Growth Regul. 2008, 55, 1–10. [Google Scholar] [CrossRef]
- Kim, D.S.; Hwang, B.K. An important role of the pepper phenylalanine ammonia-lyase gene (PAL1) in salicylic acid-dependent signalling of the defence response to microbial pathogens. J. Exp. Bot. 2014, 65, 2295–2306. [Google Scholar] [CrossRef]
- Tonnessen, B.W.; Manosalva, P.; Lang, J.M.; Baraoidan, M.; Bordeos, A.; Mauleon, R.; Oard, J.; Hulbert, S.; Leung, H.; Leach, J.E. Rice phenylalanine ammonia-lyase gene OsPAL4 is associated with broad spectrum disease resistance. Plant Mol. Biol. 2015, 87, 273–286. [Google Scholar] [CrossRef] [PubMed]
- Weisshaar, B.; Jenkinst, G.I. Phenylpropanoid biosynthesis and its regulation. Curr. Opin. Plant Biol. 1998, 1, 251–257. [Google Scholar] [CrossRef]
- Espiñeira, J.M.; Novo Uzal, E.; Gómez Ros, L.V.; Carrión, J.S.; Merino, F.; Ros Barceló, A.; Pomar, F. Distribution of lignin monomers and the evolution of lignification among lower plants. Plant Biol. 2011, 13, 59–68. [Google Scholar] [CrossRef] [PubMed]
- Tahsili, J.; Sharifi, M.; Safaie, N.; Esmaeilzadeh-Bahabadi, S.; Behmanesh, M. Induction of lignans and phenolic compounds in cell culture of Linum album by culture filtrate of Fusarium graminearum. J. Plant Interact. 2014, 9, 412–417. [Google Scholar] [CrossRef]
- Sánchez-Elordi, E.; Sterling, R.M.; Santiago, R.; de Armas, R.; Vicente, C.; Legaz, M.E. Increase in cytotoxic lignans production after smut infection in sugar cane plants. J. Plant Physiol. 2020, 244, 153087. [Google Scholar] [CrossRef]
- Karimzadeh, F.; Haddad, R.; Garoosi, G.; Khademian, R. Effects of Nanoparticles on Activity of Lignan Biosynthesis Enzymes in Cell Suspension Culture of Linum usitatissimum L. Russ. J. Plant Physiol. 2019, 66, 756–762. [Google Scholar] [CrossRef]
- Berry, E.A.; Tran, M.L.; Dimos, C.S.; Budziszek, M.J.; Scavuzzo-Duggan, T.R.; Roberts, A.W. Immuno and affinity cytochemical analysis of cell wall composition in the moss Physcomitrella patens. Front. Plant Sci. 2016, 7, 248. [Google Scholar] [CrossRef] [PubMed]
- Wang, Z.; Li, X.; Wang, X.; Liu, N.; Xu, B.; Peng, Q.; Guo, Z.; Fan, B.; Zhu, C.; Chen, Z. Arabidopsis endoplasmic reticulum-localized UBAC2 proteins interact with PAMP-INDUCED COILED-COIL to regulate pathogen-induced callose deposition and plant immunity. Plant Cell 2019, 31, 153–171. [Google Scholar] [CrossRef]
- Yan, H.Q.; Zhang, T.T.; Lan, S.C.; Jiang, S. Ultrastructural study on the interaction between Physcomitrella patens and Botrytis cinerea. Plant Pathol. 2018, 67, 42–50. [Google Scholar] [CrossRef]
- Chowdhury, J.; Coad, B.R.; Little, A. Cell Wall Responses to Biotrophic Fungal Pathogen Invasion. Annu. Plant Rev. Online 2019, 2, 1001–1030. [Google Scholar] [CrossRef]
- Gao, Y.; He, C.; Zhang, D.; Liu, X.; Xu, Z.; Tian, Y.; Liu, X.H.; Zang, S.; Pauly, M.; Zhou, Y.; et al. Two trichome birefringence-like proteins mediate xylan acetylation, which is essential for leaf blight resistance in rice. Plant Physiol. 2017, 173, 470–481. [Google Scholar] [CrossRef] [PubMed]
- Madrid Liwanag, A.J.; Ebert, B.; Verhertbruggen, Y.; Rennie, E.A.; Rautengarten, C.; Oikawa, A.; Andersen, M.C.F.; Clausen, M.H.; Scheller, H.V. Pectin biosynthesis: GALS1 in Arabidopsis thaliana Is a β-1,4-Galactan β-1,4-Galactosyltransferase. Plant Cell 2013, 24, 5024–5036. [Google Scholar] [CrossRef]
- Crespo, E.F.; Navarro, J.A.; Soriano, M.S.; Finiti, I.; García-Agustín, P.; Pallás, V.; González-Bosch, C. Hexanoic acid treatment prevents systemic MNSV movement in Cucumis melo plants by priming callose deposition correlating SA and OPDA accumulation. Front. Plant Sci. 2017, 8, 1793. [Google Scholar] [CrossRef] [PubMed]
- Kang, C.H.; Moon, B.C.; Park, H.C.; Koo, S.C.; Chi, Y.H.; Cheong, Y.H.; Yoon, B.D.; Lee, S.Y.; Kim, C.Y. Rice small C2-domain proteins are phosphorylated by calcium-dependent protein kinase. Mol. Cells 2013, 35, 381–387. [Google Scholar] [CrossRef]
- Kang, C.H.; Moon, B.C.; Park, H.C.; Koo, S.C.; Jeon, J.M.; Cheong, Y.H.; Chung, W.S.; Lim, C.O.; Kim, J.Y.; Yoon, B.D.; et al. Rice OsERG3 encodes an unusual small C2-domain protein containing a Ca 2+-binding module but lacking phospholipid-binding properties. Biochim. Biophys. Acta-Gen. Subj. 2011, 1810, 1317–1322. [Google Scholar] [CrossRef]
- Zhu, Z.; Xu, F.; Zhang, Y.; Cheng, Y.T.; Wiermer, M.; Li, X.; Zhang, Y. Arabidopsis resistance protein SNC1 activates immune responses through association with a transcriptional corepressor. Proc. Natl. Acad. Sci. USA 2010, 107, 13960–13965. [Google Scholar] [CrossRef] [PubMed]
- Zhang, Y.; Goritschnig, S.; Dong, X.; Li, X. A Gain-of-Function Mutation in a Plant Disease Resistance Gene Leads to Constitutive Activation of Downstream Signal Transduction Pathways in suppressor of npr1-1, constitutive 1. Plant Cell 2003, 15, 2636–2646. [Google Scholar] [CrossRef] [PubMed]
- Gou, M.; Hua, J. Complex regulation of an R gene SNC1 revealed by autoimmune mutants. Plant Signal. Behav. 2012, 7, 213–216. [Google Scholar] [CrossRef][Green Version]
- Verma, K.; Agrawal, S.B. Salicylic acid-mediated defence signalling in respect to its perception, alteration and transduction. In Salicylic Acid: A Multifaceted Hormone; Springer: Heidelberg, Germany, 2017; pp. 97–122. ISBN 9789811060687. [Google Scholar] [CrossRef]
- Burketova, L.; Trda, L.; Ott, P.G.; Valentova, O. Bio-based resistance inducers for sustainable plant protection against pathogens. Biotechnol. Adv. 2015, 33, 994–1004. [Google Scholar] [CrossRef] [PubMed]
- Vidhyasekaran, P. Bioengineering and Molecular Manipulation of Salicylic Acid Signaling System to Activate Plant Immune Responses for Crop Disease Management. In Plant Innate Immunity Signals and Signaling Systems; Springer: Heidelberg, Germany, 2020; pp. 169–221. [Google Scholar] [CrossRef]
- Eitas, T.K.; Nimchuk, Z.L.; Dangl, J.L. Arabidopsis TAO1 is a TIR-NB-LRR protein that contributes to disease resistance induced by the Pseudomonas syringae effector AvrB (Proceedings of the National Academy of Sciences of the United States of America). Proc. Natl. Acad. Sci. USA 2008, 105, 6475–6480. [Google Scholar] [CrossRef]
- Yang, J.; Yan, L.; Song, Y.; Chai, C.; Song, L.; Guan, L.; Hou, S. New roles for the Arabidopsis TAO1 gene besides disease resistance. Russ. J. Plant Physiol. 2015, 62, 542–550. [Google Scholar] [CrossRef]
- Zhao, H.; Yin, C.C.; Ma, B.; Chen, S.Y.; Zhang, J.S. Ethylene signaling in rice and Arabidopsis: New regulators and mechanisms. J. Integr. Plant Biol. 2021, 63, 102–125. [Google Scholar] [CrossRef]
- Liu, H.; Ma, X.; Liu, S.; Du, B.; Cheng, N.; Wang, Y.; Zhang, Y. The Nicotiana tabacum L. major latex protein-like protein 423 (NtMLP423) positively regulates drought tolerance by ABA-dependent pathway. BMC Plant Biol. 2020, 20, 12. [Google Scholar] [CrossRef]
- Vorwerke, S.; Schiff, C.; Santamaria, M.; Koh, S.; Nishimura, M.; Vogel, J.; Somerville, C.; Somerville, S. EDR2 negatively regulates salicylic acid-based defenses and cell death during powdery mildew infections of Arabidopsis thaliana. BMC Plant Biol. 2007, 7, 35. [Google Scholar] [CrossRef]
- Carella, P.; Kempthorne, C.J.; Wilson, D.C.; Isaacs, M.; Cameron, R.K. Exploring the role of DIR1, DIR1-like and other lipid transfer proteins during systemic immunity in Arabidopsis. Physiol. Mol. Plant Pathol. 2017, 97, 49–57. [Google Scholar] [CrossRef]
- Champigny, M.J.; Isaacs, M.; Carella, P.; Faubert, J.; Fobert, P.R.; Cameron, R.K. Long distance movement of DIR1 and investigation of the role of DIR1-like during systemic acquired resistance in Arabidopsis. Front. Plant Sci. 2013, 4, 230. [Google Scholar] [CrossRef] [PubMed]
- Qin, L.J.; Zhao, D.; Zhao, D.G. Overexpression of NrCN improved TMV resistance in selection marker-free tobacco generated by Gene-Deletor system. Plant Mol. Biol. Rep. 2015, 33, 1619–1633. [Google Scholar] [CrossRef]
- You, M.K.; Shin, H.Y.; Kim, Y.J.; Ok, S.H.; Cho, S.K.; Jeung, J.U.; Yoo, S.D.; Kim, J.K.; Shin, J.S. Novel bifunctional nucleases, OmBBD and AtBBD1, are involved in abscisic acid-mediated callose deposition in Arabidopsis. Plant Physiol. 2010, 152, 1015–1029. [Google Scholar] [CrossRef] [PubMed]
- Acevedo-Garcia, J.; Kusch, S.; Panstruga, R. Magical mystery tour: MLO proteins in plant immunity and beyond. J. Physiol. 2014, 204, 273–281. [Google Scholar] [CrossRef] [PubMed]
- Dubey, N.; Singh, K. Role of NBS-LRR proteins in plant defense. In Molecular Aspects of Plant-Pathogen Interaction; Springer: Heidelberg, Germany, 2018; pp. 115–138. [Google Scholar] [CrossRef]
- Huang, S.; Chen, X.; Zhong, X.; Li, M.; Ao, K.; Huang, J.; Li, X. Plant TRAF proteins regulate NLR immune receptor turnover. Cell Host Microbe 2016, 19, 204–215. [Google Scholar] [CrossRef]
- Liebrand, T.W.H.; van den Burg, H.A.; Joosten, M.H.A.J. Two for all: Receptor-associated kinases SOBIR1 and BAK1. Trends Plant Sci. 2014, 19, 123–132. [Google Scholar] [CrossRef]
- Fradin, E.F.; Zhang, Z.; Ayala, J.C.J.; Castroverde, C.D.M.; Nazar, R.N.; Robb, J.; Liu, C.-M.; Thomma, B.P.H.J. Genetic dissection of Verticillium wilt resistance mediated by tomato Ve1. Plant Physiol. 2009, 150, 320–332. [Google Scholar] [CrossRef]
- Zhang, W.; Fraiture, M.; Kolb, D.; Löffelhardt, B.; Desaki, Y.; Boutrot, F.F.G.; Tör, M.; Zipfel, C.; Gust, A.A.; Brunner, F. Arabidopsis receptor-like protein30 and receptor-like kinase suppressor of BIR1-1/EVERSHED mediate innate immunity to necrotrophic fungi. Plant Cell 2013, 25, 4227–4241. [Google Scholar] [CrossRef]
- Antolín-Llovera, M.; Ried, M.K.; Binder, A.; Parniske, M. Receptor kinase signaling pathways in plant-microbe interactions. Annu. Rev. Phytopathol. 2012, 50, 451–473. [Google Scholar] [CrossRef] [PubMed]
- Chaparro-García, Á. Molecular BASIS of Plant Cell Death Suppression by the Phytophthora infestans Effector AVR3a. Ph.D. Thesis, University of East Anglia, Norwich, UK, 2012. [Google Scholar]
- Ringli, C. The hydroxyproline-rich glycoprotein domain of the Arabidopsis LRX1 requires Tyr for function but not for insolubilization in the cell wall. Plant J. 2010, 63, 662–669. [Google Scholar] [CrossRef]
- Okuda, S.; Fujita, S.; Moretti, A.; Hohmann, U.; Doblas, V.G.; Ma, Y.; Pfister, A.; Brandt, B.; Geldner, N.; Hothorn, M. Molecular mechanism for the recognition of sequence-divergent CIF peptides by the plant receptor kinases GSO1/SGN3 and GSO2. bioRxiv 2019, 117, 2693–2703. [Google Scholar] [CrossRef] [PubMed]
- Waszczak, C.; Carmody, M.; Kangasjärvi, J. Reactive oxygen species in plant signaling. Annu. Rev. Plant Biol. 2018, 69, 209–236. [Google Scholar] [CrossRef]
- Yergaliyev, T.M.; Nurbekova, Z.; Mukiyanova, G.; Akbassova, A.; Sutula, M.; Zhangazin, S.; Bari, A.; Tleukulova, Z.; Shamekova, M.; Masalimov, Z.K.; et al. The involvement of ROS producing aldehyde oxidase in plant response to Tombusvirus infection. Plant Physiol. Biochem. 2016, 109, 36–44. [Google Scholar] [CrossRef] [PubMed]
- Passardi, F.; Longet, D.; Penel, C.; Dunand, C. The class III peroxidase multigenic family in rice and its evolution in land plants. Phytochemistry 2004, 65, 1879–1893. [Google Scholar] [CrossRef]
- Li, Q.; Ai, G.; Shen, D.; Zou, F.; Wang, J.; Bai, T.; Chen, Y.; Li, S.; Zhang, M.; Jing, M.; et al. A Phytophthora capsici Effector Targets ACD11 Binding Partners that Regulate ROS-Mediated Defense Response in Arabidopsis. Mol. Plant 2019, 12, 565–581. [Google Scholar] [CrossRef] [PubMed]
- De Gara, L.; Locato, V.; Dipierro, S.; de Pinto, M.C. Redox homeostasis in plants. The challenge of living with endogenous oxygen production. Respir. Physiol. Neurobiol. 2010, 173, S13–S19. [Google Scholar] [CrossRef]
- Petrov, V.; Hille, J.; Mueller-Roeber, B.; Gechev, T.S. ROS-mediated abiotic stress-induced programmed cell death in plants. Front. Plant Sci. 2015, 6, 69. [Google Scholar] [CrossRef]
- Abera Gebrie, S. Biotrophic Fungi Infection and Plant Defense Mechanism. J. Plant Pathol. Microbiol. 2016, 7, 2. [Google Scholar] [CrossRef]
- Lehman, T.A.; Smertenko, A.; Sanguinet, K.A. Auxin, microtubules, and vesicle traffcking: Conspirators behind the cell wall. J. Exp. Bot. 2017, 68, 3321–3329. [Google Scholar] [CrossRef] [PubMed]
- Moujaber, O.; Stochaj, U. The Cytoskeleton as Regulator of Cell Signaling Pathways. Trends Biochem. Sci. 2020, 45, 96–107. [Google Scholar] [CrossRef] [PubMed]
- Yuan, P.; Tanaka, K.; Du, L.; Poovaiah, B.W. Calcium Signaling in Plant Autoimmunity: A Guard Model for AtSR1/CAMTA3-Mediated Immune Response. Mol. Plant 2018, 11, 637–639. [Google Scholar] [CrossRef] [PubMed]
- Liu, Y.; He, C. A review of redox signaling and the control of MAP kinase pathway in plants. Redox Biol. 2017, 11, 192–204. [Google Scholar] [CrossRef]
- Dubiella, U.; Seybold, H.; Durian, G.; Komander, E.; Lassig, R.; Witte, C.P.; Schulze, W.X.; Romeis, T. Calcium-dependent protein kinase/NADPH oxidase activation circuit is required for rapid defense signal propagation. Proc. Natl. Acad. Sci. USA 2013, 110, 8744–8749. [Google Scholar] [CrossRef]
- Wang, M.; Zheng, Q.; Shen, Q.; Guo, S. The critical role of potassium in plant stress response. Int. J. Mol. Sci. 2013, 14, 7370–7390. [Google Scholar] [CrossRef]
- Pu, X.; Yang, L.; Liu, L.; Dong, X.; Chen, S.; Chen, Z.; Liu, G.; Jia, Y.; Yuan, W.; Liu, L. Genome-wide analysis of the MYB transcription factor superfamily in Physcomitrella patens. Int. J. Mol. Sci. 2020, 21, 975. [Google Scholar] [CrossRef]
- Kim, M.J.; Ruzicka, D.; Shin, R.; Schachtman, D.P. The Arabidopsis AP2/ERF transcription factor RAP2.11 modulates plant response to low-potassium conditions. Mol. Plant 2012, 5, 1042–1057. [Google Scholar] [CrossRef]
- Shin, B.; Choi, G.; Yi, H.; Yang, S.; Cho, I.; Kim, J.; Lee, S.; Paek, N.C.; Kim, J.H.; Song, P.S.; et al. AtMYB21, a gene encoding a flower-specific transcription factor, is regulated by COP1. Plant J. 2002, 30, 23–32. [Google Scholar] [CrossRef]
- Wu, Z.; Cheng, J.; Cui, J.; Xu, X.; Liang, G.; Luo, X.; Chen, X.; Tang, X.; Hu, K.; Qin, C. Genome-wide identification and expression profile of dof transcription factor gene family in pepper (Capsicum annuum L.). Front. Plant Sci. 2016, 7, 574. [Google Scholar] [CrossRef]
- Eulgem, T.; Somssich, I.E. Networks of WRKY transcription factors in defense signaling. Curr. Opin. Plant Biol. 2007, 10, 366–371. [Google Scholar] [CrossRef]
- Perdomo, J.A.; Capó-Bauçà, S.; Carmo-Silva, E.; Galmés, J. Rubisco and rubisco activase play an important role in the biochemical limitations of photosynthesis in rice, wheat, and maize under high temperature and water deficit. Front. Plant Sci. 2017, 8, 490. [Google Scholar] [CrossRef]
- Caplan, J.L.; Kumar, A.S.; Park, E.; Padmanabhan, M.S.; Hoban, K.; Modla, S.; Czymmek, K.; Dinesh-Kumar, S.P. Chloroplast Stromules Function during Innate Immunity. Dev. Cell 2015, 34, 45–57. [Google Scholar] [CrossRef] [PubMed]
- Gupta, O.P.; Sharma, P.; Gupta, R.K.; Sharma, I. Current status on role of miRNAs during plant-fungus interaction. Physiol. Mol. Plant Pathol. 2014, 85, 1–7. [Google Scholar] [CrossRef]
- Salvador-Guirao, R.; Baldrich, P.; Weigel, D.; Segundo, B.S.; Rubio-Somoza, I. The microrna miR773 is involved in the Arabidopsis immune response to fungal pathogens. Mol. Plant-Microbe Interact. 2018, 31, 249–259. [Google Scholar] [CrossRef] [PubMed]
- Andrews, S. FastQC: A Quality Control Tool for High Throughput Sequence Data—ScienceOpen 2010. Available online: https://www.bioinformatics.babraham.ac.uk/projects/fastqc (accessed on 15 April 2020).
- Bolger, A.M.; Lohse, M.; Usadel, B. Trimmomatic: A flexible trimmer for Illumina sequence data. Bioinformatics 2014, 30, 2114–2120. [Google Scholar] [CrossRef]
- Liao, Y.; Smyth, G.K.; Shi, W. The R package Rsubread is easier, faster, cheaper and better for alignment and quantification of RNA sequencing reads. Nucleic Acids Res. 2019, 47, e47-e47. [Google Scholar] [CrossRef]
- Conesa, A.; Madrigal, P.; Tarazona, S.; Gomez-Cabrero, D.; Cervera, A.; McPherson, A.; Szcześniak, M.W.; Gaffney, D.J.; Elo, L.L.; Zhang, X.; et al. A survey of best practices for RNA-seq data analysis. Genome Biol. 2016, 17, 13. [Google Scholar] [CrossRef]
- Bullard, J.H.; Purdom, E.; Hansen, K.D.; Dudoit, S. Evaluation of statistical methods for normalization and differential expression in mRNA-Seq experiments. BMC Bioinform. 2010, 11, 94. [Google Scholar] [CrossRef]
- Love, M.I.; Huber, W.; Anders, S. Moderated estimation of fold change and dispersion for RNA-seq data with DESeq2. Genome Biol. 2014, 15, 550. [Google Scholar] [CrossRef]
- Bonnot, T.; Gillard, M.; Nagel, D. A Simple Protocol for Informative Visualization of Enriched Gene Ontology Terms. Bio-Protocol 2019, 9, e3429. [Google Scholar] [CrossRef]
- Mi, H.; Muruganujan, A.; Ebert, D.; Huang, X.; Thomas, P.D. PANTHER version 14: More genomes, a new PANTHER GO-slim and improvements in enrichment analysis tools. Nucleic Acids Res. 2019, 47, D419–D426. [Google Scholar] [CrossRef] [PubMed]
- Supek, F.; Bošnjak, M.; Škunca, N.; Šmuc, T. Revigo summarizes and visualizes long lists of gene ontology terms. PLoS ONE 2011, 6, e21800. [Google Scholar] [CrossRef] [PubMed]


Publisher’s Note: MDPI stays neutral with regard to jurisdictional claims in published maps and institutional affiliations. |
© 2021 by the authors. Licensee MDPI, Basel, Switzerland. This article is an open access article distributed under the terms and conditions of the Creative Commons Attribution (CC BY) license (https://creativecommons.org/licenses/by/4.0/).
Share and Cite
Otero-Blanca, A.; Pérez-Llano, Y.; Reboledo-Blanco, G.; Lira-Ruan, V.; Padilla-Chacon, D.; Folch-Mallol, J.L.; Sánchez-Carbente, M.d.R.; Ponce De León, I.; Batista-García, R.A. Physcomitrium patens Infection by Colletotrichum gloeosporioides: Understanding the Fungal–Bryophyte Interaction by Microscopy, Phenomics and RNA Sequencing. J. Fungi 2021, 7, 677. https://doi.org/10.3390/jof7080677
Otero-Blanca A, Pérez-Llano Y, Reboledo-Blanco G, Lira-Ruan V, Padilla-Chacon D, Folch-Mallol JL, Sánchez-Carbente MdR, Ponce De León I, Batista-García RA. Physcomitrium patens Infection by Colletotrichum gloeosporioides: Understanding the Fungal–Bryophyte Interaction by Microscopy, Phenomics and RNA Sequencing. Journal of Fungi. 2021; 7(8):677. https://doi.org/10.3390/jof7080677
Chicago/Turabian StyleOtero-Blanca, Adriana, Yordanis Pérez-Llano, Guillermo Reboledo-Blanco, Verónica Lira-Ruan, Daniel Padilla-Chacon, Jorge Luis Folch-Mallol, María del Rayo Sánchez-Carbente, Inés Ponce De León, and Ramón Alberto Batista-García. 2021. "Physcomitrium patens Infection by Colletotrichum gloeosporioides: Understanding the Fungal–Bryophyte Interaction by Microscopy, Phenomics and RNA Sequencing" Journal of Fungi 7, no. 8: 677. https://doi.org/10.3390/jof7080677
APA StyleOtero-Blanca, A., Pérez-Llano, Y., Reboledo-Blanco, G., Lira-Ruan, V., Padilla-Chacon, D., Folch-Mallol, J. L., Sánchez-Carbente, M. d. R., Ponce De León, I., & Batista-García, R. A. (2021). Physcomitrium patens Infection by Colletotrichum gloeosporioides: Understanding the Fungal–Bryophyte Interaction by Microscopy, Phenomics and RNA Sequencing. Journal of Fungi, 7(8), 677. https://doi.org/10.3390/jof7080677