Article

Highly Clonal Structure and Abundance of One Haplotype Characterise the Diplodia sapinea Populations in Europe and Western Asia

by
Kalev Adamson
1,*,
Marili Laas
1,
Kathrin Blumenstein
2,
Johanna Busskamp
3,
Gitta J. Langer
3,
Darta Klavina
4,
Anu Kaur
5,
Tiit Maaten
1,
Martin S. Mullett
6,
Michael M. Müller
7,
Emília Ondrušková
8,
Allar Padari
1,
Enn Pilt
9,
Taavi Riit
10,
Halvor Solheim
11,
Liina Soonvald
12,
Leho Tedersoo
10,
Eeva Terhonen
2 and
Rein Drenkhan
1
1
Institute of Forestry and Rural Engineering, Estonian University of Life Sciences, 51014 Tartu, Estonia
2
Forest Pathology Research Group, Department of Forest Botany and Tree Physiology, Faculty of Forest Sciences and Forest Ecology, Georg-August-University, 37073 Göttingen, Germany
3
Section Mycology and Complex Diseases, Department of Forest Protection, Northwest German Forest Research Institute, 37079 Göttingen, Germany
4
Latvian State Forest Research Institute Silava, Rigas 111, LV 2169 Salaspils, Latvia
5
Tallinn Botanic Garden, Kloostrimetsa Tee 52, 11913 Tallinn, Estonia
6
Phytophthora Research Centre, Department of Forest Protection and Wildlife Management, Faculty of Forestry and Wood Technology, Mendel University in Brno, Zemědělská 3, 613 00 Brno, Czech Republic
7
Bioeconomy and Environment, Natural Resources Institute Finland (Luke), P.O. Box 2, 00791 Helsinki, Finland
8
Department of Plant Pathology and Mycology, Institute of Forest Ecology Slovak Academy of Sciences, 949 01 Nitra, Slovakia
9
Estonian Environment Agency, Mustamäe Tee 33, 10616 Tallinn, Estonia
10
Center of Mycology and Microbiology, Institute of Ecology and Earth Sciences, University of Tartu, 14a Ravila, 50411 Tartu, Estonia
11
Norwegian Institute of Bioeconomy Research, 1431 Ås, Norway
12
Institute of Agricultural and Environmental Sciences, Estonian University of Life Sciences, 51014 Tartu, Estonia
*
Author to whom correspondence should be addressed.
J. Fungi 2021, 7(8), 634; https://doi.org/10.3390/jof7080634
Submission received: 29 June 2021 / Revised: 27 July 2021 / Accepted: 28 July 2021 / Published: 4 August 2021

Abstract

:
Diplodia sapinea is a cosmopolitan endophyte and opportunistic pathogen having occurred on several conifer species in Europe for at least 200 years. In Europe, disease outbreaks have increased on several Pinus spp. in the last few decades. In this study, the genetic structure of the European and western Asian D. sapinea population were investigated using 13 microsatellite markers. In total, 425 isolates from 15 countries were analysed. A high clonal fraction and low genetic distance between most subpopulations was found. One single haplotype dominates the European population, being represented by 45.3% of all isolates and found in nearly all investigated countries. Three genetically distinct subpopulations were found: Central/North European, Italian and Georgian. The recently detected subpopulations of D. sapinea in northern Europe (Estonia) share several haplotypes with the German subpopulation. The northern European subpopulations (Latvia, Estonia and Finland) show relatively high genetic diversity compared to those in central Europe suggesting either that the fungus has existed in the North in an asymptomatic/endophytic mode for a long time or that it has spread recently by multiple introductions. Considerable genetic diversity was found even among isolates of a single tree as 16 isolates from a single tree resulted in lower clonal fraction index than most subpopulations in Europe, which might reflect cryptic sexual proliferation. According to currently published allelic patterns, D. sapinea most likely originates from North America or from some unsampled population in Asia or central America. In order to enable the detection of endophytic or latent infections of planting stock by D. sapinea, new species-specific PCR primers (DiSapi-F and Diplo-R) were designed. During the search for Diplodia isolates across the world for species specific primer development, we identified D. africana in California, USA, and in the Canary Islands, which are the first records of this species in North America and in Spain.

1. Introduction

Diplodia sapinea (Fr.) Fuckel [1,2] (syn. Diplodia pinea (Desm.) Kickx., Sphaeropsis sapinea (Fr.: Fr./Dyko and Sutton) is a widely distributed pathogen of conifers causing Diplodia tip blight. Diplodia sapinea causes a range of disease symptoms in conifers, including browning of needles, shoot blight, twig and branch dieback, crown wilt and bark cankers of adult trees, collar rot, root disease and damping-off of seedlings, and blue stain of sapwood in timber [3,4,5] It is an opportunistic pathogen being able to cause significant economic losses to the most susceptible tree species in nurseries, plantations and natural forests [6,7]. The pathogen’s conidia are easily vectored to new locations by wind, rain splash, insects and humans [7,8,9]. Diplodia sapinea is also a well-known endophyte of Pinus spp. shoots, buds and needles and becomes pathogenic when the host becomes stressed [10,11,12]. This ability of D. sapinea to exist in an asymptomatic mode hampers timing and focusing of any control measures and may increase human mediated spread to new environments. Accordingly, reliable early detection methods are needed for detection of this pathogen in planting material, allowing the prevention of further introductions into new areas. Several molecular assays such as qPCR, conventional PCR, nested conventional PCR and High-Resolution Melting Analyses (HRMA) have been developed for the detection of D. sapinea [13,14,15,16]. All these assays were tested on isolates from a geographic range missing, for instance East-Asia [13,14,15,16]. Thus, a new and reliable assay for molecular detection of D. sapinea, tested on isolates obtained from a wide geographic range, is needed.
The pathogen has a worldwide distribution [5] in temperate and subtropical conifer forests [17,18,19,20], but has only recently been detected as a pathogen in northern hemiboreal and boreal forests. D. sapinea was described in Sweden in 1823 as Sphaeria sapinea Fr. [21] but this record has not been verified using molecular tools and the first verified observation in Sweden was made just recently by Oliva et al. [22]. In Europe it has spread northward during the last two decades possibly due to global trade and climate change [22,23,24,25,26]. Annual monitoring data since 2007 suggest that D. sapinea was first introduced to Estonia by human activities and subsequently spread naturally all over the country [23]. It is thought that D. sapinea has invaded many countries via seedlings, seeds or seed lots contaminated with debris [8,27,28]. Recent climate warming may have enabled the northward spread of D. sapinea, as is believed to be the case for a number other pathogens which have recently been found in northern Europe, e.g., Dothistroma septosporum, Entoleuca mammata, Hymenoscyphus fraxineus, Lecanosticta acicola, Ophiostoma novo-ulmi [29,30,31,32,33,34].
Asexual fruiting bodies of the fungus are commonly encountered on dead host tissue [35]. The sexual state of D. sapinea has never been observed, but recent studies show that the pathogen has a cryptic sexual stage [24,36,37]. Sexual recombination can increase genetic diversity of a pathogen and form genotypes that are suitable to a new environment [38]. Up to now, several population studies of D. sapinea have been conducted, including isolates from around the world, including Australia, Argentina, Canada, Estonia, Ethiopia, France, Indonesia, Italy, Mexico, Montenegro, New Zealand, Serbia, South Africa, Spain, Sumatra, Sweden, Switzerland, Turkey and USA using RAPD markers [39,40], RFLP [41], vegetative incompatibility [42,43,44] and SSR markers [6,35,43,45,46,47,48].
The native range of D. sapinea is thought to be in pine forests of the Northern Hemisphere [42,44]. However, the highest genetic diversity is observed in South Africa, when compared to populations of the Northern Hemisphere [36,45,47]. Although populations of some European countries have been characterised by molecular methods [24,43,47,48], the genetic structure of D. sapinea in Europe (including subpopulations recently established in northern Europe) is still poorly known.
The aim of this study was to characterise the genetic diversity of D. sapinea in Europe in order to improve the understanding of the pathogen’s spread across the continent. According to our experience, existing species-specific DNA primers fail to identify all isolates of D. sapinea, and therefore, we started this research by developing a new primer-pair and testing it with an extensive set of isolates including isolates obtained from a geographically wide range. Isolates identified as D. sapinea using this new primer-pair were characterised using microsatellite markers and mating type determinations. Diversity was determined both at a country (including 1–11 sites each) level and within single trees. Genetic characteristics of subpopulations were compared to the present disease situation in each country.

2. Materials and Methods

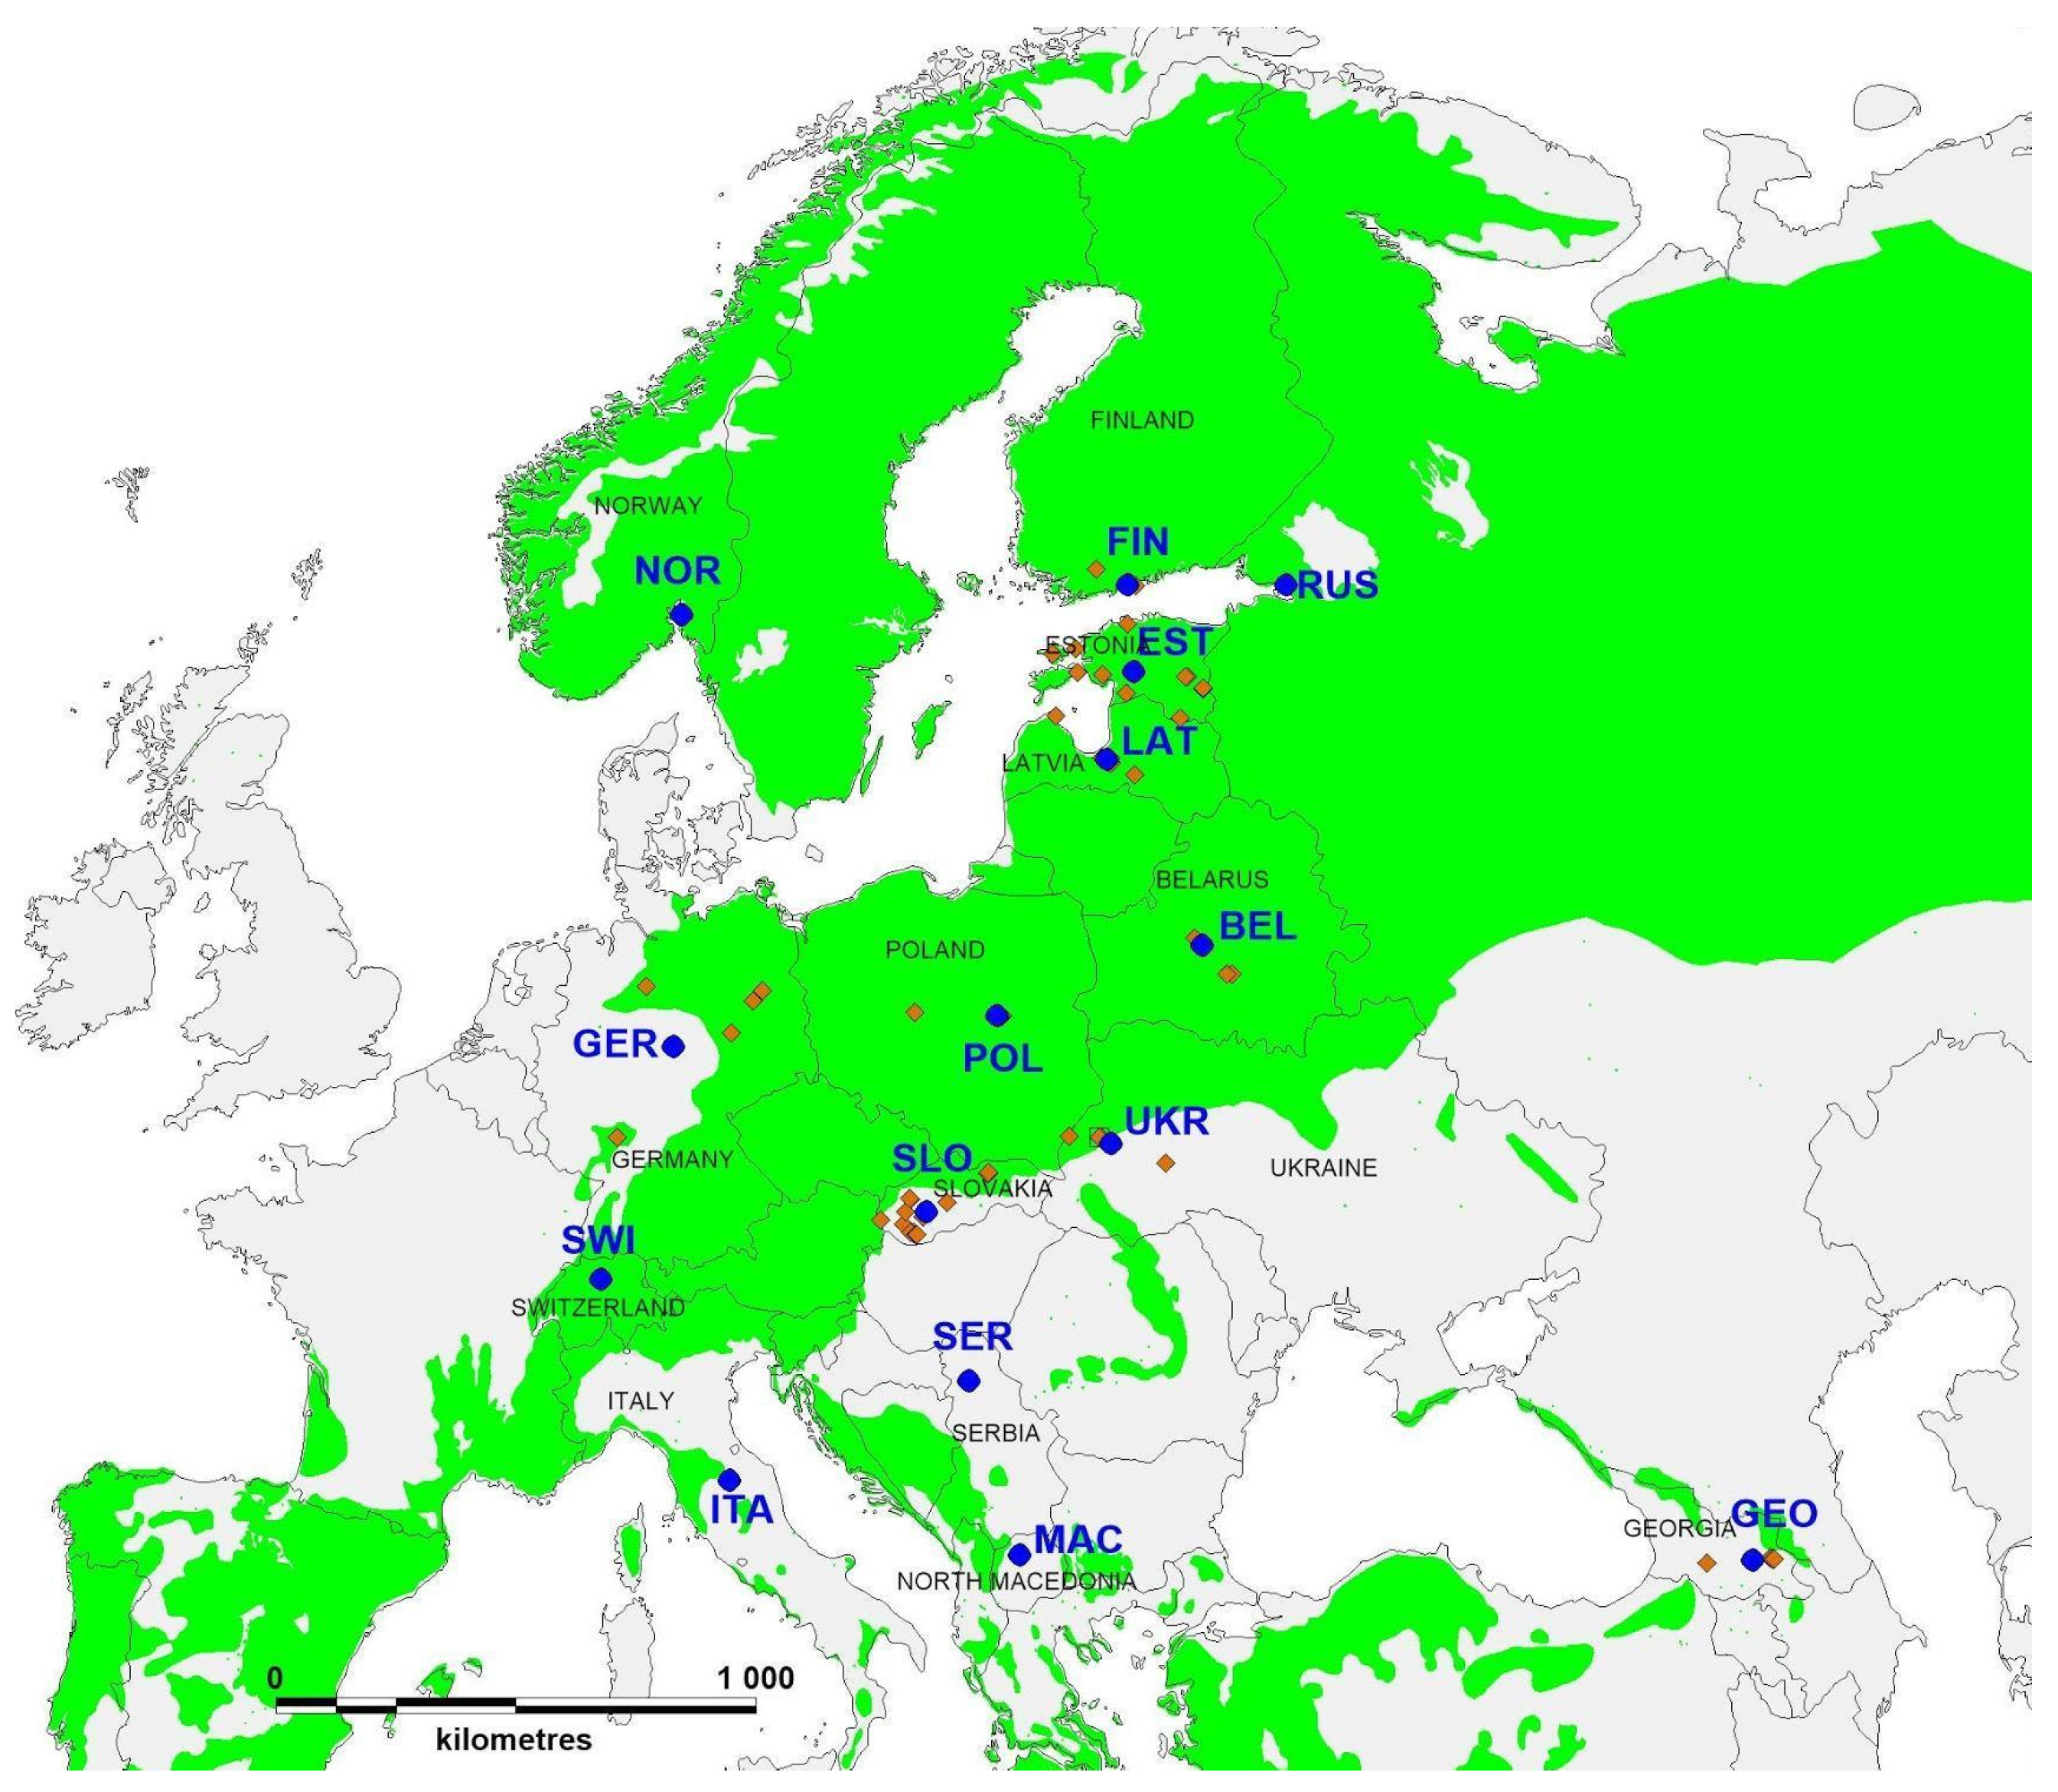
2.1. Sample Collection and Disease Severity

Pine needles, cones and shoots with and without Diplodia sapinea pycnidia were collected from one or several locations in each of 15 countries: Belarus, Estonia, Finland, Georgia, Germany, Italy, Latvia, North Macedonia, Norway, Poland, European part of Russia, Serbia, Slovakia, Switzerland and Ukraine (Figure 1 and Suppl. Tables S1 and S3). Sampled hosts included nine Pinus species, one Pseudotsuga species and one vector (insect) species (Pityogenes quadridens) (Suppl. Table S1). Samples were collected from 2011 to 2020.
Sampled cones, needles and shoots were collected from forests and urban greeneries (Suppl. Tables S1 and S3). Five isolates of D. sapinea were obtained from the exoskeleton of the bark beetle Pityogenes quadridens collected in a Norwegian Pinus sylvestris forest. To study the population structure on a European scale, only one fungal isolate per sampled tree was used in the analyses. To determine the genetic diversity of the pathogen at a small spatial scale, several isolates were obtained from single trees and small groups of nearby trees in Estonia and Slovakia. Additionally, several isolates per tree was used for analyses of first arrival haplotypes into Estonia.
One batch of isolates was obtained from a single P. nigra tree in Järvselja, south-east Estonia, from which the first D. sapinea record was documented in the Baltic states in 2007 [25]. In total, 16 isolates originate from this tree; five of them were isolated in 2012, three in 2013 and eight in 2018. Another batch of 14 isolates was obtained in 2012 from a small (0.7 ha) P. nigra stand in Muhu island, western Estonia. The third batch (10 isolates) was obtained in 2012 from six P. sylvestris trees on Vormsi island (on the west coast of Estonia) in a private garden, from where D. sapinea was found for the first time in the Baltic states on a native host, P. sylvestris [23]. The Estonian isolates were divided into two groups according to sampling time: (a) 2011–2012 as first arrivals of the pathogen; (b) 2013–2018 as the second wave of arrivals of the pathogen [23,25].
In Slovakia, 23 trees from 10 locations were sampled. Two to four isolates were obtained from each tree, yielding a total of 62 isolates. All the isolates were obtained in 2019 from cones of P. nigra or P. sylvestris trees. These and additional sampling sites are detailed in Suppl. Table S1.
Disease severity on native pine species during sampling was assessed in every country. Disease severity was indexed as follows: 1 = endophytic presence only, i.e., no disease outbreaks, 2 = weak local outbreaks, 3 = moderate local outbreaks (lethal for single mature trees) (Suppl. Text S1).

2.2. Fungal Isolations, DNA Extraction and Isolate Identification

Fungal isolations were performed according to the protocols of Mullett and Barnes [50]. Approximately 0.04 g of mycelium from the colony edge was transferred into 2.0 mL micro-centrifuge tubes and stored at −20 °C for DNA extraction. The DNA of the German samples was extracted according to Keriö et al. [51] with some modifications. Mycelium was homogenised with a Retsch MM400 homogeniser (Retsch GmbH, Haan, Germany) using metal beads (⌀ 2.5 mm). DNA was extracted using the GeneJET Genomic DNA Purification Kit (Thermo Scientific, Vilnius, Lithuania).
For the detection of D. sapinea, species-specific conventional PCR was performed with primers DiSapi-F and Diplo-R targeting mtSSU DNA (developed in this study, see Section 2.4). PCR reactions were carried out in 20 µL volumes: 1 µL DNA template, a final concentration of 0.4 µM of each forward and reverse primer, 4 µL 5× HOT FIREPol Blend Master Mix Ready to Load with 10 mM MgCl2 (Solis BioDyne, Tartu, Estonia). Cycling conditions were as follows: initial activation at 95 °C for 15 min, followed by 35 cycles of denaturation at 95 °C for 30 s, annealing at 61 °C for 30 s and elongation at 72 °C for 1 min and the final elongation at 72 °C for 10 min. All PCRs were carried out on a TProfessional Thermocycler (Biometra, Göttingen, Germany). PCR products were visualised on a 1% agarose gel (SeaKem® LE Agarose, Lonza, Rockland, ME, USA) under UV light using a Quantum ST4-system (VilberLourmat SAS, Marne-la-Vallée, France).

2.3. ITS Sequencing

The identity of Diplodia sapinea, D. africana, D. mutila, D. seriata, D. scrobiculata, Botryosphaeria dothidea, Lasiodiplodia gonubiensis, L. theobromae and Trichoderma paraciridescens isolates used for the D. sapinea species-specific primer design (described in Section 2.4.) was confirmed by sequencing the internal transcribed spacer (ITS) region. ITS-PCR was performed using the fungal-specific PCR primers ITS1-F [52] and ITS4 [53]. PCR reactions were carried out as described by Drenkhan et al. [54]. PCR products were sent for sequencing to the Estonian Biocentre in Tartu. The ITS region of samples was sequenced using the primer ITS5 [53]. The sequences were edited using BioEdit version 7.2.5 [55]. BLAST searches for fungal taxa confirmation were performed in GenBank (NCBI). ITS sequences of the isolates were deposited in GenBank (Suppl. Table S2).

2.4. Species-Specific Conventional PCR Primer Design

Primers specific to D. sapinea were designed in silico based on mitochondrial small subunit ribosomal DNA (mtSSU rDNA) sequences of D. sapinea and other related species present in the International Nucleotide Sequence Database Collaboration (INSDC) database. The sequences were downloaded and aligned using MAFFT. Aligned sequences were then scanned for regions conserved in all sequences belonging to D. sapinea, but that contain mismatches in comparison to sequences from other species of Diplodia. Specificity of suitable primer sequences was validated using BLASTn searches against the INSDC nucleotide database and sequences. Primer pairs fully complementary to species other than D. sapinea were discarded. IDT OligoAnalyzer 3.1 was used to select primers with melting temperatures differing by less than 4 °C, and to check the stability of potential homodimers, heterodimers, and hairpin structures.
All PCR experiments were carried out using the following reaction mixture: 5 μL of PCR mastermix with 10 mM MgCl2 (5x HOT FIREPol® Blend Master Mix Ready to Load; Solis Biodyne, Tartu, Estonia); 0.5 μL of both forward and reverse primers (20 μM; 0.4 μM final conc.), 18 μL of PCR grade water, and 1 μL of template DNA. The following thermal cycling program was adopted after optimisation using an annealing temperature gradient: 95 °C for 15 min; 35 cycles at 95 °C for 30 s, 61 °C for 30 s, and 72 °C for 1 min; a final step of 72 °C for 10 min. For primer specificity confirmation, DNA from the pure cultures of D. sapinea, D. africana, D. mutila, D. seriata, D. scrobiculata, Botryosphaeria dothidea, Lasiodiplodia theobromae, and Trichoderma paraviridescens were used (Suppl. Table S2 and Figure S1), as well as DNA from environmental samples of soil, wood and needles infected by D. sapinea (data not shown). In total, we used more than 500 samples from 19 countries covering five continents, including North and South America, Europe, Asia and Oceania. The detection limit of primers was determined using 10-fold serial dilutions of a D. sapinea pure culture DNA sample, whose concentration was determined using a Qubit fluorometer (Thermo Fisher Scientific, Waltham, MA, USA).

2.5. Haplotype Determination

For multilocus haplotyping, 13 microsatellite markers [35,46] were used with fluorescently labelled forward primers (Table 1). Different fluorescent labels (FAM, ATTO532, ATTO550, ATTO565) allowed fragment analysis to be run in a single panel containing amplicons from all 13 loci. PCR reactions were performed in 20 μL reaction volumes, consisting of 2 μL template DNA, a final concentration of 0.3 μM forward and reverse primer, 4 µL 5× HOT FIREPol Blend Master Mix Ready to Load with 10 mM MgCl2 and 13 μL PCR grade water. PCR was done as described by Burgess et al. [46] and Bihon et al. [35] with some modifications (see Table 1).
PCR products for fragment analysis were pooled into a single panel and run on an Applied Biosystems 3130XL genetic analyser along with LIZ 500 size standard (Applied Biosystems). Alleles were scored using GENEMAPPER v5.0 (Applied Biosystems, Carlsbad, CA, USA).

2.6. Genetic Diversity and Differentiation of Populations

Individuals with identical alleles at all microsatellite loci were considered clones. Individuals from the same country were considered to represent one subpopulation. Two datasets were generated: one containing all individuals, i.e., the non-clone-corrected (non-cc) dataset; and one containing only one individual of each multilocus haplotype per subpopulation, i.e., the clone-corrected (cc) dataset. The cc dataset was used to calculate the total number of different multilocus haplotypes using GENALEX 6.5 [56]. The non-cc data set was used for calculating the clonal fraction index CF = 1 − [(number of different multilocus haplotypes)/(total number of isolates)] [57]. The clone-corrected (cc) dataset was used to calculate mean haploid genetic diversity (h), total number of alleles, private alleles, mean number of different alleles (Na), and mean unbiased diversity (uh) for each subpopulation using GENALEX 6.5. Allelic richness (AR, the number of distinct alleles in a population) and private allelic richness (PAR, the number of alleles unique to a particular population), were calculated with ADZE 1.0 using the rarefaction approach, with subpopulation sizes standardised to the smallest sample size of 6 [58].
An analysis of molecular variance (AMOVA) was used on the cc dataset to test the significance of differentiation between subpopulations. Subpopulation RUS was omitted from AMOVA analyses due to its small sample size which did not meet the requirements of the test. Additionally, an AMOVA was conducted to test differentiation of the subpopulations on the two main hosts, P. nigra and P. sylvestris. Other host taxa were discarded from the analysis due to their small sample size.
The software STATISTICA was used to test whether mean haploid genetic diversity (h), mean unbiased diversity (uh), allelic richness (AR) or private allelic richness (PAR) correlate significantly with northern latitudes or eastern longitudes or with disease severity index (Suppl. Text S1).
EDENetworks v2.18 was used for minimum spanning network visualisation on the cc and non-cc dataset [59]. Analyses were carried out on Fst fixation indexes.

2.7. Mating Type Determination and Random Mating

To determine the mating type of D. sapinea isolates, mating type primers were used to amplify the MAT genes. The 20 μL PCR reaction mix consisted of 4 μL of 5× HOT FIREPol Blend Master Mix Ready to Load with 10 mM MgCl2, and each mating type primer at a final concentration of 0.5 µM: DipM1f, DipM1r or DipHMGf, DipHMGr [37], 1 μL template DNA and 13 μL PCR grade water. PCR conditions followed Bihon et al. [37], with the adjustment of the initial denaturation step to 95 °C for 12 min.
In order to investigate the possibility of sexual recombination, two tests were carried out on both cc and non-cc datasets for subpopulations represented by at least six isolates. Firstly, an exact binomial test, using two-tailed p-values, was used to test whether mating type ratios deviated from a 1:1 ratio. Secondly, the index of association (IA) was used to test for haploid linkage disequilibrium of the 13 microsatellite loci in Genalex 6.5 [56].

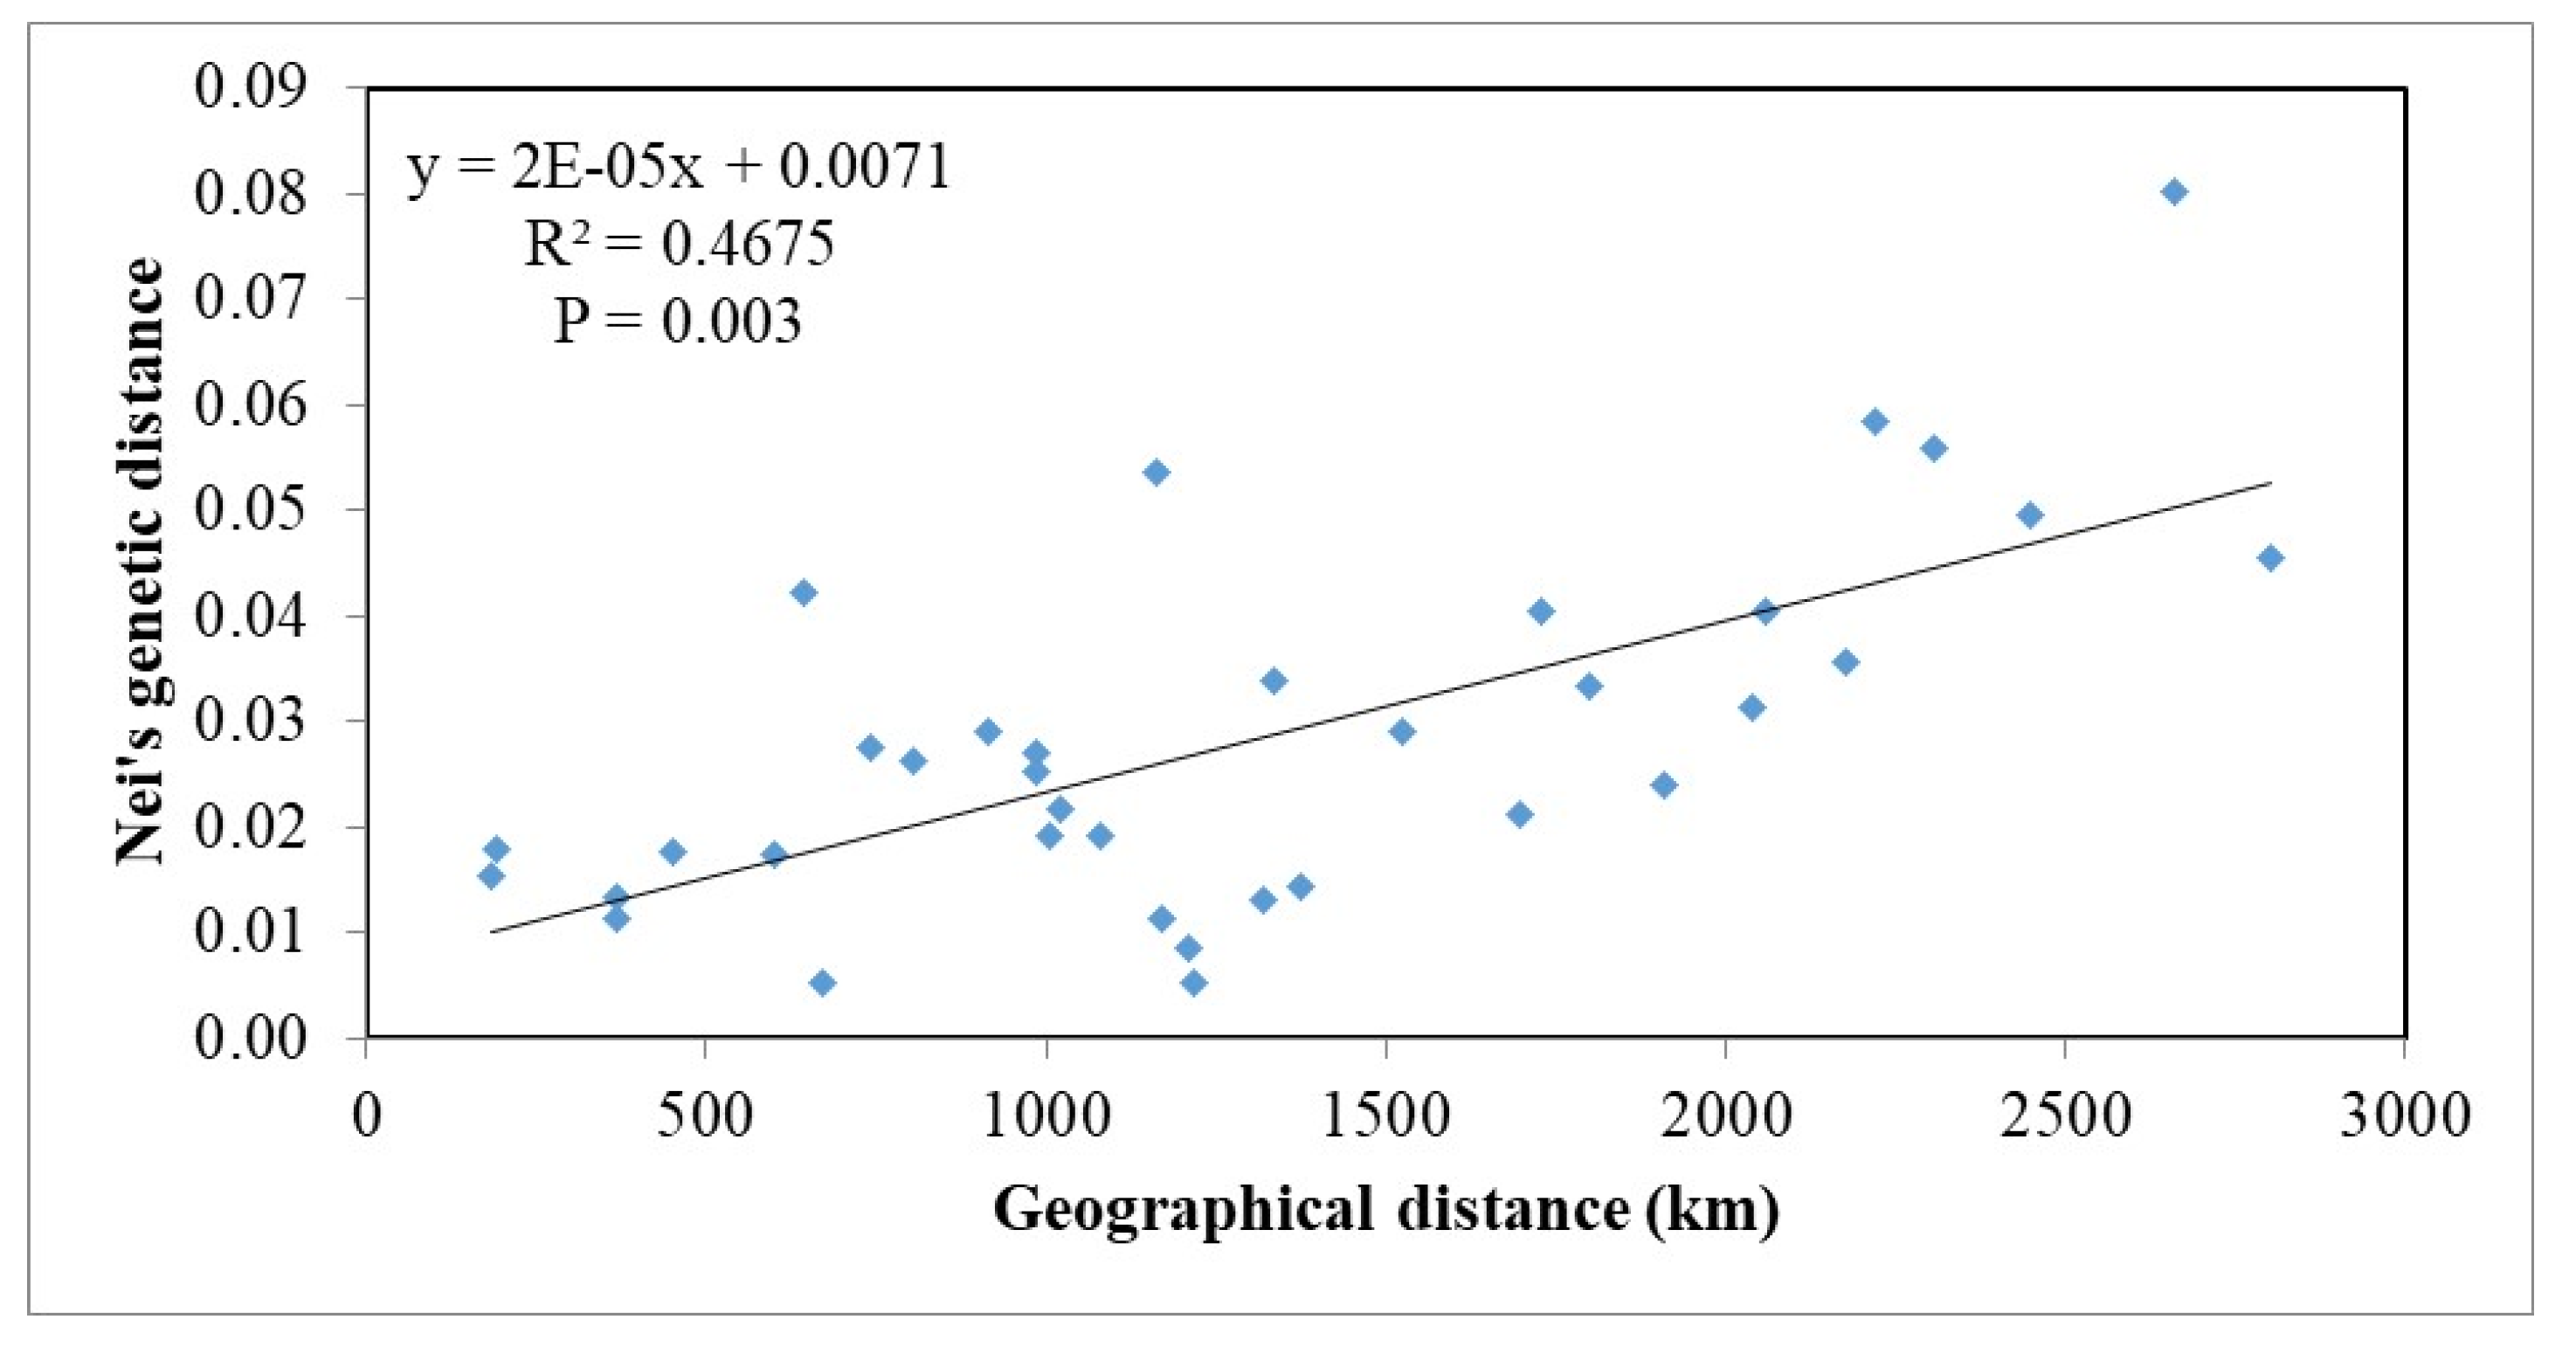
2.8. Isolation by Distance

Mantel tests, conducted in Genalex 6.5, were used to test for isolation by distance on the cc dataset using Nei’s genetic distance [60,61] and geographic distance. Only subpopulations with a sample size of six or higher were included in the analysis. For visualisation of Nei’s genetic distance and geographic distance, principal coordinates analysis (PCoA) was carried out in GENALEX 6.5 using the covariance standardised method on the cc dataset.

2.9. Population Clustering

STRUCTURE 2.3.4 [62] was used to determine the most likely number of population clusters (K). Each of 20 independent runs of K = 1−20 were carried out with 100,000 burn-in iterations followed by a run of 500,000. The optimum number of clusters (K) was determined using the ln(Pr(X|K)) method [63,64] in CLUMPAK [65].

3. Results

3.1. Identification of Diplodia sapinea with Conventional PCR Primers

As a result of in silico screening for inclusivity, specificity, melting temperatures and stability of homodimers, heterodimers and hairpin structures, the following D. sapinea specific primer pair was selected: DiSapi-F-5′ CCCTTATATATCAAACTATGCTTTGT 3′ and Diplo-R-5′ TTACATAGAGGATTGCCTTCG 3′. The forward primer is fully complementary only to the sequences of D. sapinea (4 bp differ from D. scrobiculata), whereas the reverse primer is also complementary to D. scrobiculata. Together, these primers amplify a 546 bp fragment of D. sapinea mtSSU rDNA (Suppl. Figure S1). The detection limit of D. sapinea DNA with these primers in DNA extracts of pure cultures was 2.4 pg. The species-specific PCR primers were tested on several isolates of D. sapinea from five continents (North America, South America, Europe, Asia and Oceania) (Suppl. Table S2 and Figure S1). In agarose gel electrophoresis, the primers produced a visible band of the expected size only from DNA extracted from D. sapinea pure cultures and wood infected by D. sapinea. No bands were observed when using DNA from other species or from the 10 analysed soil samples [66].
The new primers Disapi-F and Diplo-R were able to discriminate D. sapinea from D. africana, D. mutila, D. seriata, D. scrobiculata, Botryosphaeria dothidea, Lasiodiplodia gonubiensis, L. theobromae and Trichoderma paraciridescens isolates (Suppl. Table S2 and Figure S1). A total of 425 European isolates were identified as D. sapinea using the species-specific primer pairs DiSapi-F/Diplo-R. Isolates which were not D. sapinea were excluded from population analyses.

3.2. Multilocus Haplotypes

The 425 analysed D. sapinea isolates from 15 countries across Europe harboured 76 different alleles in 13 microsatellite loci (Suppl. Table S3). Nine of the 13 microsatellite markers were polymorphic, with locus SS12 harbouring nine alleles, SS5 and SS14 five alleles each, SS9 four alleles, SS7 three alleles, and SS8, SS10, SS13 and SS15 two alleles each. Four markers (SS1, SS2, SS11 and SS16) were found to be monomorphic.
Fifty-two different multilocus haplotypes (MLH) were found in the 425 European isolates of D. sapinea (Table 2). The most frequent haplotype, MLH29, was represented by 185 isolates from 13 subpopulations. The second and third most frequent haplotypes were represented by 37 isolates from nine subpopulations (MLH33) and by 32 isolates from two subpopulations (MLH8) (Table 2). From all 52 haplotypes, 27 were private haplotypes, i.e., found just in a single subpopulation.
Subpopulations GER, GEO, EST and UKR had the highest number of haplotypes (13, 10, 9 and 9, respectively) and GER has the highest number of private haplotypes (7), not represented in other subpopulations (Table 3). In general, D. sapinea subpopulations in Europe are characterised by a high clonal fraction index that in 13 out of 15 subpopulations fell in the range 0.45–0.90 (Table 3). Lowest clonal fraction index was found in FIN (0.45) and ITA (0.46) subpopulations, while the highest was recorded in SLO (0.85) and POL (0.88) subpopulations (Table 3).
The highest number of shared haplotypes (5) were found between the EST and GER subpopulations followed by the FIN and POL subpopulations with four shared haplotypes (Table 2).
In the Estonian subpopulation of first arrivals (several isolates per tree) (EST) of D. sapinea, haplotype numbers MLH4, MLH8 and MLH10 were found only in subpopulations EST and GER, while haplotypes MLH29 and MLH33 were found in most examined subpopulations, and haplotype MLH15 was found in two neighbouring countries (Finland and Latvia) to Estonia and in SER (Table 2). In the Estonian subpopulation of the second wave of arrivals (EST), haplotypes MLH2 and MLH16 were found in the EST and UKR subpopulations, MLH9 in EST and GER subpopulations, MLH15 in EST, FIN, LAT and SER subpopulations, MLH40 in EST, GER, ITA, SLO and SWI subpopulations and haplotype number MLH50 in most of the analysed subpopulations (Table 2). Haplotypes MLH1, MLH13, MLH27 and MLH48 were found only in the Estonian (EST) subpopulation. According to minimum spanning network analyses, the betweenness and connectivity between EST an GER population is high on cc and non-cc datasets (Figure 2). GEO subpopulation is related weakly with rest of European subpopulations according to minimum spanning network.

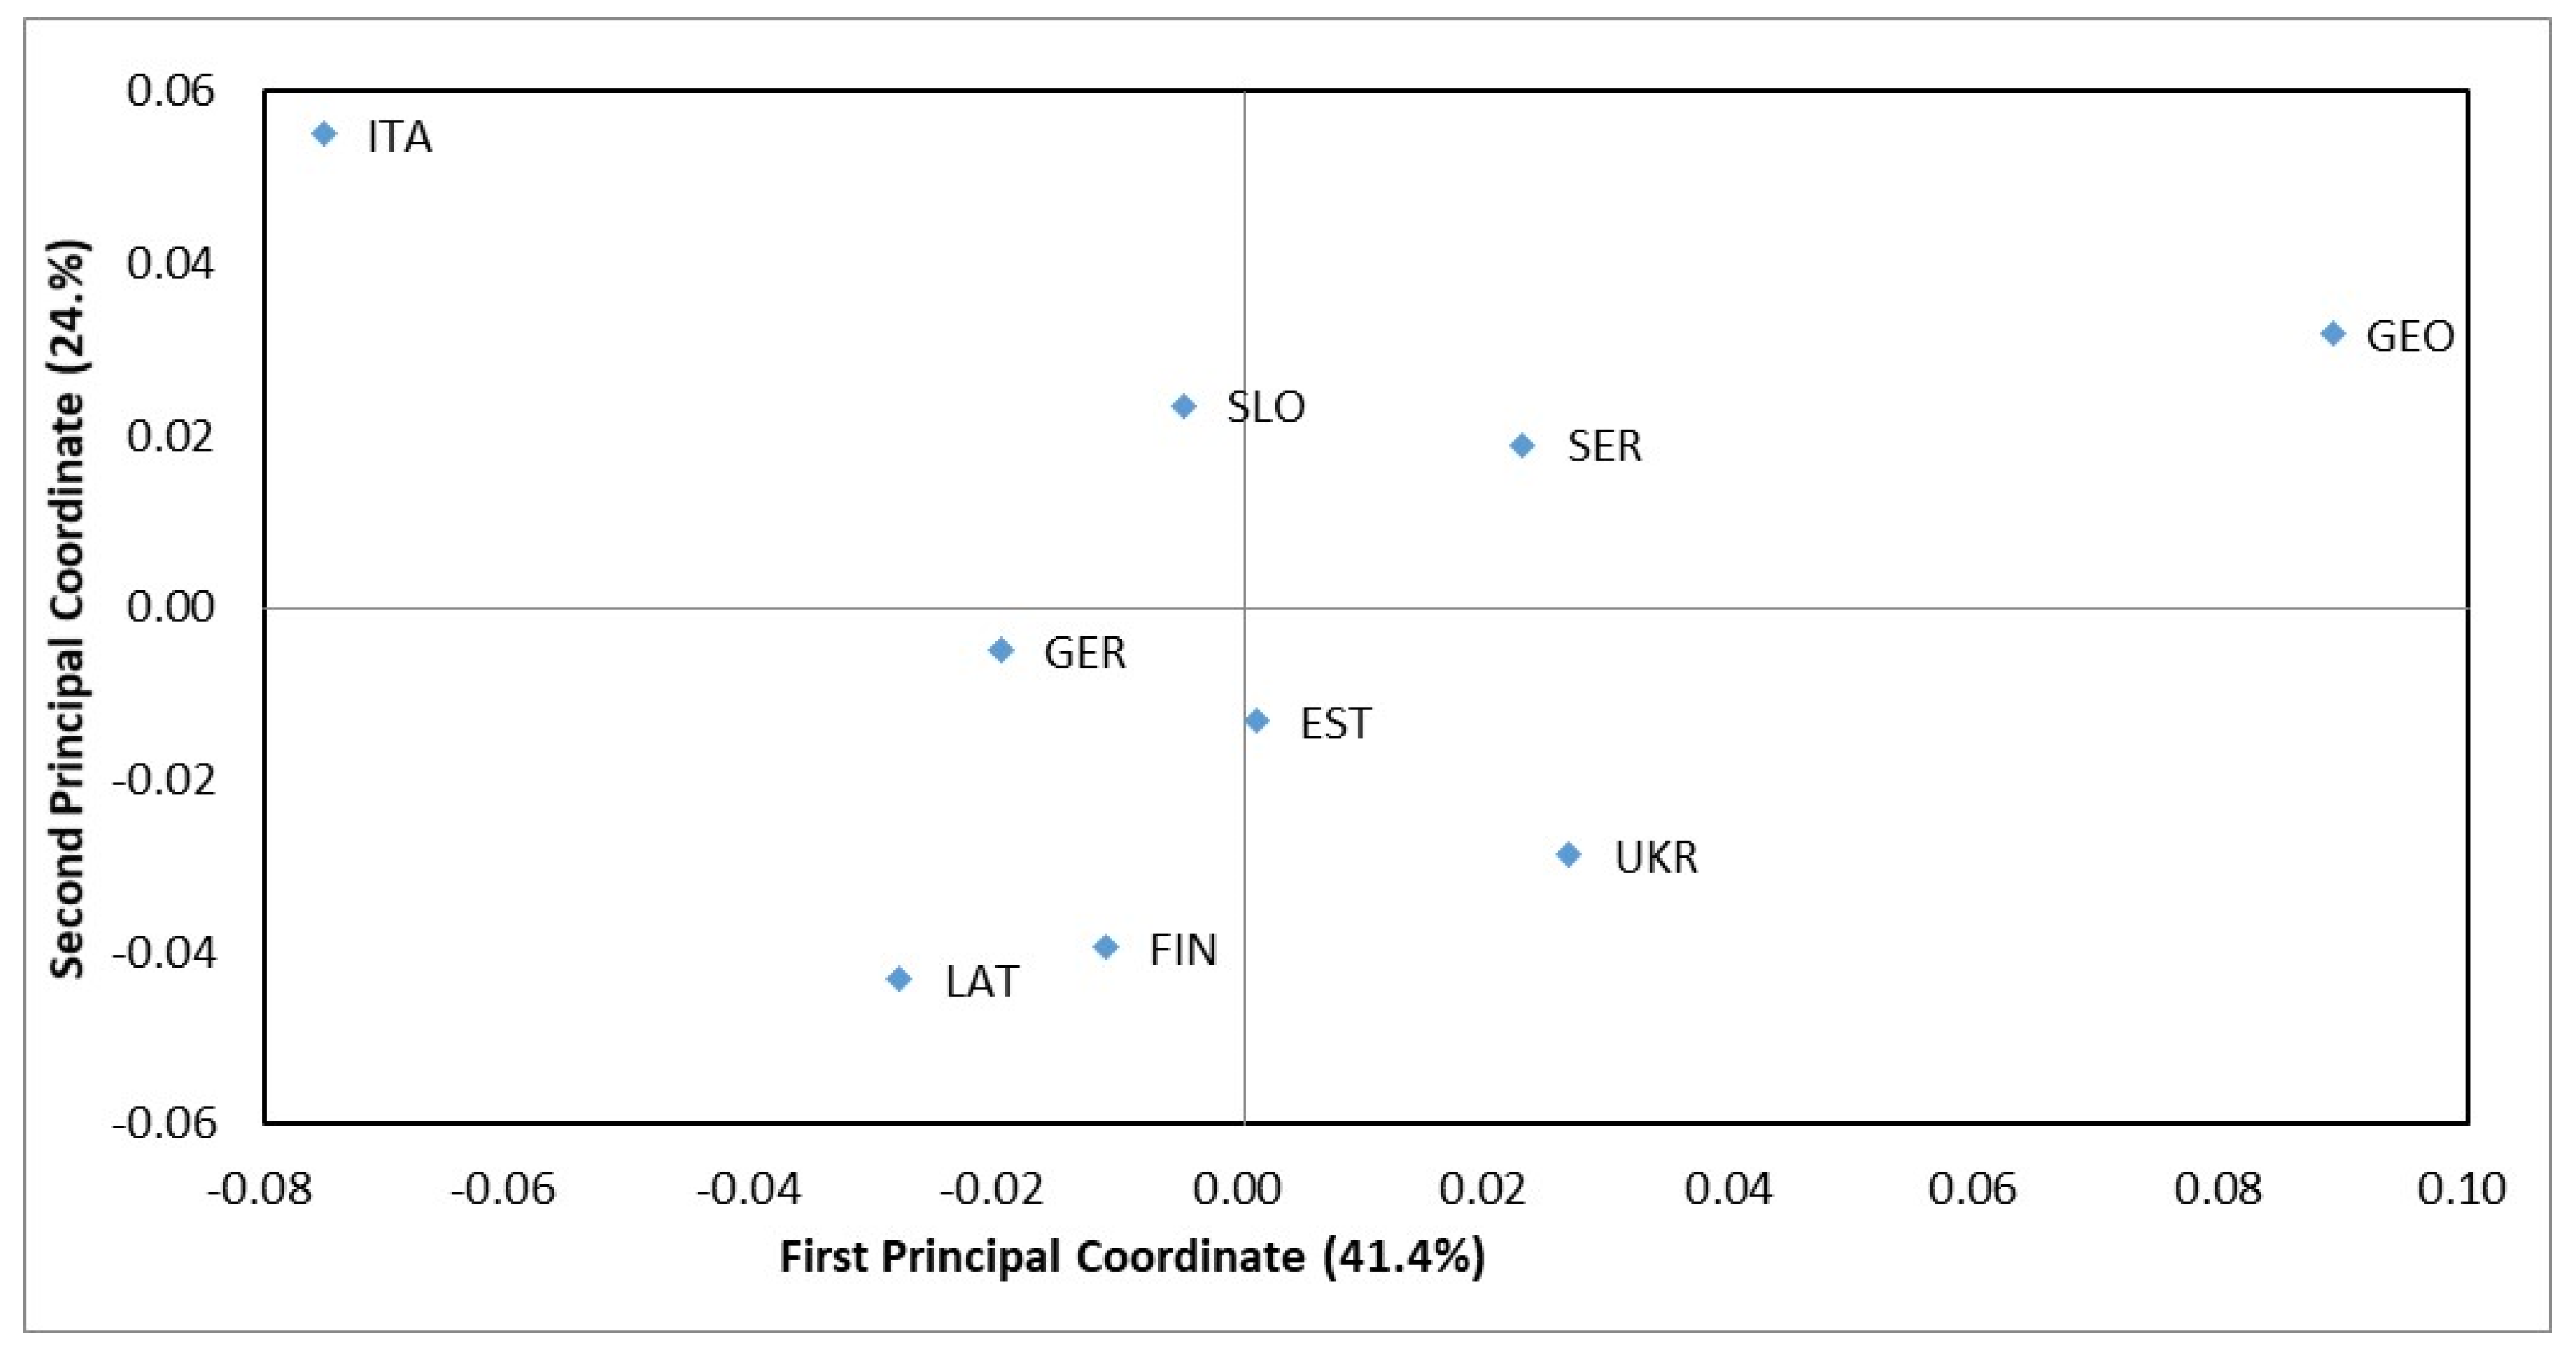
3.3. Population Differentiation

Most European subpopulations of D. sapinea did not differ from each other according to the AMOVA of their haplotype variance. Only GEO and GER differed from some other subpopulations (Table 4). According to the AMOVA 97% of the total molecular variance was ascribed to within-population variation and 3% to among-population variation. No significant differentiation (p = 0.427) was found between isolates from the two main host species, P. nigra and P. sylvestris. Calculation of Nei’s genetic distances revealed that subpopulations GEO and ITA clearly differ from other subpopulations in Europe (Table 5, Figure 3). SER subpopulation is distant from EST and LAT.

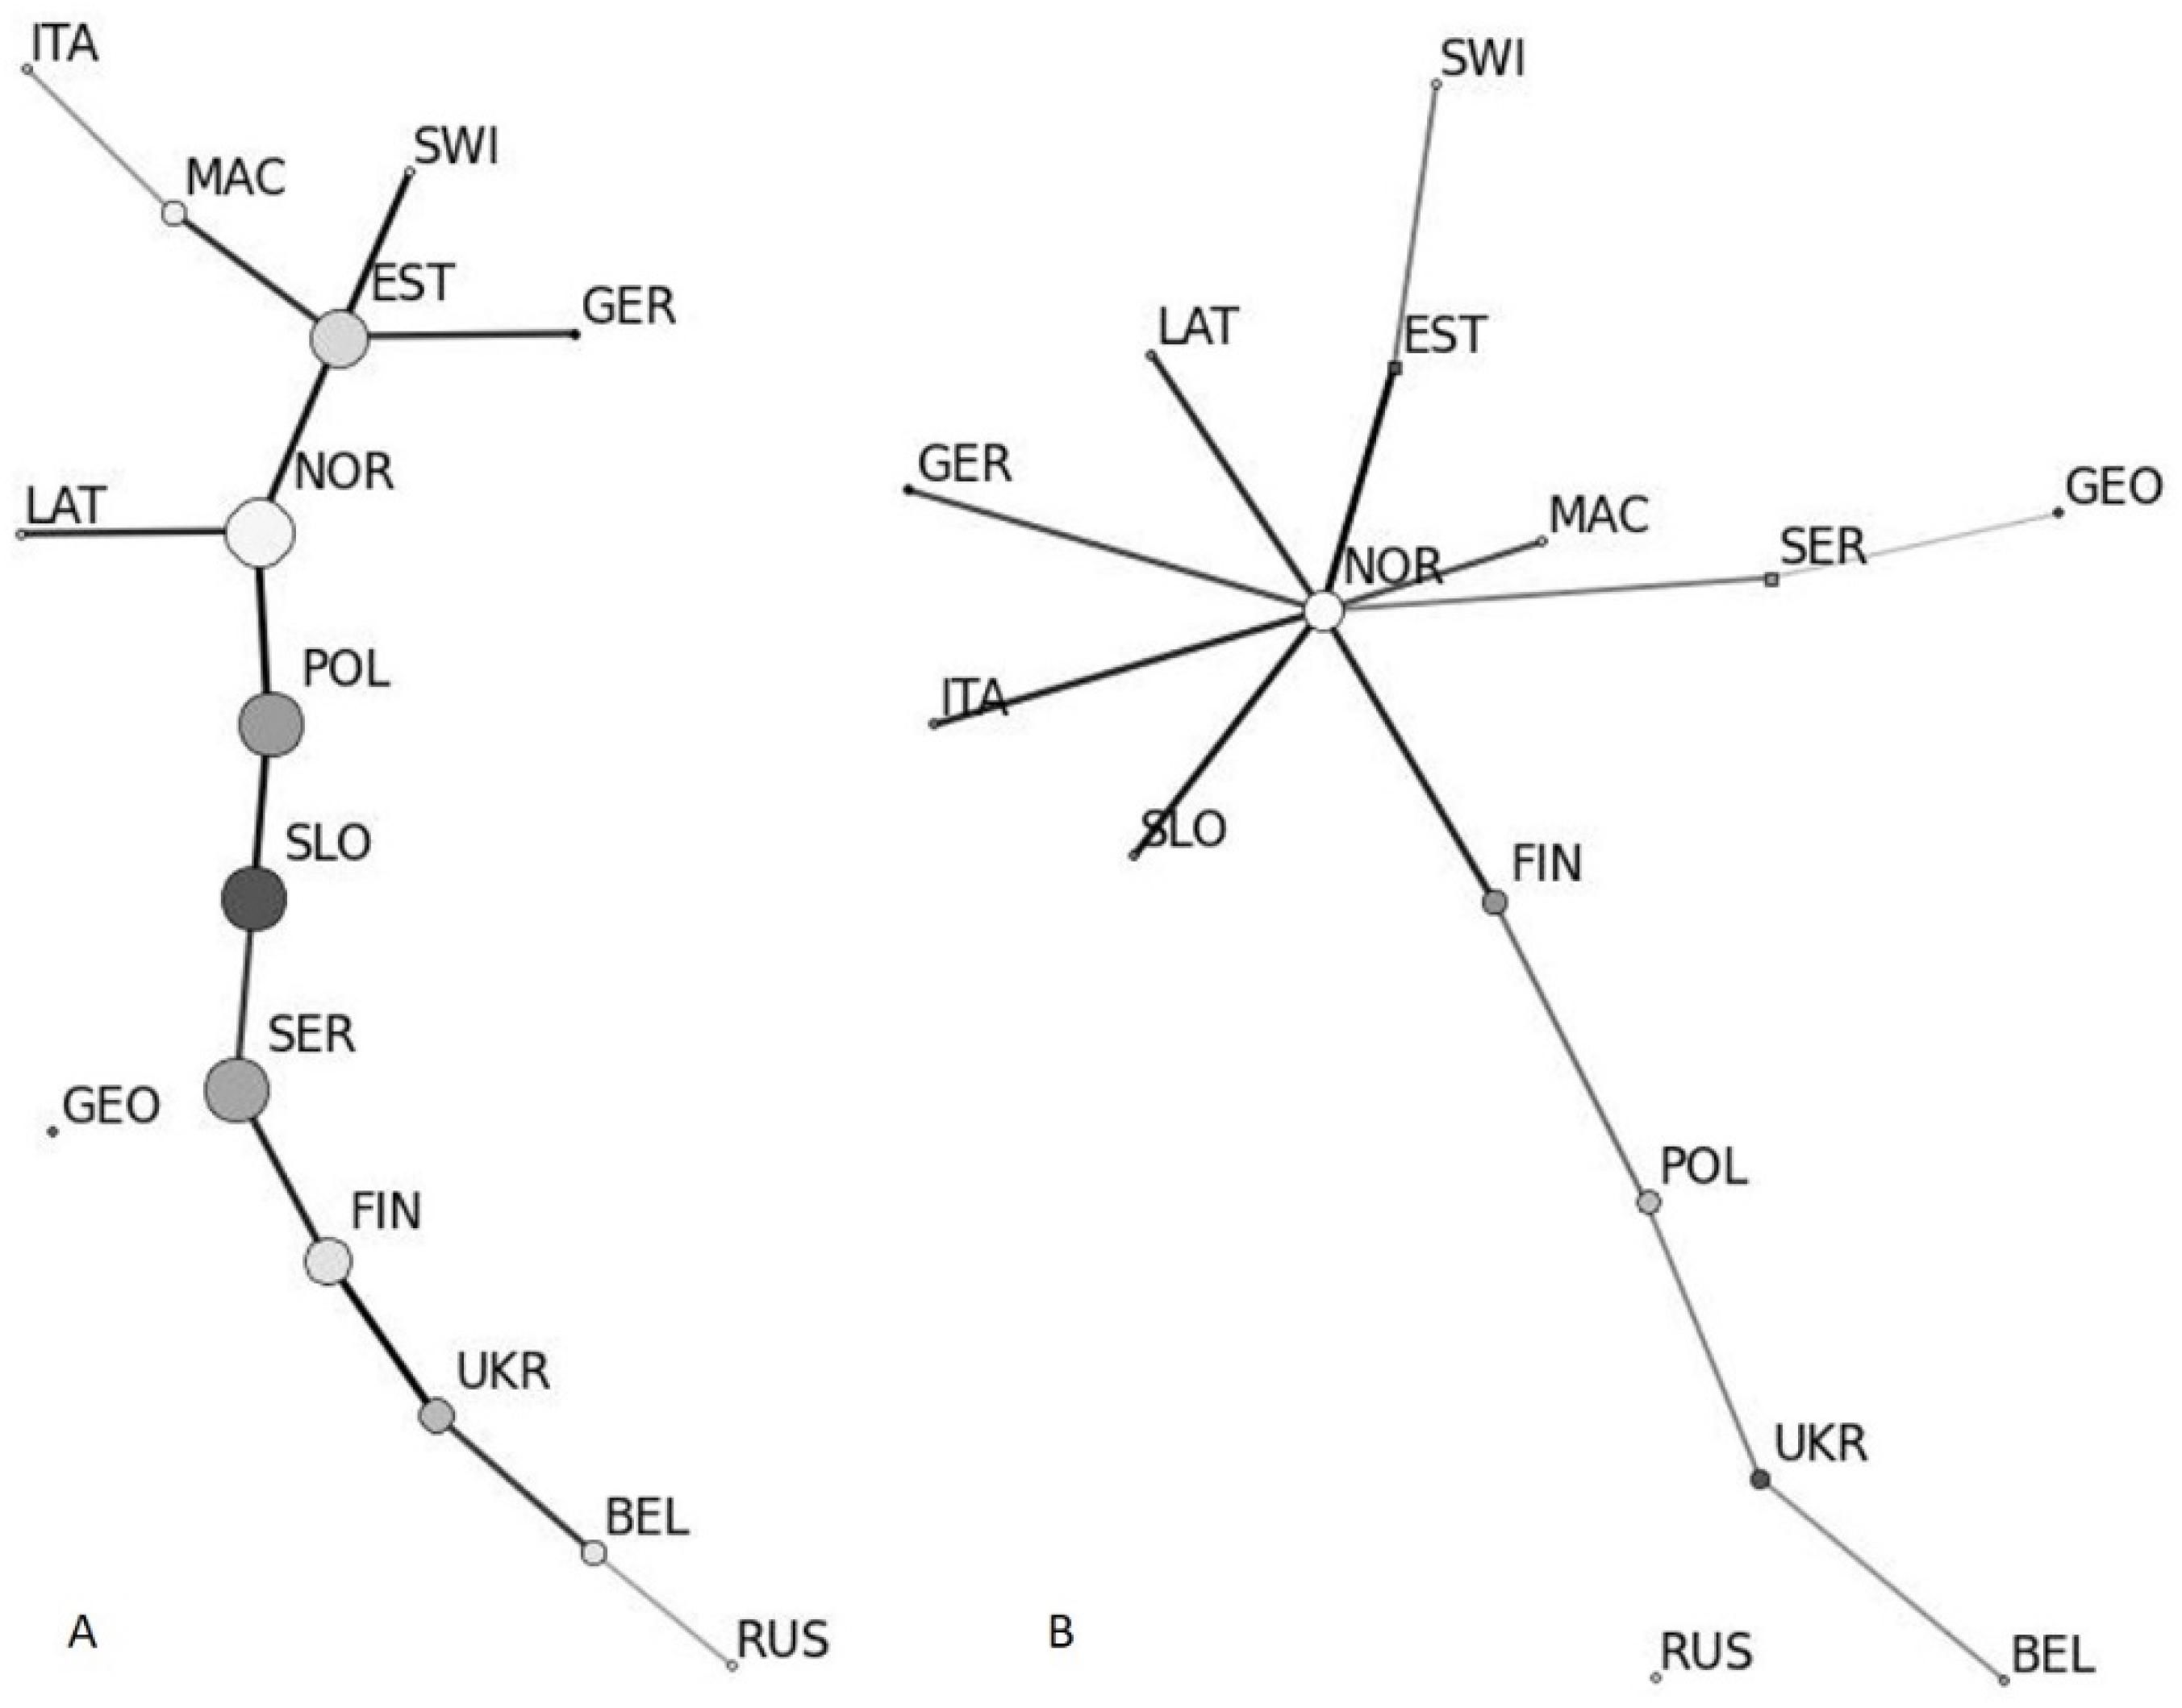
3.4. Isolation by Distance and Clustering Analysis

The Mantel test on Nei’s genetic and geographical distances revealed strong isolation by distance (p = 0.001) when the 15 subpopulations of D. sapinea in Europe and Georgia were considered (Figure 4).
The Structure results indicated that all of the isolates fell into a single cluster (probability of 0.468) (Figure 5).

3.5. Genetic Diversity and Population Statistics

In the 15 subpopulations analysed with 13 microsatellite markers, 13 (RUS) to 22 (GEO, GER and ITA) alleles were recorded per subpopulation (Table 6). Private alleles were observed in seven subpopulations: one allele in subpopulations BEL, EST, FIN and UKR, two alleles in GER and three alleles in subpopulations GEO and four in ITA. The rest of the subpopulations (LAT, MAC, NOR, POL, RUS, SER, SLO and SWI) did not have private alleles. The highest allelic richness (AR) was recorded in subpopulation ITA (1.560) followed by GEO (1.478) and SLO (1.472), but the highest private allelic richness (PAR) was found in subpopulation ITA (0.321) followed by GEO (0.152) and GER (0.077) (Table 6). The lowest allelic richness was observed in EST (1.224), while the lowest private allelic richness occurred in SER (0.022). The highest mean number of different alleles (Na) occurred in SLO (1.538), GEO, LAT and ITA (1.462 for each), while lowest values were observed in EST (1.231).
The highest mean unbiased diversity (uh) was found in SLO (0.185), followed by ITA (0.179) and SER (0.174). The lowest mean unbiased diversity was observed in the EST and UKR subpopulations (Table 6). In comparison, high mean haploid genetic diversity (h) was documented in the SLO (0.154), ITA (0.150) and SER (0.143) subpopulations (Table 6), while the lowest values were found in the EST and UKR subpopulations.
No statistically significant correlations between northern latitudes, eastern longitudes or disease severity index and mean haploid genetic diversity (h), mean unbiased diversity (uh), allelic richness (AR) or private allelic richness (PAR) were found (data not shown).

3.6. Mating Type Distribution and Haploid Linkage Disequilibrium

Both mating type idiomorphs (MAT1-1-1 and MAT1-2-1) were represented in 12 out of 15 subpopulations (Table 7). In subpopulation MAC only the MAT1-2-1 mating type idiomorph was found, while in subpopulations NOR and RUS only the MAT1-1-1 mating type idiomorph was found (Table 7).
An unequal distribution of mating type idiomorphs was registered in GEO, ITA, MAC, NOR and SLO subpopulations in the non-cc dataset (p < 0.05), whereas in the cc dataset both mating type idiomorphs were present in equal proportion (p > 0.05) in all subpopulations.
Random mating was not supported by the index of association (IA) test in the MAC subpopulation (p = 0.045) using the cc dataset, and in the GEO, ITA, MAC, POL, SER and SLO subpopulations using the non-cc dataset (p < 0.05). Using both datasets (cc and non-cc) most subpopulations had low linkage disequilibrium, except the MAC subpopulation (IA = 4.168 on non-cc and 6.210 on cc dataset) (Table 7). The significant IA for many subpopulations, together with the balanced ratio of mating types, suggests that sexual reproduction is likely occurring in these subpopulations, albeit at a low level. The high clonal fraction of many subpopulations demonstrates the predominance of asexual reproduction.

3.7. Haplotypic Diversity at Small Spatial Scale

In 2007 D. sapinea was documented for the first time in the Baltic region on cones of a single P. nigra tree in Järvselja nursery [25]. Sixteen isolates of D. sapinea were obtained from this tree over the course of three years (2012, 2013, 2018) (Table 8). Ten different haplotypes were found from the 16 isolates, giving a clonal fraction of 0.38. The most abundant haplotypes were MLH29 and MLH50, each represented by four isolates. When split by sampling time, 2012/2013 (N = 8) vs. 2018 (N = 8), two haplotypes (MLH29 and MLH50) were found at both sampling times (data not shown). In 2012/2013 seven haplotypes occurred, nos. MLH4, MLH5, MLH10, MLH29, MLH33, MLH42, MLH50 and in 2018 five haplotypes occurred, nos. MLH8, MLH16, MLH29, MLH48, MLH50 (Figure 6).
The first finding of D. sapinea on a native pine tree in Estonia was from Vormsi island, from where six P. sylvestris trees were sampled in 2012. Ten isolates from six trees consisting of four different haplotypes were obtained, giving a clonal fraction of 0.60. The most abundant haplotypes were no. MHL48 with six representatives followed by no. MHL8 with two representatives (Table 8).
In Muhu island, western Estonia D. sapinea has been found since 2008 in a P. nigra stand of 0.7 hectares. In 2012 14 isolates of the pathogen were isolated from c 10 trees, which consisted of four different haplotypes, giving a clonal fraction of 0.71. The most abundant haplotypes were nos. MLH29 and MLH45, each occurring six times (Table 8).
In Slovakia 23 different trees from 10 different sites were sampled (Table 8). From each tree two to four isolates were obtained, with each isolate from a different cone. All trees had only one haplotype per tree, with the exception of a single tree in Galanta, from which two haplotypes, no. MHL39 and MHL40, occurred in four isolates (Table 8).

3.8. Allele Polymorphism in Different Loci in North America and Europe

To date, from the SSR markers which were used on the isolates from Europe and North America only marker SS6 was found to be monomorphic on both continents (Table 9). Within Europe markers SS1 and SS2 appear monomorphic. Among loci that have been analysed in both continents higher polymorphism is observed in North America than in Europe, while the sample size in North America (N = 67) is roughly 10 times smaller than in Europe (N = 623) (Table 9). In other words, European allele diversity is considerably lower than in North America.

4. Discussion

Population analyses, based on 342 isolates of D. sapinea from 14 European and 1 western Asian country, revealed that the subpopulations are dominated by one microsatellite haplotype (MLH29), which comprised 45.3% of the isolates (Table 2). Nonetheless, 27 of the 52 recorded multilocus haplotypes were found only once. Only two subpopulations (GEO and ITA) out of the 15 differed significantly from other subpopulations. Significant isolation by distance was found in the European subpopulations (Figure 4), yet they have relatively low Nei’s genetic distance (0.005–0.080) (Table 5) compared with, for example, Dothistroma septosporum (0.055–0.857) [67,68]. Due to the clustering analyses grouping all isolates into a single cluster (Figure 5) and a relatively low occurrence of private alleles (Table 6), we conclude that the European D. sapinea subpopulation is homogenous and little differentiated, except subpopulations ITA and GEO.
The Italian (ITA) and Georgian (GEO) subpopulations clearly deviated from the others according to Nei’s genetic distance (Figure 3) which may reflect their biogeographic isolation from Central and Northern Europe due to the Alps and Caucasus mountains, respectively. These subpopulations are characterised by having a relatively high number of private haplotypes and alleles (Table 3 and Table 6). Additionally, the ITA and GEO subpopulations were characterised by a high allelic and private allelic richness, mean number of different alleles, mean unbiased diversity and mean haploid genetic diversity compared to other subpopulations.
Based on systematic annual forest disease monitoring (since 2007) on more than 60 permanent sampling sites, D. sapinea was distributed randomly around Estonia until 2012 [69]. Since 2013 the pathogen has spread widely by moving from south to north across Estonia [23]. Among the first arrived haplotypes (isolates obtained up to 2012, Table 2) only MLH4, MLH8 and MLH10 were found in subpopulations EST and GER. Haplotypes MLH29 and MLH33 were found in most of the analysed subpopulations in Europe, and haplotype MLH15 was found in neighbouring countries (Finland and Latvia). Additionally, a strong link between Estonian and German subpopulations was demonstrated by minimum spanning network analyses. Therefore, it is likely that the first introductions of D. sapinea to Estonia were of German origin or from another, unsampled, population. That the movement of D. sapinea infected plant material to Estonia from other countries is possible is demonstrated by the finding of imported seedlings testing positive for the pathogen (R. Drenkhan, unpublished data). For example, these seedlings (Tsuga canadensis and Picea pungens) were imported from the Netherlands and Germany in November 2015 and displayed no clear symptoms of D. sapinea infection, indicating that asymptomatic plants can harbour and facilitate spread of the pathogen.
A previous population study of D. sapinea with isolates from Sweden, Italy, Estonia, Spain and Turkey demonstrated the distribution of one haplotype in all investigated countries [24]. Similarly, in the present study, 25 out of 52 haplotypes occurred in at least two different subpopulations (Table 2, Figure 3), across distances of up to 2800 km (GER-GEO) (Table 5). Burgess et al. [47] documented the occurrence of a single haplotype (MS1) in North America, Europe and New Zealand. In the current study, 45.3% of European isolates were represented by haplotype MLH29. According to McDonald and Linde [38] the domination of a few (virulent) genotypes can evolve through a mixed reproduction system, which poses the highest risk to the host. During sexual recombination new genotypes are produced, and the fittest ones are widely and rapidly dispersed by subsequent asexual reproduction. If a haplotype with high fitness is dispersed over a wide area, an epidemic can arise [38]. For a long time, D. sapinea was thought to be an asexual fungus [70], but both this study (1:1 distribution of mating types and loci that are not linked) and previous ones demonstrate that D. sapinea may be reproducing sexually, at least to some extent [37,45].
D. sapinea is native to pine forests of the Northern Hemisphere [47]. In general, plant pathogens are thought to be more diverse in their native area than in areas where they have been recently introduced [71]. Nonetheless, the highest microsatellite diversity was observed in South Africa, although this is due to multiple introductions since 1909 [45,72]. Bihon et al. [45], using the same set of 13 microsatellites as used in this study, found polymorphism in the South African population of D. sapinea, while no polymorphism was found among isolates from South America, Europe, Australia, New Zealand and part of Africa [36,42,47,48]. In our study four loci (SS1, SS2, SS11 and SS16) were monomorphic (Table 9; Suppl. Table S3) among 425 isolates. Of the 16 microsatellite loci that have been described for D. sapinea, 10 are polymorphic in European subpopulations while 15 are polymorphic in North American populations (Table 9) [42,43,47,48]. In addition, the loci which were analysed in European and North American populations were found to be more diverse in North America, even if the sample size was roughly 10 times smaller than that of Europe (Table 9). These results support the view that D. sapinea is more likely indigenous to North America than Europe, while almost nothing is known about the population diversity of the fungus in Asia and thus the exact origin of the pathogen remains unknown.
Somewhat surprisingly, in the Estonian subpopulation a high haplotype diversity was observed on a single tree in Järvselja nursery, southeast Estonia, where 10 haplotypes were found from 16 isolates (Table 8). The P. nigra tree was moderately to heavily infected by D. sapinea, depending on the year. For comparison, in Slovakia just nine different haplotypes were found among 70 isolates from 23 trees. Only once were two different haplotypes observed on the same tree in Slovakia (Table 8). Of note is that from the single tree in Järvselja two haplotypes (MLH5 and MLH42) were isolated which were not found anywhere else in Estonia and haplotype MLH48 was found only in Estonia (Table 8). Additionally, the first record of D. sapinea for Estonia and for all of northern Europe was on this particular P. nigra tree [25]. It can be surmised that different haplotypes of D. sapinea have been sporadically imported into this area, probably with infected nursery stock. Another possibility is that sexual recombination has occurred on the tree, altering the haplotypic composition of its isolates. Strengthening the hypothesis about sexual proliferation is the occurrence of both mating types on the tree since 2012/2013.
The relatively high genetic diversity observed in newly established subpopulations in the Baltics and Finland may be explained by a long existence of the fungus in endophytic or asymptomatic modes. In the autumn of 2014, a survey was carried out in the northern Baltics including 85 asymptomatic pine needle and bud samples from 14 stands across Estonia and northern Latvia. The samples were analysed with D. sapinea species-specific primers and none of the samples were positive for D. sapinea (R. Drenkhan, unpublished data). Consequently, the endophytic or asymptomatic existence of D. sapinea in Estonia was possible only in restricted or unsampled areas. Terhonen et al. [73] found recently that D. sapinea is an endophyte in healthy P. sylvestris trees in Finland. Separate introductions of different strains of the fungus, as has happened in South Africa where the highest diversity of the pathogen is documented [45], is the most likely means of increasing genetic diversity of such an invasive pathogen. The distribution of identical haplotypes in remote geographic areas indicates that movement of haplotypes across large distances is possible.
Several molecular assays have been developed for the detection D. sapinea in environmental samples [13,14,15,16]. All these previously published methods were tested on isolates originating from 3–6 countries from one or two continents per method [13,14,15,16], while samples from most of Asia and South America were missing. In this study, novel species-specific PCR primers were designed and samples from five continents were used for detection and testing of D. sapinea in environmental samples such as imported and planted stock, seed and seedling lots. New species-specific primers provide more rapid and reliable detection of D. sapinea compared to conventional or nested conventional PCR primers previously published.
During testing of the new PCR protocol with various isolates of Diplodia spp. we identified D. africana (MW332343) from a cone collected in California, USA which is to our knowledge the first record of this fungus on Pinus canariensis in North America. We also found D. africana (MW332342) from a cone of P. canariensis collected in the Canary Islands, to our knowledge the first record of D. africana in Spain.

5. Conclusions

In the European D. sapinea population the dominance of a single haplotype as well as high genetic similarity between different regions were found, suggesting high gene-flow between different countries, except Italy and Georgia. The first established subpopulation of D. sapinea in northern Europe (Estonia) was likely introduced from central Europe (Germany), due to the occurrence of several common haplotypes. Furthermore, the relatively new subpopulations in northern Europe seem to have a mixed mode of reproduction (both asexual and sexual) and have similar levels of genetic diversity as older subpopulations in central and southern Europe. This situation may suggest that the pathogen population are evolutionary fit and could pose an increasing risk to pine forests, particularly in the face of a changing climate. Despite c 200 years of documented presence in European coniferous forests, D. sapinea is less diverse in Europe than in North America, which may suggest that the pathogen is not native to Europe. Further speculations on the origin of D. sapinea need population studies to be extended to Asia and Central America.

Supplementary Materials

The following are available online at https://www.mdpi.com/article/10.3390/jof7080634/s1, Figure S1: Gel picture of amplicons (546 bp) obtained with the species-specific primers DiSapi-F and Diplo-R from various Diplodia sapinea isolates (see Suppl. Table S2). The first lane in both rows is a 100–3000 bp ladder. Samples 1–18 represent D. sapinea from different regions as follows: 1—Belarus, 2—Brazil, 3—Canada, 4—Estonia, 5—Finland, 6—Georgia, 7—Germany, 8—Italy, 9—North Macedonia, 10—New Zealand, 11—Poland, 12—Russia, Far East, 13—Russia Siberia, 14—Serbia, 15—Singapore, 16—Slovakia, 17—Switzerland, 18—Ukraine. Samples 19–20 represent D. africana from Spain, Tenerife and USA, Long Beach. Sample 21 represents D. mutila from USA, Long Beach. Sample 22 represents D. seriata from Portugal. Samples 23–24 represent D. scrobiculata from Canada and Italy. Sample 25 represents Botryosphaeria dothidea from Georgia. Samples 26–27 represent Lasiodiplodia theobromae from Singapore and Lasiodiplodia gonubiensis from Brazil. Sample 28 represents Trichoderma paraviridescens from Ukraine. C—negative control. Table S1: Diplodia sapinea isolates used in this study. Table S2: List of isolates used for D. sapinea specific primers validation. Table S3: Allele frequencies for 13 loci for D. sapinea.

Author Contributions

Sample collection, K.A., M.L., K.B., J.B., G.J.L., D.K., A.K., T.M., M.M.M., E.O., A.P., E.P., H.S., L.S., L.T., E.T. and R.D., laboratory and data analyses, K.A., M.L. and T.R., manuscript preparation and writing, K.A., M.L., K.B., J.B., G.J.L., D.K., M.S.M., M.M.M., E.O., T.R., H.S., L.T., E.T. and R.D. All authors have read and agreed to the published version of the manuscript.

Funding

This research were funded by the Estonian Science Foundation grant PUT PSG136, Slovak Research and Development Agency VEGA 2/0077/18, the European Regional Development Fund, Project Phytophthora Research Centre Reg. No. CZ.02.1.01/0.0/0.0/15_003/0000453, JSC “Latvia’s State Forests” project no. 5-5.9.1_007f_101_21_69 and European Regional Development Fund Estonian University of Life Sciences ASTRA Project “Value-chain based bio-economy”.

Institutional Review Board Statement

Not applicable.

Informed Consent Statement

Not applicable.

Data Availability Statement

All the ITS sequences are deposited into GenBank (https://www.ncbi.nlm.nih.gov/genbank/, accessed on 16 June 2021). Isolates of Diplodia sapinea are stored in the Laboratory of Forest Pathology in the Estonian University of Life Sciences and are deposited in the Fungal Culture Collection, Estonian University of Life Sciences. The collected data are stored on PlutoF Data management and Publishing Platform (https://plutof.ut.ee, accessed on 16 June 2021). All the relevant data are published in this article and its supplementary files.

Acknowledgments

Authors are thankful to Eliise Kass, who helped to isolate D. sapinea pure cultures.

Conflicts of Interest

The authors declare no conflict of interest.

References

  1. Phillips, A.; Alves, A.; Abdollahzadeh, J.; Slippers, B.; Wingfield, M.; Groenewald, J.; Crous, P. The Botryosphaeriaceae: Genera and species known from culture. Stud. Mycol. 2013, 76, 51–167. [Google Scholar] [CrossRef] [Green Version]
  2. Slippers, B.; Boissin, E.; Phillips, A.; Groenewald, J.; Lombard, L.; Wingfield, M.; Postma, A.; Burgess, T.; Crous, P. Phylogenetic lineages in the Botryosphaeriales: A systematic and evolutionary framework. Stud. Mycol. 2013, 76, 31–49. [Google Scholar] [CrossRef] [PubMed] [Green Version]
  3. Brookhouser, L.W.; Peterson, G.W. Infection of Austrian, Scots, and ponderosa pines by Diplodia pinea. Phytopathology 1971, 61, 409–414. [Google Scholar] [CrossRef]
  4. Peterson, G.W. Infection, epidemiology, and control of Diplodia blight of Austrian ponderosa and Scots pines. Phytopathology 1977, 67, 511–514. [Google Scholar] [CrossRef]
  5. Swart, W.J.; Knox-Davis, P.S.; Wingfield, M.J. Sphaeropsis sapinea, with special reference to its occurrence on Pinus spp. in South Africa. South Africa For. J. 1985, 35, 1–8. [Google Scholar]
  6. Blodgett, J.T.; Stanosz, G.R. Sphaeropsis sapinea Morphotypes Differ in Aggressiveness, but Both Infect Nonwounded Red or Jack Pines. Plant Dis. 1997, 81, 143–147. [Google Scholar] [CrossRef] [Green Version]
  7. Swart, W.J.; Wingfield, M.J. Biology and Control of Sphaeropsis sapinea on Pinus species in South Mrica. Detail 1991, 30, 40. [Google Scholar]
  8. Bihon, W.; Slippers, B.; Burgess, T.; Wingfield, M.J.; Wingfield, B. Sources of Diplodia pinea endophytic infections in Pinus patula and P. radiata seedlings in South Africa. For. Pathol. 2011, 41, 370–375. [Google Scholar] [CrossRef] [Green Version]
  9. Drenkhan, T.; Voolma, K.; Adamson, K.; Sibul, I. The large pine weevil Hylobius abietis (L.) as a potential vector of the pathogenic fungus Diplodia sapinea (Fr.) Fuckel. Agric. For. Èntomol. 2016, 19, 4–9. [Google Scholar] [CrossRef] [Green Version]
  10. Bußkamp, J.; Langer, G.J.; Langer, E.J. Sphaeropsis sapinea and fungal endophyte diversity in twigs of Scots pine (Pinus sylvestris) in Germany. Mycol. Prog. 2020, 19, 985–999. [Google Scholar] [CrossRef]
  11. Oliva, J.; Ridley, M.; Redondo, M.A.; Caballol, M. Competitive exclusion amongst endophytes determines shoot blight severity on pine. Funct. Ecol. 2020, 35, 239–254. [Google Scholar] [CrossRef]
  12. Stanosz, G.R.; Blodgett, J.T.; Smith, D.R.; Kruger, E.L. Water stress and Sphaeropsis sapinea as a latent pathogen of red pine seedlings. New Phytol. 2001, 149, 531–538. [Google Scholar] [CrossRef] [Green Version]
  13. Flowers, J.; Hartman, J.; Vaillancourt, L. Detection of Latent Sphaeropsis sapinea Infections in Austrian Pine Tissues Using Nested-Polymerase Chain Reaction. Phytopathology 2003, 93, 1471–1477. [Google Scholar] [CrossRef] [PubMed] [Green Version]
  14. Luchi, N.; Capretti, P.; Surico, G.; Orlando, C.; Pazzagli, M.; Pinzani, P. A Real-Time Quantitative PCR Assay for the Detection of Sphaeropsis sapinea from Inoculated Pinus nigra Shoots. J. Phytopathol. 2005, 153, 37–42. [Google Scholar] [CrossRef]
  15. Luchi, N.; Pratesi, N.; Simi, L.; Pazzagli, M.; Capretti, P.; Scala, A.; Slippers, B.; Pinzani, P. High-Resolution Melting Analysis: A new molecular approach for the early detection of Diplodia pinea in Austrian pine. Fungal Biol. 2011, 115, 715–723. [Google Scholar] [CrossRef] [PubMed] [Green Version]
  16. Smith, D.R.; Stanosz, G.R. A Species-Specific PCR Assay for Detection of Diplodia pinea and D. scrobiculata in Dead Red and Jack Pines with Collar Rot Symptoms. Plant Dis. 2006, 90, 307–313. [Google Scholar] [CrossRef] [PubMed]
  17. Desprez-Loustau, M.-L.; Marçais, B.; Nageleisen, L.-M.; Piou, D.; Vannini, A. Interactive effects of drought and pathogens in forest trees. Ann. For. Sci. 2006, 63, 597–612. [Google Scholar] [CrossRef] [Green Version]
  18. Fabre, B.; Marçais, B.; Desprez-Loustau, M.; Piou, D. Can the emergence of pine Diplodia shoot blight in France be explained by changes in pathogen pressure linked to climate change? Glob. Chang. Biol. 2011, 17, 3218–3227. [Google Scholar] [CrossRef] [Green Version]
  19. Langer, G.; Bressem, U.; Habermann, M. Diplodia-Triebsterben der Kiefer und endophytischer Nachweis des Erregers Sphaeropsis sapinea. AFZ-Der Wald 2011, 11, 28–31. [Google Scholar]
  20. De Urbina, E.O.; Mesanza, N.; Aragonés, A.; Raposo, R.; Elvira-Recuenco, M.; Boqué, R.; Patten, C.; Aitken, J.; Iturritxa, E. Emerging Needle Blight Diseases in Atlantic Pinus Ecosystems of Spain. Forests 2017, 8, 18. [Google Scholar] [CrossRef] [Green Version]
  21. Fries, E.M. Systema Mycologicum, 2, 620; Gryphiswaldia: Lund, Sweden; Berlin, Germany, 1823. [Google Scholar]
  22. Oliva, J.; Boberg, J.; Stenlid, J. First report of Sphaeropsis sapinea on Scots pine (Pinus sylvestris) and Austrian pine (P. nigra) in Sweden. New Dis. Rep. 2013, 27, 23. [Google Scholar] [CrossRef] [Green Version]
  23. Adamson, K.; Klavina, D.; Drenkhan, R.; Gaitnieks, T.; Hanso, M. Diplodia sapinea is colonizing the native Scots pine (Pinus sylvestris) in the northern Baltics. Eur. J. Plant Pathol. 2015, 143, 343–350. [Google Scholar] [CrossRef]
  24. Brodde, L.; Adamson, K.; Camarero, J.J.; Castaño, C.; Drenkhan, R.; Lehtijärvi, A.; Luchi, N.; Migliorini, D.; Sánchez-Miranda, A.; Stenlid, J.; et al. Diplodia Tip Blight on Its Way to the North: Drivers of Disease Emergence in Northern Europe. Front. Plant Sci. 2019, 9, 1818. [Google Scholar] [CrossRef] [Green Version]
  25. Hanso, M.; Drenkhan, R. Diplodia pinea is a new pathogen on Austrian pine (Pinus nigra) in Estonia. Plant Pathol. 2009, 58, 797. [Google Scholar] [CrossRef]
  26. Müller, M.M.; Hantula, J.; Wingfield, M.; Drenkhan, R. Diplodia sapinea found on Scots pine in Finland. For. Pathol. 2019, 49, e12483. [Google Scholar] [CrossRef] [Green Version]
  27. Burgess, T.; Wingfield, M.J. Quarantine is important in restricting the spread of exotic seed-borne tree pathogens in the Southern hemisphere. Intern. For. Rev. 2002, 4, 56–65. [Google Scholar]
  28. Wingfield, M.J.; Slippers, B.; Roux, J.; Wingfield, B.D. Worldwide movement of exotic forest fungi, especially in the tropics and the southern hemisphere: This article examines the impact of fungal pathogens introduced in plantation forestry. Bioscience 2001, 51, 134–140. [Google Scholar] [CrossRef] [Green Version]
  29. Adamson, K.; Drenkhan, R.; Hanso, M. Invasive brown spot needle blight caused by Lecanosticta acicola in Estonia. Scand. J. For. Res. 2015, 30, 587–593. [Google Scholar] [CrossRef]
  30. Drenkhan, R.; Riit, T.; Adamson, K.; Hanso, M. The earliest samples of Hymenoscyphus albidus vs. H. fraxineus in Estonian mycological herbaria. Mycol. Prog. 2016, 15, 835–844. [Google Scholar] [CrossRef]
  31. Hanso, M.; Drenkhan, R. First observations of Mycosphaerella pini Estonia. Plant Pathol. 2008, 57, 1177. [Google Scholar] [CrossRef]
  32. Jürisoo, L.; Adamson, K.; Padari, A.; Drenkhan, R. Health of elms and Dutch elm disease in Estonia. Eur. J. Plant Pathol. 2019, 154, 823–841. [Google Scholar] [CrossRef]
  33. Lutter, R.; Drenkhan, R.; Tullus, A.; Jürimaa, K.; Tullus, T.; Tullus, H. First record of Entoleuca mammata in hybrid aspen plantations in hemiboreal Estonia and stand–environmental factors affecting its prevalence. Eur. J. For. Res. 2019, 138, 263–274. [Google Scholar] [CrossRef]
  34. Mullett, M.S.; Adamson, K.; Bragança, H.; Bulgakov, T.; Georgieva, M.; Henriques, J.; Jürisoo, L.; Laas, M.; Drenkhan, R. New country and regional records of the pine needle blight pathogens Lecanosticta acicola, Dothistroma septosporum and Dothistroma pini. For. Pathol. 2018, 48, e12440. [Google Scholar] [CrossRef]
  35. Bihon, W.; Burgess, T.; Slippers, B.; Wingfield, M.J.; Wingfield, B. Distribution of Diplodia pinea and its genotypic diversity within asymptomatic Pinus patula trees. Australas. Plant Pathol. 2011, 40, 540–548. [Google Scholar] [CrossRef]
  36. Bihon, W.; Burgess, T.; Slippers, B.; Wingfield, M.J.; Wingfield, B.D. High levels of genetic diversity and cryptic recombination is widespread in introduced Diplodia pinea populations. Australas. Plant Pathol. 2012, 41, 41–46. [Google Scholar] [CrossRef] [Green Version]
  37. Bihon, W.; Wingfield, M.J.; Slippers, B.; Duong, T.; Wingfield, B. MAT gene idiomorphs suggest a heterothallic sexual cycle in a predominantly asexual and important pine pathogen. Fungal Genet. Biol. 2014, 62, 55–61. [Google Scholar] [CrossRef] [Green Version]
  38. McDonald, B.A.; Linde, C. Pathogen populationgenetics, Evolutionary potential, and durable resistance. Annu. Rev. Phytopathol. 2002, 40, 349–379. [Google Scholar] [CrossRef] [Green Version]
  39. De Wet, J.; Wingfield, M.J.; Coutinho, T.; Wingfield, B. Characterization of Sphaeropsis sapinea Isolates from South Africa, Mexico, and Indonesia. Plant Dis. 2000, 84, 151–156. [Google Scholar] [CrossRef] [Green Version]
  40. Smith, D.R.; Stanosz, G.R. Confirmation of two distinct populations of Sphaeropsis sapinea in the north central United States using RAPDs. Phytopathology 1995, 85, 699–704. [Google Scholar] [CrossRef]
  41. Hausner, G.; Reid, J.; Hopkin, A.; Davis, C. Variation in culture and rDNA among isolates of Sphaeropsis sapinea from Ontario and Manitoba. Can. J. Plant Pathol. 1999, 21, 256–264. [Google Scholar] [CrossRef]
  42. Burgess, T.; Wingfield, B.D.; Wingfield, M.J. Comparison of genotypic diversity in native and introduced populations of Sphaeropsis sapinea isolated from Pinus radiata. Mycol. Res. 2001, 105, 1331–1339. [Google Scholar] [CrossRef] [Green Version]
  43. Manzanos, T.; Aragonés, A.; Iturritxa, E. Genotypic diversity and distribution of Sphaeropsis sapinea within Pinus radiata trees from northern Spain. For. Pathol. 2019, 49, e12550. [Google Scholar] [CrossRef]
  44. Smith, H.; Wingfield, M.J.; De Wet, J.; Coutinho, T. Genotypic Diversity of Sphaeropsis sapinea from South Africa and Northern Sumatra. Plant Dis. 2000, 84, 139–142. [Google Scholar] [CrossRef] [PubMed] [Green Version]
  45. Bihon, W.; Slippers, B.; Burgess, T.; Wingfield, M.J.; Wingfield, B. Diverse sources of infection and cryptic recombination revealed in South African Diplodia pinea populations. Fungal Biol. 2012, 116, 112–120. [Google Scholar] [CrossRef] [Green Version]
  46. Burgess, T.; Wingfield, M.J.; Wingfield, B. Simple Sequence Repeat Markers Distinguish among Morphotypes of Sphaeropsis sapinea. Appl. Environ. Microbiol. 2001, 67, 354–362. [Google Scholar] [CrossRef] [PubMed] [Green Version]
  47. Burgess, T.I.; Wingfield, M.J.; Wingfield, B.D. Global distribution of Diplodia pinea genotypes revealed using simple sequence repeat (SSR) markers. Australas. Plant Pathol. 2004, 33, 513–519. [Google Scholar] [CrossRef]
  48. Zlatkovic, M.; Wingfield, M.J.; Jami, F.; Slippers, B. Genetic uniformity characterizes the invasive spread of Neofusicoccum parvum and Diplodia sapinea in the Western Balkans. For. Pathol. 2019, 49, e12491. [Google Scholar] [CrossRef]
  49. Caudullo, G.; Welk, E.; San-Miguel-Ayanz, J. Chorological data for the main European woody species. Data Brief 2020, 12, 662–666. [Google Scholar] [CrossRef] [PubMed]
  50. Mullett, M.; Barnes, I. Dothistroma Isolation and Molecular Identification Methods; 2012; 22p. Available online: https://www.forestresearch.gov.uk/documents/305/DIAROD_052012_Isolation_and_indentification_97fNCCI.pdf (accessed on 30 July 2021).
  51. Keriö, S.; Terhonen, E.; LeBoldus, J.M. Safe DNA-extraction Protocol Suitable for Studying Tree-fungus Interactions. Bio-Protocol 2020, 10, e3634. [Google Scholar] [CrossRef]
  52. Gardes, M.; Bruns, T.D. ITS primers with enhanced specificity for basidiomycetes—Application to the identification of mycorrhizae and rusts. Mol. Ecol. 1993, 2, 113–118. [Google Scholar] [CrossRef]
  53. White, T.J.; Bruns, T.D.; Lee, S.; Taylor, J. PCR Protocols: A Guide to Methods and Applications: Part Three—Genetics and Evolution; Chapter 38, Amplification and Direct Sequencing of Fungal Ribosomal RNA Genes for Phylogenetics; Academic Press: London, UK, 1990; pp. 315–322. [Google Scholar]
  54. Drenkhan, R.; Adamson, K.; Jürimaa, K.; Hanso, M. Dothistroma septosporumon firs (Abiesspp.) in the northern Baltics. For. Pathol. 2014, 44, 250–254. [Google Scholar] [CrossRef]
  55. Hall, T.A. BioEdit: A User-Friendly Biological Sequence Alignment Editor and Analysis Program for Windows 95/98/NT; Nucleic Acids Symposium Series; Information Retrieval Ltd.: London, UK, 1999; Volume 41, pp. 95–98. [Google Scholar]
  56. Peakall, R.; Smouse, P.E. genalex 6: Genetic analysis in Excel. Population genetic software for teaching and research. Mol. Ecol. Notes 2006, 6, 288–295. [Google Scholar] [CrossRef]
  57. Zhan, J.; Pettway, R.; McDonald, B. The global genetic structure of the wheat pathogen Mycosphaerella graminicola is characterized by high nuclear diversity, low mitochondrial diversity, regular recombination, and gene flow. Fungal Genet. Biol. 2003, 38, 286–297. [Google Scholar] [CrossRef]
  58. Szpiech, Z.A.; Jakobsson, M.; Rosenberg, N. ADZE: A rarefaction approach for counting alleles private to combinations of populations. Bioinformatics 2008, 24, 2498–2504. [Google Scholar] [CrossRef] [Green Version]
  59. Kivelä, M.; Arnaud-Haond, S.; Saramäki, J. Eden etworks: A user-friendly software to build and analyse networks in biogeography, ecology and population genetics. Mol. Ecol. Res. 2015, 15, 117–122. [Google Scholar] [CrossRef]
  60. Nei, M. Genetic Distance between Populations. Am. Nat. 1972, 106, 283–292. [Google Scholar] [CrossRef]
  61. Nei, M. Estimation of average heterozygosity and genetic distance from a small number of individuals. Genetics 1978, 89, 583–590. [Google Scholar] [CrossRef] [PubMed]
  62. Falush, D.; Stephens, M.; Pritchard, J.K. Inference of Population Structure Using Multilocus Genotype Data: Linked Loci and Correlated Allele Frequencies. Genetics 2003, 164, 1567–1587. [Google Scholar] [CrossRef]
  63. Pritchard, J.K.; Stephens, M.; Donnelly, P. Inference of Population Structure Using Multilocus Genotype Data. Genetics 2000, 155, 945–959. [Google Scholar] [CrossRef] [PubMed]
  64. Pritchard, J.K.; Wen, W.; Falush, D. Documentation for STRUCTURE Software: Version 2.3; University of Chicago, Department of Human Genetics: Chicago, IL, USA, 2010. [Google Scholar]
  65. Kopelman, N.M.; Mayzel, J.; Jakobsson, M.; Rosenberg, N.; Mayrose, I. Clumpak: A program for identifying clustering modes and packaging population structure inferences across K. Mol. Ecol. Resour. 2015, 15, 1179–1191. [Google Scholar] [CrossRef] [Green Version]
  66. Tedersoo, L.; Bahram, M.; Põlme, S.; Kõljalg, U.; Yorou, N.S.; Wijesundera, R.; Ruiz, L.V.; Vasco-Palacios, A.M.; Thu, P.Q.; Suija, A.; et al. Global diversity and geography of soil fungi. Science 2014, 346, 1256688. [Google Scholar] [CrossRef] [PubMed] [Green Version]
  67. Adamson, K.; Mullett, M.; Solheim, H.; Barnes, I.; Müller, M.M.; Hantula, J.; Vuorinen, M.; Kacergius, A.; Markovskaja, S.; Musolin, D.L.; et al. Looking for relationships between the populations of Dothistroma septosporum in northern Europe and Asia. Fungal Genet. Biol. 2018, 110, 15–25. [Google Scholar] [CrossRef] [PubMed]
  68. Drenkhan, R.; Hantula, J.; Vuorinen, M.; Jankovský, L.; Müller, M.M. Genetic diversity of Dothistroma septosporum in Estonia, Finland and Czech Republic. Eur. J. Plant Pathol. 2013, 136, 71–85. [Google Scholar] [CrossRef]
  69. Drenkhan, R.; Hanso, M. Recent invasion of foliage fungi of pines (Pinus spp.) to the Northern Baltics. For. Stud. 2009, 51, 49–64. [Google Scholar] [CrossRef]
  70. Sutton, B.C. The Coelomycetes. Fungi Imperfecti with Pycnidia, Acervuli and Stromata; Commonwealth Mycological Institute. 1980. Available online: https://www.cabdirect.org/?target=%2fcabdirect%2fabstract%2f19801366283 (accessed on 16 June 2021).
  71. McDonald, B.; McDermott, J.M. Population Genetics of Plant Pathogenic Fungi. Bioscience 1993, 43, 311–319. [Google Scholar] [CrossRef]
  72. Lundquist, J.E. A History of Five Forest Diseases in South Africa. South Afr. For. J. 1987, 140, 51–59. [Google Scholar] [CrossRef]
  73. Terhonen, E.-L.; Babalola, J.; Kasanen, R.; Jalkanen, R.; Blumenstein, K. Sphaeropsis sapinea found as symptomless endophyte in Finland. Silva Fenn. 2021, 55. [Google Scholar] [CrossRef]
Figure 1. Map of sampling sites of Diplodia sapinea. Green shading indicates the distribution of the genus Pinus in Europe [49]. Red symbols indicate sampling sites (where several sites/countries were sampled); blue symbols indicate subpopulations and weighted geographical midpoints of sampling sites. Subpopulations are coded according to countries as follows: Belarus—BEL, Estonia—EST, Finland—FIN, Georgia—GEO, Germany—GER, Italy—ITA, Latvia—LAT, North Macedonia—MAC, Norway—NOR, Poland—POL, European part of Russia—RUS, Serbia—SER, Slovakia—SLO, Switzerland—SWI and Ukraine—UKR.
Jof 07 00634 g001
Figure 2. Minimum spanning network of D. sapinea subpopulations in Europe and western Asia based on the non-cc dataset (A) and cc-dataset (B). Darker node colour represents higher haplotype number in subpopulations and node size represents betweenness of subpopulation in the network. Darker edges represent a higher degree of connectivity. Subpopulations are coded as follows: Belarus—BEL, Estonia—EST, Finland—FIN, Georgia—GEO, Germany—GER, Italy—ITA, Latvia—LAT, North Macedonia—MAC, Norway—NOR, Poland—POL, European part of Russia—RUS, Serbia—SER, Slovakia—SLO, Switzerland—SWI and Ukraine—UKR.
Jof 07 00634 g002
Figure 3. Principal coordinate analysis of Nei’s genetic distance of nine subpopulations of D. sapinea. The variation explained by each coordinate is given as a percentage within parentheses. Subpopulation codes: Estonia—EST, Finland—FIN, Georgia—GEO, Germany—GER, Italy—ITA, Latvia—LAT, Serbia—SER, Slovakia—SLO and Ukraine—UKR.
Jof 07 00634 g003
Figure 4. Genetic differentiation of D. sapinea subpopulations in Europe and Georgia according to geographical distance. Nei’s genetic distances of isolates representing 15 subpopulations are presented as a function of geographic distance.
Jof 07 00634 g004
Figure 5. The optimum number of clusters determined using the ln(Pr(X|K)) method [63,64] in CLUMPAK [65].
Jof 07 00634 g005
Figure 6. Venn diagram showing D. sapinea haplotype distribution from a single P. nigra tree in Järvselja nursery, Estonia from two sampling dates.
Jof 07 00634 g006
Table 1. Thirteen D. sapinea microsatellite markers with fluorescent labels and annealing temperatures. Fluorescent labels were attached to the forward primers. Deviations from the reference labels and annealing temperatures are underlined and highlighted in bold.
Primer PairLocusFluorescent LabelAnnealing Temp (°C)Reference
TB1 and TB2-2SS1ATTO55058[46]
TB5 and TB6SS2ATTO53258[46]
TB19 and TB20-2SS5FAM62[46]
TB23 and TB24SS7ATTO53262[46]
TB35-2 and TB36SS8ATTO56562[46]
TB37 and TB38SS9ATTO55062[46]
TB41 and TB42SS10FAM62[46]
TB43 and TB44SS11ATTO56558[46]
WB1-a and WB1-bSS12ATTO56566[35]
WB2-a and WB2-bSS13FAM57[35]
WB4-a and WB4-bSS14ATTO55060[35]
WB7-a and WB7-bSS15ATTO55055[35]
WB8-a and WB8-bSS16ATTO53255[35]
Table 2. Haplotype frequencies of D. sapinea in Europe. Occurrence of 52 multilocus haplotypes (MLHs) (based on 13 microsatellite markers) among isolates of D. sapinea isolated in 14 European countries and Georgia.
MLH
No.
BELESTFINGEOGERITALATMACNORPOLRUSSERSLOSWIUKRHaplotype
Frequency
Percent
of Total
1-(1)-------------(1)0.0
2-1------------120.6
3-----1---------10.3
4-(1)--1----------1 (1)0.3
5-(1)-------------(1)0.0
6----1----------10.3
7----1----------10.3
8-1 (7)--24----------25 (7)7.3
9-1--1----------20.6
10-(1)--1----------1 (1)0.3
11----1----------10.3
12---1-----------10.3
13-(1)-------------(1)0.3
14-------1-------10.3
15-(3)2---1----2---5 (3)1.5
16-(1)------------22 (1)0.6
17---2-----------20.6
18---7-----------72.0
19---10-------63 (2)--19 (2)5.6
20---16-----------164.7
21--------------110.3
22--1---3--1----382.3
23------1--------10.3
24-----------1---10.3
25---4-----------41.2
26------------1 (1)--1 (1)0.3
27-1-------------10.3
28------------1 (2)--1 (2)0.3
2935 (14)3341-74527-1436 (16)16155 (30)45.3
30--1------------10.3
31----1----------10.3
32-----------52--72.0
33212121---1--8 (12)-725 (12)7.3
34-----1-2-------30.9
35-----7---------72.0
36----2----------20.6
37---1-----------10.3
38----1----------10.3
39------------(1)--(1)0.0
40-1--11------1 (2)1-5 (2)1.5
41-----1---------10.3
42-(1)-------------(1)0.0
43--------------110.3
44-----1---------10.3
45-1 (5)-------------1 (5)0.3
46---1-----------10.3
47----------1----10.3
48-2 (5)-------------2 (5)0.6
49--------------110.3
504(4)2-2-1--3112 (2)-117 (6)5.0
511--------------10.3
52------1--------10.3
N1014 (45)1146801314753222954 (38)223342 (83)100
Haplotypes of first arrivals of D. sapinea into Estonia are highlighted in bold and underlined. If several isolates were obtained from single tree or small group of trees then only one randomly chosen haplotype was used and several isolates from same tree were used in small spatial scale analyses and were indicated in brackets. Percentage calculation included haplotypes, which were used in the main study. Subpopulation codes: Belarus—BEL, Estonia—EST, Finland—FIN, Georgia—GEO, Germany—GER, Italy—ITA, Latvia—LAT, North Macedonia—MAC, Norway—NOR, Poland—POL, European part of Russia—RUS, Serbia—SER, Slovakia—SLO, Switzerland—SWI and Ukraine—UKR.
Table 3. Number of haplotypes found in the investigated subpopulations of D. sapinea and the clonal fraction among isolates of each subpopulation.
Subpopulation
Code
N of
Sampling Sites
N of Sampled
Trees
N of Sampled
Insects
N of
Isolates
N of
Haplotypes cc
N of Private
Haplotypes cc
Clonal
Fraction
BEL210-10410.60
EST 1114-14920.69
FIN311-11610.45
GEO246-461030.78
GER580-801370.84
ITA113-13730.46
LAT814-14620.57
MAC17-7310.57
NOR1-55100.80
POL232-32400.88
RUS12-2210.00
SER129-29610.79
SLO1054-54820.85
SWI12-2200.00
UKR323-23920.61
Subpopulation codes: Belarus—BEL, Estonia—EST, Finland—FIN, Georgia—GEO, Germany—GER, Italy—ITA, Latvia—LAT, North Macedonia—MAC, Norway—NOR, Poland—POL, European part of Russia—RUS, Serbia—SER, Slovakia—SLO, Switzerland—SWI and Ukraine—UKR.
Table 4. Significance of differences in allelic patterns between the investigated subpopulations. AMOVA results are given as p-values, with statistically significant p-values given in bold and underlined.
Subpopulation
Code
BELEST FINGEOGER ITALATMACPOLRUSSERSLOSWI
EST 0.093
FIN0.4110.435
GEO0.1500.0040.127
GER 0.1380.4220.2530.001
ITA0.1400.4700.3270.0130.041
LAT0.2410.4540.4610.0620.2490.337
MAC0.1440.4290.3180.1220.1670.4390.504
POL0.2340.4130.3800.1400.3390.3840.4810.457
RUS0.3320.0550.2870.0460.0470.0780.1770.0960.333
SER0.3880.1670.4230.3900.0540.3930.4450.5310.4830.322
SLO0.4300.4390.3750.1630.3990.4890.4380.3490.3680.1170.411
SWI0.2680.3990.3550.2570.3990.3320.4290.5980.5390.3340.2840.438
UKR0.3780.1450.3970.1520.0420.0970.3940.4090.4070.3810.3920.4280.430
Subpopulation codes: Belarus—BEL, Estonia—EST, Finland—FIN, Georgia—GEO, Germany—GER, Italy—ITA, Latvia—LAT, North Macedonia—MAC, Norway—NOR, Poland—POL, European part of Russia—RUS, Serbia—SER, Slovakia—SLO, Switzerland—SWI and Ukraine—UKR.
Table 5. Nei’s genetic and geographical distances for subpopulations with a clone corrected sample size ≥6. Below the diagonal are Nei’s genetic distances and above are geographical distances (km). Genetic differences higher than the arithmetic average value (0.028) are given in bold and underlined.
Subpopulation
Code
EST FINGEOGER ITALATSERSLOUKR
EST -18323071217190819015241209987
FIN0.015-244613182057368169713741169
GEO0.0560.049-280326592222203921771801
GER 0.0050.0130.045-91410799856721004
ITA0.0240.0400.0800.029-17276437421164
LAT0.0180.0130.0580.0190.040-13341021803
SER0.0290.0210.0310.0250.0420.034-368601
SLO0.0080.0140.0360.0050.0270.0220.011-451
UKR0.0270.0110.0330.0190.0540.0260.0170.018-
Subpopulation codes: Estonia—EST, Finland—FIN, Georgia—GEO, Germany—GER, Italy—ITA, Latvia—LAT, Serbia—SER, Slovakia—SLO and Ukraine—UKR.
Table 6. Diversity statistics of D. sapinea for the 15 analysed subpopulations using the clone corrected dataset. For each diversity index the three highest values are given in bold and underlined.
Subpopulation
Code
N of
Isolates
N of
Haplotypes cc
Total No
of Alleles
Private
Alleles
Allelic
Richness
Ar (SE) 1
cc
Private
Allelic Richness
Par (SE) 1
cc
Mean Number of
Different Alleles
Na (SE) 1
cc
Mean Unbiased
Diversity
uh (SE) 1
cc
Mean Haploid
Genetic
Diversity
h (SE) 1
cc
Disease
Severity 2
BEL104171NCNCNCNCNC2
EST 1491711.224 (0.124)0.043 (0.043)1.231 (0.163)0.072 (0.051)0.060 (0.042)1
FIN1161911.333 (0.154)0.064 (0.064)1.385 (0.180)0.138 (0.063)0.115 (0.052)1
GEO46102231.478 (0.257)0.152 (0.103)1.462 (0.243)0.149 (0.079)0.124 (0.066)2
GER80132221.363 (0.159)0.077 (0.048)1.385 (0.180)0.138 (0.063)0.115 (0.052)2
ITA1372241.560 (0.192)0.321 (0.147)1.462 (0.183)0.179 (0.069)0.150 (0.057)2
LAT1462001.410 (0.159)0.047 (0.029)1.462 (0.183)0.169 (0.065)0.140 (0.054)1
MAC73160NCNCNCNCNC2
NOR51140NCNCNCNCNC1
POL324170NCNCNCNCNC2
RUS22130NCNCNCNCNC2
SER2961901.372 (0.171)0.022 (0.022)1.385 (0.180)0.174 (0.078)0.143 (0.064)2
SLO5481901.472 (0.187)0.032 (0.032)1.538 (0.215)0.185 (0.071)0.154 (0.059)2
SWI22150NCNCNCNCNC2
UKR2392011.378 (0.203)0.043 (0.043)1.308 (0.175)0.118 (0.065)0.098 (0.054)1
NC—not calculated. SE—standard error. 1 Subpopulation sizes are standardised to 6. 2 Please see Materials and Methods Section 2.1 and Supplementary Text S1. Subpopulation codes: Belarus—BEL, Estonia—EST, Finland—FIN, Georgia—GEO, Germany—GER, Italy—ITA, Latvia—LAT, North Macedonia—MAC, Norway—NOR, Poland—POL, European part of Russia—RUS, Serbia—SER, Slovakia—SLO, Switzerland—SWI and Ukraine—UKR.
Table 7. Mating type distribution and index of association. Significant p-values are highlighted in bold and underlined.
Subpopulation
Code
MAT1-1-1
Non-cc
MAT1-2-1
Non-cc
p-Value of
Exact Binomial
Test Non-cc
Index of
Association
IA Non-cc
p-Value of
IA Non-cc
MAT1-1-1
cc
MAT1-2-1
cc
p-Value of Exact
Binomial Test cc
Index of
Association
IA cc
p-Value of
IA cc
BEL550.6231.3690.052220.6881.5830.339
EST 750.3871.3840.923440.6371.4431.000
FIN650.5001.6400.462330.6561.6280.824
GEO9360.0001.7070.001460.3771.8550.169
GER45320.0862.0810.7381040.0901.5760.975
ITA2110.0112.7950.002250.2282.3770.346
LAT580.2911.3970.260240.3441.6260.721
MAC070.0074.1680.011030.1256.2100.045
NOR500.031NCNC100.500NCNC
POL20120.1081.6040.005310.3131.5460.254
RUS200.250NCNC200.250NANA
SER14150.5001.7740.001420.3442.3420.156
SLO19350.0201.2590.050360.2541.1670.890
SWI110.750NCNC110.750NCNC
UKR1390.2621.7150.185720.0902.1440.738
NC—not calculated. Subpopulation codes: Belarus—BEL, Estonia—EST, Finland—FIN, Georgia—GEO, Germany—GER, Italy—ITA, Latvia—LAT, North Macedonia—MAC, Norway—NOR, Poland—POL, European part of Russia—RUS, Serbia—SER, Slovakia—SLO, Switzerland—SWI and Ukraine—UKR.
Table 8. Diversity of D. sapinea in single trees and small groups of nearby trees.
CountryLocationSampling
Date
Host
Species
SubstrateNo. of
Trees
No. of IsolatesClonal
Fraction
MLH Nos.
EstoniaJärvselja nursery17.05.2012;
28.06.2013;
16.02.2018
Pinus nigraCone, shoot 1160.384; 5; 8; 10; 16; 29; 29; 29;
29; 33; 42; 48; 50; 50; 50; 50
EstoniaMuhu25.10.2012P. nigraCone1 stand140.718; 15; 29; 29; 29; 29; 29;
29; 45; 45; 45; 45; 45; 45
EstoniaVormsi06.09.2012P. sylvestrisCone, needle6100.602; 8; 8; 29; 48; 48; 48; 48; 48; 48
SlovakiaArboretum Mlyňany20.08.2019P. sylvestrisCone120.5032; 32
SlovakiaBorová Hora03.09.2019P. sylvestrisCone120.5029; 29
SlovakiaBorová Hora03.09.2019P. nigraCone130.6729; 29; 29
SlovakiaGalanta15.08.2019P. nigraCone120.5029; 29
SlovakiaGalanta15.08.2019P. nigraCone120.5033; 33
SlovakiaGalanta15.08.2019P. nigraCone130.6733; 33; 33
SlovakiaGalanta15.08.2019P. sylvestrisCone130.6750; 50; 50
SlovakiaGalanta15.08.2019P. sylvestrisCone130.6729; 29; 29
SlovakiaGalanta15.08.2019P. sylvestrisCone130.6733; 33; 33
SlovakiaGalanta15.08.2019P. sylvestrisCone140.5039; 40; 40; 40
SlovakiaHlohovec13.08.2019P. nigraCone130.6728; 28; 28
SlovakiaKežmarok04.10.2019P. sylvestrisCone130.6729; 29; 29
SlovakiaKežmarok04.10.2019P. nigraCone130.6729; 29; 29
SlovakiaKežmarok03.11.2019P. sylvestrisCone120.5029; 29
SlovakiaKežmarok03.11.2019P. sylvestrisCone130.6729; 29; 29
SlovakiaNová Lehota01.10.2019P. nigraCone130.6733; 33; 33
SlovakiaPalárikovo13.08.2019P. nigraCone120.5026; 26
SlovakiaPalárikovo13.08.2019P. nigraCone130.6719; 19; 19
SlovakiaPalárikovo13.08.2019P. sylvestrisCone130.6733; 33; 33
SlovakiaStupava21.03.2019P. nigraCone120.5029; 29
SlovakiaStupava21.03.2019P. nigraCone130.6729; 29; 29
SlovakiaTematín01.10.2019P. nigraCone120.5033; 33
SlovakiaVlčany13.08.2019P. nigraCone130.6729; 29; 29
Table 9. Number of observed alleles in different microsatellite loci in Northern Hemisphere populations.
Publication RegionN. America [42] *N. America [47] *EuropeEurope [48]Europe [43]Present Study Europe
N of isolates1651278586425
Locus
SS1511111
SS22211-1
SS3211---
SS4211---
SS5742-15
SS6111---
SS75211-3
SS88111-2
SS9541-34
SS10221122
SS11772111
SS12-41-29
SS13---312
SS14---435
SS15---222
SS16---111
* Isolates of North American origin.
Publisher’s Note: MDPI stays neutral with regard to jurisdictional claims in published maps and institutional affiliations.

