
Agronomic Factors Influencing the Scale of Fusarium Mycotoxin Contamination of Oats

 ,
,  and
and
Abstract
:1. Introduction
2. Materials and Methods
2.1. Chemicals and Materials
2.2. Preparation of Standard Solutions
2.3. Sampling
2.4. Sample Preparation
2.5. UHPLC-MS/MS Parameters
2.6. Method Validation
2.7. Statistical Analyses
3. Results
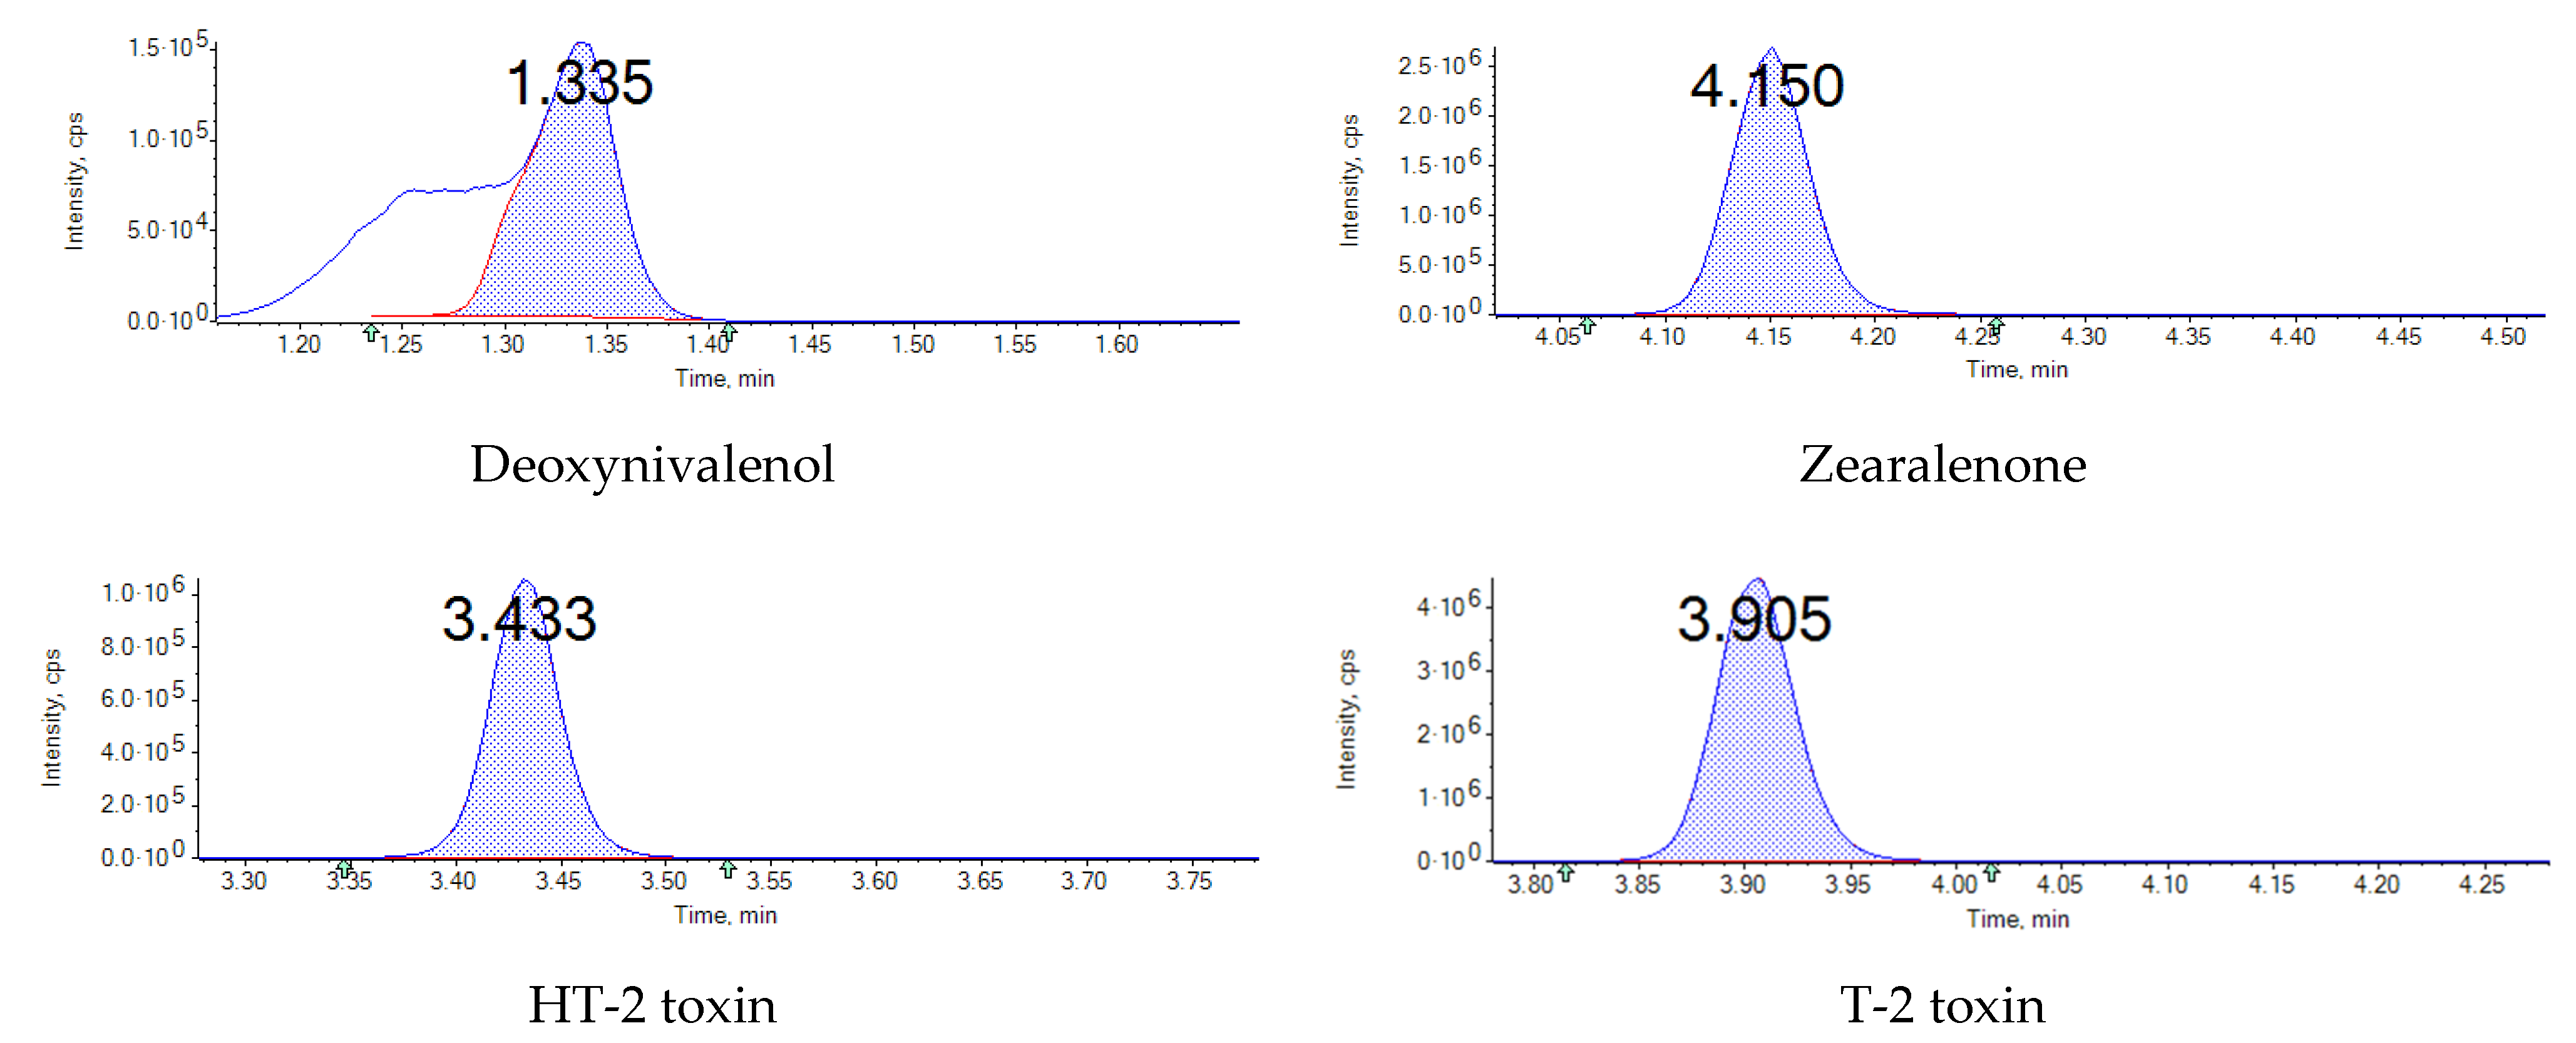
3.1. Method Performance
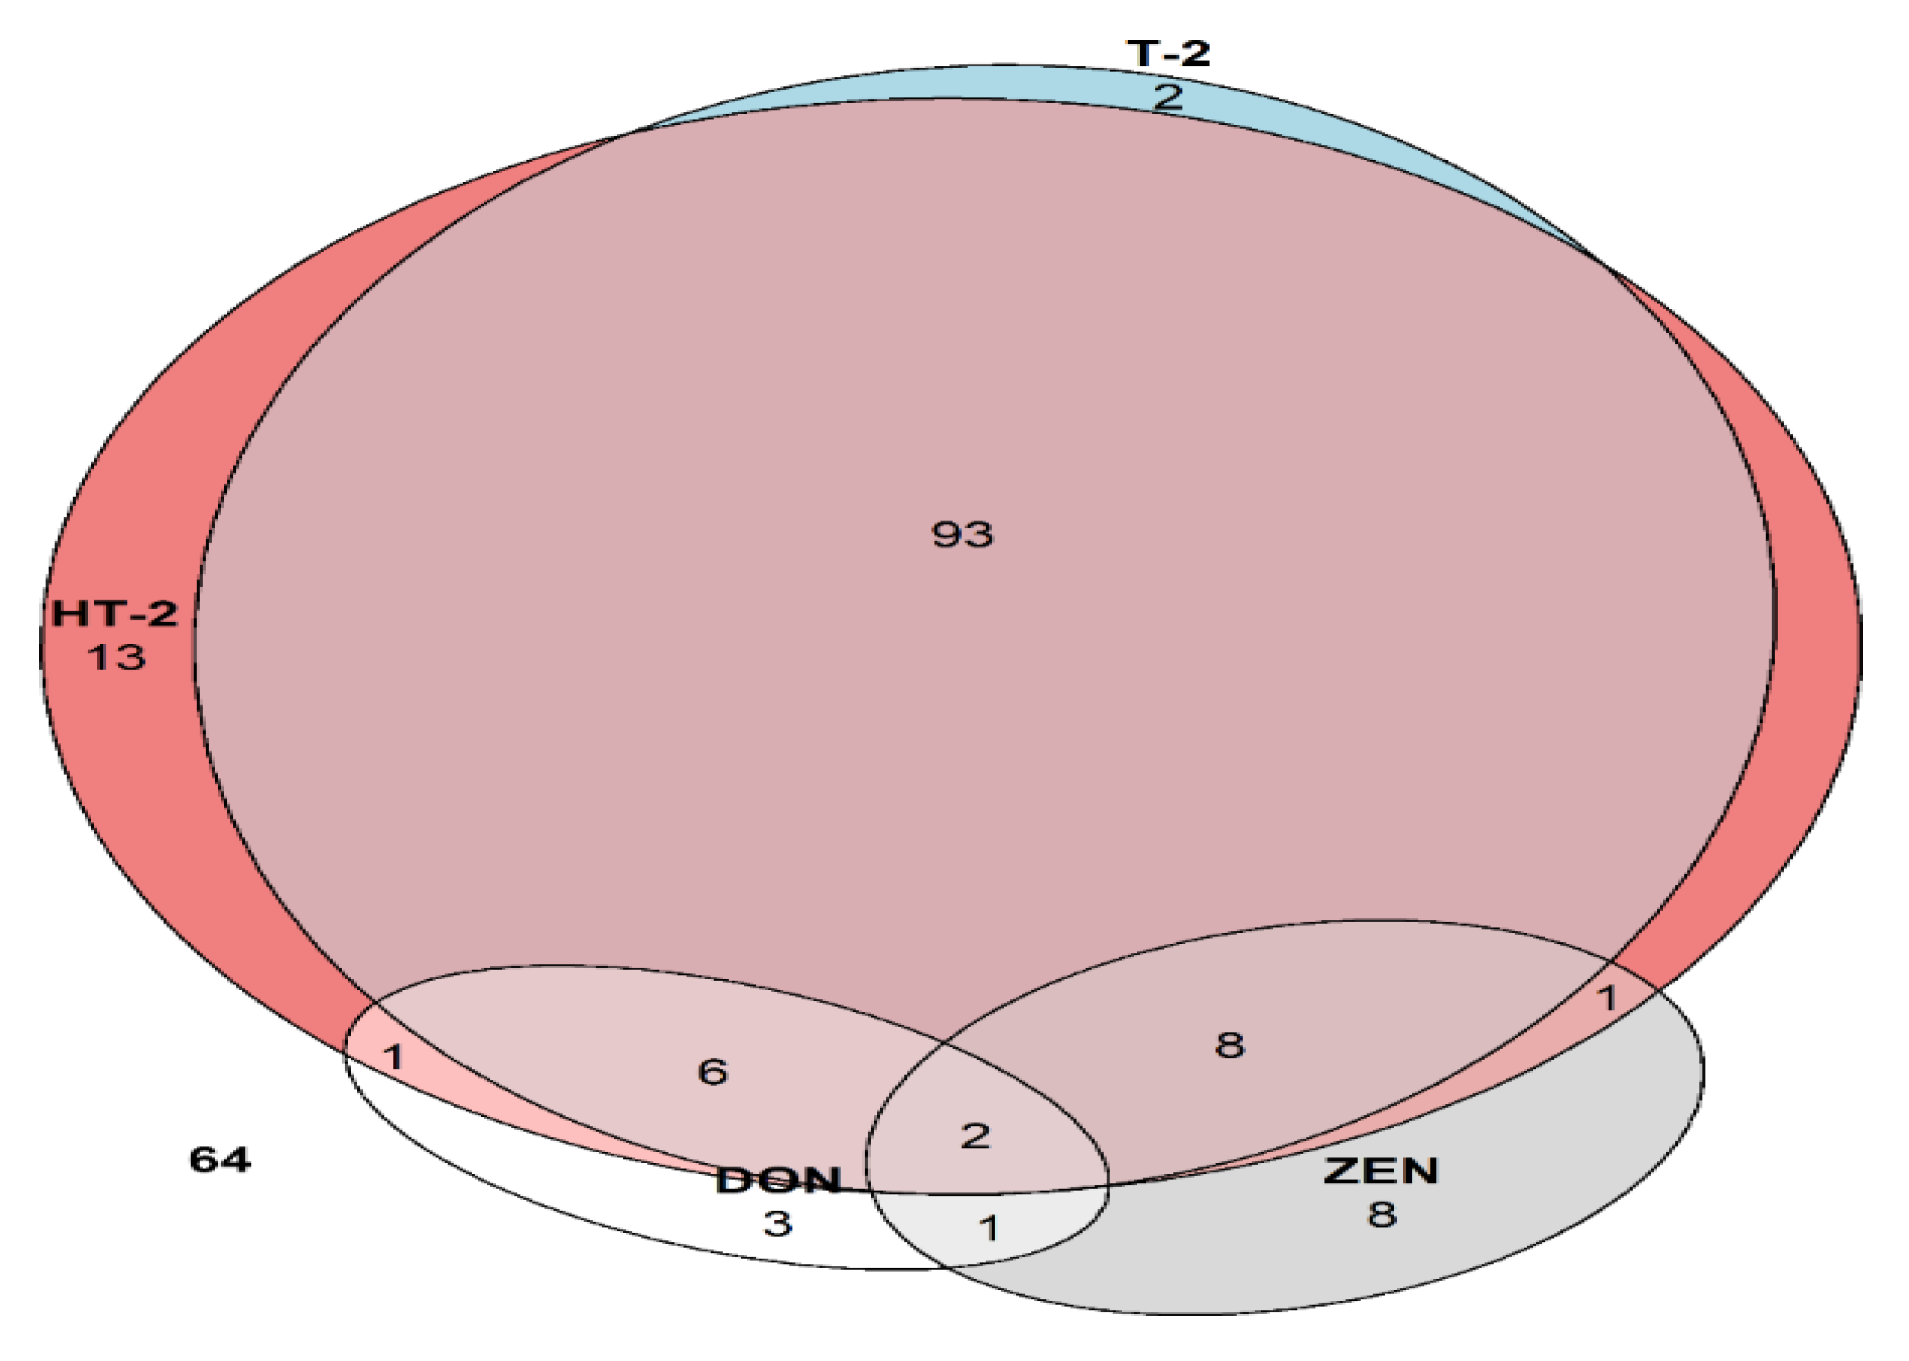
3.2. Application of the Proposed Method to Real Samples
3.2.1. Crop Season
3.2.2. Harvest Date
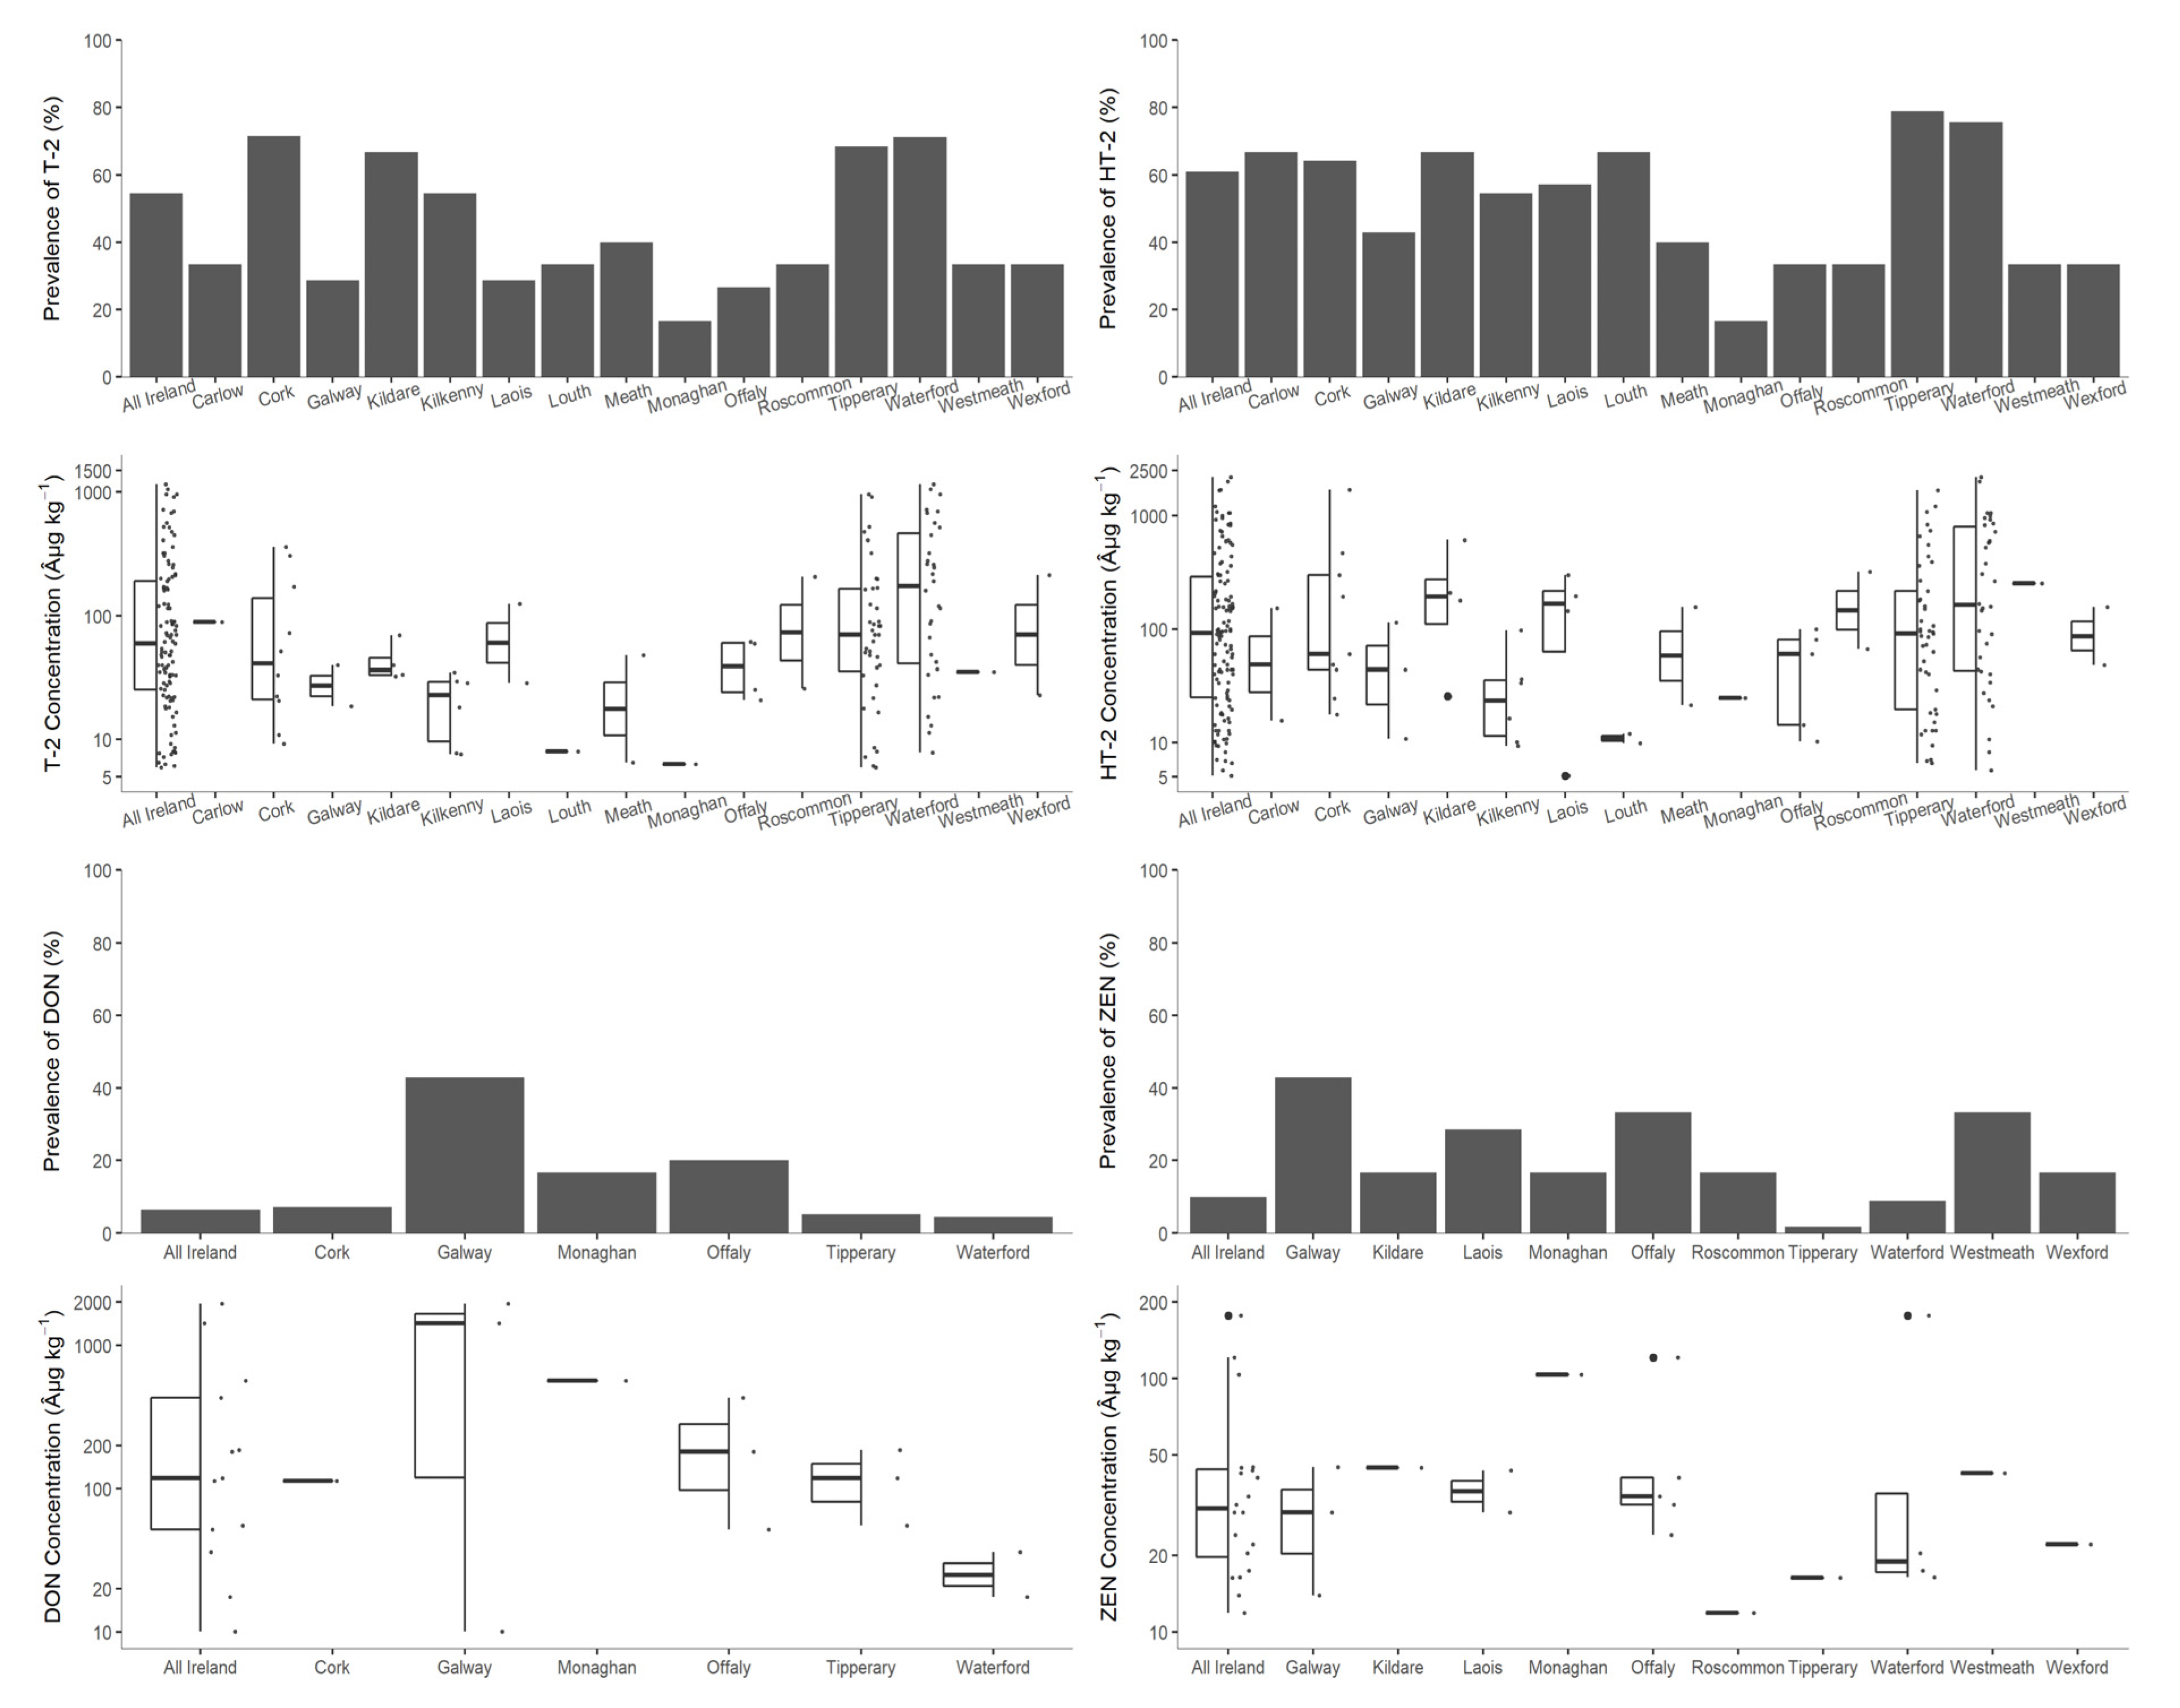
3.2.3. County
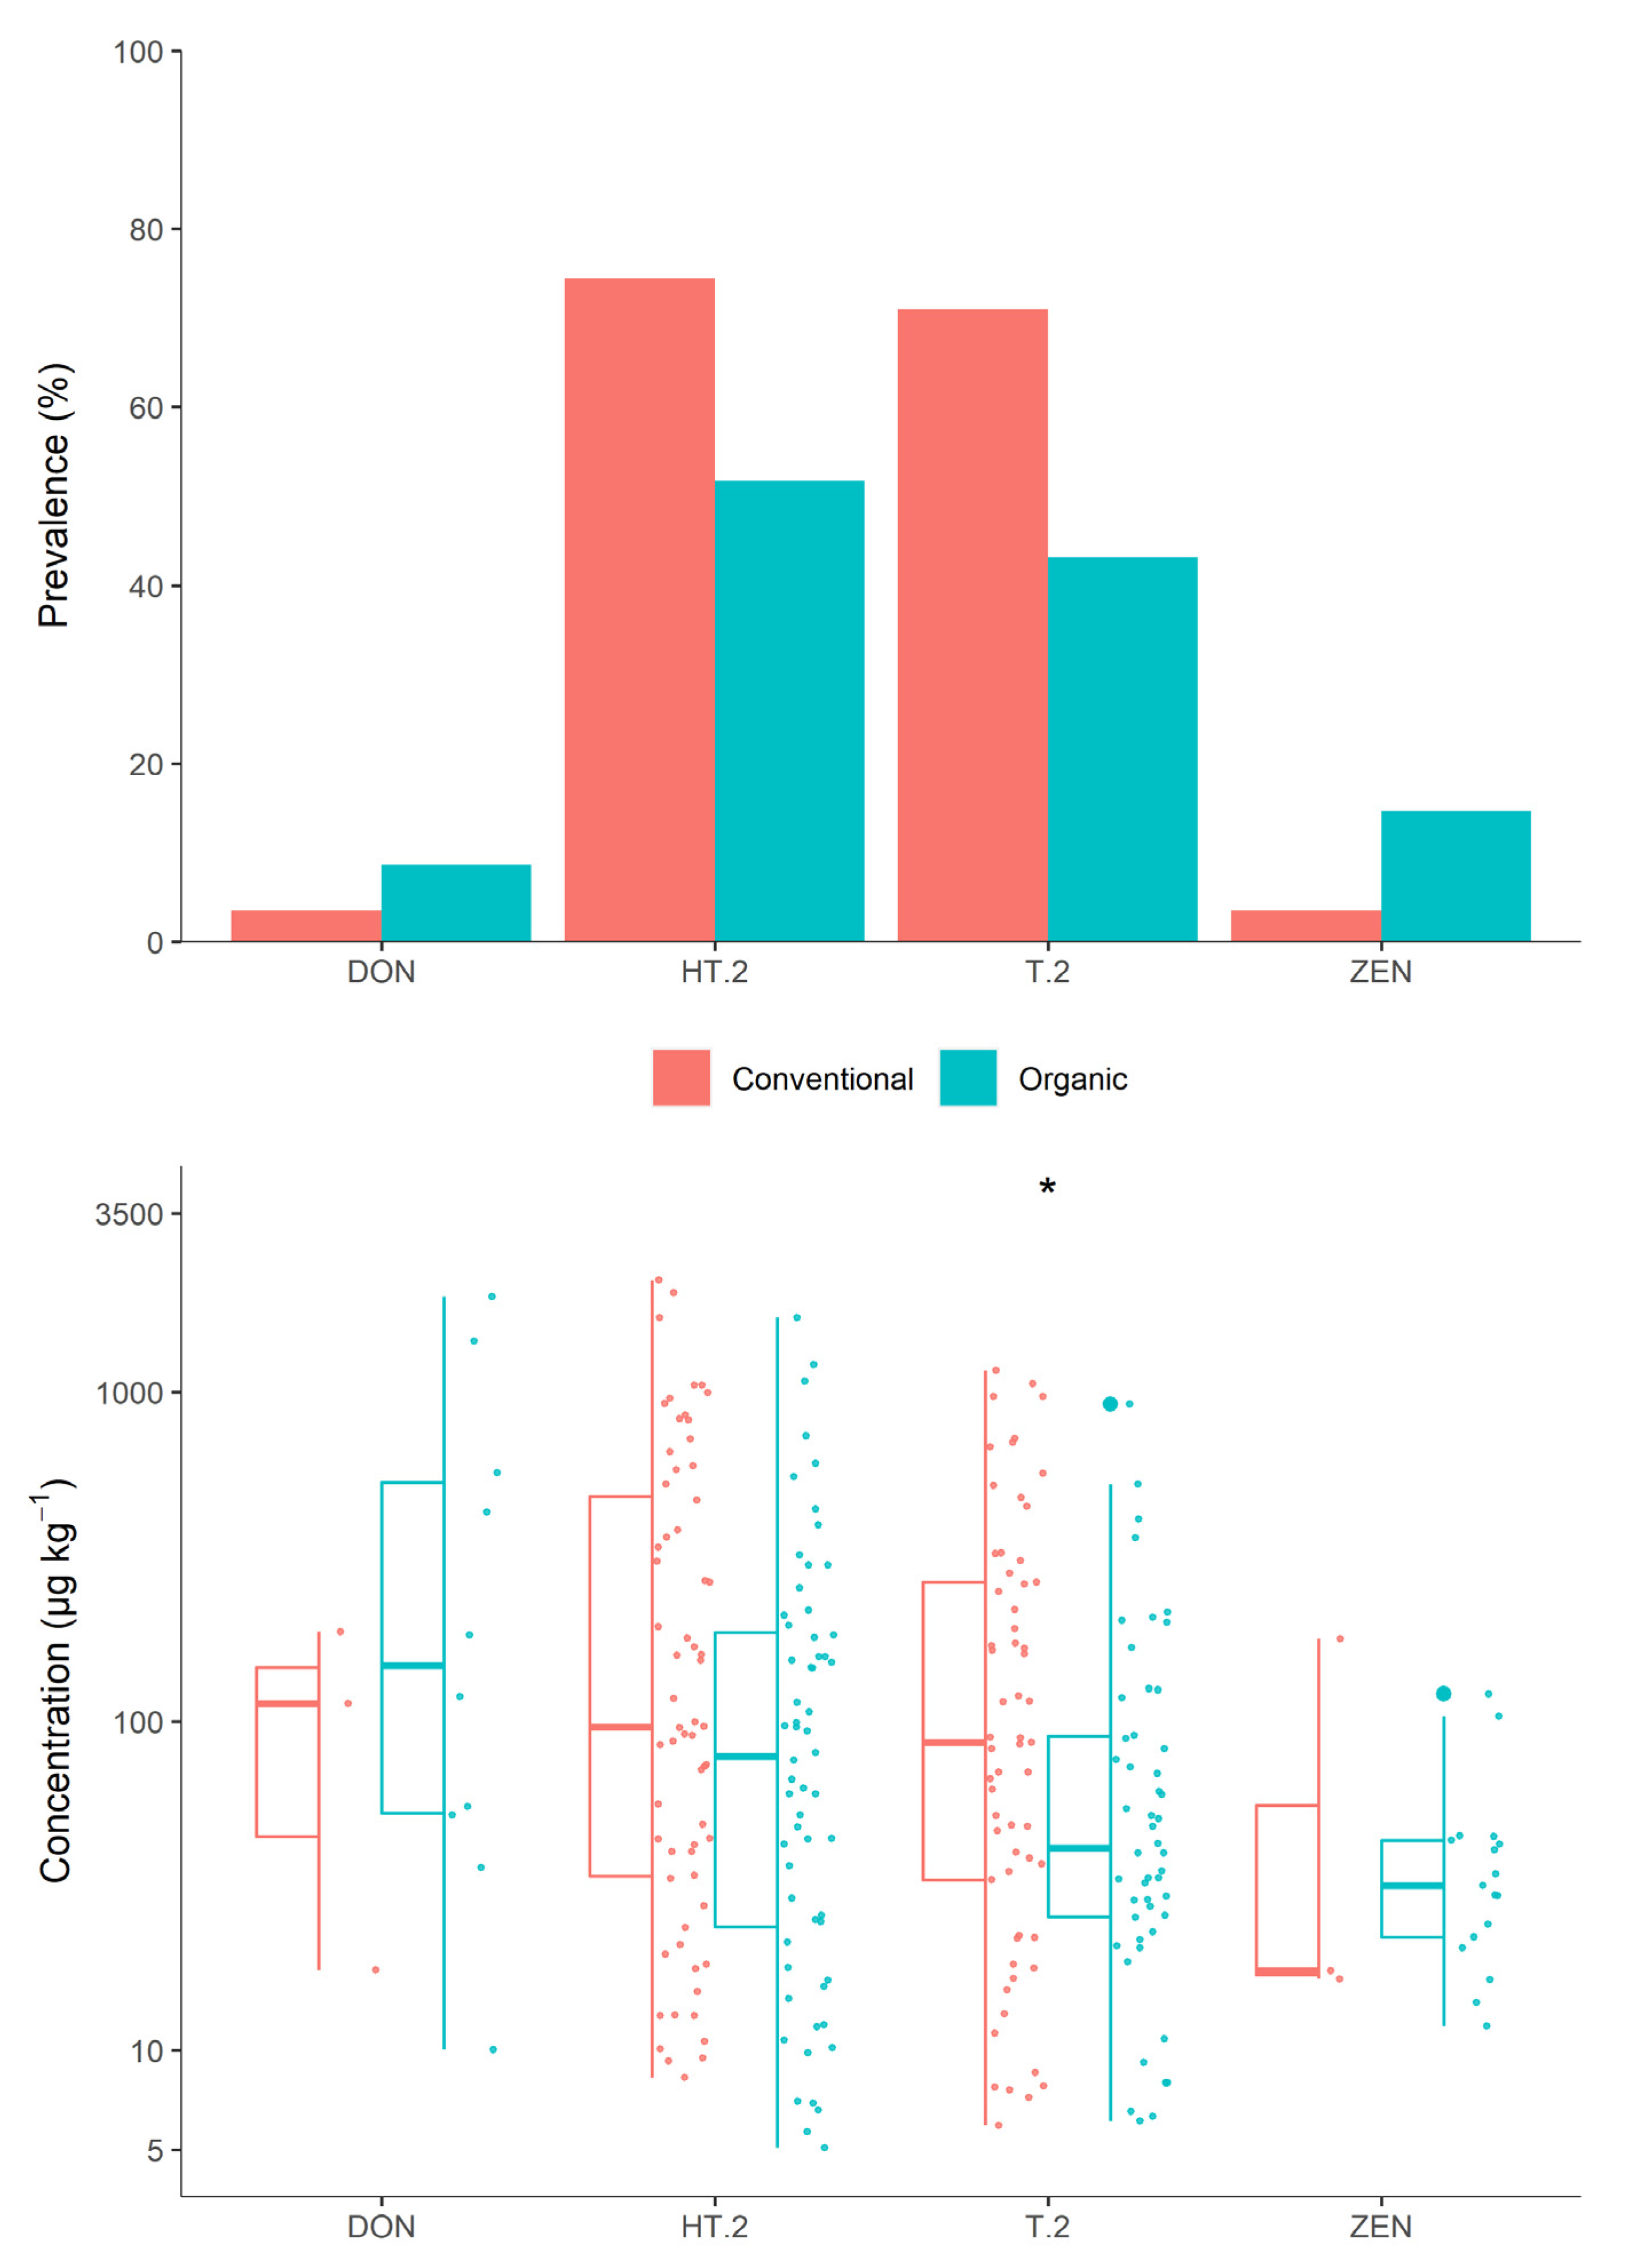
3.2.4. Farming System
3.2.5. Previous Crop
3.2.6. Moisture
3.2.7. Oat Variety
3.3. Multivariate Analysis
3.3.1. T-2 Toxin
3.3.2. HT-2 Toxin
3.3.3. Type A Trichothecenes
3.3.4. Deoxynivalenol
3.3.5. Zearalenone
4. Discussion
4.1. Crop Season
4.2. Previous Crop
4.3. Farming System
5. Conclusions
Author Contributions
Funding
Conflicts of Interest
References
- Rasane, P.; Jha, A.; Sabikhi, L.; Kumar, A.; Unnikrishnan, V. Nutritional advantages of oats and opportunities for its processing as value added foods—A review. J. Food Sci. Technol. 2013, 52, 662–675. [Google Scholar] [CrossRef] [PubMed] [Green Version]
- Clemens, R.; Klinken, B. Oats, more than just a whole grain: An introduction. Br. J. Nutr. 2014, 112, S1–S3. [Google Scholar] [CrossRef] [Green Version]
- Lange, E. Oats products as functional food. Zywnosc Nauka Technol. Jakosc Food Sci. Technol. Qual. 2010, 70, 7–24. [Google Scholar] [CrossRef]
- Martinelli, J.; Soares, C.M.; Sganzerla, G.F.; Carlos, F.L.; Felipe, D.L. Impact of Fusarium Head Blight in Reducing the Weight of Oat Grains. J. Agric. Sci. 2014, 6, 188. [Google Scholar] [CrossRef]
- Hautsalo, J.; Jauhiainen, L.; Hannukkala, A.; Manninen, O.; Veteläinen, M.; Pietilä, L. Resistance to Fusarium head blight in oats based on analyses of multiple field and greenhouse studies. Eur. J. Plant Pathol. 2020, 158, 15–33. [Google Scholar] [CrossRef]
- Kolawole, O.; Meneely, J.; Petchkongkaew, A.; Elliott, C. A review of mycotoxin biosynthetic pathways: Associated genes and their expressions under the influence of climatic factors. Fungal Biol. Rev. 2021, 37, 8–26. [Google Scholar] [CrossRef]
- Ostry, V.; Malir, F.; Toman, J.; Grosse, Y. Mycotoxins as human carcinogens—The IARC Monographs classification. Mycotoxin Res. 2016, 33, 65–73. [Google Scholar] [CrossRef] [PubMed]
- Kolawole, O.; Graham, A.; Donaldson, C.; Owens, B.; Abia, W.; Meneely, J.; Alcorn, M.J.; Connolly, L.; Elliott, C.T. Low Doses of Mycotoxin Mixtures below EU Regulatory Limits Can Negatively Affect the Performance of Broiler Chickens: A Longitudinal Study. Toxins 2020, 12, 433. [Google Scholar] [CrossRef]
- Sobrova, P.; Adam, V.; Vasatkova, A.; Beklova, M.; Zeman, L.; Kizek, R. Deoxynivalenol and its toxicity. Interdiscip. Toxicol. 2010, 3, 94–99. [Google Scholar] [CrossRef]
- Knutsen, H.-K.; Barregård, L.; Bignami, M.; Brüschweiler, B.; Ceccatelli, S.; Cottrill, B.; Dinovi, M.; Edler, L.; Grasl-Kraupp, B.; Hogstrand, C.; et al. Appropriateness to set a group health-based guidance value for T2 and HT2 toxin and its modified forms. Eur. Food Saf. Auth. J. 2017, 15, e04655. [Google Scholar]
- European Food Safety Authority. Commission Regulation (EC) No. 1881/2006 setting maximum levels of certain contaminants in foodstuffs. Off. J. Eur. Union 2006, L364, 5–24. [Google Scholar]
- European Food Safety Authority. Scientific Opinion on the risks for human and animal health related to the presence of modified forms of certain mycotoxins in food and feed. ESFA J. 2014, 12, 3916. [Google Scholar]
- European Food Safety Authority. Appropriateness to set a group health-based guidance value for zearalenone and its modified forms. Eur. Food Saf. Auth. J. 2016, 14, e04425. [Google Scholar]
- Central Statistics Office. Available online: https://www.cso.ie/en/releasesandpublications/er/aypc/areayieldandproductionofcrops2019/ (accessed on 20 July 2021).
- De Colli, L.; De Ruyck, K.; Abdallah, M.; Finnan, J.; Mullins, E.; Kildea, S.; Spink, J.; Elliott, C.; Danaher, M. Natural Co-Occurrence of Multiple Mycotoxins in Unprocessed Oats Grown in Ireland with Various Production Systems. Toxins 2021, 13, 188. [Google Scholar] [CrossRef] [PubMed]
- FSAI. Survey of Mycotoxins in Irish Grain Samples 2012. Available online: https://www.fsai.ie/publications_survey_mycotoxins_grain.aspx (accessed on 20 July 2021).
- FSAI. Survey of Mycotoxins in Irish Grain Samples 2006–2008. Available online: https://www.fsai.ie/surveyofmycotoxinsinirishgrainsamples2006-2008.html (accessed on 20 July 2021).
- Hietaniemi, V.; Kumpulainen, J. Contents of Fusarium toxins in Finnish and imported grains and feeds. Food Addit. Contam. 1991, 8, 171–181. [Google Scholar] [CrossRef]
- Kuzdraliński, A.; Solarska, E.; Mazurkiewicz, J. Mycotoxin content of organic and conventional oats from southeastern Poland. Food Control 2013, 33, 68–72. [Google Scholar] [CrossRef]
- Pettersson, H.; Brown, C.; Hauk, J.; Hoth, S.; Meyer, J.; Wessels, D. Survey of T-2 and HT-2 toxins by LC–MS/MS in oats and oat products from European oat mills in 2005–2009. Food Addit. Contam. Part B 2011, 4, 110–115. [Google Scholar] [CrossRef]
- Van der Fels-Klerx, H.; Stratakou, I. T-2 toxin and HT-2 toxin in grain and grain-based commodities in Europe: Occurrence, factors affecting occurrence, co-occurrence and toxicological effects. World Mycotoxin J. 2010, 3, 349–367. [Google Scholar] [CrossRef]
- Martos, P.; Thompson, W.; Diaz, G. Multiresidue mycotoxin analysis in wheat, barley, oats, rye and maize grain by high-performance liquid chromatography-tandem mass spectrometry. World Mycotoxin J. 2010, 3, 205–223. [Google Scholar] [CrossRef]
- Lindblad, M.; Gidlund, A.; Sulyok, M.; Börjesson, T.; Krska, R.; Olsen, M.; Fredlund, E. Deoxynivalenol and other selected Fusarium toxins in Swedish wheat—Occurrence and correlation to specific Fusarium species. Int. J. Food Microbiol. 2013, 167, 284–291. [Google Scholar] [CrossRef]
- Scudamore, K.; Patel, S.; Edwards, S. HT-2 toxin and T-2 toxin in commercial cereal processing in the United Kingdom, 2004–2007. World Mycotoxin J. 2009, 2, 357–365. [Google Scholar] [CrossRef]
- Food Standard Agency. Code of Good Agricultural Practice for the Reduction of Mycotoxins in UK Cereals. Available online: https://www.food.gov.uk/sites/default/files/media/document/mycotoxincop2007.pdf (accessed on 20 July 2021).
- Food and Agriculture Organisation. Available online: http://www.fao.org/fao-who-codexalimentarius/shproxy/en/?lnk=1&url=https%253A%252F%252Fworkspace.fao.org%252Fsites%252Fcodex%252FStandards%252FCXC%2B51-2003%252FCXC_051e.pdf (accessed on 20 July 2021).
- European Food Safety Authority. Available online: https://www.efsa.europa.eu/en/topics/topic/mycotoxins (accessed on 20 July 2021).
- European Food Safety Authority. Commission Decision 2002/657/EC of 12 August 2002 implementing Council Directive 96/23/EC concerning the performance of analytical methods and the interpretation of results. Off. J. Eur. Commun. 2002, 50, 8–36. [Google Scholar]
- R Core Team. R: A Language and Environment for Statistical Computing; R Foundation for Statistical Computing: Vienna, Austria, 2006; Available online: https://www.r-project.org/ (accessed on 11 April 2021).
- Kassambara, A. ggpubr: ‘ggplot2’ Based Publication Ready Plots. R Package Version 0.4.0. 2020. Available online: https://CRAN.R-project.org/package=ggpubr (accessed on 11 April 2021).
- Faraway, J. Functions and Datasets for Books by Julian Faraway. Available online: https://cran.r-project.org/package=faraway (accessed on 11 April 2021).
- Venables, W.N.; Ripley, B.D. Modern Applied Statistics with S, 4th ed.; Springer: Berlin/Heidelberg, Germany, 2002; Available online: https://www.stats.ox.ac.uk/pub/MASS4/ (accessed on 11 April 2021).
- Ebbert. D. chisq.posthoc.test: A Post Hoc Analysis for Pearson’s Chi-Squared Test for Count Data. R Package Version 0.1.2. 2019. Available online: https://CRAN.Rproject.org/package=chisq.posthoc.test (accessed on 20 August 2021).
- Elliott, C.; Connolly, L.; Kolawole, O. Potential adverse effects on animal health and performance caused by the addition of mineral adsorbents to feeds to reduce mycotoxin exposure. Mycotoxin Res. 2019, 36, 115–126. [Google Scholar] [CrossRef] [PubMed] [Green Version]
- European Food Safety Authority. Scientific Opinion on the risks for animal and public health related to the presence of T-2 and HT-2 toxin in food and feed. Eur. Food Saf. Auth. J. 2011, 9, 2481. [Google Scholar]
- Edwards, S. Fusarium mycotoxin content of UK organic and conventional oats. Food Addit. Contam. Part A 2009, 26, 1063–1069. [Google Scholar] [CrossRef] [PubMed] [Green Version]
- Edwards, S. Impact of agronomic and climatic factors on the mycotoxin content of harvested oats in the United Kingdom. Food Addit. Contam. Part A 2017, 34, 2230–2241. [Google Scholar] [CrossRef]
- Hjelkrem, A.; Aamot, H.; Brodal, G.; Strand, E.; Torp, T.; Edwards, S.G.; Dill-Macky, R.; Hofgaard, I.S. HT-2 and T-2 toxins in Norwegian oat grains related to weather conditions at different growth stages. Eur. J. Plant Pathol. 2018, 151, 501–514. [Google Scholar] [CrossRef] [Green Version]
- Hofgaard, I.; Aamot, H.; Torp, T.; Jestoi, M.; Lattanzio, V.; Klemsdal, S.S.; Waalwijk, C.; Van der Lee, T.; Brodal, G. Associations between Fusarium species and mycotoxins in oats and spring wheat from farmers’ fields in Norway over a six-year period. World Mycotoxin J. 2016, 9, 365–378. [Google Scholar] [CrossRef]
- Hietaniemi, V.; Rämö, S.; Yli-Mattila, T.; Jestoi, M.; Peltonen, S.; Kartio, M.; Sieviläinen, E.; Koivisto, T.; Parikka, P. Updated survey of Fusarium species and toxins in Finnish cereal grains. Food Addit. Contam. Part A 2016, 33, 831–848. [Google Scholar] [CrossRef]
- Fredlund, E.; Gidlund, A.; Sulyok, M.; Börjesson, T.; Krska, R.; Olsen, M.; Lindblad, M. Deoxynivalenol and other selected Fusarium toxins in Swedish oats—Occurrence and correlation to specific Fusarium species. Int. J. Food Microbiol. 2013, 167, 276–283. [Google Scholar] [CrossRef]
- Schöneberg, T.; Jenny, E.; Wettstein, F.; Bucheli, T.; Mascher, F.; Bertossa, M.; Musa, T.; Seifert, K.; Gräfenhan, T.; Keller, B.; et al. Occurrence of Fusarium species and mycotoxins in Swiss oats—Impact of cropping factors. Eur. J. Agron. 2018, 92, 123–132. [Google Scholar] [CrossRef]
- Martin, C.; Schöneberg, T.; Vogelgsang, S.; Mendes, F.C.; Morisoli, R.; Bertossa, M.; Bucheli, T.D.; Mauch-Mani, B.; Macher, F. Responses of Oat Grains to Fusarium poae and F. langsethiae Infections and Mycotoxin Contaminations. Toxins 2018, 10, 47. [Google Scholar] [CrossRef] [Green Version]
- Imathiu, S.; Ray, R.; Back, M.; Hare, M.; Edwards, S. Agronomic practices influence the infection of an oats cultivar with Fusarium langsethiae. Acta Phytopathol. Entomol. Hung. 2017, 52, 15–27. [Google Scholar] [CrossRef]
- Edwards, S.; Imathiu, S.; Ray, R.; Back, M.; Hare, M. Molecular studies to identify the Fusarium species responsible for HT-2 and T-2 mycotoxins in UK oats. Int. J. Food Microbiol. 2012, 156, 168–175. [Google Scholar] [CrossRef]
- Morcia, C.; Tumino, G.; Ghizzoni, R.; Badeck, F.; Lattanzio, V.; Pascale, M.; Terzi, V. Occurrence of Fusarium langsethiae and T-2 and HT-2 Toxins in Italian Malting Barley. Toxins 2016, 8, 247. [Google Scholar] [CrossRef]
- Opoku, N.; Back, M.; Edwards, S. Susceptibility of cereal species to Fusarium langsethiae under identical field conditions. Eur. J. Plant Pathol. 2017, 150, 869–879. [Google Scholar] [CrossRef]
- Torp, M.; Adler, A. The European Sporotrichiella project: A polyphasic approach to the biology of a new Fusarium species. Int. J. Food Microbiol. 2004, 95, 241–245. [Google Scholar] [CrossRef]
- Bernhoft, A.; Torp, M.; Clasen, P.; Løes, A.; Kristoffersen, A. Influence of agronomic and climatic factors on Fusarium infestation and mycotoxin contamination of cereals in Norway. Food Addit. Contam. Part A 2012, 29, 1129–1140. [Google Scholar] [CrossRef] [Green Version]
- Bernhoft, A.; Clasen, P.; Kristoffersen, A.; Torp, M. Less Fusarium infestation and mycotoxin contamination in organic than in conventional cereals. Food Addit. Contam. Part A 2010, 27, 842–852. [Google Scholar] [CrossRef]
- Nathanail, A.; Syvähuoko, J.; Malachová, A.; Jestoi, M.; Varga, E.; Michlmayr, H.; Adam, G.; Sieviläinen, E.; Berthiller, F.; Peltonen, K. Simultaneous determination of major type A and B trichothecenes, zearalenone and certain modified metabolites in Finnish cereal grains with a novel liquid chromatography-tandem mass spectrometric method. Anal. Bioanal. Chem. 2015, 407, 4745–4755. [Google Scholar] [CrossRef] [PubMed] [Green Version]
- Orlando, B.; Grignon, G.; Vitry, C.; Kashefifard, K.; Valade, R. Fusarium species and enniatin mycotoxins in wheat, durum wheat, triticale and barley harvested in France. Mycotoxin Res. 2019, 35, 369–380. [Google Scholar] [CrossRef] [PubMed]
- Kaukoranta, T.; Hietaniemi, V.; Rämö, S.; Koivisto, T.; Parikka, P. Contrasting responses of T-2, HT-2 and DON mycotoxins and Fusarium species in oat to climate, weather, tillage and cereal intensity. Eur. J. Plant Pathol. 2019, 155, 93–110. [Google Scholar] [CrossRef] [Green Version]
- Gottschalk, C.; Barthel, J.; Engelhardt, G.; Bauer, J.; Meyer, K. Occurrence of type A trichothecenes in conventionally and organically produced oats and oat products. Mol. Nutr. Food Res. 2007, 51, 1547–1553. [Google Scholar] [CrossRef]
- Food and Agriculture Organisation. Food Safety and Quality as Affected by Organic Farming. In Proceedings of the Twenty-Second FAO Regional Conference for Europe, Porto, Portugal, 24–28 July 2000. [Google Scholar]
- Champeil, A.; Fourbet, J.; Doré, T.; Rossignol, L. Influence of cropping system on Fusarium head blight and mycotoxin levels in winter wheat. Crop Prot. 2004, 23, 531–537. [Google Scholar] [CrossRef]
- Cirillo, T.; Ritieni, A.; Visone, M.; Cocchieri, R. Evaluation of Conventional and Organic Italian Foodstuffs for Deoxynivalenol and Fumonisins B1 and B2. J. Agric. Food Chem. 2003, 51, 8128–8131. [Google Scholar] [CrossRef]
- Jestoi, M.; Somma, M.; Kouva, M.; Veijalainen, P.; Rizzo, A.; Ritieni, A. Levels of mycotoxins and sample cytotoxicity of selected organic and conventional grain-based products purchased from Finnish and Italian markets. Mol. Nutr. Food Res. 2004, 48, 299–307. [Google Scholar] [CrossRef] [PubMed]


| Mycotoxin | Food | Maximum Level (µg∙kg−1) |
|---|---|---|
| Deoxynivalenol | Unprocessed oats. | 1750 |
| Oat flour, meal, bran, or germ. | 750 | |
| Bread, pastries, biscuits, cereal snacks, and breakfast cereals. | 500 | |
| Zearalenone | Unprocessed oats. | 100 |
| Oat flour, meal, bran, or germ. | 75 | |
| Bread, pastries, biscuits, cereal snacks, and breakfast cereals. | 50 | |
| T-2 and HT-2 toxin | Unprocessed oats. | 1000 |
| Oat grains for direct human consumption. | 200 | |
| Oat bran and flakes. | 200 |
| Mycotoxin | Molecular Formula | Molar Mass | Measured Ion | Precursor Ion (m/z) | Product Ion (m/z) | Retention Time | DP (V) | CE (V) | CXP (V) |
|---|---|---|---|---|---|---|---|---|---|
| Deoxynivalenol | C15H20O6 | 296.31 | [M + H]+ | 297.1 | 249.1 203.2 | 1.34 | 91 91 | 21 21 | 20 20 |
| Zearalenone | C18H22O5 | 318.364 | [M + H]+ | 319.1 | 301.1 283.1 | 4.15 | 81 81 | 15 17 | 16 14 |
| T-2 toxin | C24H34O9 | 466.52 | [M + NH4]+ | 484.3 | 215.2 185.1 | 3.90 | 76 76 | 29 31 | 18 11 |
| HT-2 toxin | C22H32O8 | 424.5 | [M + NH4]+ | 442.2 | 263.1 215.1 | 3.43 | 71 71 | 19 19 | 14 22 |
| Analyte | Calibration Range (µg-kg−1) | Graph Equation | Linearity R2 | SSE (%) | LOD (µg∙kg−1) | LOQ (µg∙kg−1) |
|---|---|---|---|---|---|---|
| Deoxynivalenol | 10–2000 | y = 594.7x + 372.25 | 0.9994 | −10 | 0.9 | 10 |
| Zearalenone | 10–2000 | y = 15,828.4x + 3148.16 | 0.9992 | −7.8 | 2 | 10 |
| T-2 toxin | 5–2000 | y = 46,303x + 5172.73 | 0.9996 | 6.8 | 1.5 | 5 |
| HT-2 toxin | 5–2000 | y = 39,794x + 102.53 | 0.9998 | −9.3 | 1 | 5 |
| 10 µg∙kg−1 | 200 µg∙kg−1 | 1000 µg∙kg−1 | |||||||
|---|---|---|---|---|---|---|---|---|---|
| Recovery (%) | RSDr b (%) | RSDR c (%) | Recovery (%) | RSDr b (%) | RSDR c (%) | Recovery (%) | RSDr b (%) | RSDR c (%) | |
| Deoxynivalenol | 87 | 2.6 | 4.6 | 91 | 2.5 | 4.8 | 91 | 1.9 | 3.1 |
| Zearalenone | 92 | 3.1 | 3.9 | 90 | 2.9 | 3.1 | 96 | 2.2 | 6.2 |
| T-2 toxin | 91 | 2.5 | 5.2 | 92 | 2.1 | 4.6 | 95 | 1.7 | 4.3 |
| HT-2 toxin | 93 | 1.1 | 5.4 | 92 | 1.9 | 4.8 | 96 | 2.1 | 4.6 |
| N = 202 | Deoxynivalenol | Zearalenone | T-2 Toxin | HT-2 Toxin | T-2 + HT-2 |
|---|---|---|---|---|---|
| Prevalence (%) | 13 (6.4) | 20 (9.9) | 111 (55) | 124 (61) | 126 (62) |
| Exceeding Limit (%) | 1 (0.5) | 3 (1.5) | 2 (1.0) | 8 (4.0) | 15 (7.4) |
| Median (µg∙kg−1) | 119 | 31 | 61 | 93 | 138 |
| Range (µg∙kg−1) | 10–1947 | 12–177 | 6–1166 | 5–2190 | 5–3064 |
Publisher’s Note: MDPI stays neutral with regard to jurisdictional claims in published maps and institutional affiliations. |
© 2021 by the authors. Licensee MDPI, Basel, Switzerland. This article is an open access article distributed under the terms and conditions of the Creative Commons Attribution (CC BY) license (https://creativecommons.org/licenses/by/4.0/).
Share and Cite
Kolawole, O.; De Ruyck, K.; Greer, B.; Meneely, J.; Doohan, F.; Danaher, M.; Elliott, C. Agronomic Factors Influencing the Scale of Fusarium Mycotoxin Contamination of Oats. J. Fungi 2021, 7, 965. https://doi.org/10.3390/jof7110965
Kolawole O, De Ruyck K, Greer B, Meneely J, Doohan F, Danaher M, Elliott C. Agronomic Factors Influencing the Scale of Fusarium Mycotoxin Contamination of Oats. Journal of Fungi. 2021; 7(11):965. https://doi.org/10.3390/jof7110965
Chicago/Turabian StyleKolawole, Oluwatobi, Karl De Ruyck, Brett Greer, Julie Meneely, Fiona Doohan, Martin Danaher, and Christopher Elliott. 2021. "Agronomic Factors Influencing the Scale of Fusarium Mycotoxin Contamination of Oats" Journal of Fungi 7, no. 11: 965. https://doi.org/10.3390/jof7110965
APA StyleKolawole, O., De Ruyck, K., Greer, B., Meneely, J., Doohan, F., Danaher, M., & Elliott, C. (2021). Agronomic Factors Influencing the Scale of Fusarium Mycotoxin Contamination of Oats. Journal of Fungi, 7(11), 965. https://doi.org/10.3390/jof7110965