Botrytis cinerea Transcriptome during the Infection Process of the Bryophyte Physcomitrium patens and Angiosperms

 , , and
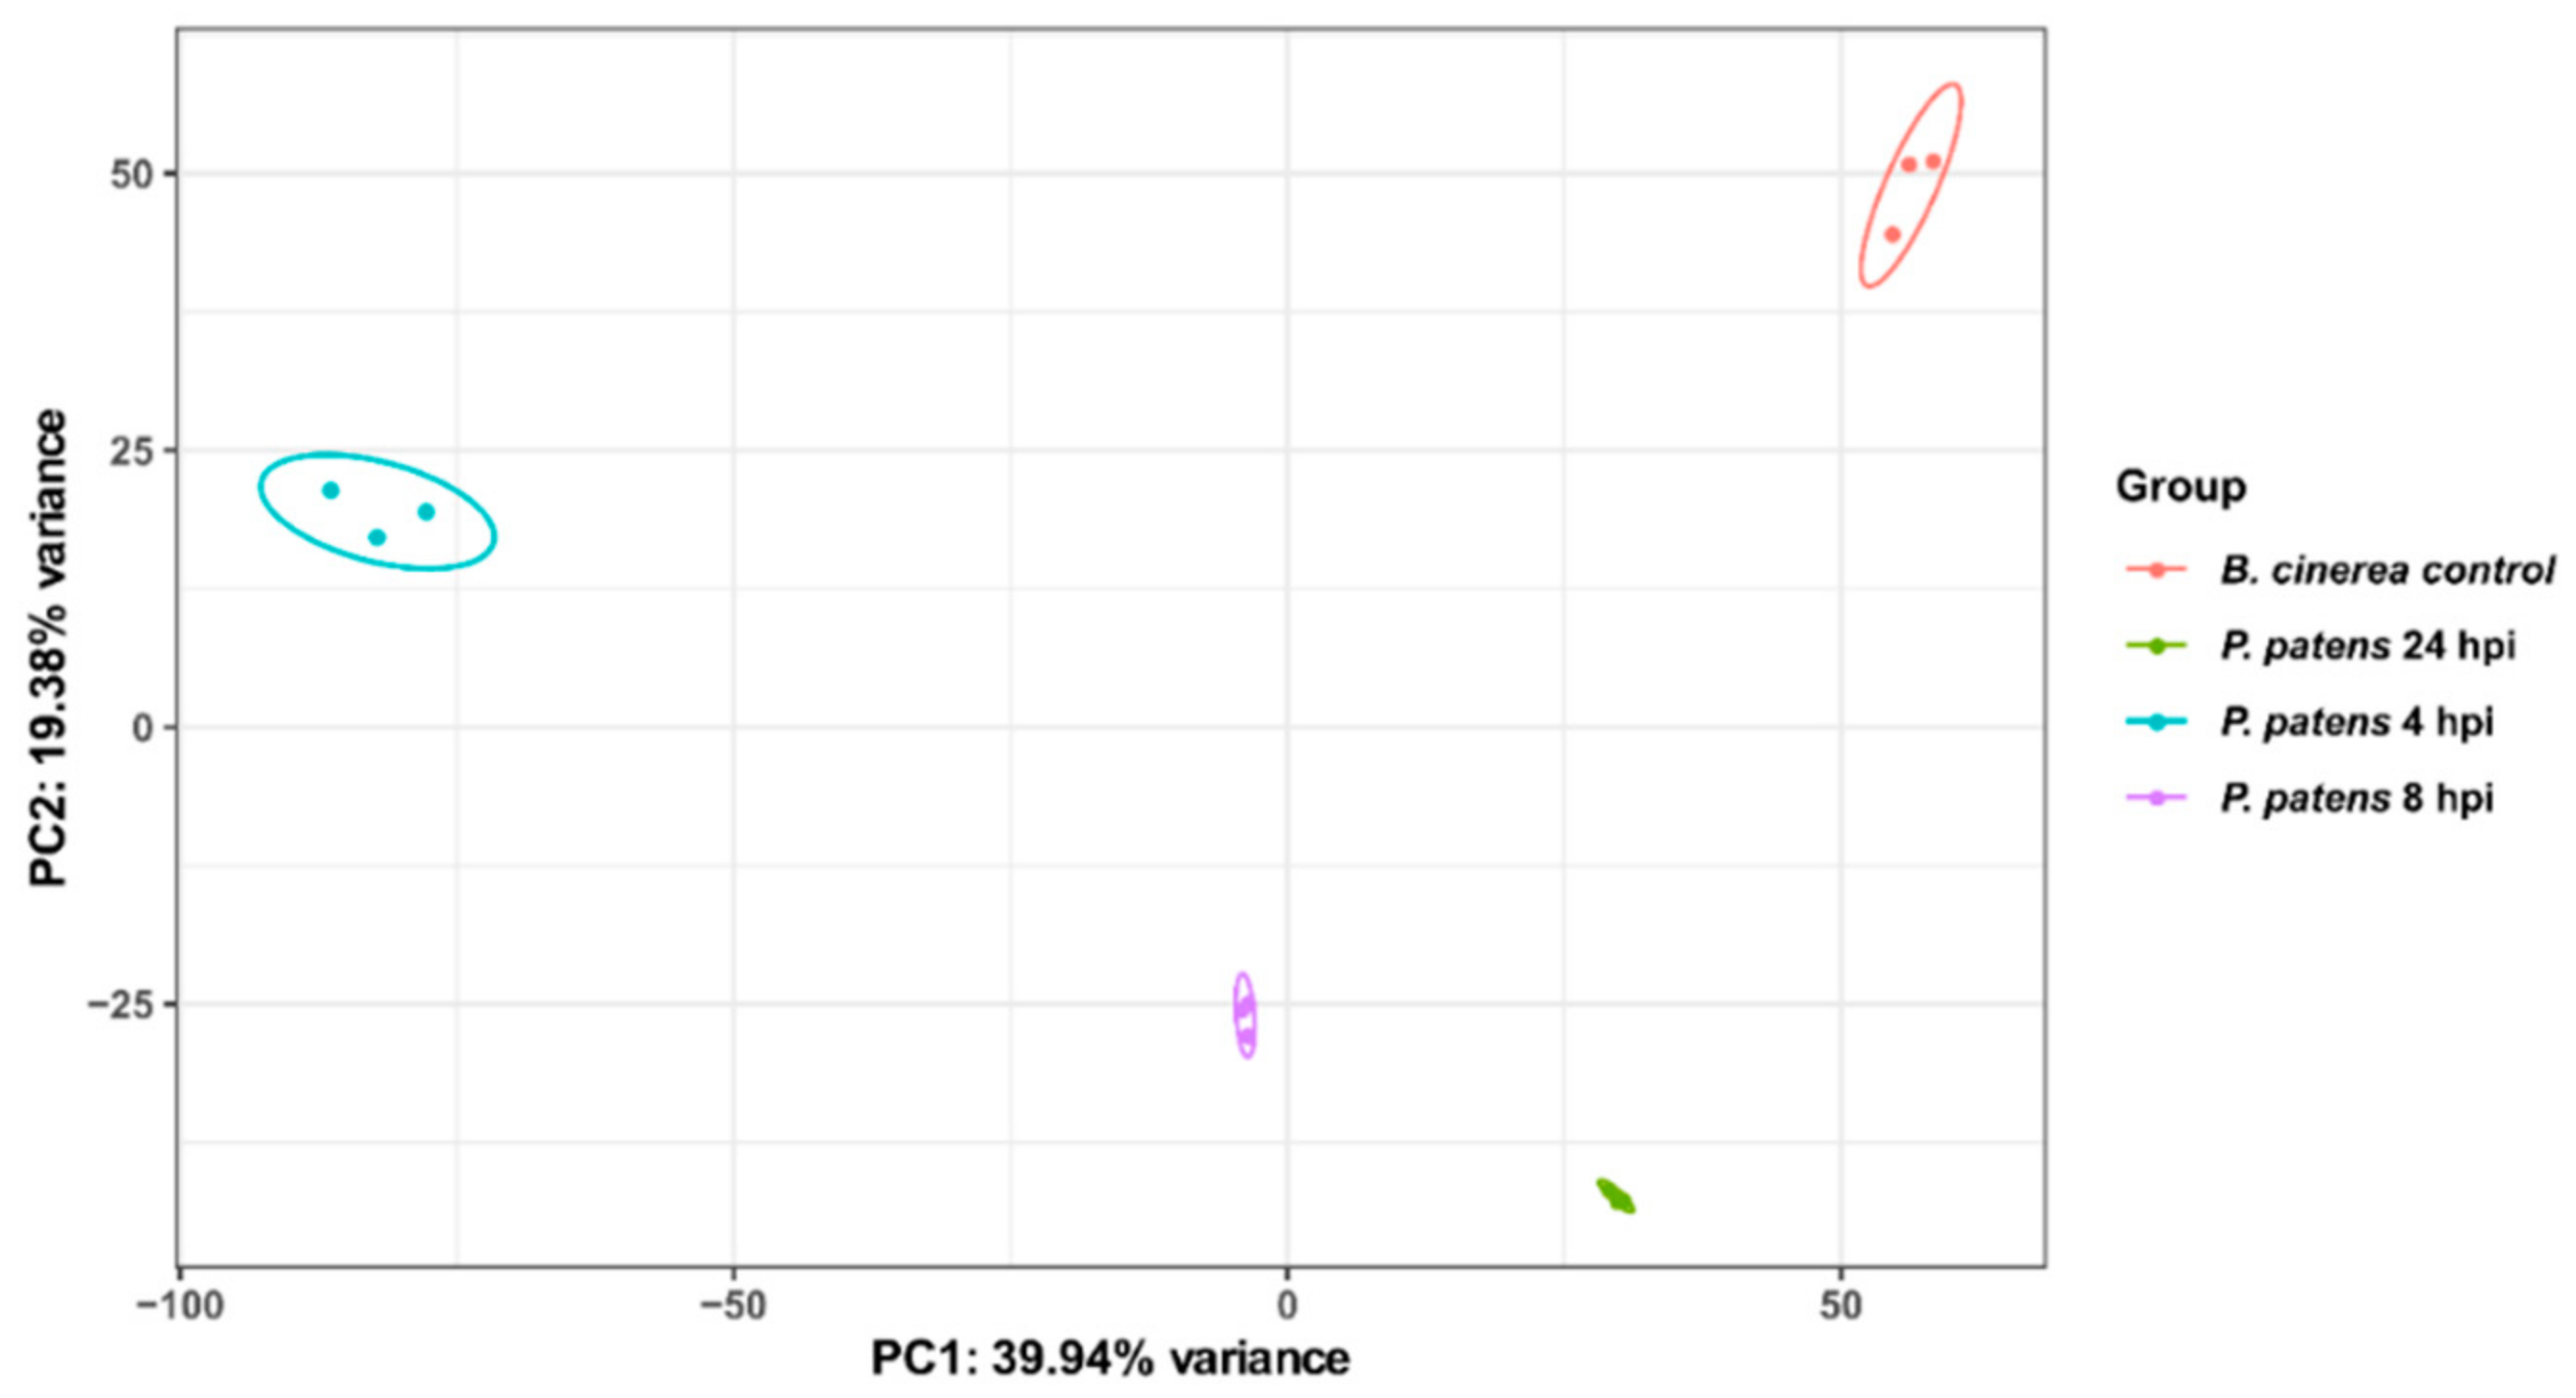
Abstract
1. Introduction
2. Materials and Methods
2.1. B. cinerea, P. patens Inoculation and Microscopy
2.2. RNA Extraction, RNA Sequencing, Data Processing and qPCR Analysis of P. patens-Infected Tissues
2.3. RNA-seq Data from B. cinerea Grown on A. thaliana, S. lycopersicum, and L. sativa and Comparison with B. cinerea Grown on P. patens
2.4. Functional Clasification and Comparison with B. cinerea Secretomes
3. Results
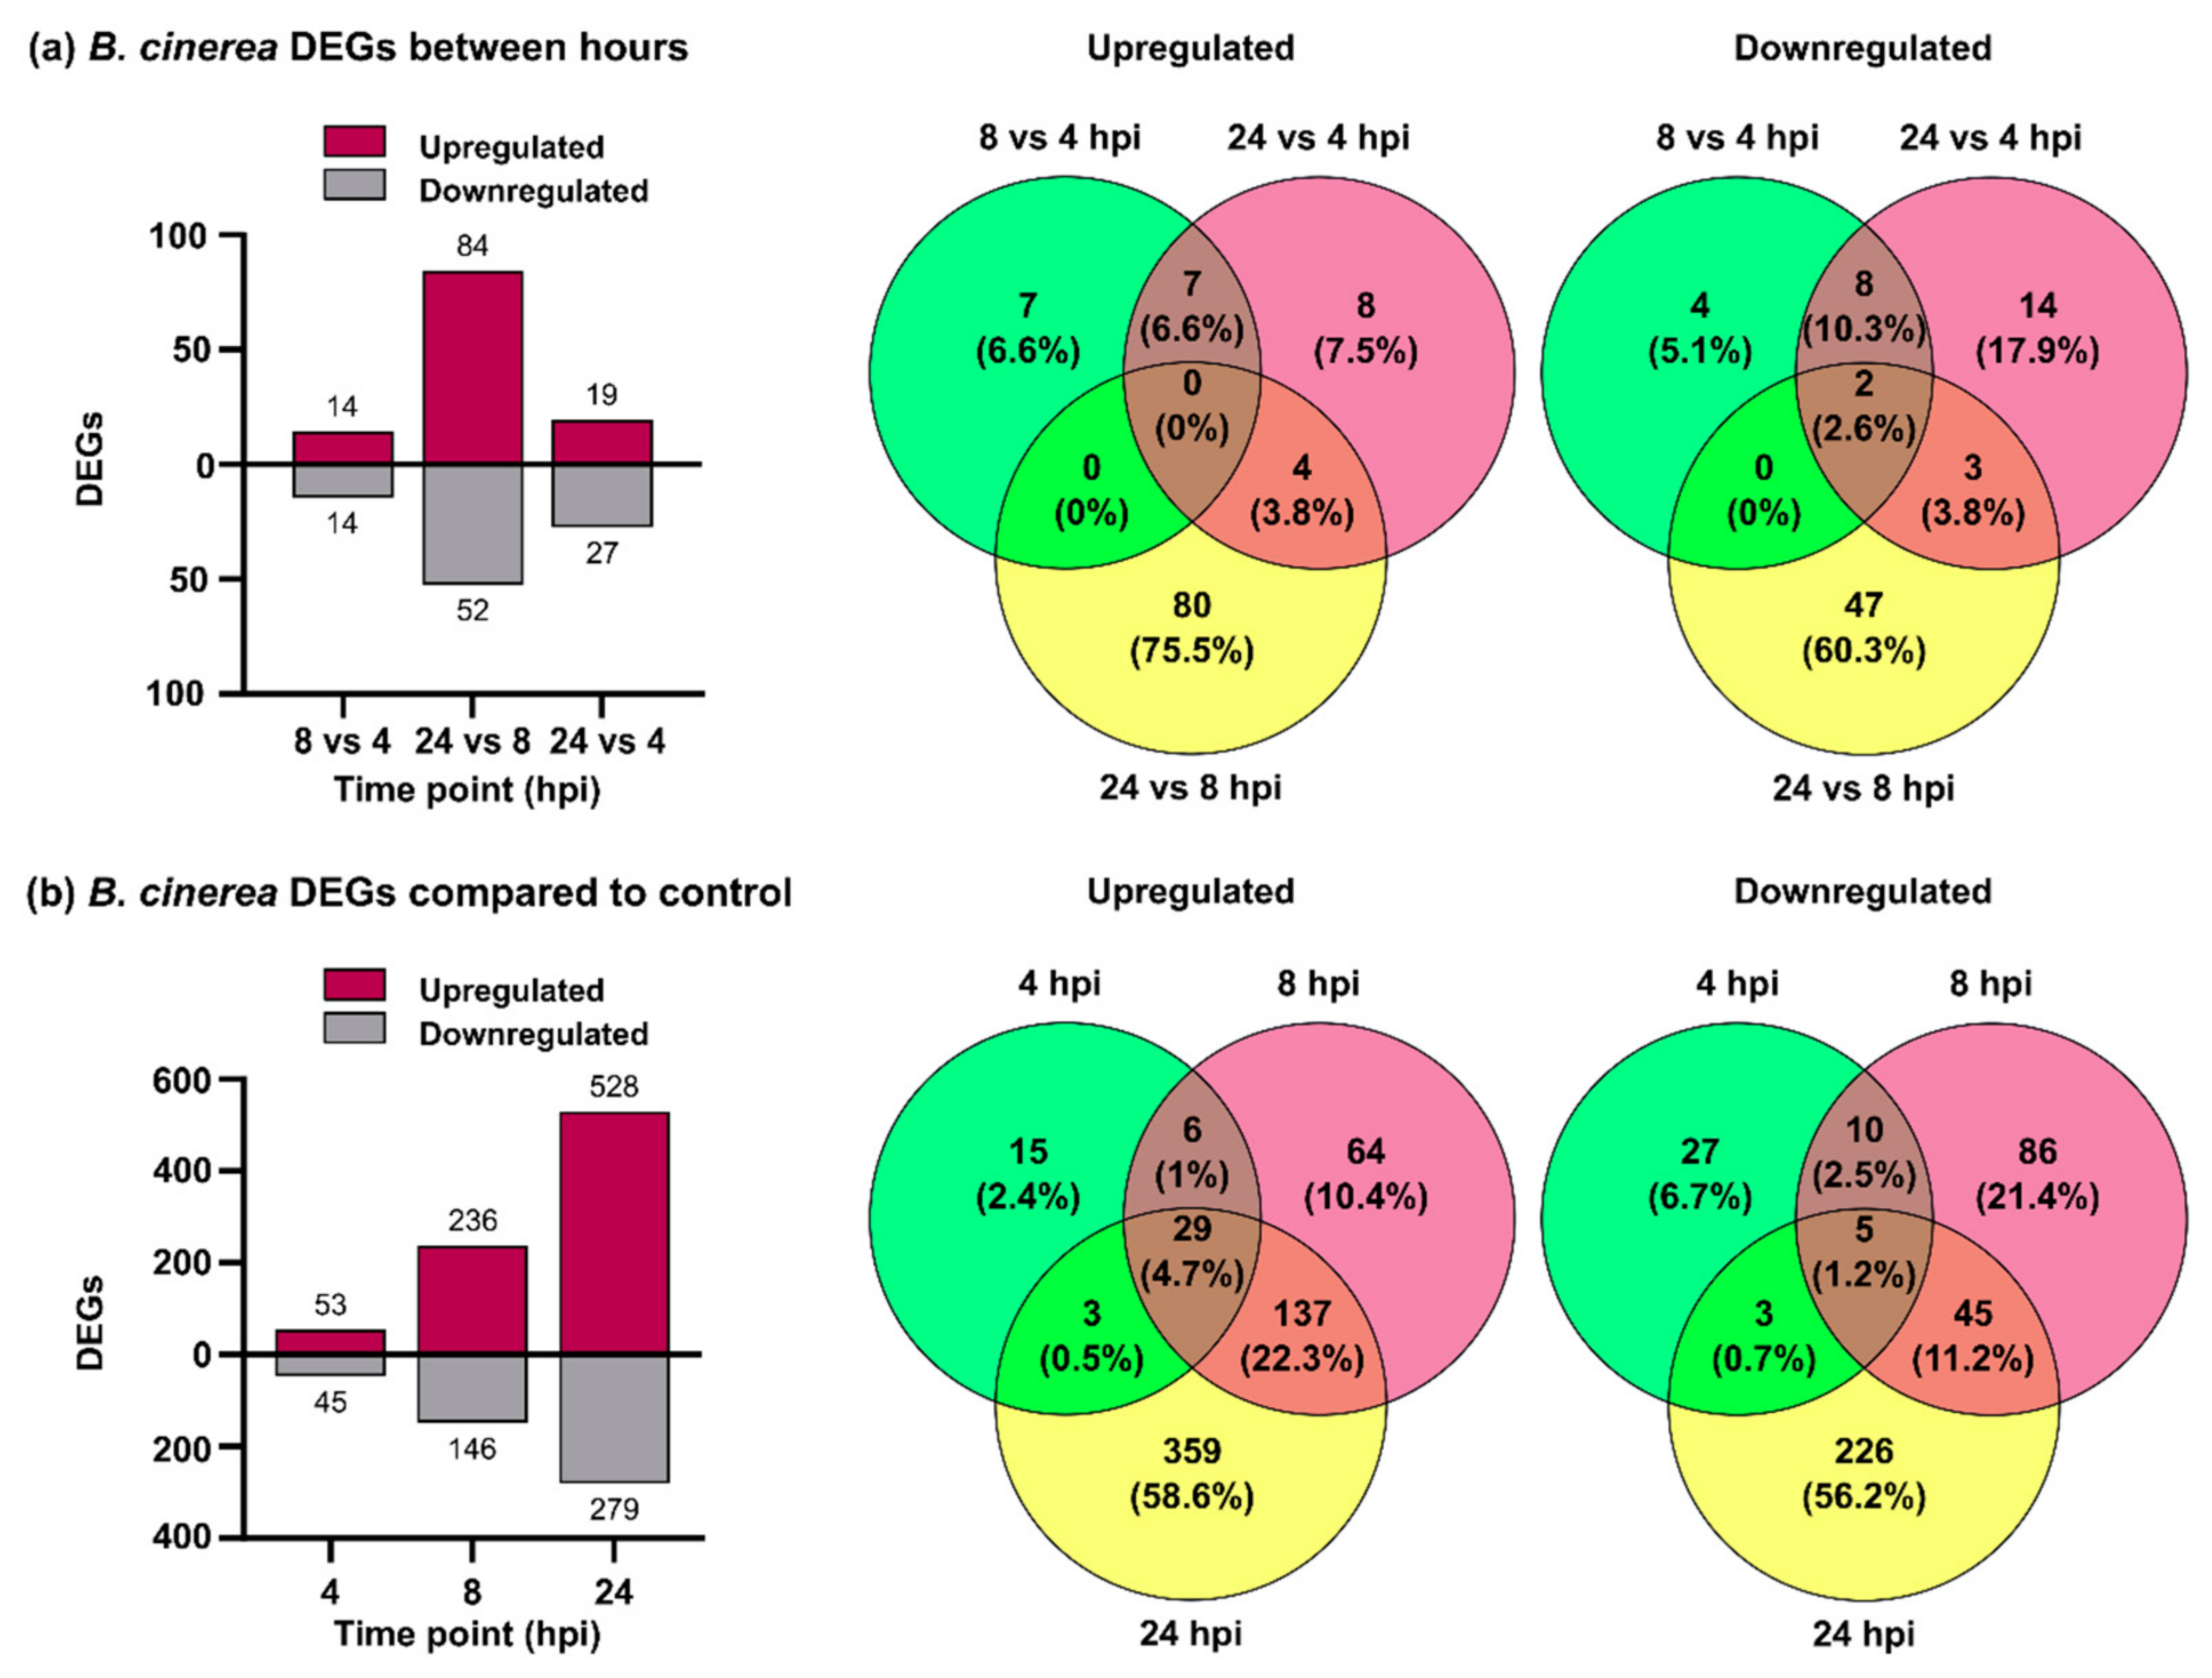
3.1. B. cinerea Differentially Expressed Genes during P. patens Infection
3.2. B. cinerea Genes Encoding Secreted Cell Wall Degrading Enzymes and Other Virulence Factors Are Induced during P. patens Infection
3.3. Genes Encoding B. cinerea Virulence Factors and Candidate Effectors Are Upregulated during Moss Infection
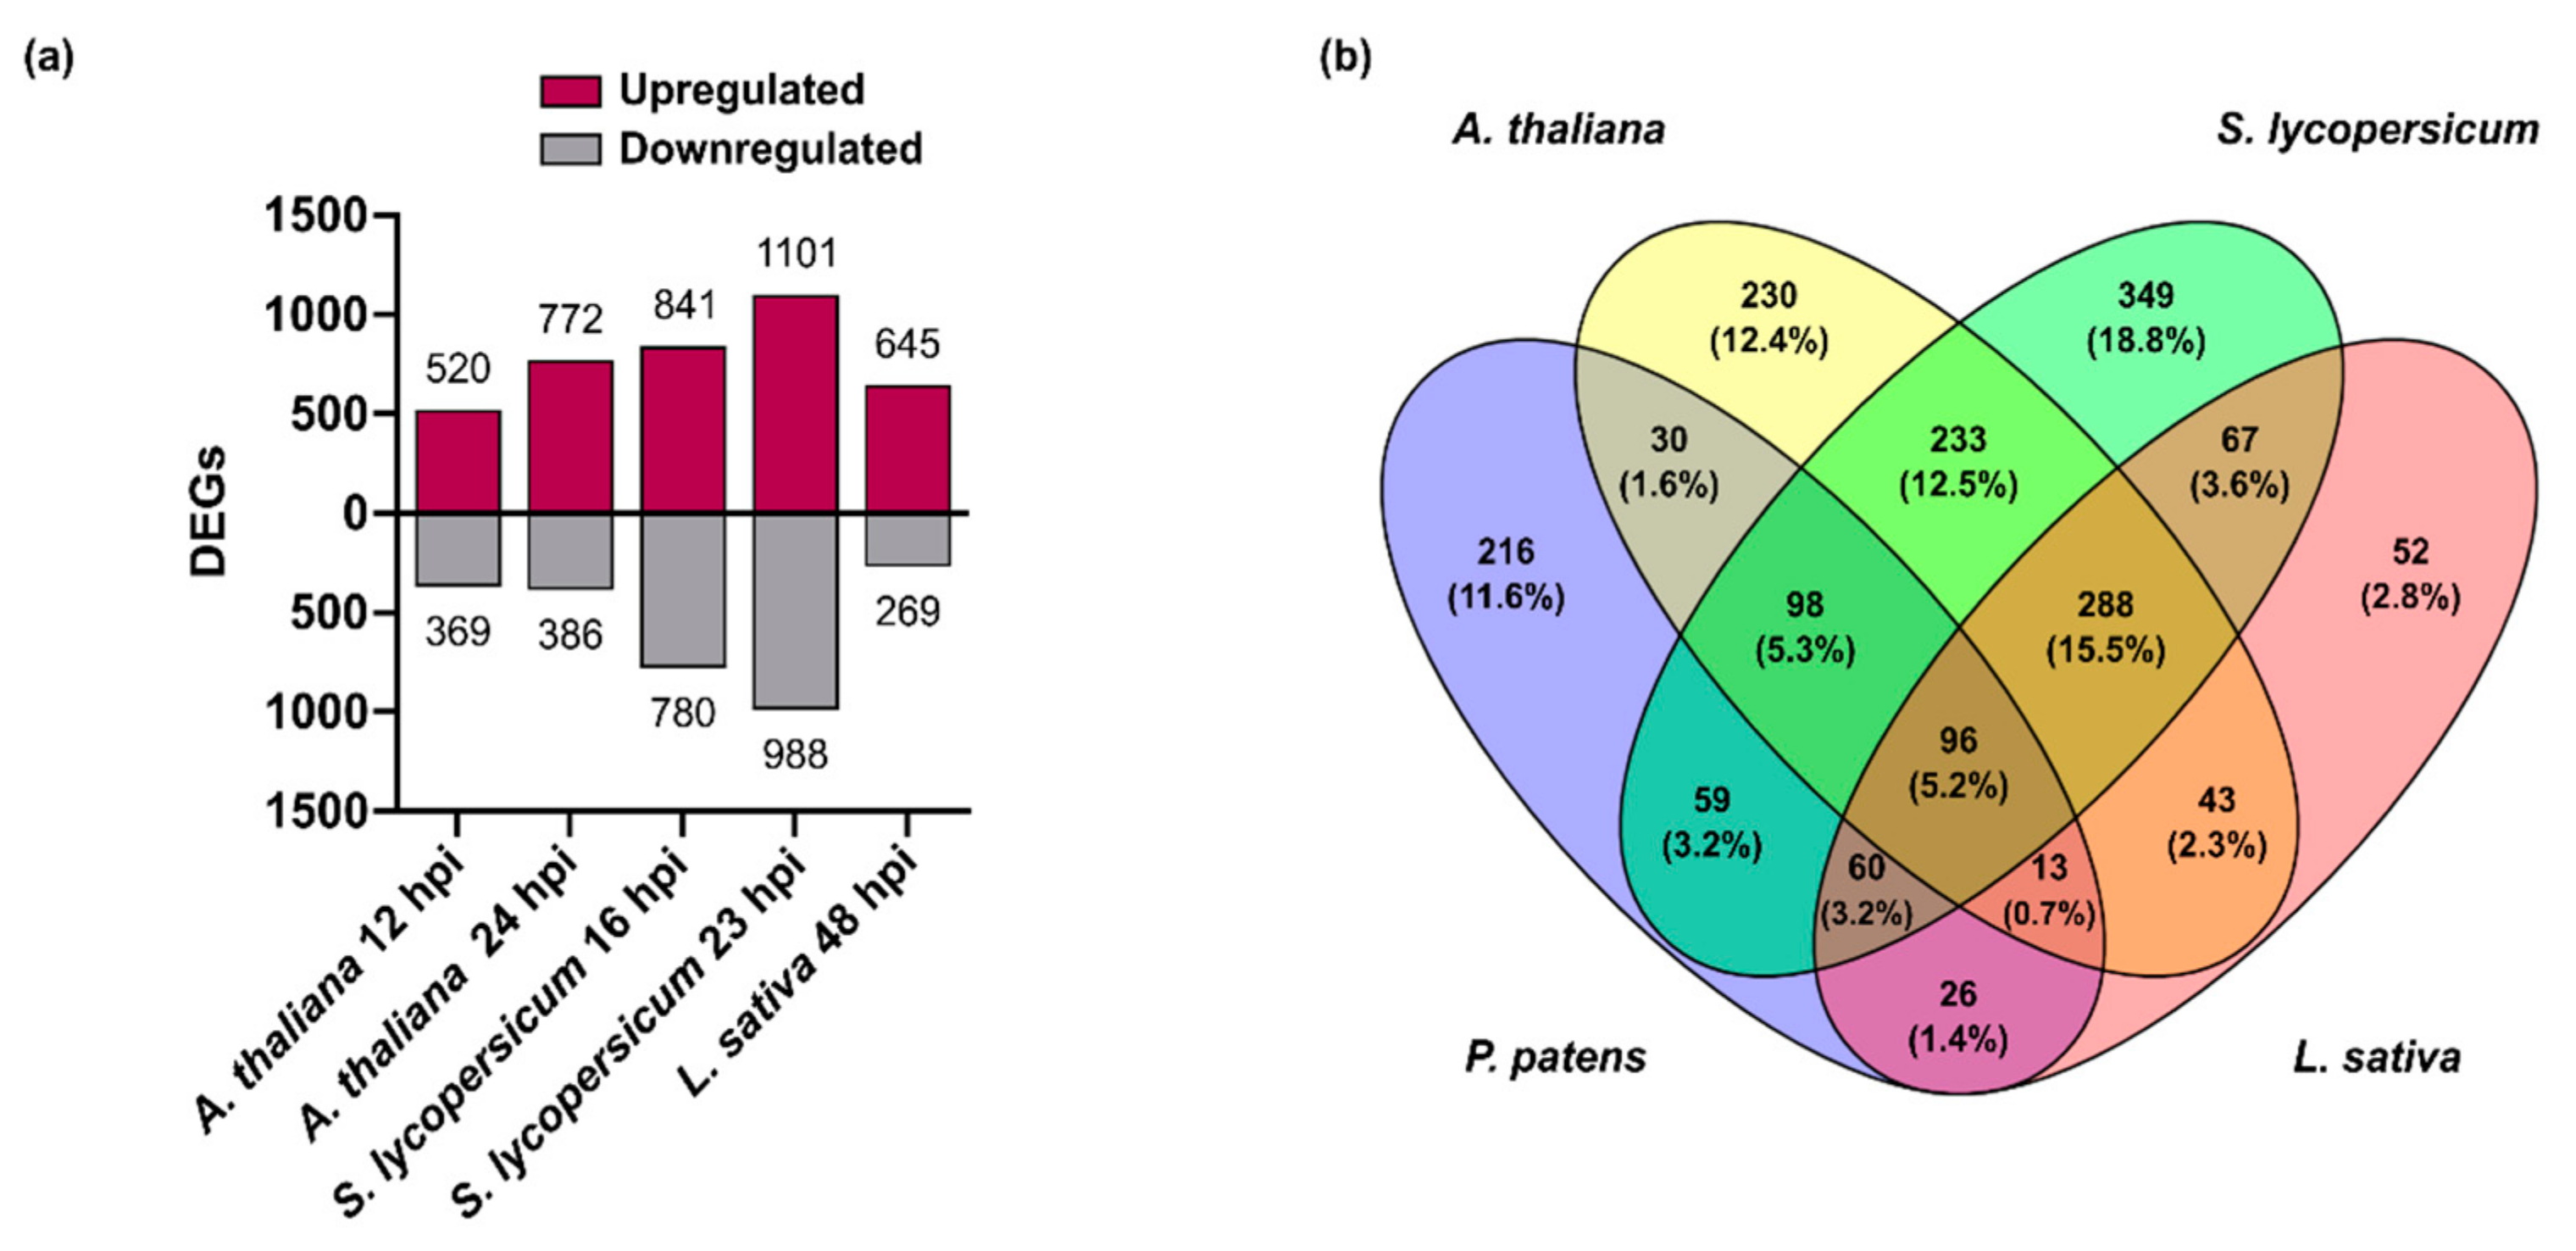
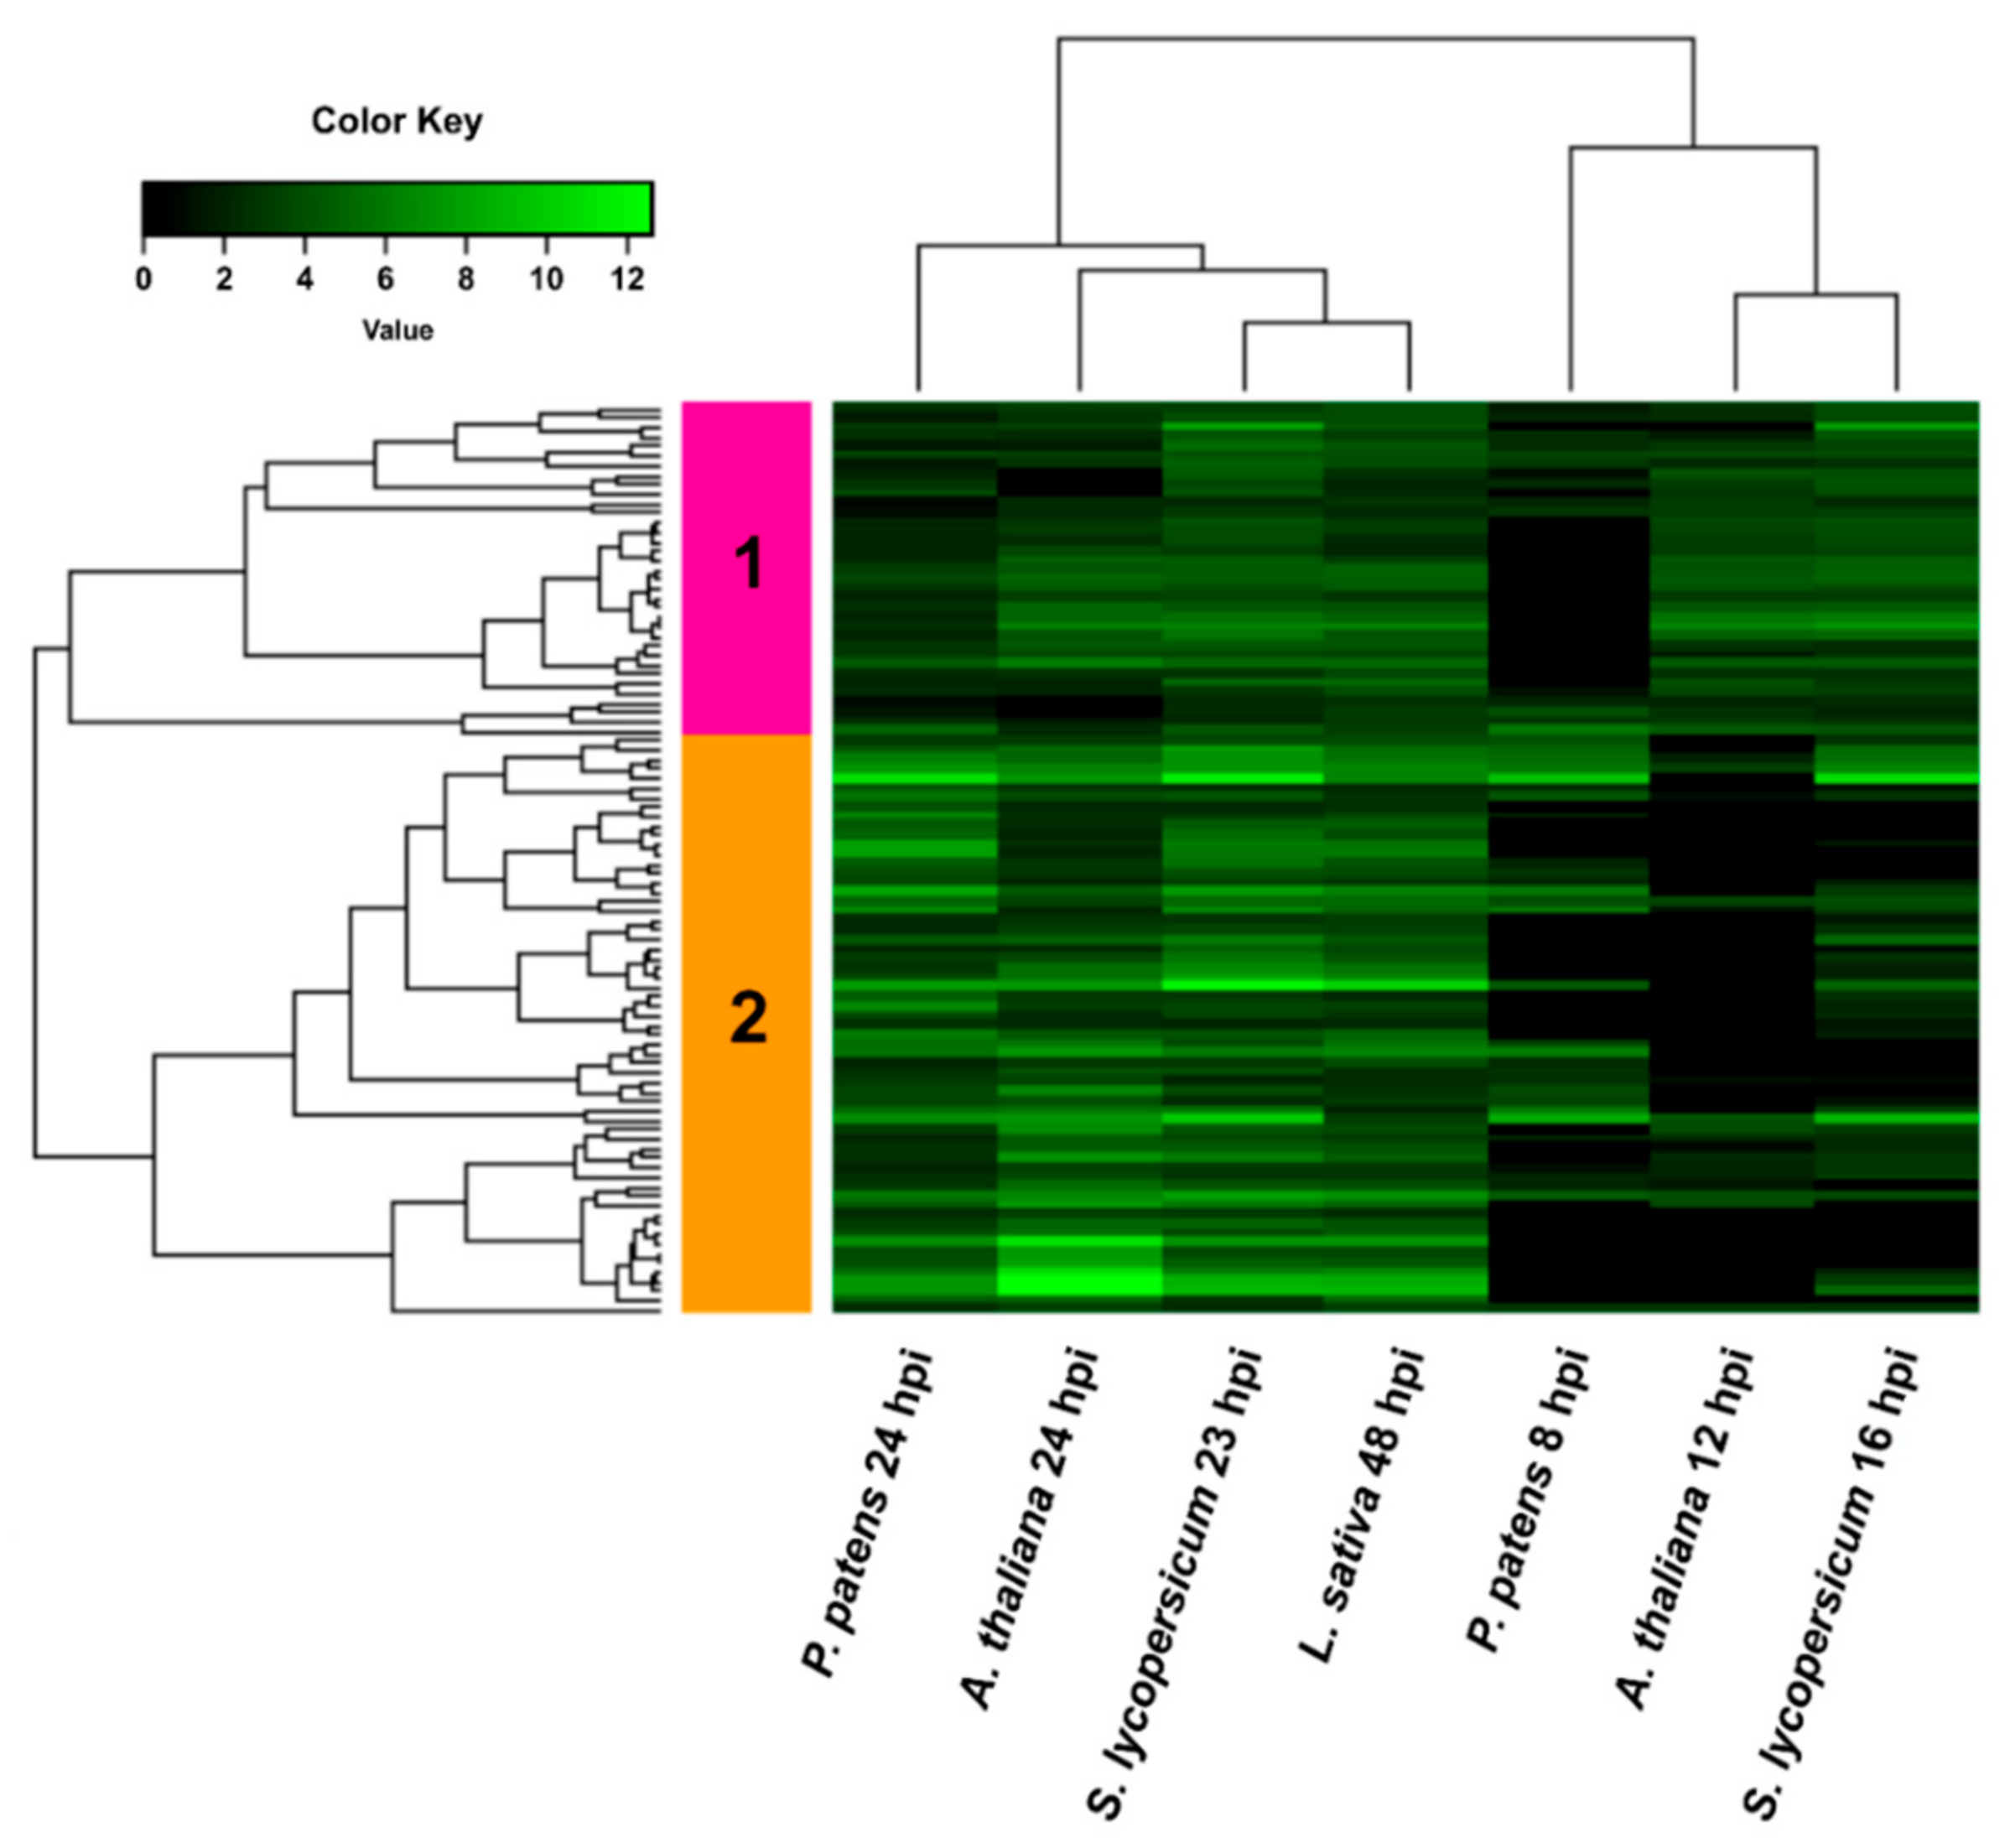
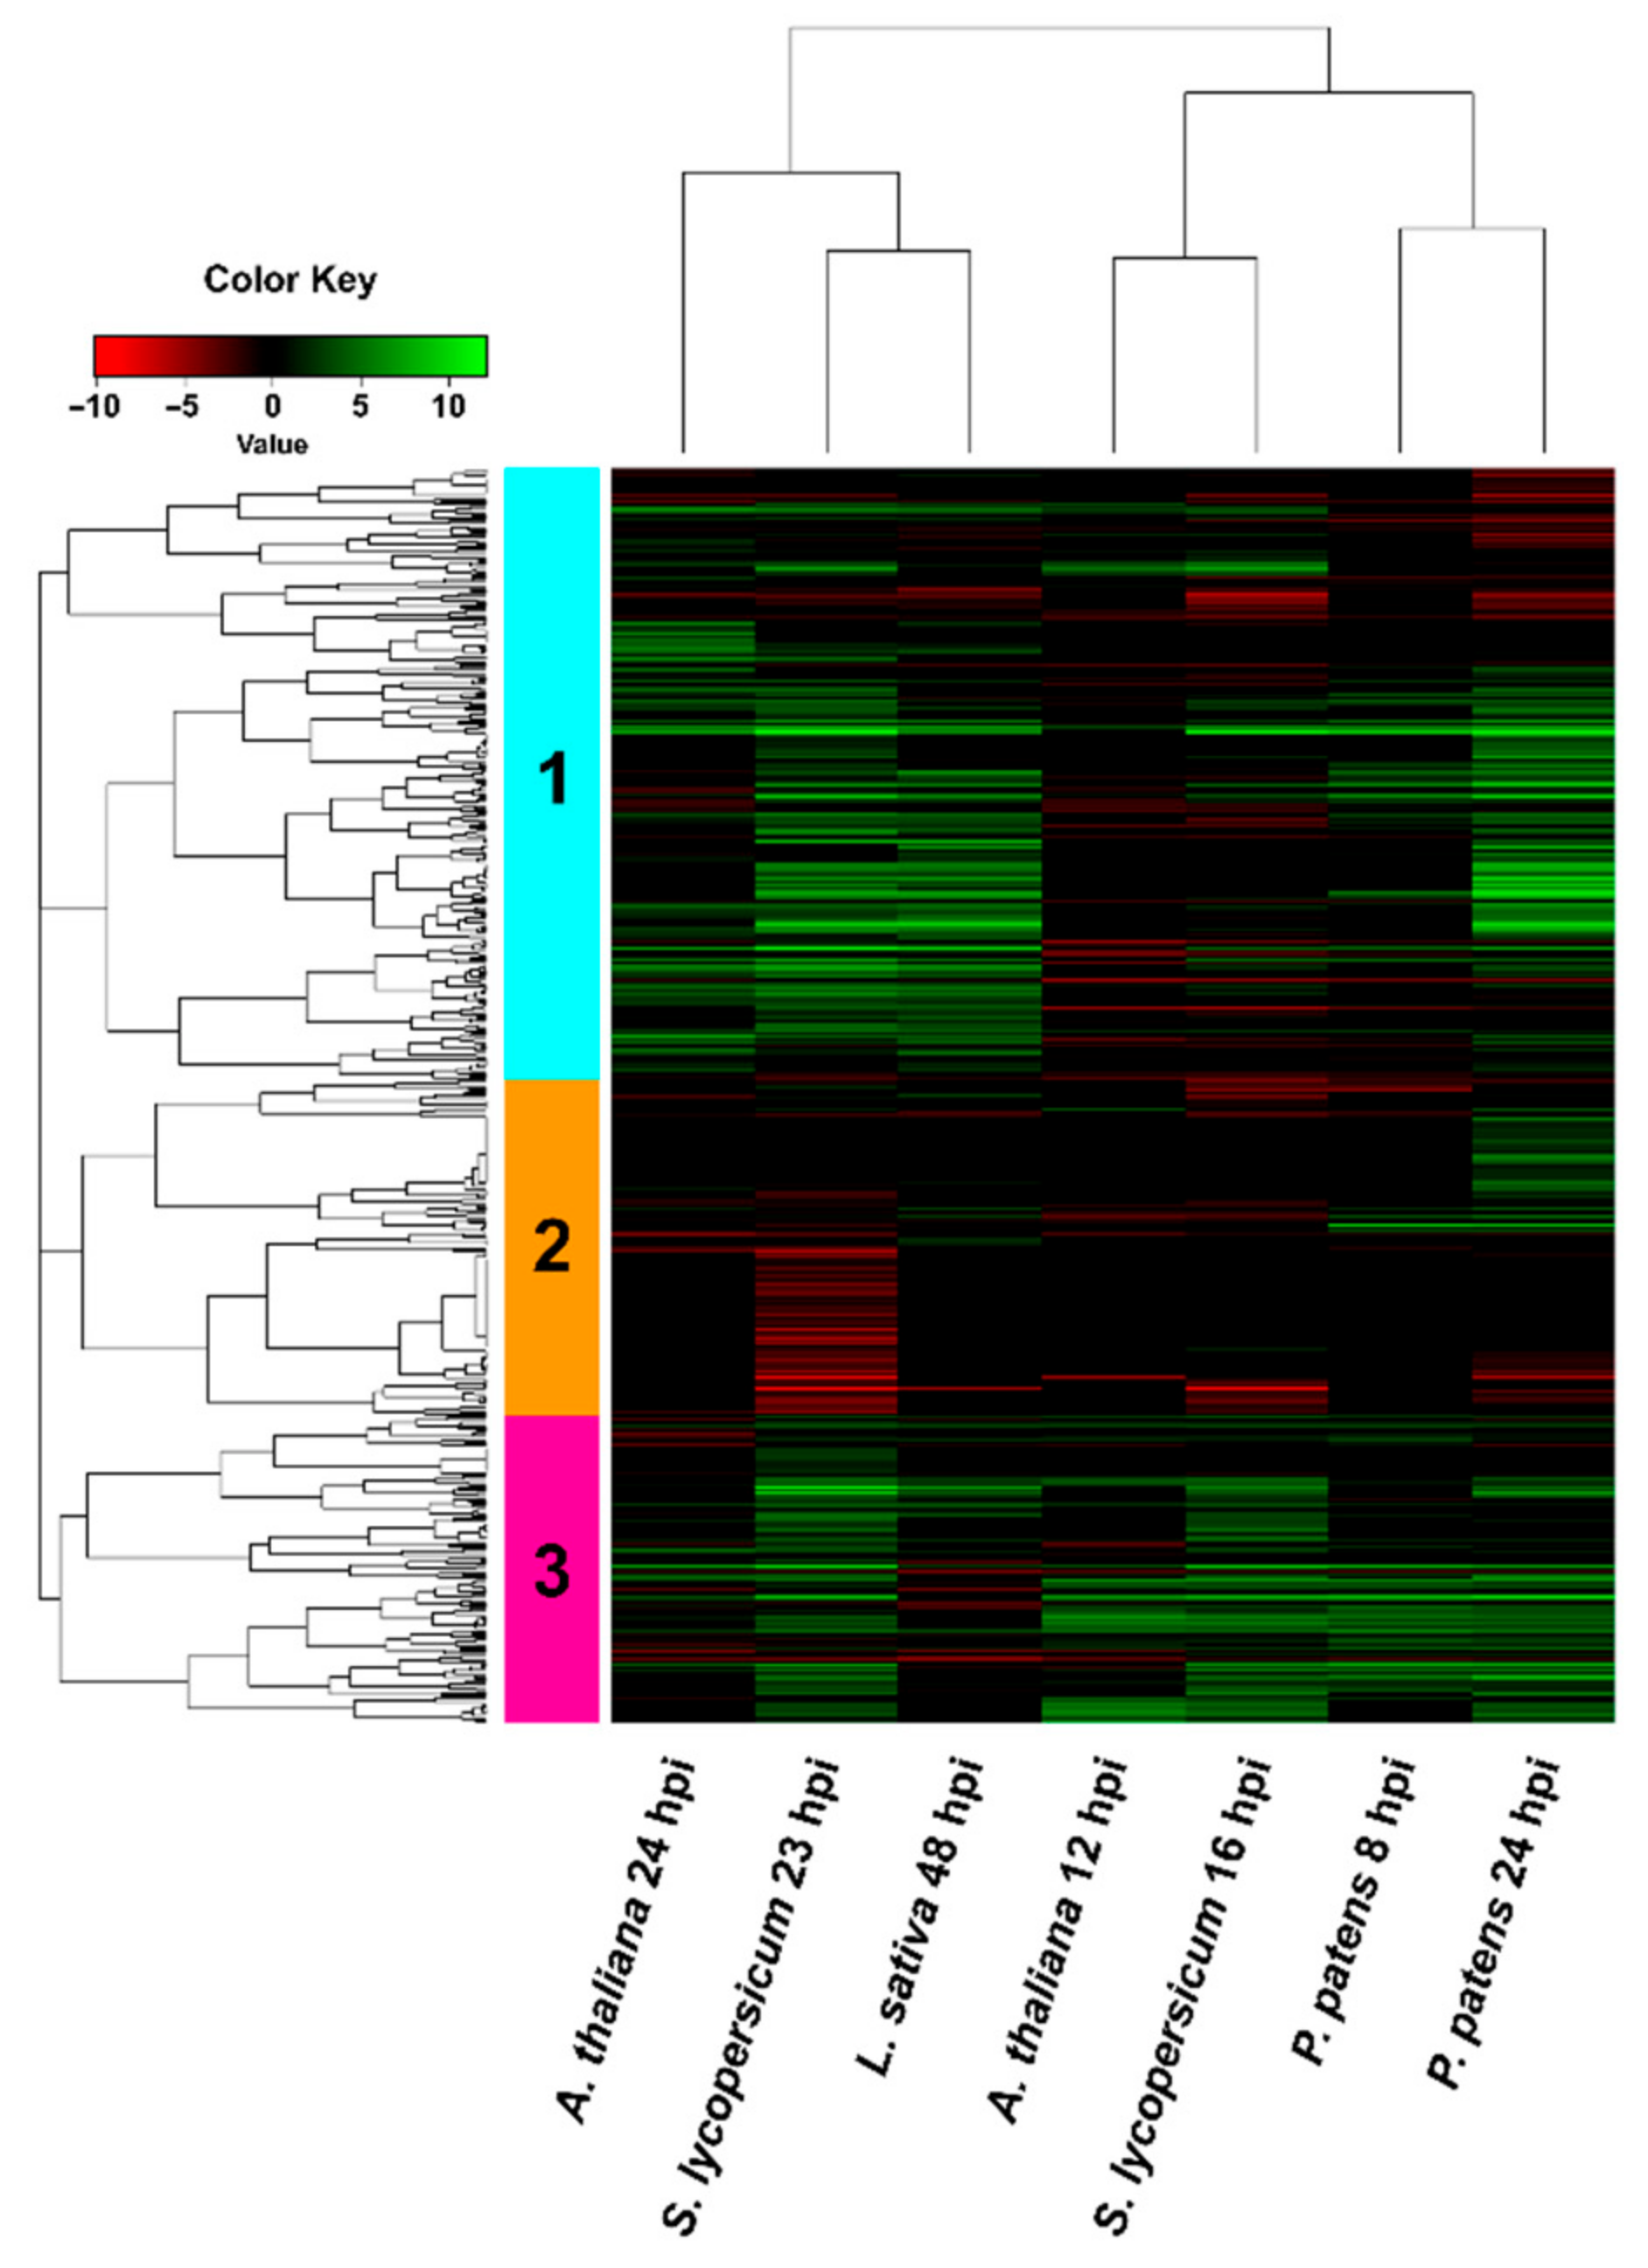
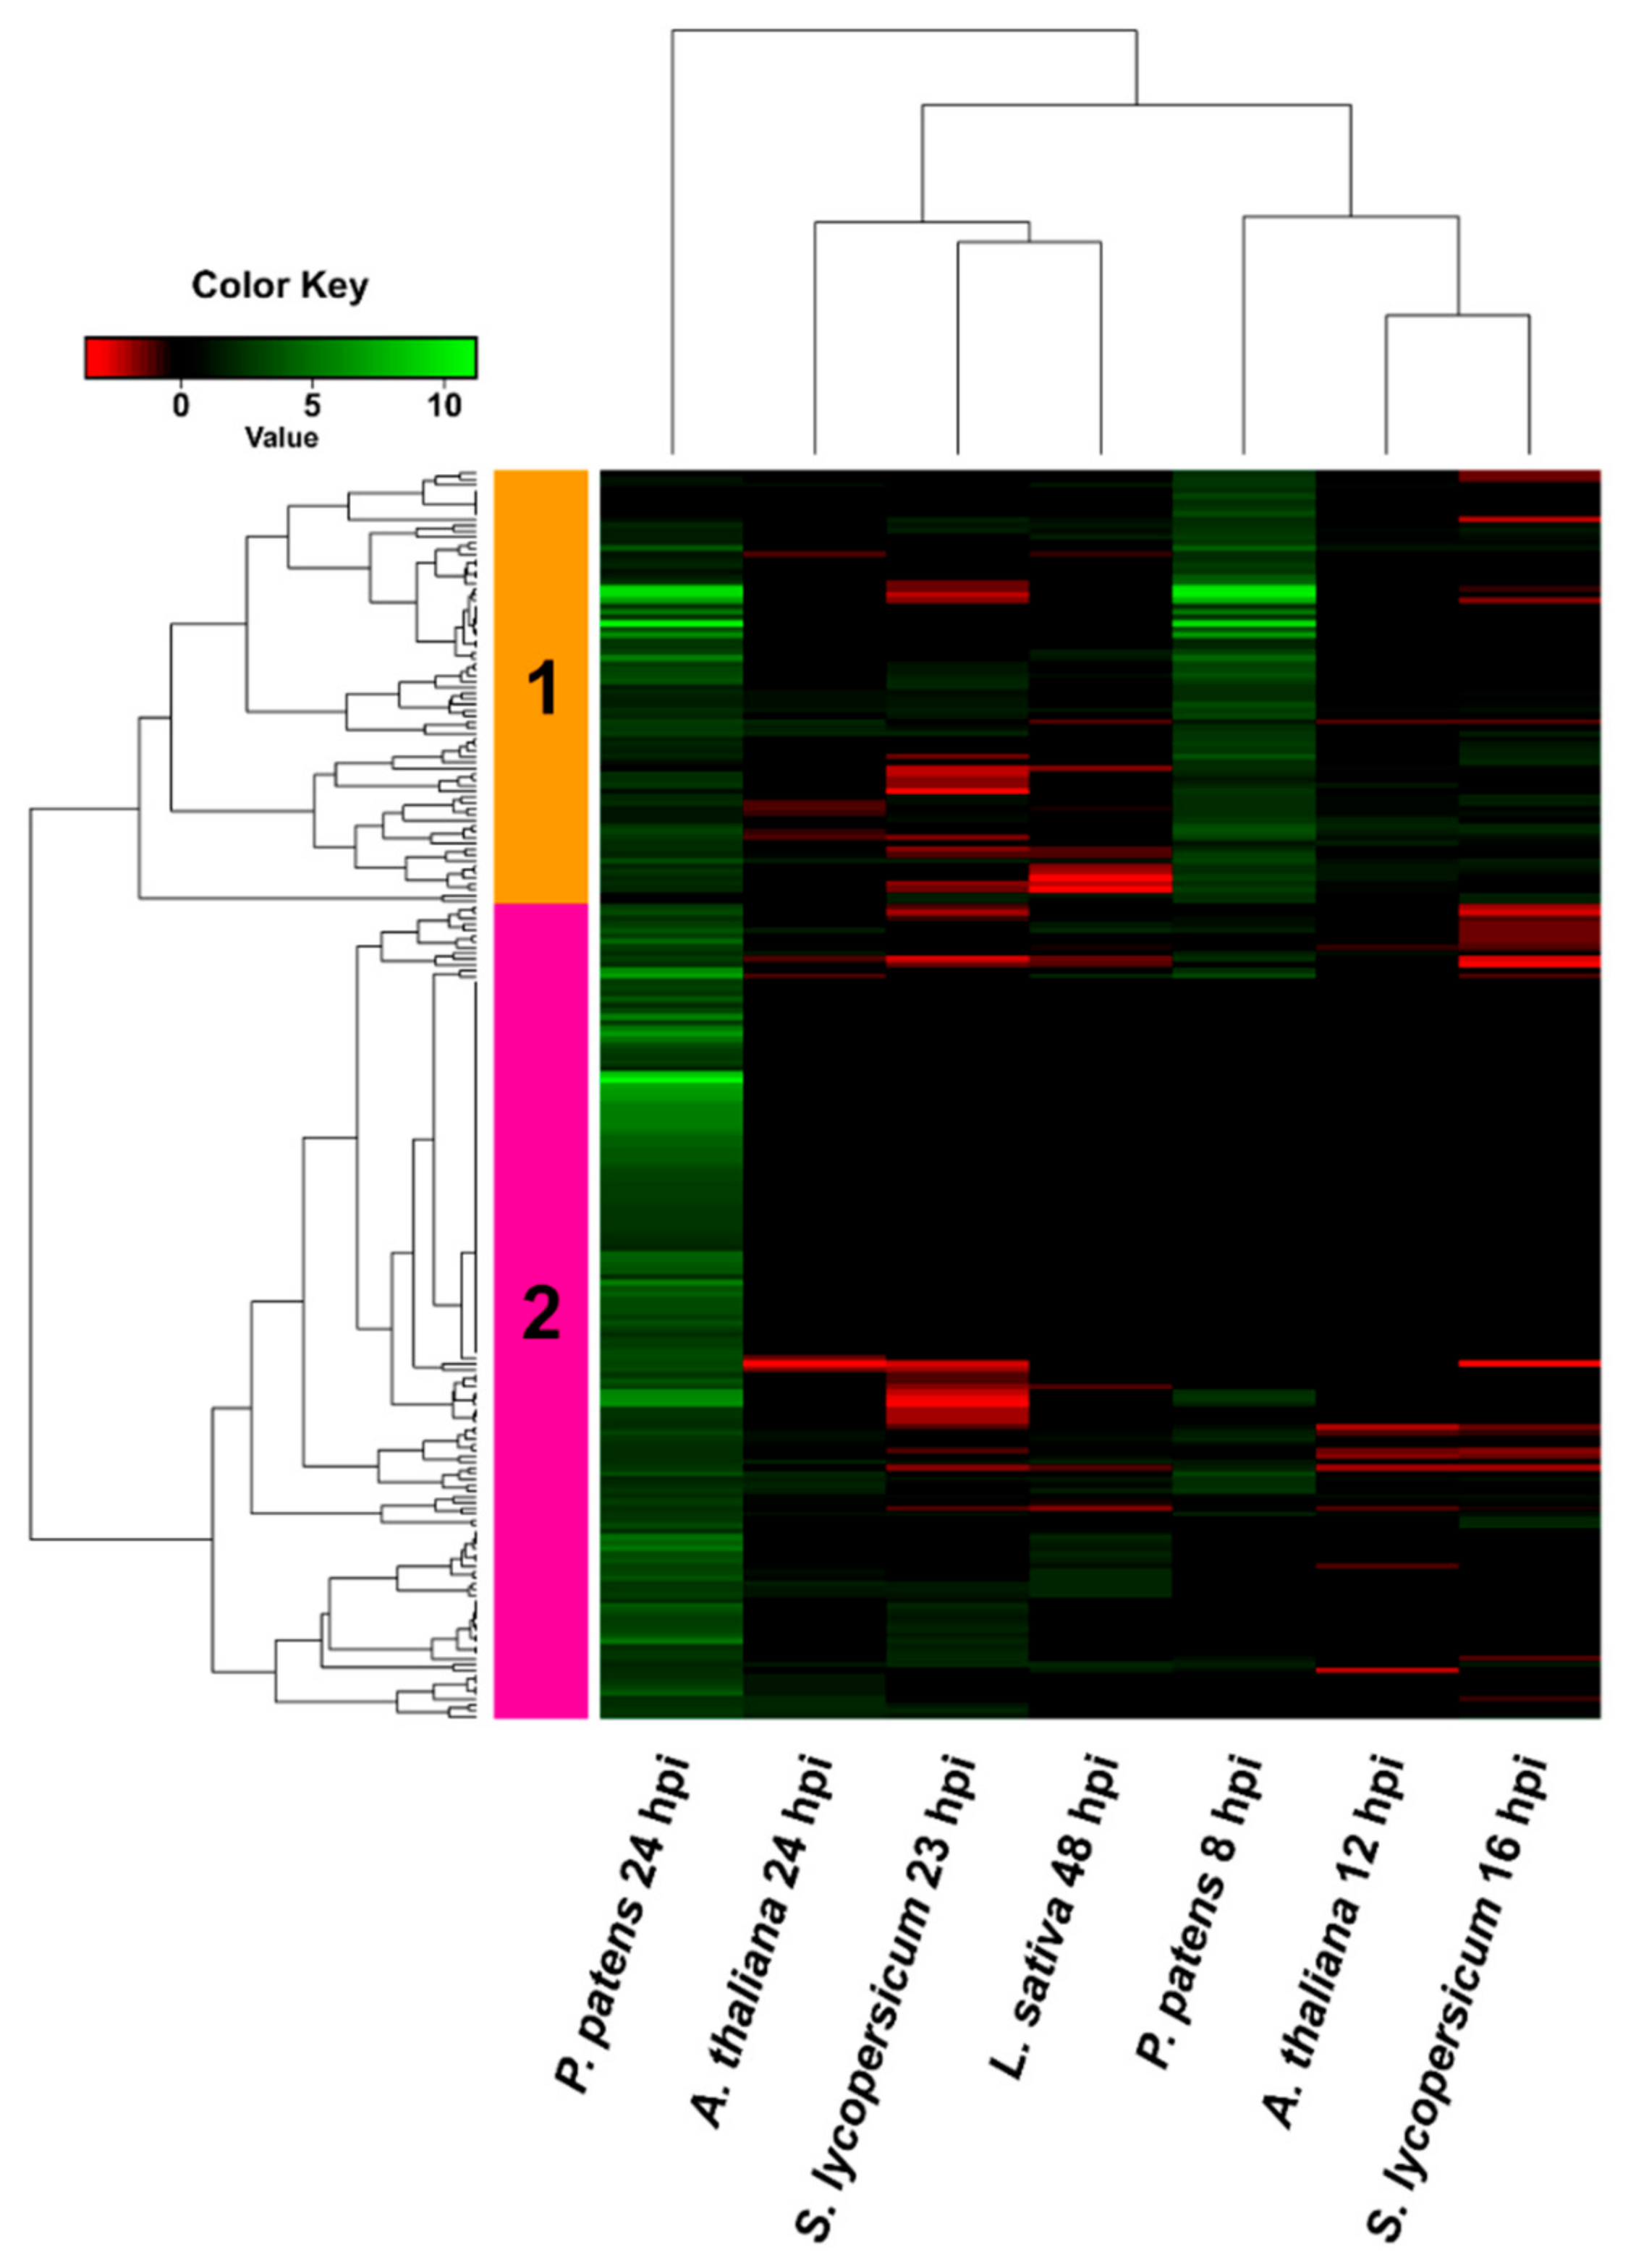
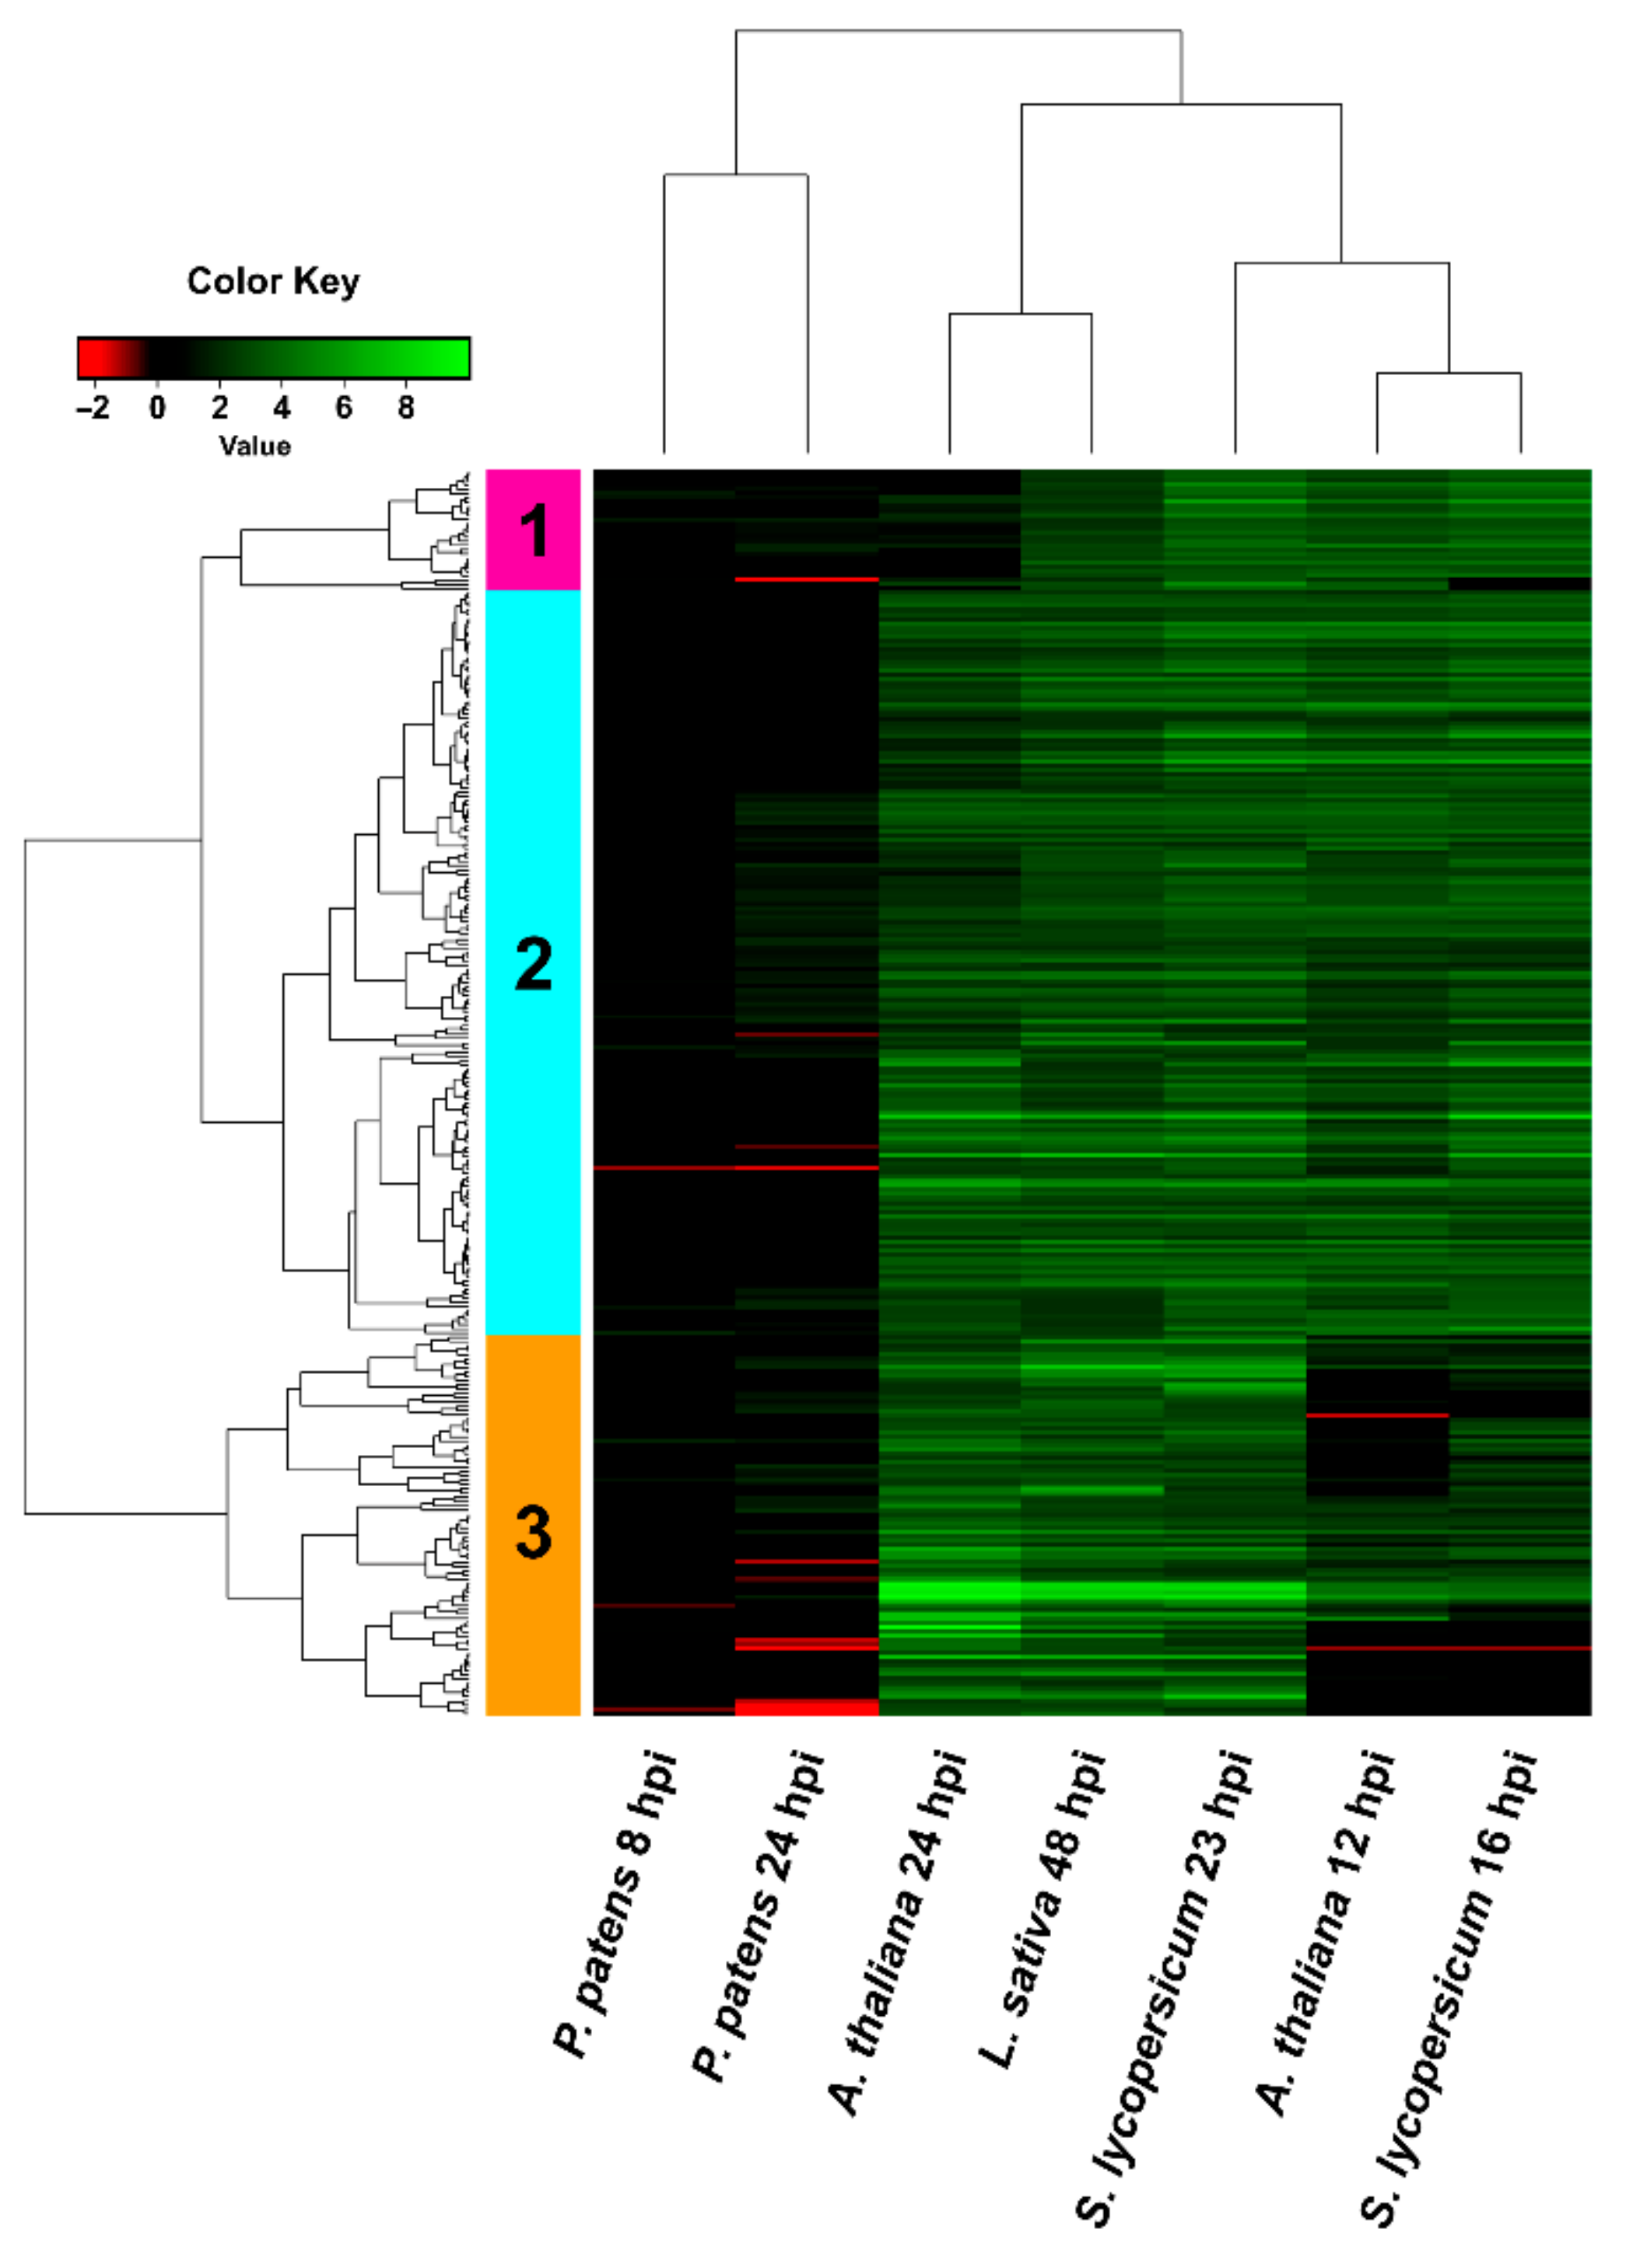
3.4. Comparison of B. cinerea DEGs during the Interaction with P. patens and Three Different Angiosperms
4. Discussion
5. Conclusions
Supplementary Materials
Author Contributions
Funding
Acknowledgments
Conflicts of Interest
References
- Elad, Y.; Pertot, I.; Cotes Prado, A.M.; Stewart, A. Plant hosts of Botrytis spp. In Botrytis—The Fungus, the Pathogen and Its Management in Agricultural Systems; Fillinger, S., Elad, Y., Eds.; Springer: Berlin, Germany, 2015; pp. 413–486. [Google Scholar]
- Dean, R.; van Kan, J.A.L.; Pretorius, Z.A.; Hammond-Kosack, K.E.; Di Pietro, A.; Spanu, P.D.; Rudd, J.J.; Dickman, M.; Kahmann, R.; Ellis, J. The Top 10 fungal pathogens in molecular plant pathology. Mol. Plant Pathol. 2012, 13, 414–430. [Google Scholar] [CrossRef] [PubMed]
- Williamson, B.; Tudzynski, B.; Tudzynski, P.; Van Kan, J.A.L. Botrytis cinerea: The cause of grey mould disease. Mol. Plant Pathol. 2007, 8, 561–580. [Google Scholar] [CrossRef] [PubMed]
- Nicot, P.C.; Baille, A. Integrated Control of Botrytis cinerea on Greenhouse Tomatoes. In Aerial Plant Surface Microbiology; Springer: Boston, MA, USA, 2007; pp. 169–189. [Google Scholar]
- Elad, Y.; Williamson, B.; Tudzynski, P.; Delen, N. Botrytis spp. and Diseases They Cause in Agricultural Systems—An Introduction. In Botrytis: Biology, Pathology and Control; Springer Science and Business Media LLC: Dordrecht, The Netherlands, 2007; pp. 1–8. [Google Scholar]
- Fillinger, S.; Elad, Y. Botrytis—The Fungus, the Pathogen and Its Management in Agricultural Systems; Springer: New York, NY, USA, 2016. [Google Scholar]
- Holz, G.; Coertze, S.; Williamson, B. The Ecology of Botrytis on Plant Surfaces. In Botrytis: Biology, Pathology and Control; Elad, Y., Williamson, B., Tudzynski, P., Delen, N., Eds.; Springer: Dordrecht, The Netherlands, 2007; pp. 9–27. [Google Scholar]
- Govrin, E.M.; Levine, A. The hypersensitive response facilitates plant infection by the necrotrophic pathogen Botrytis cinerea. Curr. Biol. 2000, 10, 751–757. [Google Scholar] [CrossRef]
- Van Kan, J.A. Licensed to kill: The lifestyle of a necrotrophic plant pathogen. Trends Plant Sci. 2006, 11, 247–253. [Google Scholar] [CrossRef] [PubMed]
- Choquer, M.; Fournier, E.; Kunz, C.; Levis, C.; Pradier, J.-M.; Simon, A.; Viaud, M. Botrytis cinerea virulence factors: New insights into a necrotrophic and polyphageous pathogen. FEMS Microbiol. Lett. 2007, 277, 1–10. [Google Scholar] [CrossRef]
- Gourgues, M.; Brunet-Simon, A.; Lebrun, M.-H.; Levis, C. The tetraspanin BcPls1 is required for appressorium-mediated penetration of Botrytis cinerea into host plant leaves. Mol. Microbiol. 2003, 51, 619–629. [Google Scholar] [CrossRef]
- Amselem, J.; Cuomo, C.A.; Van Kan, J.A.L.; Viaud, M.; Benito, E.P.; Couloux, A.; Coutinho, P.M.; De Vries, R.P.; Dyer, P.S.; Fillinger, S.; et al. Genomic Analysis of the Necrotrophic Fungal Pathogens Sclerotinia sclerotiorum and Botrytis cinerea. PLoS Genet. 2011, 7, e1002230. [Google Scholar] [CrossRef]
- Espino, J.; Brito, N.; Noda, J.; González, C. Botrytis cinerea endo-ß-1,4-glucanase Cel5A is expressed during infection but is not required for pathogenesis. Physiol. Mol. Plant Pathol. 2005, 66, 213–221. [Google Scholar] [CrossRef]
- Kars, I.; McCalman, M.; Wagemakers, L.; Van Kan, J.A.L. Functional analysis of Botrytis cinerea pectin methylesterase genes by PCR-based targeted mutagenesis: Bcpme1 and Bcpme2 are dispensable for virulence of strain B05.10. Mol. Plant Pathol. 2005, 6, 641–652. [Google Scholar] [CrossRef]
- Van Kan, J.A.L.; Klooster, J.W.V.; Wagemakers, C.A.M.; Dees, D.C.T.; Van Der Vlugt-Bergmans, C.J.B. Cutinase A of Botrytis cinerea is Expressed, but not Essential, During Penetration of Gerbera and Tomato. Mol. Plant Microbe Interact. 1997, 10, 30–38. [Google Scholar] [CrossRef]
- Reis, H.; Pfiffi, S.; Hahn, M. Molecular and functional characterization of a secreted lipase from Botrytis cinerea. Mol. Plant Pathol. 2005, 6, 257–267. [Google Scholar] [CrossRef] [PubMed]
- Colmenares, A.J.; Aleu, J.; Durán-Patrón, R.; Collado, I.G.G.; Hernández-Galán, R. The Putative Role of Botrydial and Related Metabolites in the Infection Mechanism of Botrytis cinerea. J. Chem. Ecol. 2002, 28, 997–1005. [Google Scholar] [CrossRef] [PubMed]
- Van Kan, J.A.L.; Stassen, J.H.M.; Mosbach, A.; Van Der Lee, T.A.J.; Faino, L.; Farmer, A.D.; Papasotiriou, D.G.; Zhou, S.; Seidl, M.F.; Cottam, E.; et al. A gapless genome sequence of the fungus Botrytis cinerea. Mol. Plant Pathol. 2016, 18, 75–89. [Google Scholar] [CrossRef] [PubMed]
- Manteau, S.; Abouna, S.; Lambert, B.; Legendre, L. Differential regulation by ambient pH of putative virulence factor secretion by the phytopathogenic fungus Botrytis cinerea. FEMS Microbiol. Ecol. 2003, 43, 359–366. [Google Scholar] [CrossRef] [PubMed]
- Kunz, C.; Vandelle, E.; Rolland, S.; Poinssot, B.; Bruel, C.; Cimerman, A.; Zotti, C.; Moreau, E.; Vedel, R.; Pugin, A.; et al. Characterization of a new, nonpathogenic mutant of Botrytis cinerea with impaired plant colonization capacity. New Phytol. 2006, 170, 537–550. [Google Scholar] [CrossRef]
- AbuQamar, S.F.; Moustafa, K.; Tran, L.S. Mechanisms and strategies of plant defense against Botrytis cinerea. Crit. Rev. Biotechnol. 2017, 37, 262–274. [Google Scholar] [CrossRef] [PubMed]
- Veloso, J.; Van Kan, J.A. Many Shades of Grey in Botrytis–Host Plant Interactions. Trends Plant Sci. 2018, 23, 613–622. [Google Scholar] [CrossRef]
- Racovitza, A. Etude systématique et bryologique des champignons bryophiles. In Muséum National d’Histoire naturelle; Museum National D’histoire Naturelle: Paris, France, 1959; Volume 10, p. 288. [Google Scholar]
- Ponce De León, I.; Oliver, J.P.; Castro, A.; Gaggero, C.; Bentancor, M.; Vidal, S. Erwinia carotovora elicitors and Botrytis cinerea activate defense responses in Physcomitrella patens. BMC Plant Biol. 2007, 7, 52. [Google Scholar] [CrossRef]
- Krings, M.; Taylor, T.N.; Hass, H.; Kerp, H.; Dotzler, N.; Hermsen, E.J. Fungal endophytes in a 400-million-yr-old land plant: Infection pathways, spatial distribution, and host responses. New Phytol. 2007, 174, 648–657. [Google Scholar] [CrossRef]
- Ponce De León, I.; Schmelz, E.A.; Gaggero, C.; Castro, A.; Álvarez, A.; Montesano, M. Physcomitrella patens activates reinforcement of the cell wall, programmed cell death and accumulation of evolutionary conserved defence signals, such as salicylic acid and 12-oxo-phytodienoic acid, but not jasmonic acid, upon Botrytis cinerea infection. Mol. Plant Pathol. 2012, 13, 960–974. [Google Scholar] [CrossRef]
- Yan, H.Q.; Zhang, T.T.; Lan, S.C.; Jiang, S. Ultrastructural study on the interaction between Physcomitrella patens and Botrytis cinerea. Plant Pathol. 2017, 67, 42–50. [Google Scholar] [CrossRef]
- Reboledo, G.; Agorio, A.; Vignale, L.; Batista-García, R.; Ponce de León, I. Transcriptional profiling reveals conserved and species-specific plant defense responses during the interaction of Physcomitrium patens with Botrytis cinerea. Plant Mol. Biol. 2020. under review. [Google Scholar]
- Ashton, N.W.; Cove, D.J. The isolation and preliminary characterisation of auxotrophic and analogue resistant mutants of the moss, Physcomitrella patens. Mol. Genet. Genom. 1977, 154, 87–95. [Google Scholar] [CrossRef]
- Bolger, A.M.; Lohse, M.; Usadel, B. Trimmomatic: A flexible trimmer for Illumina sequence data. Bioinformatics 2014, 30, 2114–2120. [Google Scholar] [CrossRef] [PubMed]
- Kim, D.; Langmead, B.; Salzberg, S.L. HISAT: A fast spliced aligner with low memory requirements. Nat. Methods 2015, 12, 357–360. [Google Scholar] [CrossRef]
- Li, H.; Handsaker, B.; Wysoker, A.; Fennell, T.; Ruan, J.; Homer, N.; Marth, G.; Abecasis, G.; Durbin, R. 1000 Genome Project Data Processing Subgroup. The Sequence Alignment/Map format and SAMtools. Bioinformatics 2009, 25, 2078–2079. [Google Scholar] [CrossRef]
- Liao, Y.; Smyth, G.K.; Shi, W. featureCounts: An efficient general purpose program for assigning sequence reads to genomic features. Bioinformatics 2013, 30, 923–930. [Google Scholar] [CrossRef]
- Martini, F.; Binder, H. pcaExplorer: An R/Bioconductor package for interacting with RNA-seq principal components. BMC Bioinform. 2019, 20, 1–8. [Google Scholar] [CrossRef]
- Robinson, M.D.; McCarthy, D.J.; Smyth, G.K. edgeR: A Bioconductor package for differential expression analysis of digital gene expression data. Bioinformatics 2009, 26, 139–140. [Google Scholar] [CrossRef]
- Benjamini, Y.; Hochberg, Y. Controlling the false discovery rate: A practical and powerful approach to multiple testing. J. R. Stat. Soc. Ser. B Stat. Methodol. 1995, 57, 289–300. [Google Scholar] [CrossRef]
- Livak, K.J.; Schmittgen, T.D. Analysis of relative gene expression data using real-time quantitative PCR and the 2-ΔΔCT Method. Methods 2001, 25, 402–408. [Google Scholar] [CrossRef] [PubMed]
- Coolen, S.; Proietti, S.; Hickman, R.; Olivas, N.H.D.; Huang, P.-P.; Van Verk, M.C.; Van Pelt, J.A.; Wittenberg, A.H.; De Vos, M.; Prins, M.; et al. Transcriptome dynamics of Arabidopsis during sequential biotic and abiotic stresses. Plant J. 2016, 86, 249–267. [Google Scholar] [CrossRef]
- De Cremer, K.; Mathys, J.; Voß, C.; Froenicke, L.; Michelmore, R.; Cammue, B.P.A.; De Coninck, B. RNAseq-based transcriptome analysis of Lactuca sativa infected by the fungal necrotroph Botrytis cinerea. Plant Cell Environ. 2013, 36, 1992–2007. [Google Scholar] [CrossRef] [PubMed]
- Srivastava, D.A.; Arya, G.C.; Pandaranayaka, E.P.J.; Manasherova, E.; Prusky, D.; Elad, Y.; Frenkel, O.; Harel, A. Transcriptome Profiling Data of Botrytis cinerea Infection on Whole Plant Solanum lycopersicum. Mol. Plant Microbe Interact. 2020, 33, 1103–1107. [Google Scholar] [CrossRef]
- Raudvere, U.; Kolberg, L.; Kuzmin, I.; Arak, T.; Adler, P.; Peterson, H.; Vilo, J. g:Profiler: A web server for functional enrichment analysis and conversions of gene lists (2019 update). Nucleic Acids Res. 2019, 47, W191–W198. [Google Scholar] [CrossRef] [PubMed]
- Heard, S.; Brown, N.A.; Hammond-Kosack, K. An Interspecies Comparative Analysis of the Predicted Secretomes of the Necrotrophic Plant Pathogens Sclerotinia sclerotiorum and Botrytis cinerea. PLoS ONE 2015, 10, e0130534. [Google Scholar] [CrossRef] [PubMed]
- Zhu, W.; Ronen, M.; Gur, Y.; Minz-Dub, A.; Masrati, G.; Ben-Tal, N.; Savidor, A.; Sharon, I.; Eizner, E.; Valerius, O.; et al. BcXYG1, a Secreted Xyloglucanase from Botrytis cinerea, Triggers Both Cell Death and Plant Immune Responses. Plant Physiol. 2017, 175, 438–456. [Google Scholar] [CrossRef] [PubMed]
- Cove, D.J.; Knight, C.D.; Lamparter, T. Mosses as model systems. Trends Plant Sci. 1997, 2, 99–105. [Google Scholar] [CrossRef]
- Zhang, L.; Thiewes, H.; Van Kan, J.A. The d-galacturonic acid catabolic pathway in Botrytis cinerea. Fungal Genet. Biol. 2011, 48, 990–997. [Google Scholar] [CrossRef]
- Mohnen, D. Pectin structure and biosynthesis. Curr. Opin. Plant Biol. 2008, 11, 266–277. [Google Scholar] [CrossRef]
- Zhang, L.; Lubbers, R.J.; Simon, A.; Stassen, J.H.; Ribera, P.R.V.; Viaud, M.; Van Kan, J.A. A novel Zn2Cys6transcription factor BcGaaR regulates D-galacturonic acid utilization in Botrytis cinerea. Mol. Microbiol. 2016, 100, 247–262. [Google Scholar] [CrossRef] [PubMed]
- Valero-Jiménez, C.A.; Veloso, J.; Staats, M.; Van Kan, J.A. Comparative genomics of plant pathogenic Botrytis species with distinct host specificity. BMC Genom. 2019, 20, 1–12. [Google Scholar] [CrossRef] [PubMed]
- Kong, W.; Chen, N.; Liu, T.; Zhu, J.; Wang, J.; He, X.; Jingqi, W. Large-Scale Transcriptome Analysis of Cucumber and Botrytis cinerea during Infection. PLoS ONE 2015, 10, e0142221. [Google Scholar] [CrossRef] [PubMed]
- Haile, Z.M.; Guzman, E.G.N.-D.; Moretto, M.; Sonego, P.; Engelen, K.; Zoli, L.; Moser, C.; Baraldi, E. Transcriptome Profiles of Strawberry (Fragaria vesca) Fruit Interacting With Botrytis cinerea at Different Ripening Stages. Front. Plant Sci. 2019, 10, 1131. [Google Scholar] [CrossRef]
- Haile, Z.M.; Malacarne, G.; Pilati, S.; Sonego, P.; Moretto, M.; Masuero, D.; Vrhovsek, U.; Engelen, K.; Baraldi, E.; Moser, C. Dual Transcriptome and Metabolic Analysis of Vitis vinifera cv. Pinot Noir Berry and Botrytis cinerea During Quiescence and Egressed Infection. Front. Plant Sci. 2020, 10, 1704. [Google Scholar] [CrossRef]
- Davey, M.L.; Currah, R.S. Interactions between mosses (Bryophyta) and fungi. Can. J. Bot. 2006, 84, 1509–1519. [Google Scholar] [CrossRef]
- Ponce De León, I. The Moss Physcomitrella patens as a Model System to Study Interactions between Plants and Phytopathogenic Fungi and Oomycetes. J. Pathog. 2011, 2011, 1–6. [Google Scholar] [CrossRef]
- Tenberge, K.B.; Beckedorf, M.; Hoppe, B.; Schouten, A.; Solf, M.; Driesch, M.V.D. In Situ Localization of AOS in Host-Pathogen Interactions. Microsc. Microanal. 2002, 8, 250–251. [Google Scholar] [CrossRef]
- Zhang, M.; Sun, C.; Liu, Y.; Feng, H.; Chang, H.; Cao, S.; Li, G.; Yang, S.; Hou, J.; Zhu-Salzman, K.; et al. Transcriptome analysis and functional validation reveal a novel gene, BcCGF1, that enhances fungal virulence by promoting infection-related development and host penetration. Mol. Plant Pathol. 2020, 21, 834–853. [Google Scholar] [CrossRef]
- Hou, J.; Feng, H.; Chang, H.; Liu, Y.; Li, G.; Yang, S.; Sun, C.; Zhang, M.; Yuan, Y.; Sun, J.; et al. The H3K4 demethylase Jar1 orchestrates ROS production and expression of pathogenesis-related genes to facilitate Botrytis cinerea virulence. New Phytol. 2019, 225, 930–947. [Google Scholar] [CrossRef]
- Turrion-Gomez, J.L.; Benito, E.P. Flux of nitric oxide between the necrotrophic pathogen Botrytis cinerea and the host plant. Mol. Plant Pathol. 2011, 12, 606–616. [Google Scholar] [CrossRef] [PubMed]
- Siegmund, U.; Viefhues, A. Reactive Oxygen Species in the Botrytis—Host Interaction. In Botrytis—The Fungus, the Pathogen and Its Management in Agricultural Systems; Springer: Cham, Germany, 2015; pp. 269–289. [Google Scholar]
- Espino, J.J.; Gutiérrez-Sánchez, G.; Brito, N.; Shah, P.; Orlando, R.; González, C. The Botrytis cinerea early secretome. Proteom. 2010, 10, 3020–3034. [Google Scholar] [CrossRef] [PubMed]
- Tiedemann, A. Evidence for a primary role of active oxygen species in induction of host cell death during infection of bean leaves with Botrytis cinerea. Physiol. Mol. Plant Pathol. 1997, 50, 151–166. [Google Scholar] [CrossRef]
- Pinedo, C.; Wang, C.-M.; Pradier, J.-M.; Dalmais, B.; Choquer, M.; Le Pêcheur, P.; Morgant, G.; Collado, I.G.; Cane, D.E.; Viaud, M. Sesquiterpene Synthase from the Botrydial Biosynthetic Gene Cluster of the Phytopathogen Botrytis cinerea. ACS Chem. Biol. 2008, 3, 791–801. [Google Scholar] [CrossRef] [PubMed]
- Siewers, V.; Viaud, M.; Jimenez-Teja, D.; Collado, I.G.; Gronover, C.S.; Pradier, J.-M.; Tudzynski, B.; Tudzynski, P. Functional Analysis of the Cytochrome P450 Monooxygenase Gene bcbot1 of Botrytis cinerea Indicates That Botrydial Is a Strain-Specific Virulence Factor. Mol. Plant Microbe Interact. 2005, 18, 602–612. [Google Scholar] [CrossRef] [PubMed]
- Collado, I.G.G.; Viaud, M. Secondary Metabolism in Botrytis cinerea: Combining Genomic and Metabolomic Approaches. In Botrytis—The Fungus, the Pathogen and Its Management in Agricultural Systems; Springer: Cham, Germany, 2015; pp. 291–313. [Google Scholar]
- Porquier, A.; Morgant, G.; Moraga, J.; Dalmais, B.; Luyten, I.; Simon, A.; Pradier, J.-M.; Amselem, J.; Collado, I.G.; Viaud, M. The botrydial biosynthetic gene cluster of Botrytis cinerea displays a bipartite genomic structure and is positively regulated by the putative Zn(II)2Cys6 transcription factor BcBot6. Fungal Genet. Biol. 2016, 96, 33–46. [Google Scholar] [CrossRef] [PubMed]
- Dalmais, B.; Schumacher, J.; Moraga, J.; Le Pêcheur, P.; Tudzynski, B.; Collado, I.G.; Viaud, M. The Botrytis cinerea phytotoxin botcinic acid requires two polyketide synthases for production and has a redundant role in virulence with botrydial. Mol. Plant Pathol. 2011, 12, 564–579. [Google Scholar] [CrossRef]
- Arenas, Y.C.; Kalkman, E.R.; Schouten, A.; Dieho, M.; Vredenbregt, P.; Uwumukiza, B.; Oses-Ruiz, M.; Van Kan, J.A. Functional analysis and mode of action of phytotoxic Nep1-like proteins of Botrytis cinerea. Physiol. Mol. Plant Pathol. 2010, 74, 376–386. [Google Scholar] [CrossRef]
- Noda, J.; Brito, N.; González, C. The Botrytis cinerea xylanase Xyn11A contributes to virulence with its necrotizing activity, not with its catalytic activity. BMC Plant Biol. 2010, 10, 38. [Google Scholar] [CrossRef]
- Kars, I.; Krooshof, G.H.; Wagemakers, L.; Joosten, R.; Benen, J.A.E.; Van Kan, J.A.L. Necrotizing activity of five Botrytis cinerea endopolygalacturonases produced in Pichia pastoris. Plant J. 2005, 43, 213–225. [Google Scholar] [CrossRef]
- Brito, N.; Espino, J.J.; González, C. The Endo-β-1,4-Xylanase Xyn11A Is Required for Virulence in Botrytis cinerea. Mol. Plant Microbe Interact. 2006, 19, 25–32. [Google Scholar] [CrossRef] [PubMed]
- Li, B.; Wang, W.; Zong, Y.; Qin, G.; Tian, S. Exploring Pathogenic Mechanisms of Botrytis cinerea Secretome under Different Ambient pH Based on Comparative Proteomic Analysis. J. Proteome Res. 2012, 11, 4249–4260. [Google Scholar] [CrossRef] [PubMed]
- Shah, P.; Atwood, J.A.; Orlando, R.; El Mubarek, H.; Podila, G.K.; Davis, M.R. Comparative Proteomic Analysis of Botrytis cinerea Secretome. J. Proteome Res. 2009, 8, 1123–1130. [Google Scholar] [CrossRef] [PubMed]
- Fernández-Acero, F.J.; Colby, T.; Harzen, A.; Carbú, M.; Wieneke, U.; Cantoral, J.M.; Schmidt, J. 2-DE proteomic approach to the Botrytis cinerea secretome induced with different carbon sources and plant-based elicitors. Proteomics 2010, 10, 2270–2280. [Google Scholar] [CrossRef] [PubMed]
- Shah, P.; Powell, A.L.; Orlando, R.; Bergmann, C.; Gutierrez-Sanchez, G. Proteomic Analysis of Ripening Tomato Fruit Infected by Botrytis cinerea. J. Proteome Res. 2012, 11, 2178–2192. [Google Scholar] [CrossRef] [PubMed]
- Staples, R.C.; Mayer, A. Putative virulence factors of Botrytis cinerea acting as a wound pathogen. FEMS Microbiol. Lett. 1995, 134, 1–7. [Google Scholar] [CrossRef][Green Version]
- Leroch, M.; Kleber, A.; Silva, E.; Coenen, T.; Koppenhöfer, D.; Shmaryahu, A.; Valenzuela, P.D.T.; Hahn, M. Transcriptome Profiling of Botrytis cinerea Conidial Germination Reveals Upregulation of Infection-Related Genes during the Prepenetration Stage. Eukaryot. Cell 2013, 12, 614–626. [Google Scholar] [CrossRef]
- Lee, S.B.; Yang, S.U.; Pandey, G.; Kim, M.; Hyoung, S.; Choi, D.; Shin, H.-Y.; Suh, M.C. Occurrence of land-plant-specific glycerol-3-phosphate acyltransferases is essential for cuticle formation and gametophore development in Physcomitrella patens. New Phytol. 2019, 225, 2468–2483. [Google Scholar] [CrossRef]
- Blanco-Ulate, B.; Morales-Cruz, A.; Amrine, K.C.H.; Labavitch, J.M.; Powell, A.L.T.; Cantu, D. Genome-wide transcriptional profiling of Botrytis cinerea genes targeting plant cell walls during infections of different hosts. Front. Plant Sci. 2014, 5, 435. [Google Scholar] [CrossRef]
- Have, A.T.; Breuil, W.O.; Wubben, J.P.; Visserb, J.; Van Kan, J.A. Botrytis cinerea Endopolygalacturonase Genes Are Differentially Expressed in Various Plant Tissues. Fungal Genet. Biol. 2001, 33, 97–105. [Google Scholar] [CrossRef]
- Moller, I.; Sørensen, I.; Bernal, A.J.; Blaukopf, C.; Lee, K.; Øbro, J.; Pettolino, F.; Roberts, A.; Mikkelsen, J.D.; Knox, J.P.; et al. High-throughput mapping of cell-wall polymers within and between plants using novel microarrays. Plant J. 2007, 50, 1118–1128. [Google Scholar] [CrossRef] [PubMed]
- Roberts, A.W.; Roberts, E.M.; Haigler, C.H. Moss cell walls: Structure and biosynthesis. Front. Plant Sci. 2012, 3, 166. [Google Scholar] [CrossRef] [PubMed]
- Zhang, L.; van Kan, J.A.L. Botrytis cinerea mutants deficient in D-galacturonic acid catabolism have a perturbed virulence on Nicotiana benthamiana and Arabidopsis; but not on tomato. Mol. Plant Pathol. 2013, 14, 19–29. [Google Scholar] [CrossRef] [PubMed]
- Nafisi, M.; Stranne, M.; Zhang, L.; Van Kan, J.A.L.; Sakuragi, Y. The Endo-Arabinanase BcAra1 Is a Novel Host-Specific Virulence Factor of the Necrotic Fungal Phytopathogen Botrytis cinerea. Mol. Plant Microbe Interact. 2014, 27, 781–792. [Google Scholar] [CrossRef] [PubMed]
- Lyon, G.D.; Goodman, B.A.; Williamson, B. Botrytis cinerea Perturbs Redox Processes as an Attack Strategy in Plants. In Botrytis: Biology, Pathology and Control; Springer: Dordrecht, The Netherlands, 2007; pp. 119–141. [Google Scholar]
- González-Fernández, R.; Aloria, K.; Valero-Galván, J.; Redondo, I.; Arizmendi, J.M.; Jorrín-Novo, J.V. Proteomic analysis of mycelium and secretome of different Botrytis cinerea wild-type strains. J. Proteom. 2014, 97, 195–221. [Google Scholar] [CrossRef]
- Pandey, V.; Singh, M.; Pandey, D.; Kumar, A. Integrated proteomics, genomics, metabolomics approaches reveal oxalic acid as pathogenicity factor in Tilletia indica inciting Karnal bunt disease of wheat. Sci. Rep. 2018, 8, 1–14. [Google Scholar] [CrossRef]
- Guyon, K.; Balagué, C.; Roby, D.; Raffaele, S. Secretome analysis reveals effector candidates associated with broad host range necrotrophy in the fungal plant pathogen Sclerotinia sclerotiorum. BMC Genom. 2014, 15, 1–19. [Google Scholar] [CrossRef]
- Seifbarghi, S.; Borhan, M.H.; Wei, Y.; Coutu, C.; Robinson, S.J.; Hegedus, D.D. Changes in the Sclerotinia sclerotiorum transcriptome during infection of Brassica napus. BMC Genom. 2017, 18, 1–37. [Google Scholar] [CrossRef]
- Viaud, M.; Brunet-Simon, A.; Brygoo, Y.; Pradier, J.-M.; Levis, C. Cyclophilin A and calcineurin functions investigated by gene inactivation, cyclosporin A inhibition and cDNA arrays approaches in the phytopathogenic fungus Botrytis cinerea. Mol. Microbiol. 2003, 50, 1451–1465. [Google Scholar] [CrossRef]
- Have, A.T.; Espino, J.J.; Dekkers, E.; Van Sluyter, S.C.; Brito, N.; Kay, J.; González, C.; Van Kan, J.A. The Botrytis cinerea aspartic proteinase family. Fungal Genet. Biol. 2010, 47, 53–65. [Google Scholar] [CrossRef]
- Denton-Giles, M.; McCarthy, H.; Sehrish, T.; Dijkwel, Y.; Mesarich, C.H.; Bradshaw, R.E.; Cox, M.P.; Dijkwel, P.P. Conservation and expansion of a necrosis-inducing small secreted protein family from host-variable phytopathogens of the Sclerotiniaceae. Mol. Plant Pathol. 2020, 21, 512–526. [Google Scholar] [CrossRef] [PubMed]
- Pennington, H.G.; Jones, R.; Kwon, S.; Bonciani, G.; Thieron, H.; Chandler, T.; Luong, P.; Morgan, S.N.; Przydacz, M.; Bozkurt, T.; et al. The fungal ribonuclease-like effector protein CSEP0064/BEC1054 represses plant immunity and interferes with degradation of host ribosomal RNA. PLoS Pathog. 2019, 15, e1007620. [Google Scholar] [CrossRef] [PubMed]
- Boller, T.; Felix, G. A Renaissance of Elicitors: Perception of Microbe-Associated Molecular Patterns and Danger Signals by Pattern-Recognition Receptors. Annu. Rev. Plant Biol. 2009, 60, 379–406. [Google Scholar] [CrossRef] [PubMed]
- Zhang, L.; Kars, I.; Essenstam, B.; Liebrand, T.W.; Wagemakers, L.; Elberse, J.; Tagkalaki, P.; Tjoitang, D.; Ackerveken, G.V.D.; Van Kan, J.A. Fungal Endopolygalacturonases Are Recognized as Microbe-Associated Molecular Patterns by the Arabidopsis Receptor-Like Protein RESPONSIVENESS TO BOTRYTIS POLYGALACTURONASES1. Plant Physiol. 2014, 164, 352–364. [Google Scholar] [CrossRef]
- Lionetti, V.; Raiola, A.; Camardella, L.; Giovane, A.; Obel, N.; Pauly, M.; Favaron, F.; Cervone, F.; Bellincampi, D. Overexpression of Pectin Methylesterase Inhibitors in Arabidopsis Restricts Fungal Infection by Botrytis cinerea. Plant Physiol. 2007, 143, 1871–1880. [Google Scholar] [CrossRef]
- Sbaghi, M.; Jeandet, P.; Bessis, R.; Leroux, P. Degradation of stilbene-type phytoalexins in relation to the pathogenicity of Botrytis cinerea to grapevines. Plant Pathol. 1996, 45, 139–144. [Google Scholar] [CrossRef]
- Quidde, T.; Osbourn, A.; Tudzynski, P. Detoxification of α-tomatine by Botrytis cinerea. Physiol. Mol. Plant Pathol. 1998, 52, 151–165. [Google Scholar] [CrossRef]
- El Oirdi, M.; Trapani, A.; Bouarab, K. The nature of tobacco resistance against Botrytis cinerea depends on the infection structures of the pathogen. Environ. Microbiol. 2010, 12, 239–253. [Google Scholar] [CrossRef]
- Pedras, M.S.C.; Hossain, S.; Snitynsky, R.B. Detoxification of cruciferous phytoalexins in Botrytis cinerea: Spontaneous dimerization of a camalexin metabolite. Phytochemistry 2011, 72, 199–206. [Google Scholar] [CrossRef]
- VanEtten, H.; Temporini, E.; Wasmann, C. Phytoalexin (and phytoanticipin) tolerance as a virulence trait: Why is it not required by all pathogens? Physiol. Mol. Plant Pathol. 2001, 59, 83–93. [Google Scholar] [CrossRef]
- Vela-Corcía, D.; Srivastava, D.A.; Dafa-Berger, A.; Rotem, N.; Barda, O.; Levy, M. MFS transporter from Botrytis cinerea provides tolerance to glucosinolate-breakdown products and is required for pathogenicity. Nat. Commun. 2019, 10, 1–11. [Google Scholar] [CrossRef] [PubMed]
- Stefanato, F.L.; Abou-Mansour, E.; Buchala, A.; Kretschmer, M.; Mosbach, A.; Hahn, M.; Bochet, C.G.; Métraux, J.-P.; Schoonbeek, H.-J. The ABC transporter BcatrB from Botrytis cinerea exports camalexin and is a virulence factor on Arabidopsis thaliana. Plant J. 2009, 58, 499–510. [Google Scholar] [CrossRef] [PubMed]
- Hayashi, K.; Schoonbeek, H.-J.; De Waard, M.A. Bcmfs1, a Novel Major Facilitator Superfamily Transporter from Botrytis cinerea, Provides Tolerance towards the Natural Toxic Compounds Camptothecin and Cercosporin and towards Fungicides. Appl. Environ. Microbiol. 2002, 68, 4996–5004. [Google Scholar] [CrossRef] [PubMed]
- Ponce De León, I.; Montesano, M. Adaptation Mechanisms in the Evolution of Moss Defenses to Microbes. Front. Plant Sci. 2017, 8, 366. [Google Scholar] [CrossRef]


Publisher’s Note: MDPI stays neutral with regard to jurisdictional claims in published maps and institutional affiliations. |
© 2020 by the authors. Licensee MDPI, Basel, Switzerland. This article is an open access article distributed under the terms and conditions of the Creative Commons Attribution (CC BY) license (http://creativecommons.org/licenses/by/4.0/).
Share and Cite
Reboledo, G.; Agorio, A.; Vignale, L.; Batista-García, R.A.; Ponce De León, I. Botrytis cinerea Transcriptome during the Infection Process of the Bryophyte Physcomitrium patens and Angiosperms. J. Fungi 2021, 7, 11. https://doi.org/10.3390/jof7010011
Reboledo G, Agorio A, Vignale L, Batista-García RA, Ponce De León I. Botrytis cinerea Transcriptome during the Infection Process of the Bryophyte Physcomitrium patens and Angiosperms. Journal of Fungi. 2021; 7(1):11. https://doi.org/10.3390/jof7010011
Chicago/Turabian StyleReboledo, Guillermo, Astrid Agorio, Lucía Vignale, Ramón Alberto Batista-García, and Inés Ponce De León. 2021. "Botrytis cinerea Transcriptome during the Infection Process of the Bryophyte Physcomitrium patens and Angiosperms" Journal of Fungi 7, no. 1: 11. https://doi.org/10.3390/jof7010011
APA StyleReboledo, G., Agorio, A., Vignale, L., Batista-García, R. A., & Ponce De León, I. (2021). Botrytis cinerea Transcriptome during the Infection Process of the Bryophyte Physcomitrium patens and Angiosperms. Journal of Fungi, 7(1), 11. https://doi.org/10.3390/jof7010011