Space and Vine Cultivar Interact to Determine the Arbuscular Mycorrhizal Fungal Community Composition

 , ,
, ,  ,
,
Abstract
1. Introduction
- (i)
- Quantify the diversity of AM fungi associated with the vineyard, both those directly colonizing roots and those present at the agroecosystem level (surrounding soil);
- (ii)
- Investigate the AM fungal community composition associated with each vineyard cultivar;
- (iii)
- Quantify the relative importance of environmental/spatial factors in the distribution of AM fungal communities.
2. Materials and Methods
2.1. Sampling and DNA Extraction
2.2. DNA Amplification and Sequencing
2.3. Bioinformatic Analyses
2.4. Statistical Analyses
3. Results
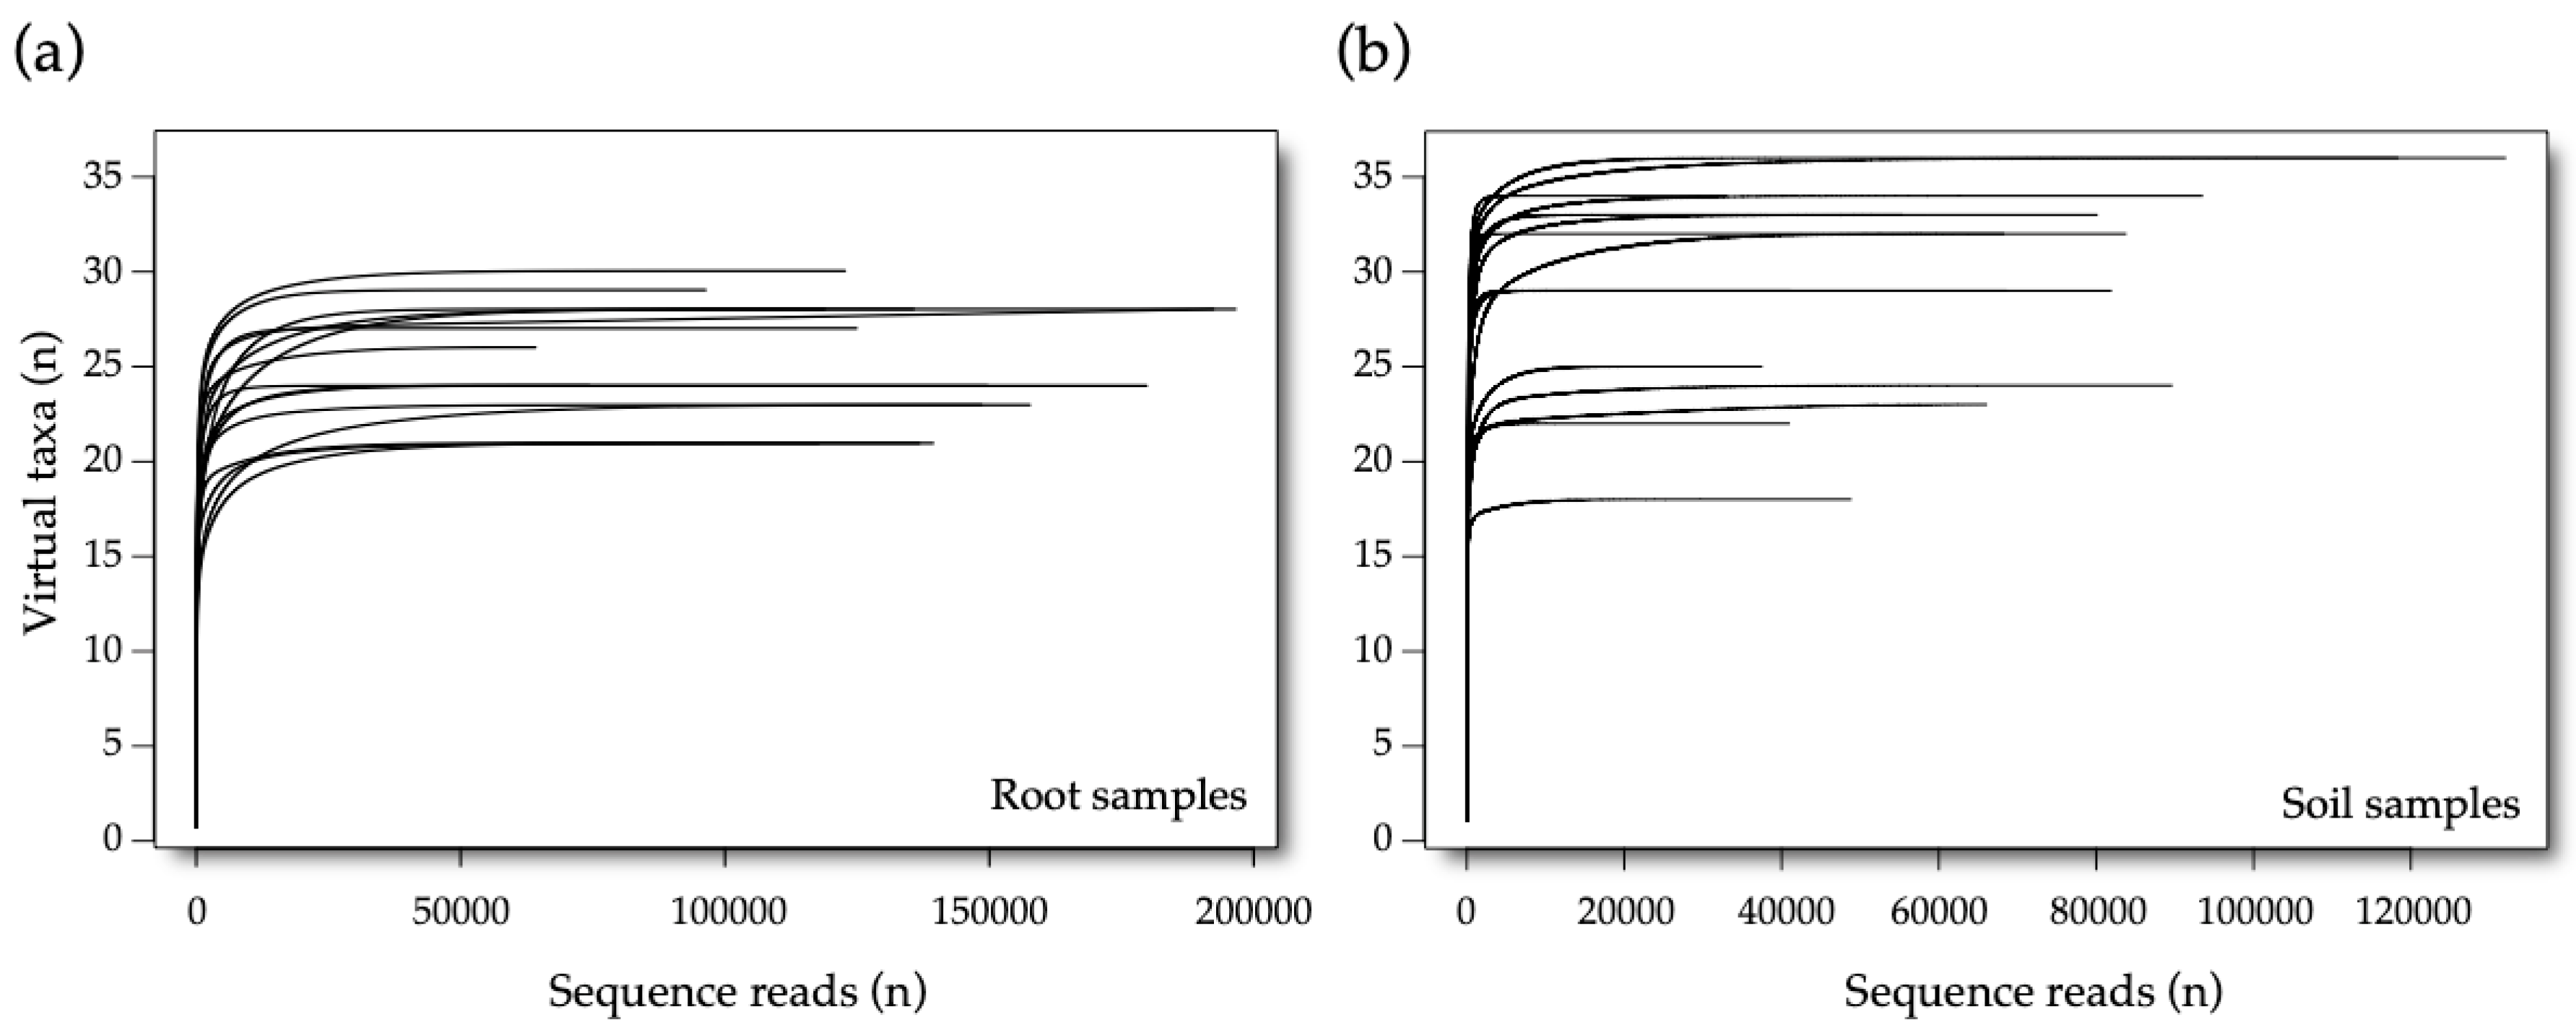
3.1. Sequencing Data
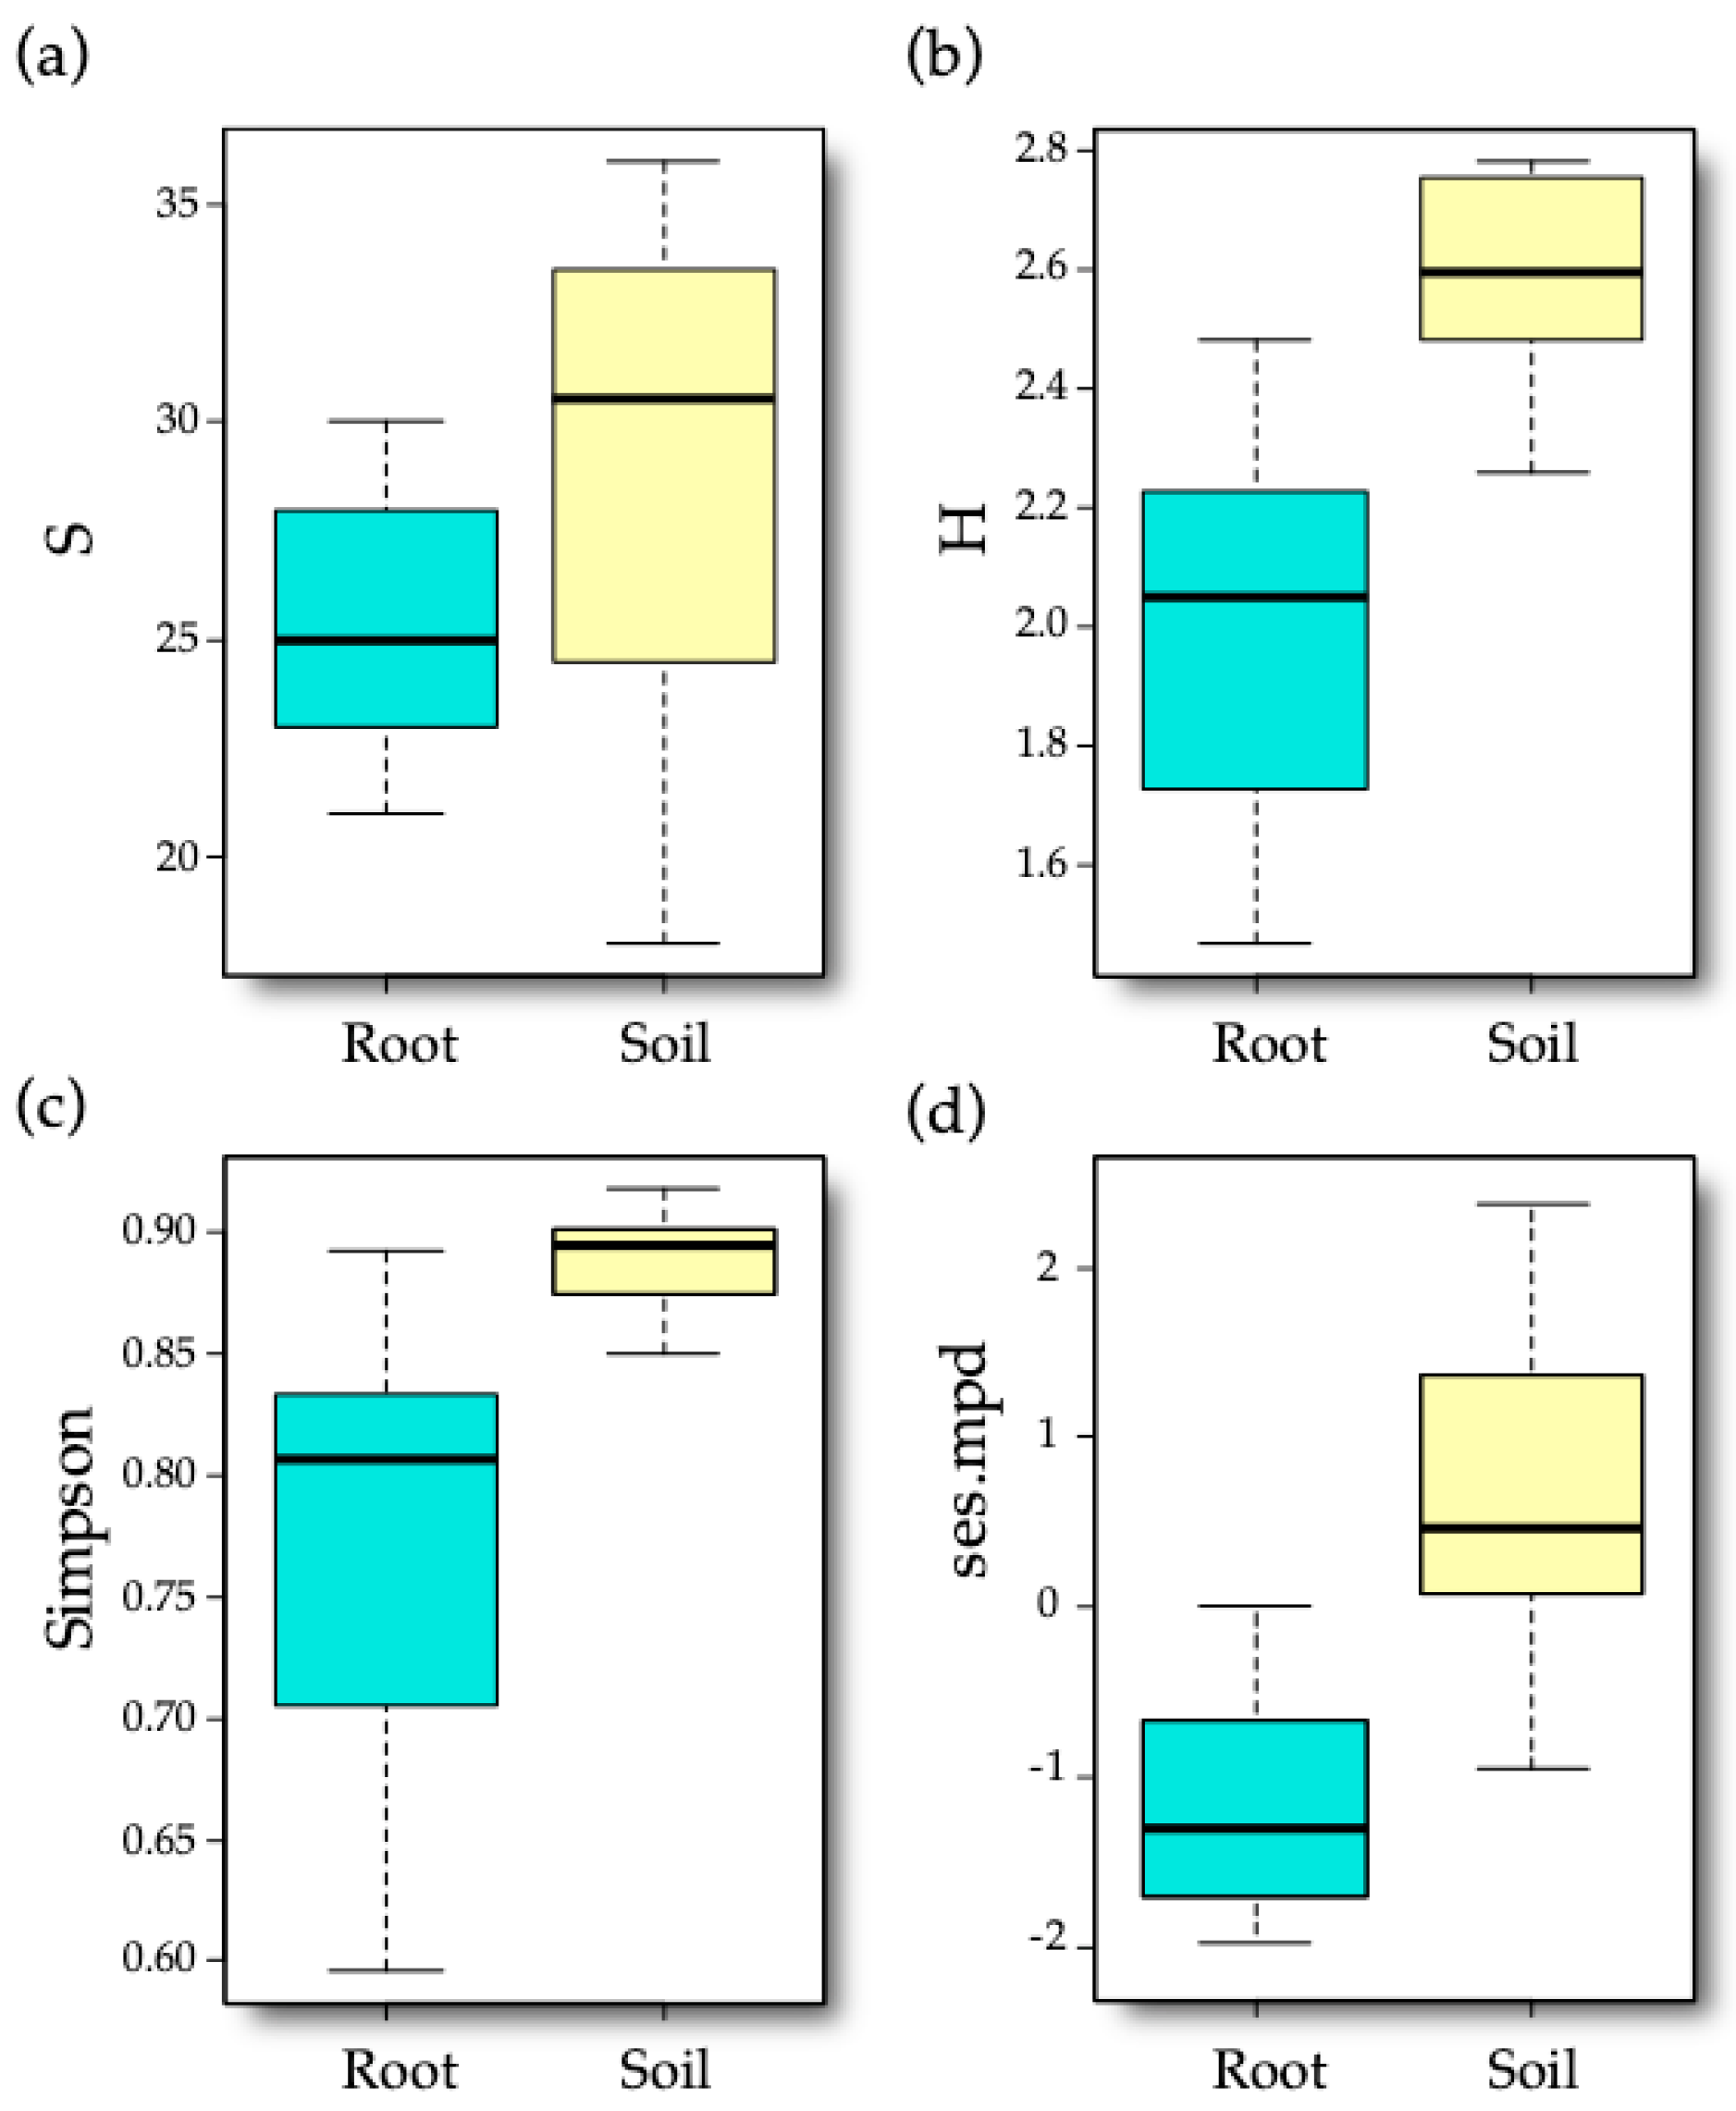
3.2. AM Fungal Diversity
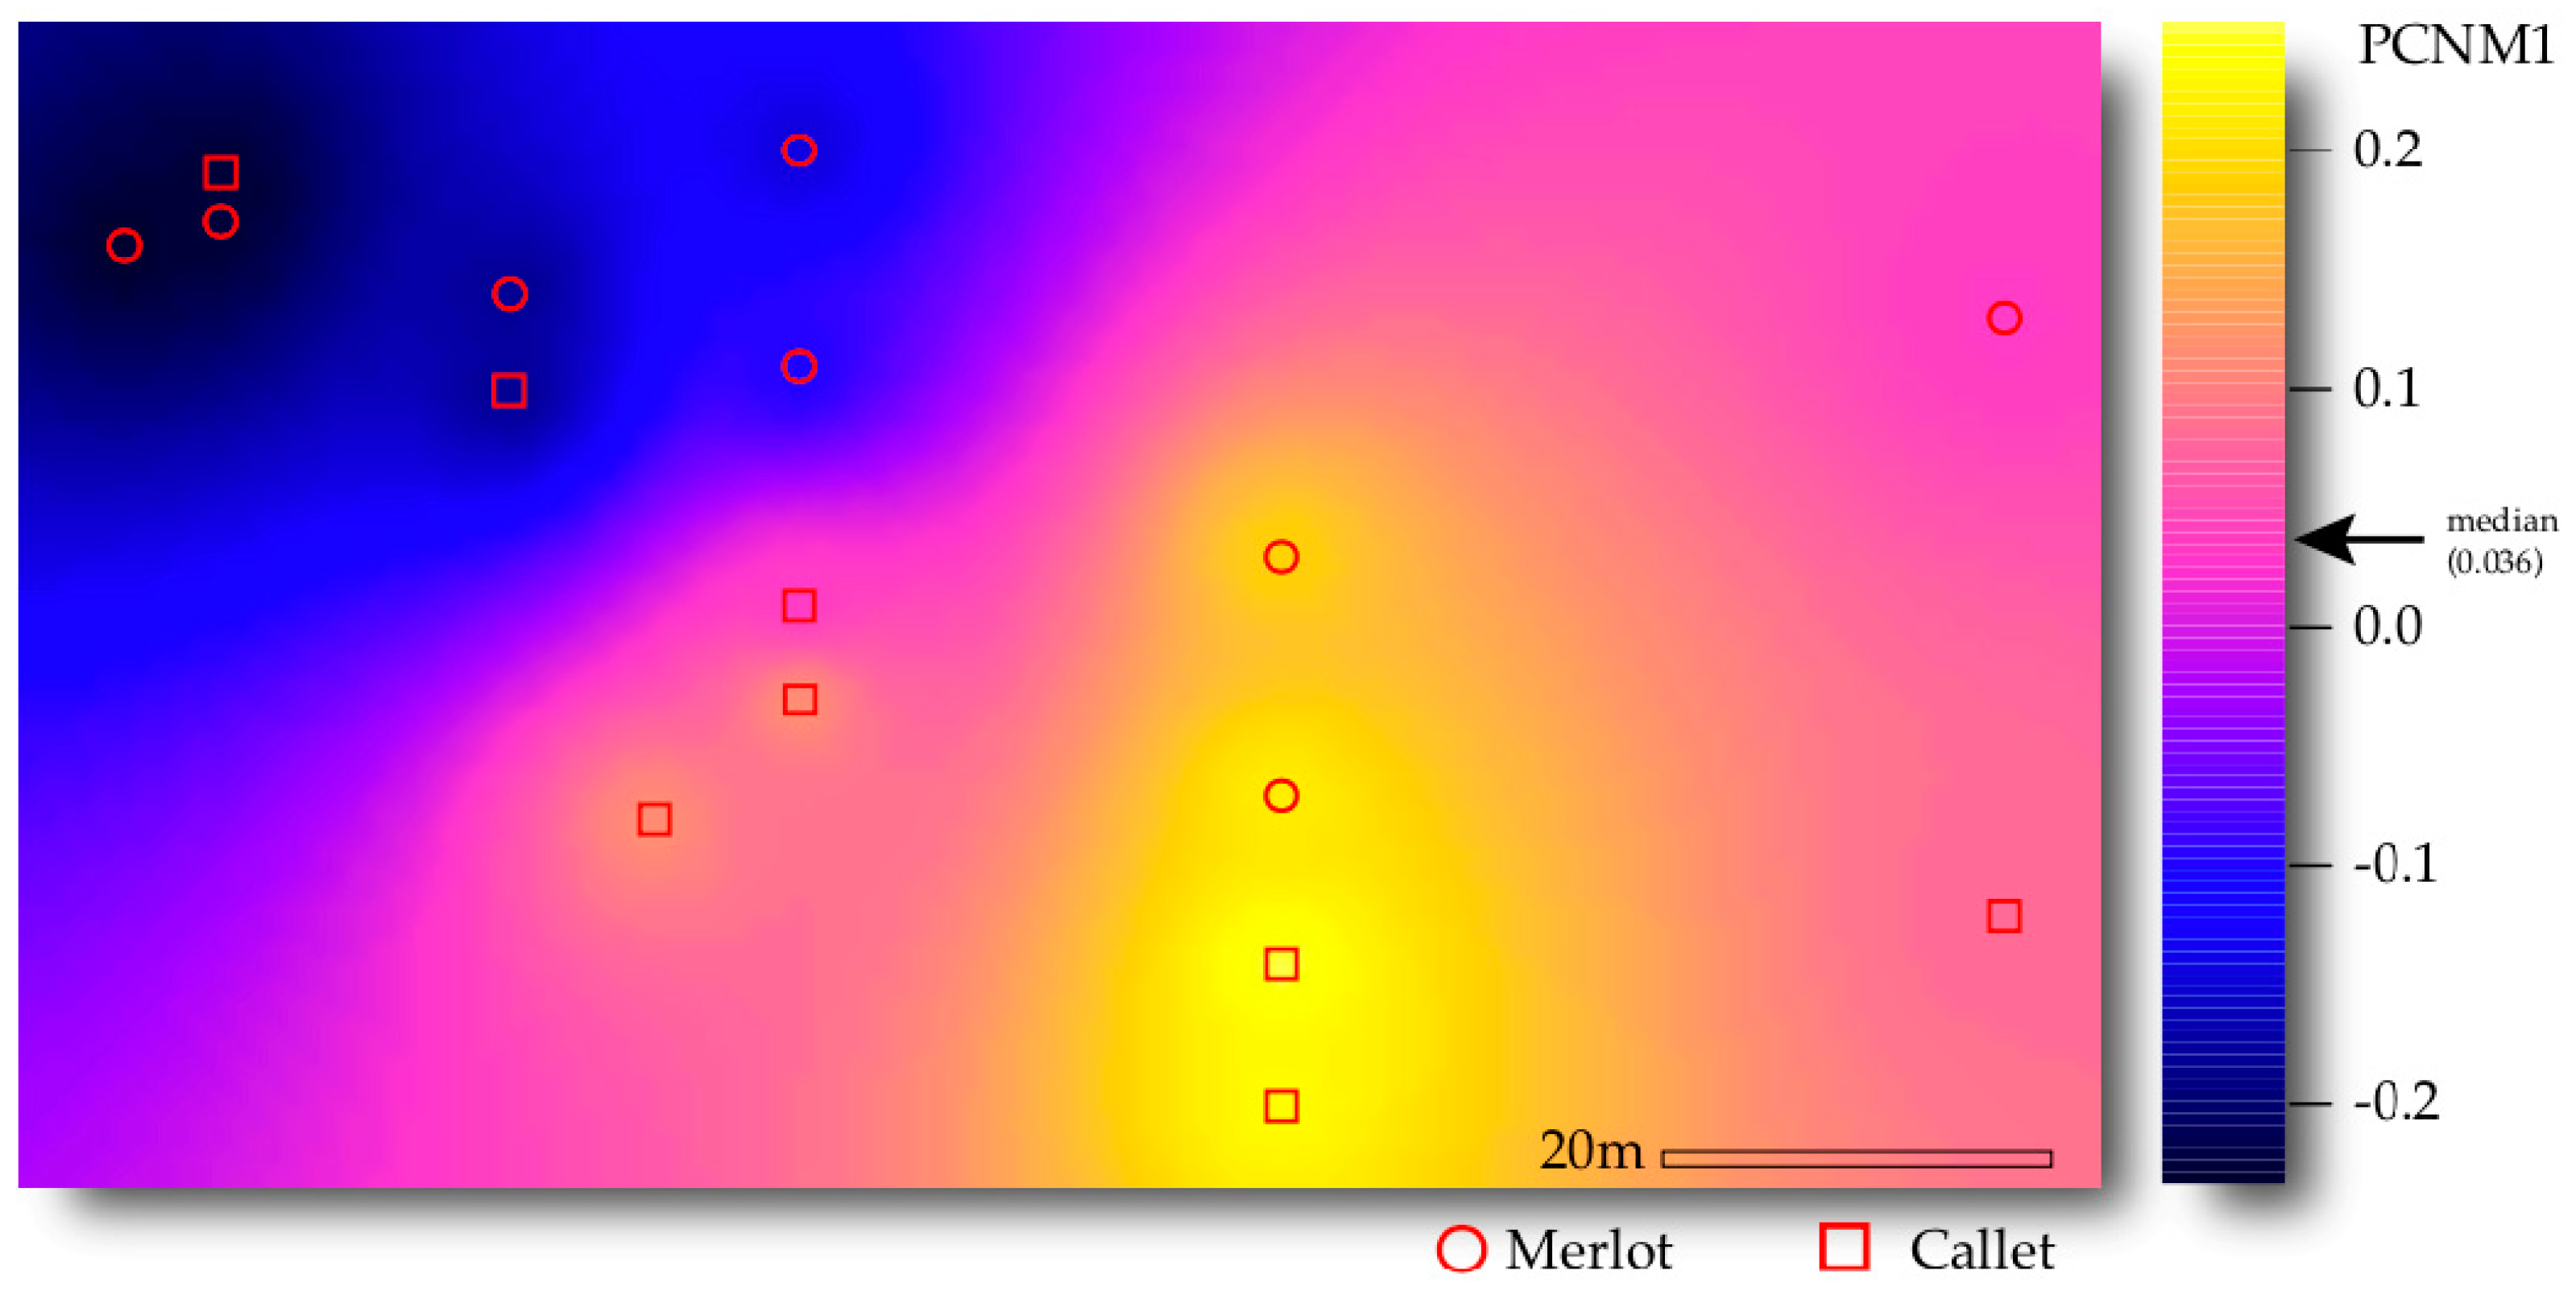
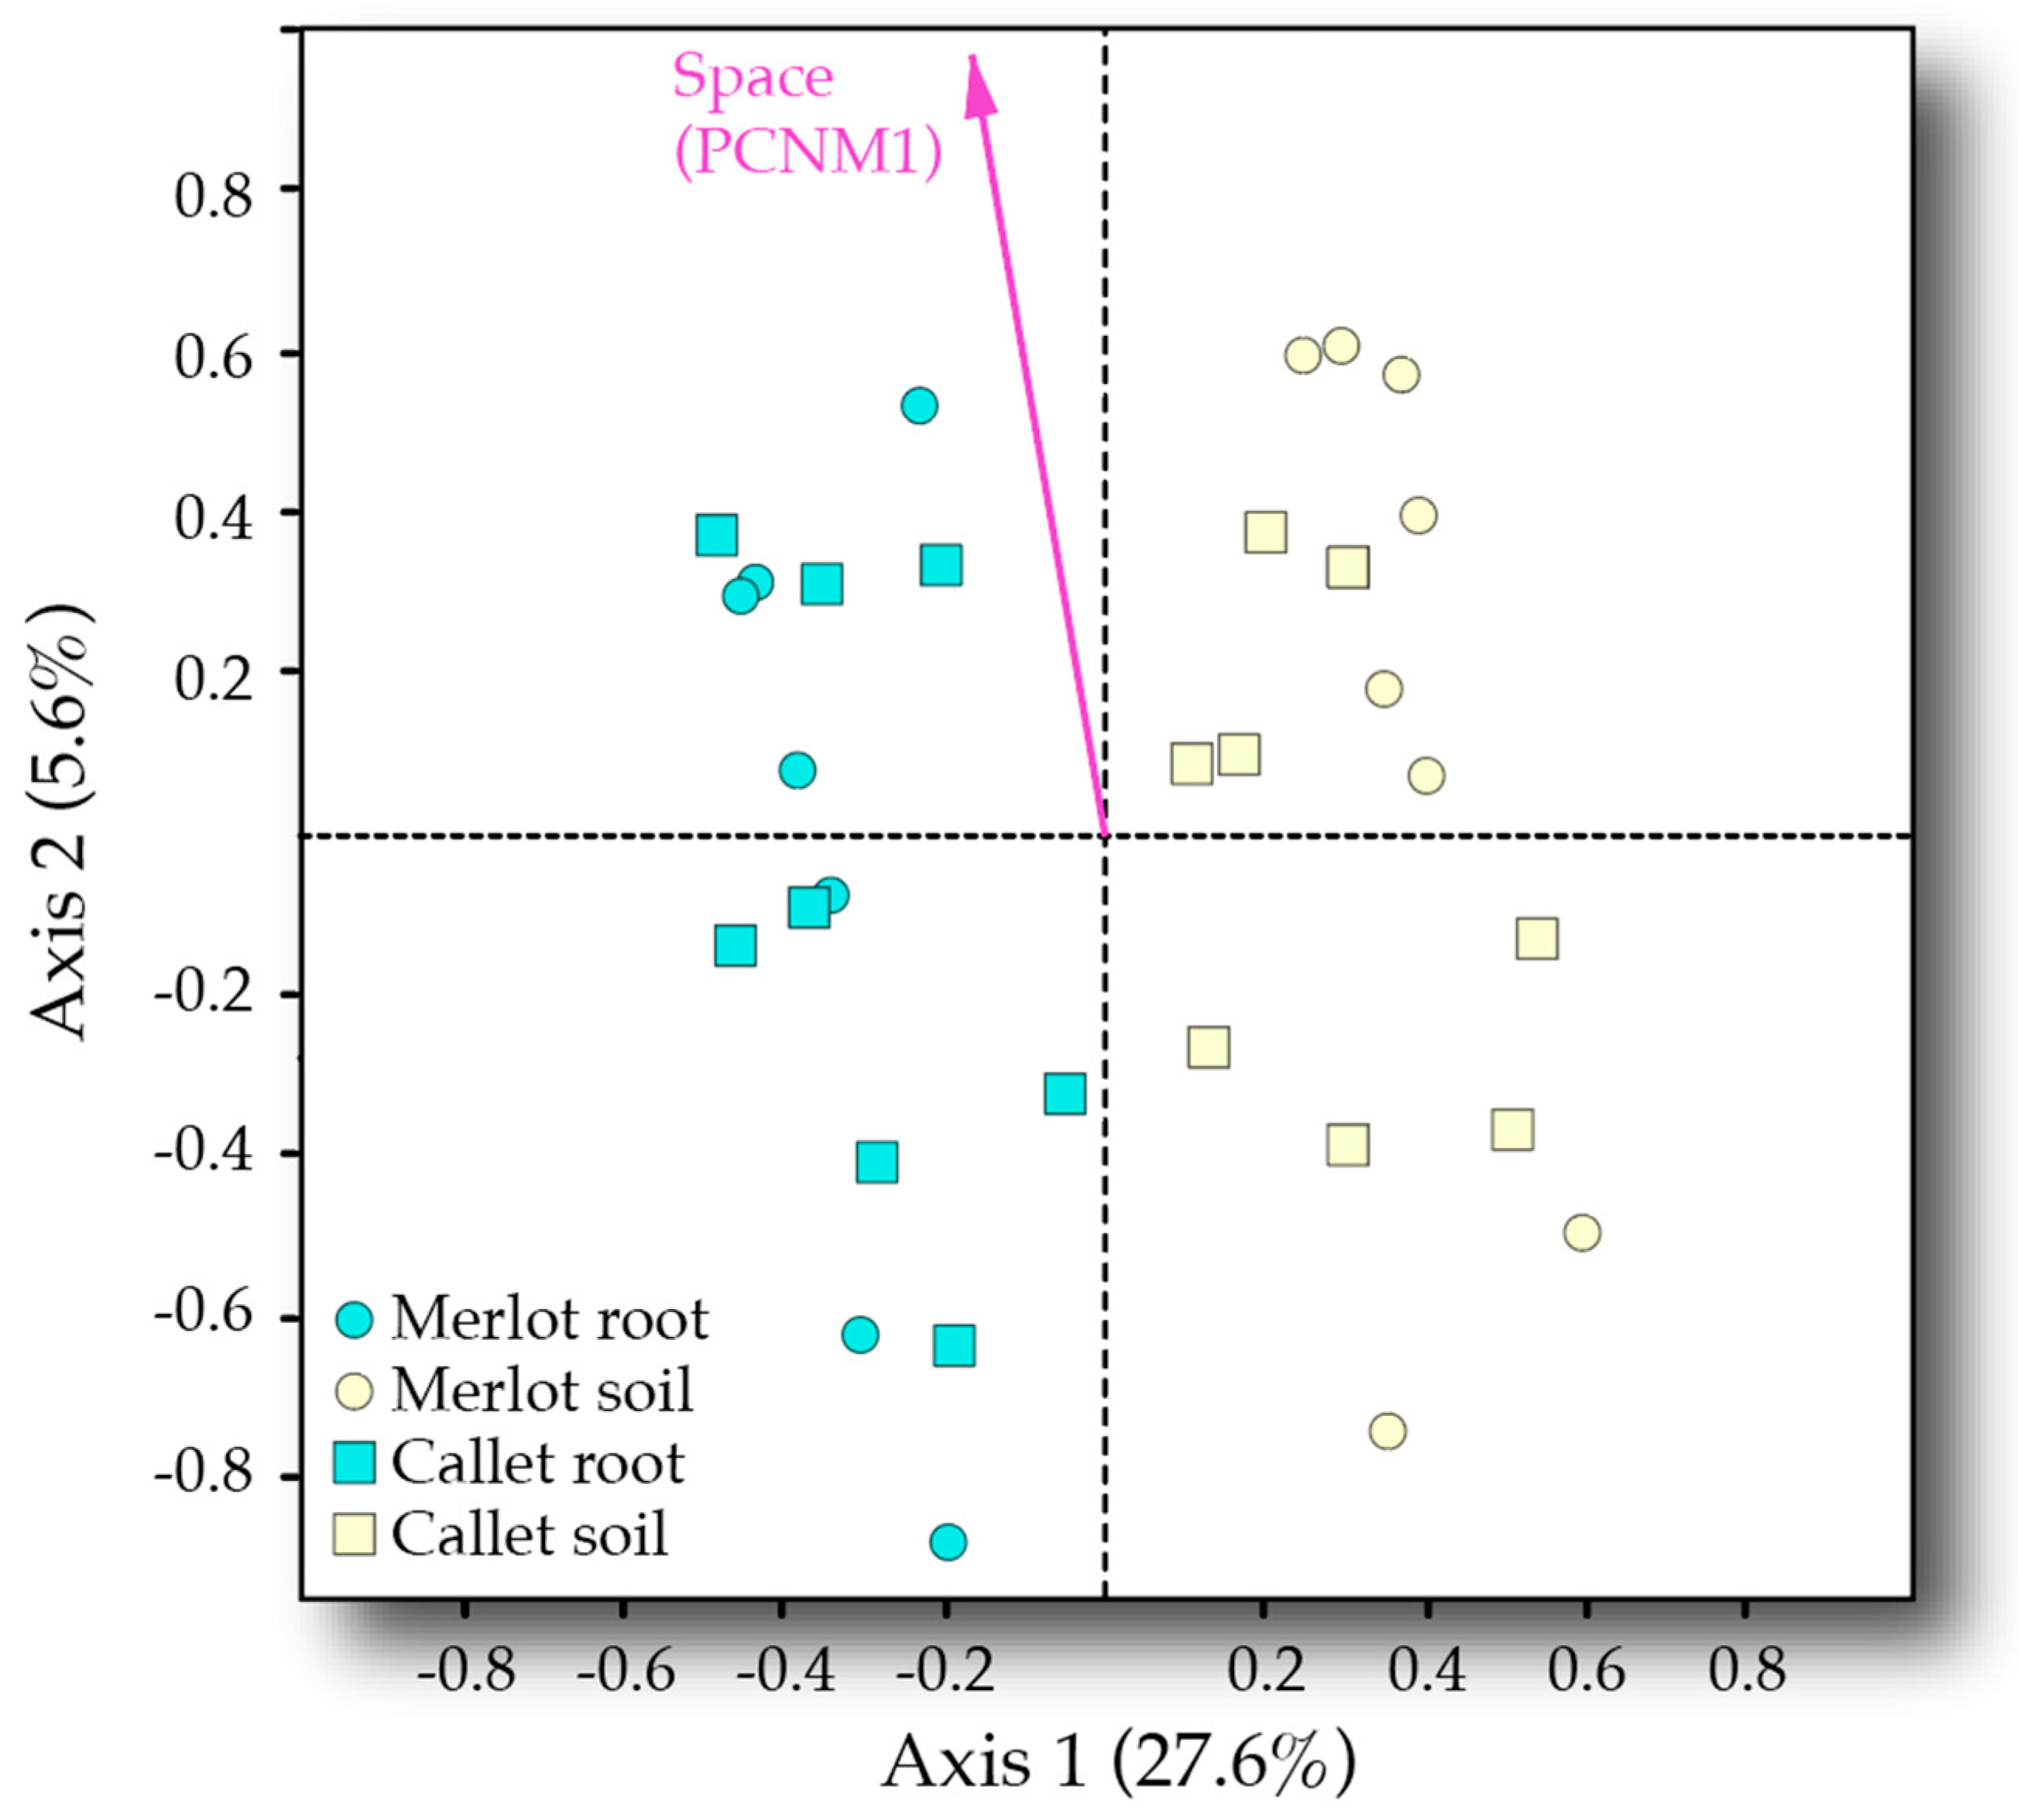
3.3. Drivers of AM Fungal Community Composition
4. Discussion
4.1. Diversity of Vineyard Associated AMF
4.2. Effect of Sample Type
4.3. Interactive Effect of Cultivar and Space
5. Conclusions
Supplementary Materials
Author Contributions
Funding
Acknowledgments
Conflicts of Interest
Appendix A


| Family | All Samples | Soil Samples | Root Samples |
|---|---|---|---|
| Glomeraceae | 88.94 | 72.89 | 97.43 |
| Claroideoglomeraceae | 6.86 | 18.43 | 0.74 |
| Paraglomeraceae | 2.83 | 5.09 | 1.64 |
| Diversisporaceae | 1.01 | 2.58 | 0.17 |
| Archaeosporaceae | 0.33 | 0.94 | <0.01 |
| Acaulosporaceae | 0.02 | 0.04 | 0.00 |
| Gigasporaceae | <0.01 | 0.00 | <0.01 |
| Ambisporaceae | <0.01 | <0.01 | <0.01 |
| Spatial Axis | Df | SS | MS | F | R2 | p |
|---|---|---|---|---|---|---|
| PCNM1 | 1 | 0.776 | 0.776 | 1.996 | 0.061 | 0.048 |
| PCNM2 | 1 | 0.324 | 0.324 | 0.833 | 0.026 | 0.589 |
| PCNM3 | 1 | 0.487 | 0.487 | 1.254 | 0.039 | 0.205 |
| PCNM4 | 1 | 0.576 | 0.576 | 1.482 | 0.046 | 0.144 |
| PCNM5 | 1 | 0.368 | 0.368 | 0.946 | 0.029 | 0.438 |
| PCNM6 | 1 | 0.324 | 0.324 | 0.834 | 0.026 | 0.559 |
| PCNM7 | 1 | 0.443 | 0.443 | 1.141 | 0.035 | 0.282 |
| PCNM8 | 1 | 0.330 | 0.330 | 0.849 | 0.026 | 0.584 |
| PCNM9 | 1 | 0.470 | 0.470 | 1.210 | 0.037 | 0.226 |
| Residuals | 22 | 8.550 | 0.389 | 0.676 | ||
| Total | 31 | 12.648 | 1.000 |
| Factor Level | Virtual Taxa | Family | Indicator Index | p |
|---|---|---|---|---|
| Root | VTX113 | Glomeraceae | 0.892 | 0.001 |
| VTX069 | Glomeraceae | 0.888 | 0.001 | |
| VTX214 | Glomeraceae | 0.780 | 0.007 | |
| VTX114 | Glomeraceae | 0.671 | 0.004 | |
| VTX100 | Glomeraceae | 0.566 | 0.023 | |
| Soil | VTX005 | Archaeosporaceae | 0.375 | 0.025 |
| VTX245 | Archaeosporaceae | 0.313 | 0.043 | |
| VTX338 | Archaeosporaceae | 0.436 | 0.006 | |
| VTX055 | Claroideoglomeraceae | 0.896 | 0.002 | |
| VTX056 | Claroideoglomeraceae | 0.852 | 0.001 | |
| VTX193 | Claroideoglomeraceae | 0.749 | 0.001 | |
| VTX054 | Diversisporaceae | 0.438 | 0.006 | |
| VTX356 | Diversisporaceae | 0.858 | 0.001 | |
| VTX065 | Glomeraceae | 0.500 | 0.014 | |
| VTX154 | Glomeraceae | 0.434 | 0.014 | |
| VTX153 | Glomeraceae | 0.781 | 0.001 | |
| VTX392 | Glomeraceae | 0.871 | 0.002 | |
| VTX293 | Glomeraceae | 0.646 | 0.039 | |
| VTX419 | Glomeraceae | 0.776 | 0.002 | |
| VTX191 | Glomeraceae | 0.638 | 0.016 | |
| VTX001a | Paraglomeraceae | 0.625 | 0.001 | |
| Callet | VTX100 | Claroideoglomeraceae | 0.563 | 0.021 |
| VTX072 | Glomeraceae | 0.721 | 0.010 | |
| Merlot | VTX055 | Glomeraceae | 0.723 | 0.047 |
| VTX114 | Glomeraceae | 0.598 | 0.012 |
References
- Van Der Heijden, M.G.A.; Martin, F.M.; Selosse, M.-A.; Sanders, I.R. Mycorrhizal ecology and evolution: The past, the present, and the future. New Phytol. 2015, 205, 1406–1423. [Google Scholar] [CrossRef]
- Smith, S.E.; Read, D.J. Mycorrhizal Symbiosis, 3rd ed.; Elsevier Academic Press: New York, NY, USA, 2008; p. 800. [Google Scholar]
- Barea, J.M.; Palenzuela, J.; Cornejo, P.; Sánchez-Castro, I.; Navarro-Fernández, C.M.; Lopéz-García, A.; Estrada, B.; Azcón, R.; Ferrol, N.; Azcón-Aguilar, C. Ecological and functional roles of mycorrhizas in semi-arid ecosystems of Southeast Spain. J. Arid. Environ. 2011, 75, 1292–1301. [Google Scholar] [CrossRef]
- Bona, E.; Cantamessa, S.; Massa, N.; Manassero, P.; Marsano, F.; Copetta, A.; Lingua, G.; D’Agostino, G.; Gamalero, E.; Berta, G. Arbuscular mycorrhizal fungi and plant growth-promoting pseudomonads improve yield, quality and nutritional value of tomato: A field study. Mycorrhiza 2017, 27, 1–11. [Google Scholar] [CrossRef]
- Baslam, M.; Esteban, R.; García-Plazaola, J.I.; Goicoechea, N. Effectiveness of arbuscular mycorrhizal fungi (AMF) for inducing the accumulation of major carotenoids, chlorophylls and tocopherol in green and red leaf lettuces. Appl. Microbiol. Biotechnol. 2012, 97, 3119–3128. [Google Scholar] [CrossRef]
- Todeschini, V.; AitLahmidi, N.; Mazzucco, E.; Marsano, F.; Gosetti, F.; Robotti, E.; Bona, E.; Massa, N.; Bonneau, L.; Marengo, E.; et al. Impact of Beneficial Microorganisms on Strawberry Growth, Fruit Production, Nutritional Quality, and Volatilome. Front. Plant Sci. 2018, 9, 1611. [Google Scholar] [CrossRef]
- Sepp, S.K.; Davison, J.; Jairus, T.; Vasar, M.; Moora, M.; Zobel, M.; Öpik, M. Non-random association patterns in a plant–mycorrhizal fungal network reveal host–symbiont specificity. Mol. Ecol. 2019, 28, 365–378. [Google Scholar] [CrossRef]
- Powell, J.R.; Parrent, J.L.; Hart, M.M.; Klironomos, J.N.; Rillig, M.C.; Maherali, H. Phylogenetic trait conservatism and the evolution of functional trade-offs in arbuscular mycorrhizal fungi. Proc. R. Soc. B Biol. Sci. 2009, 276, 4237–4245. [Google Scholar] [CrossRef]
- Rohyadi, A.; Noviani, R.; Isnaini, M. Responses of Cowpea Genotypes to Arbuscular Mycorrhiza. AGRIVITA J. Agric. Sci. 2017, 39, 288–295. [Google Scholar] [CrossRef][Green Version]
- Bazghaleh, N.; Hamel, C.; Gan, Y.; Tar’An, B.; Knight, J.D. Genotypic variation in the response of chickpea to arbuscular mycorrhizal fungi and non-mycorrhizal fungal endophytes. Can. J. Microbiol. 2018, 64, 265–275. [Google Scholar] [CrossRef]
- Taylor, A.; Pereira, N.; Thomas, B.; Pink, D.A.C.; Jones, J.E.; Bending, G.D. Growth and nutritional responses to arbuscular mycorrhizal fungi are dependent on onion genotype and fungal species. Biol. Fertil. Soils 2015, 51, 801–813. [Google Scholar] [CrossRef]
- Bever, J.D.; Richardson, S.C.; Lawrence, B.M.; Holmes, J.; Watson, M. Preferential allocation to beneficial symbiont with spatial structure maintains mycorrhizal mutualism. Ecol. Lett. 2009, 12, 13–21. [Google Scholar] [CrossRef]
- Kiers, E.T.; Duhamel, M.; Beesetty, Y.; Mensah, J.A.; Franken, O.; Verbruggen, E.; Fellbaum, C.R.; Kowalchuk, G.A.; Hart, M.M.; Bago, A.; et al. Reciprocal Rewards Stabilize Cooperation in the Mycorrhizal Symbiosis. Science 2011, 333, 880–882. [Google Scholar] [CrossRef]
- Mullins, M.G.; Bouquet, A.; Williams, L.E. Biology of the Grapevine; Cambridge University Press: Cambridge, UK, 1992. [Google Scholar]
- Pulvirenti, A.; Giugno, R.; Distefano, R.; Pigola, G.; Mongiovi’, M.; Giudice, G.; Vendramin, V.; Lombardo, A.; Cattonaro, F.; Ferro, A. A knowledge base for Vitis vinifera functional analysis. BMC Syst. Biol. 2015, 9, S5. [Google Scholar] [CrossRef][Green Version]
- FAO. FAOSTAT. 2018. Available online: http://www.fao.org/faostat/en/#home (accessed on 12 October 2020).
- Hannah, L.; Roehrdanz, P.R.; Ikegami, M.; Shepard, A.V.; Shaw, M.R.; Tabor, G.; Zhi, L.; Marquet, P.A.; Hijmans, R.J. Climate change, wine, and conservation. Proc. Natl. Acad. Sci. USA 2013, 110, 6907–6912. [Google Scholar] [CrossRef]
- Cheng, X.; Baumgartner, K. Arbuscular mycorrhizal fungi-mediated nitrogen transfer from vineyard cover crops to grapevines. Biol. Fertil. Soils 2004, 40, 406–412. [Google Scholar] [CrossRef]
- Cheng, X.; Baumgartner, K. Effects of mycorrhizal roots and extraradical hyphae on 15N uptake from vineyard cover crop litter and the soil microbial community. Soil Biol. Biochem. 2006, 38, 2665–2675. [Google Scholar] [CrossRef]
- Brunetto, G.; Rosa, D.J.; Ambrosini, V.G.; Heinzen, J.; Ferreira, P.A.A.; Ceretta, C.A.; Soares, C.R.; Melo, G.W.; Soriani, H.H.; Nicoloso, F.T.; et al. Use of phosphorus fertilization and mycorrhization as strategies for reducing copper toxicity in young grapevines. Sci. Hortic. 2019, 248, 176–183. [Google Scholar] [CrossRef]
- Nikolaou, N.; Angelopoulos, K.; Karagiannidis, N. Effects of drought stress on mycorrhizal and non-mycorrhizal cabernet sauvignon grapevine, grafted onto various rootstocks. Exp. Agric. 2003, 39, 241–252. [Google Scholar] [CrossRef]
- Nogales, A.; Camprubi, A.; Estaun, V.; Marfa, V.; Calvet, C. In vitro interaction studies between Glomus intraradices and Armillaria mellea in vines. Span. J. Agric. Res. 2010, 8, 62. [Google Scholar] [CrossRef]
- Holland, T.; Bowen, P.; Kokkoris, V.; Urbez-Torres, J.R.; Hart, M.M. Does Inoculation with Arbuscular Mycorrhizal Fungi Reduce Trunk Disease in Grapevine Rootstocks? Horticulturae 2019, 5, 61. [Google Scholar] [CrossRef]
- Torres, N.; Hilbert, G.; Antolín, M.C.; Goicoechea, N. Aminoacids and Flavonoids Profiling in Tempranillo Berries Can Be Modulated by the Arbuscular Mycorrhizal Fungi. Plants 2019, 8, 400. [Google Scholar] [CrossRef] [PubMed]
- Antolín, M.C.; Izurdiaga, D.; Urmeneta, L.; Pascual, I.; Irigoyen, J.J.; Goicoechea, N. Dissimilar responses of ancient grapevines recovered in Navarra (Spain) to arbuscular mycorrhizal symbiosis in terms of berry quality. Agronomy 2020, 10, 473. [Google Scholar] [CrossRef]
- Likar, M.; Hančević, K.; Radić, T.; Regvar, M. Distribution and diversity of arbuscular mycorrhizal fungi in grapevines from production vineyards along the eastern Adriatic coast. Mycorrhiza 2013, 23, 209–219. [Google Scholar] [CrossRef] [PubMed]
- Holland, T.C.; Bowen, P.; Bogdanoff, C.; Hart, M.M. How distinct are arbuscular mycorrhizal fungal communities associating with grapevines? Biol. Fertil. Soils 2014, 50, 667–674. [Google Scholar] [CrossRef]
- Schreiner, R.P.; Mihara, K.L. The diversity of arbuscular mycorrhizal fungi amplified from grapevine roots (Vitis vinifera L.) in Oregon vineyards is seasonally stable and influenced by soil and vine age. Mycologia 2009, 101, 599–611. [Google Scholar] [CrossRef]
- Lumini, E.; Orgiazzi, A.; Borriello, R.; Bonfante, P.; Bianciotto, V. Disclosing arbuscular mycorrhizal fungal biodiversity in soil through a land-use gradient using a pyrosequencing approach. Environ. Microbiol. 2010, 12, 2165–2179. [Google Scholar] [CrossRef]
- Balestrini, R.; Magurno, F.; Walker, C.; Lumini, E.; Bianciotto, V. Cohorts of arbuscular mycorrhizal fungi (AMF) in Vitis vinifera, a typical Mediterranean fruit crop. Environ. Microbiol. Rep. 2010, 2, 594–604. [Google Scholar] [CrossRef]
- Vukicevich, E.; Lowery, D.T.; Eissenstat, D.; Hart, M. Changes in arbuscular mycorrhizal fungi between young and old Vitis roots. Symbiosis 2019, 78, 43–44. [Google Scholar] [CrossRef]
- Schreiner, R.P. Depth structures the community of arbuscular mycorrhizal fungi amplified from grapevine (Vitis vinifera L.) roots. Mycorrhiza 2020, 30, 149–160. [Google Scholar] [CrossRef]
- Bota, J.; Flexas, J.; Medrano, H. Genetic variability of photosynthesis and water use in Balearic grapevine cultivars. Ann. Appl. Biol. 2001, 138, 353–361. [Google Scholar] [CrossRef]
- Bota, J.; Tomás, M.; Flexas, J.; Medrano, H.; Escalona, J.M. Differences among grapevine cultivars in their stomatal behavior and water use efficiency under progressive water stress. Agric. Water Manag. 2016, 164, 91–99. [Google Scholar] [CrossRef]
- Florez-Sarasa, I.; Clemente-Moreno, M.J.; Cifre, J.; Capó, M.; Llompart, M.; Fernie, A.R.; Bota, J. Differences in Metabolic and Physiological Responses between Local and Widespread Grapevine Cultivars under Water Deficit Stress. Agronomy 2020, 10, 1052. [Google Scholar] [CrossRef]
- IUSS Working Group WRB. World Reference Base for Soil Resources 2014, update 2015. In International Soil Classification System for Naming Soils and Creating Legends for Soil Maps; World Soil Resources Reports No. 106; FAO: Rome, Italy, 2015. [Google Scholar]
- Simon, L.; Lalonde, M.; Bruns, T.D. Specifi amplification of 18S fungal ribosomal genes from vesicular-arbuscular endomycorrhizal fungi colonizing roots. Appl. Environ. Microbiol. 1992, 58, 291–295. [Google Scholar] [CrossRef] [PubMed]
- Lee, J.; Lee, S.; Young, J.P.W. Improved PCR primers for the detection and identification of arbuscular mycorrhizal fungi. FEMS Microbiol. Ecol. 2008, 65, 339–349. [Google Scholar] [CrossRef]
- Callahan, B.J.; McMurdie, P.J.; Rosen, M.J.; Han, A.W.; Johnson, A.J.A.; Holmes, S.P. DADA2: High-resolution sample inference from Illumina amplicon data. Nat. Methods 2016, 13, 581–583. [Google Scholar] [CrossRef]
- Quast, C.; Pruesse, E.; Yilmaz, P.; Gerken, J.; Schweer, T.; Yarza, P.; Peplies, J.; Glöckner, F.O. The silva ribosomal rna gene database project: Improved data processing and web-based tools. Nucleic Acids Res. 2013, 41, D590–D596. [Google Scholar] [CrossRef]
- Wang, Q.; Garrity, G.M.; Tiedje, J.M.; Cole, J.R. Naïve Bayesian Classifier for Rapid Assignment of rRNA Sequences into the New Bacterial Taxonomy. Appl. Environ. Microbiol. 2007, 73, 5261–5267. [Google Scholar] [CrossRef]
- Öpik, M.; Vanatoa, A.; Moora, M.; Davison, J.; Kalwij, J.M.; Reier, Ü.; Zobel, M. The online database MaarjAM reveals global and ecosystemic distribution patterns in arbuscular mycorrhizal fungi (Glomeromycota). New Phytol. 2010, 188, 223–241. [Google Scholar] [CrossRef]
- Frøslev, T.G.; Kjøller, R.; Bruun, H.H.; Ejrnæs, R.; Brunbjerg, A.K.; Pietroni, C.; Hansen, A.J. Algorithm for post-clustering curation of DNA amplicon data yields reliable biodiversity estimates. Nat. Commun. 2017, 8, 1–11. [Google Scholar] [CrossRef]
- Katoh, K.; Rozewicki, J.; Yamada, K.D. MAFFT online service: Multiple sequence alignment, interactive sequence choice and visualization. Briefings Bioinform. 2019, 20, 1160–1166. [Google Scholar] [CrossRef]
- Rognes, T.; Flouri, T.; Nichols, B.; Quince, C.; Mahé, F. VSEARCH: A versatile open source tool for metagenomics. PeerJ 2016, 4, e2584. [Google Scholar] [CrossRef]
- Schloss, P.D.; Westcott, S.L.; Ryabin, T.; Hall, J.R.; Hartmann, M.; Hollister, E.B.; Lesniewski, R.A.; Oakley, B.B.; Parks, D.H.; Robinson, C.J.; et al. Introducing mothur: Open-Source, Platform-Independent, Community-Supported Software for Describing and Comparing Microbial Communities. Appl. Environ. Microbiol. 2009, 75, 7537–7541. [Google Scholar] [CrossRef]
- Oksanen, J.; Blanchet, F.G.; Friendly, M.; Kindt, R.; Legendre, P.; McGlinn, D.; Minchin, P.R.; O’Hara, R.B.; Simpson, G.L.; Solymos, P.; et al. Vegan: Community Ecology Package; R Package Version 2.5-6; R Foundation for Statistical Computing: Vienna, Austria, 2019; Available online: https://cran.r-project.org/web/packages/vegan/index.html (accessed on 1 June 2020).
- Legendre, P.; Gallagher, E. Ecologically meaningful transformations for ordination of species data. Oecologia 2001, 129, 271–280. [Google Scholar] [CrossRef]
- Webb, C.O.; Ackerly, D.D.; McPeek, M.A.; Donoghue, M.J. Phylogenies and Community Ecology. Annu. Rev. Ecol. Syst. 2002, 33, 475–505. [Google Scholar] [CrossRef]
- Kumar, S.; Stecher, G.; Li, M.; Knyaz, C.; Tamura, K. MEGA X: Molecular Evolutionary Genetics Analysis across Computing Platforms. Mol. Biol. Evol. 2018, 35, 1547–1549. [Google Scholar] [CrossRef]
- Kembel, S.W.; Cowan, P.D.; Helmus, M.R.; Cornwell, W.K.; Morlon, H.; Ackerly, D.D.; Blomberg, S.P.; Webb, C.O. Picante: R tools for integrating phylogenies and ecology. Bioinformatics 2010, 26, 1463–1464. [Google Scholar] [CrossRef]
- Pinheiro, J.; Bates, D.; DebRoy, S.; Sarkar, D. Nlme: Linear and Nonlinear Mixed Effects Models; R Package Version 3.1-149; R Foundation for Statistical Computing: Vienna, Austria, 2020; Available online: https://CRAN.R-project.org/package=nlme (accessed on 1 June 2020).
- Zuur, A.F.; Ieno, E.N.; Walker, N.J.; Saveliev, A.A.; Smith, G.M. Mixed Effects Models and Extensions in Ecology with R; Springer: New York, NY, USA, 2009. [Google Scholar]
- Legendre, P.; Legendre, L. Numerical Ecology, 2nd ed.; Elsevier: Amsterdam, The Netherlands, 1998; ISBN 978-0444892508. [Google Scholar]
- Dufrêne, M.; Legendre, P. Species Assemblages and Indicator Species: The Need for a Flexible Asymmetrical Approach. Ecol. Monogr. 1997, 67, 345–366. [Google Scholar] [CrossRef]
- Roberts, D.W. Labdsv Package: Ordination and Multivariate Analysis for Ecology; R Package Version 2.0-1; R Foundation for Statistical Computing: Vienna, Austria, 2019; Available online: https://cran.r-project.org/web/packages/labdsv/index.html (accessed on 1 June 2020).
- Borcard, D.; Legendre, P. All-scale spatial analysis of ecological data by means of principal coordinates of neighbour matrices. Ecol. Model. 2002, 153, 51–68. [Google Scholar] [CrossRef]
- Varela-Cervero, S.; Vasar, M.; Davison, J.; Barea, J.M.; Öpik, M.; Azcón-Aguilar, C. The composition of arbuscular mycorrhizal fungal communities differs among the roots, spores and extraradical mycelia associated with five Mediterranean plant species. Environ. Microbiol. 2015, 17, 2882–2895. [Google Scholar] [CrossRef]
- López-García, Á.; Varela-Cervero, S.; Vasar, M.; Öpik, M.; Barea, J.M.; Azcón-Aguilar, C. Plant traits determine the phylogenetic structure of arbuscular mycorrhizal fungal communities. Mol. Ecol. 2017, 26, 6948–6959. [Google Scholar] [CrossRef]
- Hart, M.M.; Aleklett, K.; Chagnon, P.L.; Egan, C.; Ghignone, S.; Helgason, T.; Waller, L. Navigating the labyrinth: A guide to sequence-based, community ecology of arbuscular mycorrhizal fungi. New Phytol. 2015, 207, 235–247. [Google Scholar] [CrossRef]
- Bouffaud, M.-L.; Bernaud, E.; Colombet, A.; Van Tuinen, D.; Wipf, D.; Redecker, D. Regional-scale analysis of arbuscular mycorrhizal fungi: The case of Burgundy vineyards. J. Int. Sci. Vigne Vin 2016, 50, 1–8. [Google Scholar] [CrossRef]
- Hart, M.M.; Reader, R.J. Taxonomic basis for variation in the colonization strategy of arbuscular mycorrhizal fungi. New Phytol. 2002, 153, 335–344. [Google Scholar] [CrossRef]
- Maherali, H.; Klironomos, J.N. Influence of Phylogeny on Fungal Community Assembly and Ecosystem Functioning. Science 2007, 316, 1746–1748. [Google Scholar] [CrossRef]
- Yang, H.; Zhang, Q.; Koide, R.T.; Hoeksema, J.D.; Tang, J.; Bian, X.; Hu, S.; Chen, X. Taxonomic resolution is a determinant of biodiversity effects in arbuscular mycorrhizal fungal communities. J. Ecol. 2017, 105, 219–228. [Google Scholar] [CrossRef]
- Giovannini, L.; Palla, M.; Agnolucci, M.; Avio, L.; Sbrana, C.; Turrini, A.; Giovannetti, M. Arbuscular Mycorrhizal Fungi and Associated Microbiota as Plant Biostimulants: Research Strategies for the Selection of the Best Performing Inocula. Agronomy 2020, 10, 106. [Google Scholar] [CrossRef]
- Verbruggen, E.; Kiers, E.T. Evolutionary ecology of mycorrhizal functional diversity in agricultural systems. Evol. Appl. 2010, 3, 547–560. [Google Scholar] [CrossRef]
- Chagnon, P.-L.; Bradley, R.L.; Maherali, H.; Klironomos, J.N. A trait-based framework to understand life history of mycorrhizal fungi. Trends Plant Sci. 2013, 18, 484–491. [Google Scholar] [CrossRef]
- Rosendahl, S.; McGee, P.A.; Morton, J.B. Lack of global population genetic differentiation in the arbuscular mycorrhizal fungus Glomus mosseae suggests a recent range expansion which may have coincided with the spread of agriculture. Mol. Ecol. 2009, 18, 4316–4329. [Google Scholar] [CrossRef]
- Holland, T.C.; Bowen, P.A.; Bogdanoff, C.P.; Lowery, T.D.; Shaposhnikova, O.; Smith, S.M.; Hart, M.M. Evaluating the diversity of soil microbial communities in vineyards relative to adjacent native ecosystems. Appl. Soil Ecol. 2016, 100, 91–103. [Google Scholar] [CrossRef]
- Davison, J.; Moora, M.; Öpik, M.; Ainsaar, L.; Ducousso, M.; Hiiesalu, I.; Jairus, T.; Johnson, N.; Jourand, P.; Kalamees, R.; et al. Microbial island biogeography: Isolation shapes the life history characteristics but not diversity of root-symbiotic fungal communities. ISME J. 2018, 12, 2211–2224. [Google Scholar] [CrossRef] [PubMed]
- Hempel, S.; Renker, C.; Buscot, F. Differences in the species composition of arbuscular mycorrhizal fungi in spore, root and soil communities in a grassland ecosystem. Environ. Microbiol. 2007, 9, 1930–1938. [Google Scholar] [CrossRef] [PubMed]
- Van Der Heijden, M.G.A.; Klironomos, J.N.; Ursic, M.; Moutoglis, P.; Streitwolf-Engel, R.; Boller, T.; Wiemken, A.; Sanders, I.R. Mycorrhizal fungal diversity determines plant biodiversity, ecosystem variability and productivity. Nat. Cell Biol. 1998, 396, 69–72. [Google Scholar] [CrossRef]
- Richards, A.; Estaki, M.; Urbez-Torres, J.R.; Bowen, P.; Lowery, T.; Hart, M. Cover Crop Diversity as a Tool to Mitigate Vine Decline and Reduce Pathogens in Vineyard Soils. Diversity 2020, 12, 128. [Google Scholar] [CrossRef]
- Radić, T.; Hančević, K.; Likar, M.; Protega, I.; Jug-Dujaković, M.; Bogdanović, I. Neighbouring weeds influence the formation of arbuscular mycorrhiza in grapevine. Symbiosis 2012, 56, 111–120. [Google Scholar] [CrossRef]
- Massa, N.; Bona, E.; Novello, G.; Todeschini, V.; Boatti, L.; Mignone, F.; Gamalero, E.; Lingua, G.; Berta, G.; Cesaro, P. AMF communities associated to Vitis vinifera in an Italian vineyard subjected to integrated pest management at two different phenological stages. Sci. Rep. 2020, 10, 1–12. [Google Scholar] [CrossRef]
- Peiffer, J.A.; Spor, A.; Koren, O.; Jin, Z.; Tringe, S.G.; Dangl, J.L.; Buckler, E.S.; Ley, R.E. Diversity and heritability of the maize rhizosphere microbiome under field conditions. Proc. Natl. Acad. Sci. USA 2013, 110, 6548–6553. [Google Scholar] [CrossRef]
- Edwards, J.; Johnson, C.; Santos-Medellín, C.; Lurie, E.; Podishetty, N.K.; Bhatnagar, S.; Eisen, J.A.; Sundaresan, V. Structure, variation, and assembly of the root-associated microbiomes of rice. Proc. Natl. Acad. Sci. USA 2015, 112, E911–E920. [Google Scholar] [CrossRef]
- Jiang, Y.; Li, S.; Li, R.; Zhang, J.; Liu, Y.; Lv, L.; Zhu, H.; Wu, W.; Li, W. Plant cultivars imprint the rhizosphere bacterial community composition and association networks. Soil Biol. Biochem. 2017, 109, 145–155. [Google Scholar] [CrossRef]
- Philippot, L.; Raaijmakers, J.M.; Lemanceau, P.; Van Der Putten, W.H. Going back to the roots: The microbial ecology of the rhizosphere. Nat. Rev. Genet. 2013, 11, 789–799. [Google Scholar] [CrossRef]
- Marasco, R.; Rolli, E.; Fusi, M.; Michoud, G.; Daffonchio, D. Grapevine rootstocks shape underground bacterial microbiome and networking but not potential functionality. Microbiome 2018, 6, 1–17. [Google Scholar] [CrossRef]
- Berlanas, C.; Berbegal, M.; Elena, G.; Laidani, M.; Cibriain, J.F.; Sagües, A.; Gramaje, D. The Fungal and Bacterial Rhizosphere Microbiome Associated with Grapevine Rootstock Genotypes in Mature and Young Vineyards. Front. Microbiol. 2019, 10, 1142. [Google Scholar] [CrossRef] [PubMed]
- Ellouze, W.; Hamel, C.; Vujanovic, V.; Gan, Y.; Bouzid, S.; St-Arnaud, M. Chickpea genotypes shape the soil microbiome and affect the establishment of the subsequent durum wheat crop in the semiarid North American Great Plains. Soil Biol. Biochem. 2013, 63, 129–141. [Google Scholar] [CrossRef]
- Götzenberger, L.; De Bello, F.; Bråthen, K.A.; Davison, J.; Dubuis, A.; Guisan, A.; Lepš, J.; Lindborg, R.; Moora, M.; Pärtel, M.; et al. Ecological assembly rules in plant communities-approaches, patterns and prospects. Biol. Rev. 2011, 87, 111–127. [Google Scholar] [CrossRef] [PubMed]
- Chang, L.W.; Zeleny, D.; Li, C.F.; Chiu, S.T.; Hsieh, C.F. Better environmental data may reverse conclusions about niche- and dispersal-based processes in community assembly. Ecology 2013, 94, 2145–2151. [Google Scholar] [CrossRef] [PubMed]
- Jansa, J.; Erb, A.; Oberholzer, H.R.; Šmilauer, P.; Egli, S. Soil and geography are more important determinants of indigenous arbuscular mycorrhizal communities than management practices in Swiss agricultural soils. Mol. Ecol. 2014, 23, 2118–2135. [Google Scholar] [CrossRef] [PubMed]
- Vályi, K.; Mardhiah, U.; Rillig, M.C.; Hempel, S. Community assembly and coexistence in communities of arbuscular mycorrhizal fungi. ISME J. 2016, 10, 2341–2351. [Google Scholar] [CrossRef]
- Davison, J.; Moora, M.; Jairus, T.; Vasar, M.; Öpik, M.; Zobel, M. Hierarchical assembly rules in arbuscular mycorrhizal (AM) fungal communities. Soil Biol. Biochem. 2016, 97, 63–70. [Google Scholar] [CrossRef]
- Berg, G.; Rybakova, D.; Grube, M.; Köberl, M. The plant microbiome explored: Implications for experimental botany. J. Exp. Bot. 2016, 67, 995–1002. [Google Scholar] [CrossRef]
- Pieterse, C.M.J.; De Jonge, R.; Berendsen, R.L. The Soil-Borne Supremacy. Trends Plant Sci. 2016, 21, 171–173. [Google Scholar] [CrossRef]
- Corneo, P.E.; Pellegrini, A.; Cappellin, L.; Roncador, M.; Chierici, M.; Gessler, C.; Pertot, I. Microbial community structure in vineyard soils across altitudinal gradients and in different seasons. FEMS Microbiol. Ecol. 2013, 84, 588–602. [Google Scholar] [CrossRef]
- Mezzasalma, V.; Sandionigi, A.; Guzzetti, L.; Galimberti, A.; Grando, M.S.; Tardaguila, J.; Labra, M. Geographical and Cultivar Features Differentiate Grape Microbiota in Northern Italy and Spain Vineyards. Front. Microbiol. 2018, 9, 946. [Google Scholar] [CrossRef]
- Haney, C.H.; Samuel, B.S.; Bush, J.; Ausubel, F.M. Associations with rhizosphere bacteria can confer an adaptive advantage to plants. Nat. Plants 2015, 1, 1–9. [Google Scholar] [CrossRef]


| Diversity Index | Sample Type | Cultivar | Sample Type × Cultivar |
|---|---|---|---|
| VT richness | 6.8031,28 * | 0.6191,28 | 0.7561,28 |
| Shannon | 46.3481,28 *** | 2.7191,28 | 0.3641,28 |
| Simpson | 27.2401,28 *** | 1.981,28 | 1.431,28 |
| Ses.mpd | 43.9681,28 *** | 0.7211,28 | 2.1731,28 |
| Variable | Df | SS | MS | F | R2 | p |
|---|---|---|---|---|---|---|
| Sample type | 1 | 3.401 | 3.401 | 11.971 | 0.269 | <0.001 |
| Cultivar | 1 | 0.444 | 0.444 | 1.564 | 0.035 | 0.117 |
| Space (PCNM1) | 1 | 0.792 | 0.792 | 2.787 | 0.063 | 0.011 |
| Sample type × Cultivar | 1 | 0.222 | 0.222 | 0.782 | 0.018 | 0.617 |
| Sample type × Space (PCNM1) | 1 | 0.234 | 0.234 | 0.824 | 0.019 | 0.559 |
| Cultivar × Space (PCNM1) | 1 | 0.593 | 0.593 | 2.086 | 0.047 | 0.034 |
| Sample type × Cultivar × Space | 1 | 0.143 | 0.143 | 0.502 | 0.011 | 0.942 |
| Residuals | 24 | 6.819 | 0.284 | 0.539 | ||
| Total | 31 | 12.648 | 1.000 |
| (a) | |||||||
| Data subset | |||||||
| Variable | Df | SS | MS | F | R2 | p | |
| Callet | Space (PCNM1) | 1 | 0.598 | 0.598 | 1.947 | 0.101 | 0.043 |
| Sample type | 1 | 1.421 | 1.421 | 4.627 | 0.239 | 0.001 | |
| PCNM × Sample type | 1 | 0.236 | 0.236 | 0.768 | 0.040 | 0.677 | |
| Residuals | 12 | 3.686 | 0.307 | 0.620 | |||
| Total | 15 | 5.942 | 1.000 | ||||
| Merlot | Space (PCNM1) | 1 | 0.786 | 0.786 | 3.012 | 0.126 | 0.016 |
| Sample type | 1 | 2.202 | 2.202 | 8.436 | 0.352 | 0.001 | |
| PCNM × Sample type | 1 | 0.141 | 0.141 | 0.539 | 0.022 | 0.851 | |
| Residuals | 12 | 3.133 | 0.261 | 0.500 | |||
| Total | 15 | 6.262 | 1.000 | ||||
| (b) | |||||||
| PCNM1 >0.036 | Cultivar | 1 | 0.590 | 0.590 | 2.210 | 0.102 | 0.031 |
| Sample type | 1 | 1.808 | 1.808 | 6.774 | 0.314 | 0.001 | |
| Sample type × Cultivar | 1 | 0.158 | 0.158 | 0.592 | 0.027 | 0.816 | |
| Residuals | 12 | 3.203 | 0.267 | 0.556 | |||
| Total | 15 | 5.759 | 1.000 | ||||
| PCNM1 <0.036 | Cultivar | 1 | 0.308 | 0.308 | 0.947 | 0.050 | 0.441 |
| Sample type | 1 | 1.758 | 1.758 | 5.402 | 0.287 | 0.002 | |
| Sample type × Cultivar | 1 | 0.154 | 0.154 | 0.472 | 0.025 | 0.948 | |
| Residuals | 12 | 3.905 | 0.325 | 0.638 | |||
| Total | 15 | 6.124 | 1 |
Publisher’s Note: MDPI stays neutral with regard to jurisdictional claims in published maps and institutional affiliations. |
© 2020 by the authors. Licensee MDPI, Basel, Switzerland. This article is an open access article distributed under the terms and conditions of the Creative Commons Attribution (CC BY) license (http://creativecommons.org/licenses/by/4.0/).
Share and Cite
López-García, Á.; Jurado-Rivera, J.A.; Bota, J.; Cifre, J.; Baraza, E. Space and Vine Cultivar Interact to Determine the Arbuscular Mycorrhizal Fungal Community Composition. J. Fungi 2020, 6, 317. https://doi.org/10.3390/jof6040317
López-García Á, Jurado-Rivera JA, Bota J, Cifre J, Baraza E. Space and Vine Cultivar Interact to Determine the Arbuscular Mycorrhizal Fungal Community Composition. Journal of Fungi. 2020; 6(4):317. https://doi.org/10.3390/jof6040317
Chicago/Turabian StyleLópez-García, Álvaro, José A. Jurado-Rivera, Josefina Bota, Josep Cifre, and Elena Baraza. 2020. "Space and Vine Cultivar Interact to Determine the Arbuscular Mycorrhizal Fungal Community Composition" Journal of Fungi 6, no. 4: 317. https://doi.org/10.3390/jof6040317
APA StyleLópez-García, Á., Jurado-Rivera, J. A., Bota, J., Cifre, J., & Baraza, E. (2020). Space and Vine Cultivar Interact to Determine the Arbuscular Mycorrhizal Fungal Community Composition. Journal of Fungi, 6(4), 317. https://doi.org/10.3390/jof6040317