Abstract
In the last 40 years, a significant increase in the incidence of lung infections by Aspergillus has been reported. The scarcity of studies that describe the costs of aspergillosis indicates that the economic impact of aspergillosis in the hospital environment is greater than that of other fungal infections. The objective of the study was to evaluate the direct healthcare costs associated with aspergillosis in the Spanish National Health System from 1997 to 2021. A retrospective nationwide longitudinal descriptive study was designed to review hospital records from the Minimum Basic Data Set of patients admitted to hospitals of the National Health System from 1997 to 2021, with a diagnosis of aspergillosis. A total of 44,586 patients were admitted for aspergillosis in the Spanish National Health System. There was a progressive increase in the average annual cost from 1997 to 2012, which reached a maximum peak, EUR 1,395,154.21 (±2,155,192.87). It decreased between 2014 and 2019, but increased again in 2020 and 2021, EUR 28,675.79 (±30,384.12). The Pearson correlation coefficient revealed a weak negative correlation between age and hospital costs and a moderate positive correlation between average length of stay and hospital costs. Our data show that the economic impact of hospitalizations for aspergillosis is significant and increasing at a rate proportionally higher than that of other prevalent diseases. Costs related to Aspergillus infection are associated mainly with respiratory diseases. The results of this economic evaluation may be useful for health authorities to develop a future economic strategy for managing this fungal infection.
1. Introduction
Aspergillosis is caused by the species of the fungus Aspergillus spp., a common saprophytic colonial fungus that is ubiquitously found in nature and affects susceptible hosts when inhaled. The species most frequently involved are A. fumigatus, A. flavus, A. niger, and A. terreus [1,2]. Depending on the underlying immune status of the host, the fungus may cause disease through any of the following mechanisms: fungal sensitization, allergic response, saprophytic colonization, and/or frank invasion of the lung parenchyma. Hence, it is now regarded as a semicontinuous spectrum of allergic, noninvasive, and invasive forms [3].
Aspergillosis is described mainly in neutropenic patients due to hemato-oncological diseases [1,4,5]. The lethality rate has decreased significantly in recent years owing to early treatment, especially in invasive aspergillosis, where a decrease of up to 30% has been observed [6]. In severely immunosuppressed patients, the lethality rate reaches up to 40–50% [1,7]. In recent years, an increasing number of cases has been reported, especially of invasive aspergillosis [2,7]. This is mainly due to the group of patients receiving immunosuppressive treatments and the increase in the number of solid organ transplants, with an incidence of up to 19% in this group [7].
Since 2013, the Leading International Fungal Education (LIFE) portal estimated the burden of aspergillosis infections by country, revealing differences in the global burden between countries, within regions of the same country, and between at-risk populations [8]. Therefore, according to epidemiological reports, a significant increase in the incidence in the last 40 years likely reflects an increase in the number of immunocompromised patients [7,9].
However, very little information is available concerning the overall hospital cost of fungal infections caused by Aspergillus spp. [10]. The scarcity of studies that describe the costs associated with aspergillosis indicates that the economic impact of aspergillosis in the hospital environment is greater than that of other fungal infections [9,11,12]. This economic cost has usually been analyzed in a partial and incomplete manner. Thus, most works focused on invasive aspergillosis and have fundamentally evaluated the cost associated with changes in therapeutic strategy between the different families of antifungals in countries such as the United States, Canada, Sweden, and Spain [12,13,14,15]. Consequently, there are currently few studies on the economic impact of aspergillosis, and comparisons between countries are difficult. Therefore, the aim of our study was to evaluate the direct healthcare costs associated with aspergillosis among inpatients in the Spanish National Health System (NHS) from 1997 to 2021.
2. Materials and Methods
2.1. Study Population and Data Source
We conducted a nationwide retrospective longitudinal descriptive study of all aspergillosis hospitalizations in public hospitals of the Spanish NHS between 1 January 1997 and 31 December 2021. Spain’s NHS provides publicly funded universal coverage and offers a broad portfolio of services that includes all technologies and health procedures for known diseases. It comprises all the health services of the state administration and the 17 autonomous communities that constitute the Spanish state.
The necessary information was obtained from the Minimum Basic Data Set (MBDS/CMBD in Spanish), from its first to its latest version, which is called the Register of Specialized Health Care (RAE-CMBD in Spanish). The latest version was implemented in 2016 and extended the register to other forms of in-patient care (e.g., home care, medical day hospital, out-patient surgery, out-patient procedures of special complexity, and emergencies) and to the private sector. The CMBD is a specialized healthcare registry that uses each care contact with a patient as a recording unit. It is an essential source for epidemiological research in the NHS, which has existed for more than 25 years. Until 2015, Spain applied the International Classification of Diseases (ICD)-9-CM (Clinical Modification of the 9th Revision of the International Classification of Diseases) as the reference classification for the coding of diagnoses and procedures of the CMBD. Since 1 January 2016, the ICD-10 has been implemented as the reference classification for clinical coding and recording of morbidity, in accordance with the Spanish Royal Decree 69/2015 [16].
The principal diagnosis is defined as the condition after the study that results in admission to the hospital, according to the ICD-9-CM or ICD-10 Official Guidelines for Coding and Reporting and the criteria of the attending clinical service or medical practitioner, even if major complications or other independent conditions have occurred during the stay. Secondary diagnoses are “other diagnoses” or conditions that coexist with the principal condition at the time of admission (i.e., comorbidities) or develop later during the hospital stay (i.e., complications), influencing the length of stay or the treatment administered.
The classification of Spanish public hospitals into clusters establishes the following categories. GROUP 1: Small regional hospitals with fewer than 150 beds on average, with hardly any high-tech equipment, few doctors and low complexity of care. GROUP 2: Basic general hospitals, average size of less than 200 beds, minimal technological equipment, with some teaching weight and somewhat greater complexity of care. GROUP 3: Area hospitals, average size of approximately 500 beds. On average, they have more than 50 MIR (Medical Intern Resident) doctors and 269 doctors. Medium complexity (1.5 complex services and 1.01 case mix). GROUP 4: Group of large hospitals, but more heterogeneous in staffing, size, and activity. High teaching intensity (more than 160 MIR doctors and high complexity (four complex services on average and a case mix greater than 1.20)). GROUP 5: Hospitals of great structural weight and high activity. Full range of services. More than 680 doctors and approximately 300 MIRs were included. These include large complexes. GROUP 6: Hospitals that could not be classified or that had not been assigned to any of the previous groups at the time of analysis.
The health administration uses the “Diagnosis Related Groups” (DRGs) classification system to define hospital costs [16]. This system groups patients with various diagnoses of similar resource consumption into a case mix category. Each patient is assigned a single DRG at discharge. The Ministry of Health periodically prepares these costs of hospitalization processes. The DRG classification used in Spain until 2015 was the All Patient DRG (AP-DRGs), which was designed exclusively for clinical variables to be coded with the ICD-9-CM. Since changing to the ICD-10, AP-DRGs have ceased to be used worldwide and have been replaced by All Patients Refined (APR-DRGs). Each APR-DRG is classified into four types of severity of illness (SOI) and four types of risk of mortality (ROM) subclasses, ranging from 1 to 4 (1-minor, 2-moderate, 3-major, and 4-extreme), which are determined by secondary diagnoses, with weights increasing as severity increases.
The estimation of the patient costs is an approximate calculation based on the DRG classification system. Each condition treated is assigned a code from the DRG classification system. Each of these DRGs has an average weight (standard value in each of the hospitals of the NHS that allows the comparison of activity between hospitals). Each AP-DRG or APR-DRG (and with each severity level since 2016) has its associated weights and costs. The cost is calculated by multiplying the number of cases of each DRG (and severity level since 2016) by its average cost and dividing by the total number of cases of a given unit, group, or process. Until 2015, the costs corresponded to the costs of the AP-DRG estimated in the process of estimating hospital costs of the NHS, so that each discharge was assigned the estimated cost for the AP-DRG that corresponds to it. Since 2016, the average cost has been different for each DRG and severity level.
2.2. Selection of Aspergillosis
We included all aspergillosis hospitalizations in public hospitals of the NHS between 1997 and 2021. We defined an aspergillosis-related hospitalization using the classifications of the International Classification of Diseases, 9th Revision, Clinical Modification (ICD-9-CM) and 10th edition (ICD-10) as follows: any hospital discharge with a principal or secondary diagnosis of aspergillosis and infection due to Aspergillus species (semicontinuous spectrum of allergic, noninvasive, and invasive forms, chronic pulmonary aspergillosis included) diagnosis codes: 117.3 (ICD-9-CM, cases 1997–2015) and B44 (ICD-10, cases 2016–2021). The CMBD excludes short-term admissions (<24 h), emergency department care, and outpatient care. Patients with missing data were excluded from the study.
2.3. Data Analysis
The total cost of aspergillosis-related hospital care was estimated as the sum of the total hospital charges incurred for all hospitalizations for which aspergillosis was listed as a diagnosis. The average cost corresponds to the average cost estimated for each DRG in the process of estimating the weights and NHS costs of the version in force, which are calculated and updated for the reference year. For the APR-DRG, the cost is calculated for each severity level (SOI). The methodological difference between AP-DRGs and APR-DRGs in cost calculation required us to estimate the costs of aspergillosis-related hospital care separately in the two following periods: from 1997 to 2015 and from 2016 to 2021. All costs were expressed in euros (EUR).
An initial descriptive analysis of the variables was conducted. Continuous variables were expressed as the means and standard deviations (SDs) or medians, interquartile ranges (IQRs), and ranges. Categorical variables were reported in absolute values (n) and percentages (%). The means of the quantitative variables and proportions of the qualitative variables were subsequently compared. Qualitative variables were tested with Pearson’s chi-square test to assess trends. ANOVA was used to determine the existence of statistically significant differences between two or more categorical groups by testing for differences in means using one variance. The Pearson correlation coefficient (r) was used to describe the strength and direction of the linear relationship between two quantitative variables. Statistically significant differences were those with p < 0.05. The statistical analysis was performed via the statistical program SPSS 28.0.
2.4. Ethics Statement
The study protocol was approved by the Clinical Research Ethics Committee of Investigation with Drugs of Cantabria, Spain (CEIMC 2020.353). The procedures described here were carried out in accordance with the ethical standards described in the Revised Declaration of Helsinki in 2013.
3. Results
3.1. Patient Characteristics
A total of 44,586 patients were admitted for aspergillosis in the Spanish National Health System between January 1997 and December 2021; in most cases (82%), the diagnosis of Aspergillus was secondary. A total of 30,023 (67%) were men, with a mean age of 63 (±17.6) years of age, compared to 14,560 women (33%), with a slightly lower mean age of 59 (±20.7) years of age (p < 0.001); 1347 (3%) were in the pediatric population. Hospital admissions were mainly non-programmed (77.5%), more frequent during the winter season (31.2%), and in specialized hospitals, such as area hospitals (GROUP 3, 25.7%), large hospitals (GROUP 4, 21.6%), and complex hospitals (GROUP 5, 26.6%) of the Spanish public health system (97%). Aspergillus infection was mainly associated with respiratory diseases such as chronic obstructive pulmonary disease (COPD) (44%), influenza/pneumonia (32.4%), and hematological malignancies (20.4%). The hospital services with the highest number of admissions were internal medicine (20.8%), pneumology (19.7%), clinical hematology (13.5%), and medical processes (81.1%). A total of 3512 (7.9%) patients needed a critical care unit (CCU)/intensive care unit (ICU), and 68 (0.1%) needed a neonatal intensive care unit (NICU)/pediatric intensive care unit (PICU). Furthermore, 650 (1.5%) patients were at the transplant unit. The mean hospital stay was 27 (±27.3) days. Most patients were classified as having SOI or ROM levels of 3 (major) or 4 (extreme). Finally, one out of four patients died (25%). Table 1 shows the clinical and epidemiological characteristics of these patients.

Table 1.
Characteristics of patients with aspergillosis-related hospitalizations, 1997–2021.
3.2. Cost of Aspergillosis-Related Hospitalizations
There was a progressive increase in the average annual cost from 1997 to 2012, which peaked at EUR 1,395,154.21 (±2,155,192.87). It decreased between 2014 and 2019 but increased again in 2020 and 2021, reaching EUR 28,675.79 (±30,384.12). Figure 1 shows the evolution of the average cost (EUR) year by year in Spain over the 25 years of the study, 1997–2021. Similarly, Figure 2 shows the evolution of the average cost (EUR) year by year in the different Spanish hospital clusters over the last 25 years. The average cost increases as the cluster increases in complexity and specialization.
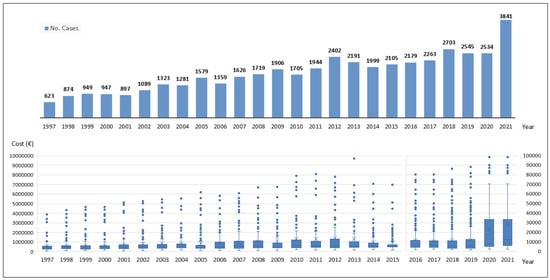
Figure 1.
Evolution of caseload (bar chart) and cost (box plot) year by year, Spain (1997–2021).
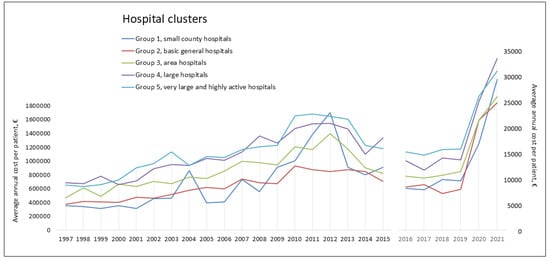
Figure 2.
Evolution of the average annual cost per patient (EUR) and hospital clusters, Spain (1997–2021).
The average and total costs associated with Aspergillus infection in Spain over this 25-year period are shown in Table 2. We highlight some total costs as follows: in special units like ICU costs were EUR 4,152,2570,859 (Mean cost per patient: 1997–2015 was EUR 2,572,988 vs. 2016–2021 was EUR 38,485); regarding comorbidity, COPD costs were EUR 8,817,805,808 (Mean cost per patient: 1997–2015 was EUR 691,676 vs. 2016–2021 was EUR 10,933), influenza costs were EUR 11,597,012,286 (Mean cost per patient:1997–2015 was 1,225,153 vs. 2016–2021 27,644) and Hematology malignancy EUR 8,868,538,550 (mean cost per patient: 1997–2015 was EUR 1,377,734 vs. 2016–2021 EUR 19,556). Regarding outcomes, total costs of survival was EUR 18,732,760,191 (mean cost per patient:1997–2015 was EUR 869,866 vs. 2016–2021 EUR 14,074) and total costs in death was EUR 10,442,003,681 (mean cost per patient: 1997–2015 was EUR 1,443,287 vs. 2016–2021 EUR 28,091). An ANOVA revealed significant differences in the costs related to Aspergillus infection for all the variables analyzed (p < 0.001). The Pearson correlation coefficient indicated a weak negative correlation between age and hospital costs (r = −0.144, period 1997–2015; r = −0.107, period 2016–2021), with lower ages resulting in higher hospital costs, and a moderate positive correlation between average length of hospital stay and hospital costs, with hospital costs increasing as the number of days of hospital stay increase (r = 0.389, period 1997–2015; r = 0.503, period 2016–2021). Finally, Figure 3 illustrates the costs associated with aspergillosis in Spain over a 25-year period, both for patients who survived and for those who died.
Table 2.
Cost of aspergillosis-related hospitalizations, 1997–2021.
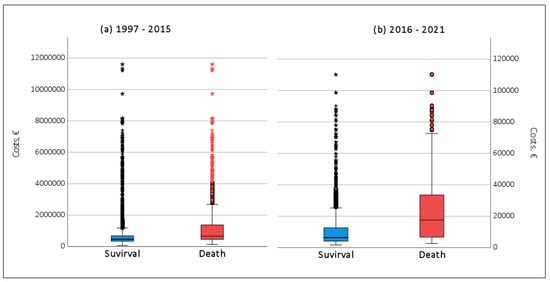
Figure 3.
Box plot of the cost incurred in hospitalized patients with aspergillosis who survived and died in Spain over 25 years: (a) 1997–2015, (b) 2016–2021.
4. Discussion
We evaluated the economic impact of hospitalized patients with aspergillosis in the Spanish National Health System from 1997 to 2021. Our data revealed that the economic impact of hospitalization for aspergillosis is significant and increasing. Notably, other diseases that are more prevalent than aspergillosis in Spain, such as chronic heart failure (CHF), diabetes (DM), or community-acquired pneumonia (CAP), have a proportionally lower economic impact than the pathology studied. For example, CHF is estimated to cost EUR 2500 million per year, of which 470 million are exclusively hospital costs. In 2010, DM generated a cost of EUR 5809 million in Spain. Finally, at the European level, CAP is estimated to cost EUR 10.1 billion, with a hospital burden of EUR 5.7 billion, and at the national level, it is estimated to generate costs of EUR 5353/patient.
Previous studies and publications by our group have shown an increase in the incidence of aspergillosis in Spain [2,17], which leads to the associated economic costs. Other reasons include the increase in immunocompromised patients and the prolongation of survival in these patients [2,17].
Since 1 January 2016, the ICD-10-ES classification has been the reference of classification for clinical coding and morbidity registration in Spain, replacing the ICD-9-CM. The quality of the ICD-10 is higher than that of the ICD-9 because of the improved specificity of the codes. Better coding means better quality hospital data, which translates into better analysis, better measurement of services provided and, consequently, a more accurate and detailed costing methodology. This, among other factors, could explain the increase in cases.
We note the great difference between the expenses incurred by aspergillosis and those incurred by other services. Thus, hematological patients double the expenses generated (mean cost per patient) in other services, such as pulmonology or internal medicine. This can be explained by what was described by the American Society of Microbiology and the Spanish Public Health Society, which observed a greater number of complications and coinfections due to the state of immunosuppression in hematological patients [1,7,18,19,20]. Similarly, pediatric patients have higher cost figures, possibly because they are onco-pediatric patients.
During the 25-year study period, two peaks in hospital costs were observed. The first was between 2010 and 2012, which could be related to the first influenza A pandemic [21]. The second peak between 2020 and 2021 coincided with the SARS-CoV-2 pandemic [2,17]. Our study supports the hypothesis already described of the association between infection by Aspergillus spp. and different viruses, such as influenza and, more recently, SARS-CoV-2. Reinforcing the idea that coinfection usually entails a greater use of resources, the need for intensive care, ventilatory support therapies, a greater number of days of hospitalization, and greater lethality, it ultimately generates a greater economic cost [22,23,24,25]. Notably, between 2015 and 2018, a decrease in expenses was observed. One of the factors that has favored economic savings may be the therapeutic introduction of isavuconazole compared with other more expensive options, a phenomenon already supported in several studies in the United States, Europe, and Spain [12,13,14,15]. Isavuconazole was approved in March 2015 by the Food and Drug Administration (FDA) and was marketed in Spain in 2017.
We wanted to highlight the relationship between the type of hospital and the economic impact caused by aspergillosis. Thus, the more complex the hospital is, the greater the expense. It seems logical to think that these hospitals, many of which are reference hospitals, manage the most complex patients. In addition, disease severity (SOI) and mortality risk (ROM) are mainly determined by the interaction of multiple diseases. Thus, patients with greater disease severity had higher costs.
The APR-DRG system is based mainly on secondary diagnoses instead of classification by age and complications or comorbidities, such as the previous version of AP-DRG; therefore, patients with a greater number of secondary diagnoses (and therefore greater SOI) consume a greater amount of health resources, which translates into higher costs, and these data are compatible with previous Spanish studies [26].
Variations in the distribution of severity are directly related to variations in the average weight for these DRGs in APR (since 2016), whereas in the AP (until 2015), this weight is constant. With the implementation of the ICD-10 for diseases and procedures, the grouping was revamped, including the introduction of a refined grouping for all patients (APR-DRG), which was stratified into four levels of severity (according to resource consumption) that were mainly determined by secondary diagnoses reflecting the comorbidities and severity of the principal diagnosis, with weights increasing with increasing severity. The introduction of the ICD-10 and APR-DRG necessitated a better and more exhaustive definition of processes, demanded a higher quality of coding than previous versions (measured as the average number of diagnoses and procedures per episode), and revealed some inconsistencies in the equivalences for some procedures that have been used until then.
The use of the APR-DRG reduces the complexity (mean weight) of a hospital by half compared with that obtained if the same episodes are grouped with the AP-DRG. However, the distribution according to the four levels of severity in the APR-DRG is highly variable across hospitals. The impact of robust information recording on complexity is much greater in the APR-DRG than in the AP-DRG. This leads us to affirm that the impact of a good recording of information on complexity or average weight is greater in the APR-DRG than in the AP-DRG [26,27].
Strengths and Limitations
The main limitation of this work is that it is a retrospective study, and the information used comes from the CMBD. The CMBD provides information from a network of hospitals that covers more than 99% of the population living in Spain (https://www.sanidad.gob.es accessed on 2 March 2024) thus, we are confident that this study provides fairly accurate estimates. However, several factors contributed to the limitations of our study as follows: (i) the use of sources, such as the CMBD, for purposes other than research and clinical care; (ii) the use of the ICD-9 code, which has certain classification limitations with respect to the ICD-10; (iii) encoding errors; (iv) the inability to access patient medical history, which prevented us from confirming the diagnosis and the species implicated, identifying the possible associated factors involved, and assessing the tests used for aspergillosis diagnosis, which impaired the quality of the data. To our knowledge, there are no data on the sensitivity and specificity of the 117.3 code (1997–2015) and code B44 (2016–2017) for aspergillosis cases. (v) This study only considered cases in hospitals and not non-hospital cases or those in private centers; for example, patients who are ill and who are not admitted or who did not receive medical care, in addition to those treated in private hospitals, were excluded. Thus, hospital records underestimate the real burden of aspergillosis in Spain. (vi) The DRGs were not designed to be used for health services research, though they have proven useful for this purpose. The DRG cost databases attach monetary value to hospital healthcare resources consumed by patients. Their advantages include public and free access, transparency, exhaustivity (accounting for severity and risk levels), regular updates, and a classification system that is stable over time and comparable across hospitals and even countries [28]. Both the DRG costs and DRG weights are published by the Spanish NHS. The cost calculation methodology was revised in 2016. However, Spain has a decentralized public administration system, with 17 autonomous communities (ACs) and two autonomous cities (Ceuta and Melilla), each with different hospital accounting procedures and practices. Thus, some ACs use top-down gross costing methods that are based on North American DRG weightings to allocate costs to DRGs, whereas other ACs use micro-costing to determine cost drivers. Public tariffs/prices for inpatient DRGs are published separately for the 17 ACs and two ACs [29]. Furthermore, the APR-DRG accounts for diagnoses and procedures, but not complications that may occur during hospitalization and may impact the overall cost [30]. We acknowledge these limitations but also believe that we have contributed to the generation of hypotheses that may be explored in further investigations.
5. Conclusions
In conclusion, our data show that the economic impact of hospitalization for aspergillosis is significant and increasing at a rate proportionally higher than that of other diseases, such as chronic heart failure, diabetes, or community-acquired pneumonia. Costs associated with Aspergillus infections were mainly associated with respiratory diseases such as chronic obstructive pulmonary disease or influenza/pneumonia and hematological malignancies. The results of this economic evaluation may be useful for health authorities to develop a future economic strategy for the management of this fungal infection.
Author Contributions
Conceptualization, M.A.-S., M.B.-G. and J.P.-L.; methodology, M.A.-S.; software, M.A.-S.; validation, E.A.-A., B.R.A. and Á.R.-A.; formal analysis, M.R.V.; investigation, M.R.V. and A.L.-B.; resources, E.A.-A.; data curation, B.R.A.; writing—original draft preparation, M.R.V.; writing—review and editing, M.A.-S. and M.B.-G.; visualization, J.P.-L.; supervision, M.B.-G. and J.P.-L.; project administration, M.A.-S., M.B.-G. and J.P.-L. All authors have read and agreed to the published version of the manuscript.
Funding
This research received no external funding.
Institutional Review Board Statement
The study protocol was approved by the Clinical Research Ethics Committee of Investigation with Drugs of Cantabria, Spain (CEIMC 2020.353). The procedures described here were carried out in accordance with the ethical standards described in the Revised Declaration of Helsinki in 2013.
Informed Consent Statement
Not applicable.
Data Availability Statement
The necessary information was obtained from the Minimum Basic Data Set (MBDS/CMBD in Spanish), from its first to its latest version, which is called the Register of Specialized Health Care (RAE-CMBD in Spanish).
Conflicts of Interest
The authors declare no conflicts of interest.
References
- Latgé, J.P.; Chamilos, G. Aspergillus fumigatus and Aspergillosis in 2019. Clin. Microbiol. Rev. 2019, 33, e00140-18. [Google Scholar] [CrossRef] [PubMed]
- González-Garcia, P.; Alonso-Sardón, M.; López-Bernus, A.; Carbonell, C.; Romero-Alegría, Á.; Muro, A.; Galindo-Pérez, I.; Muñoz-Bellido, J.L.; Pardo-Lledias, J.; Belhassen-García, M. Epidemiology of aspergillosis in hospitalised Spanish patients—A 21-year retrospective study. Mycoses 2021, 64, 520–527. [Google Scholar] [CrossRef] [PubMed]
- Kosmidis, C.; Denning, D.W. The clinical spectrum of pulmonary aspergillosis. Thorax 2014, 70, 270–277. [Google Scholar] [CrossRef] [PubMed]
- Tejeda, M.I.; Salso, S.; Barberán, J. Invasive pulmonary aspergillosis in non-neutropenic patients. Rev. Española Quimioter. Publicación Of. La Soc. Española Quimioter. 2016, 29 (Suppl. S1), 56–58. [Google Scholar]
- Barberán, J.; Mensa, J. Aspergilosis pulmonar invasiva en el enfermo con enfermedad pulmonar obstructiva crónica. Rev. Iberoam. Micol. 2014, 31, 237–241. [Google Scholar] [CrossRef] [PubMed]
- Ramírez, P.; Garnacho-Montero, J. Aspergilosis invasiva en el paciente crítico. Rev. Iberoam. Micol. 2018, 35, 210–216. [Google Scholar] [CrossRef]
- Valenzuela, P.; Legarraga, P.; Rabagliati, R. Epidemiologa de la enfermedad fúngica invasora por hongos filamentosos en el período 2005 a 2015, en un hospital universitario en Santiago, Chile. Rev. Chil Infectologa 2019, 36, 732–741. [Google Scholar] [CrossRef]
- Bongomin, F.; Gago, S.; Oladele, R.; Denning, D. Global and Multi-National Prevalence of Fungal Diseases—Estimate Precision. J. Fungi 2017, 3, 57. [Google Scholar] [CrossRef]
- Taccone, F.S.; Van den Abeele, A.M.; Bulpa, P.; Misset, B.; Meersseman, W.; Cardoso, T.; Paiva, J.A.; Blasco-Navalpotro, M.; De Laere, E.; Dimopoulos, G.; et al. Epidemiology of invasive aspergillosis in critically ill patients: Clinical presentation, underlying conditions, and outcomes. Crit. Care 2015, 19, 7. [Google Scholar] [CrossRef]
- Moreno, C.; del Valle, G. Estudio de costo del tratamiento de la aspergilosis invasora en pacientes oncolgicos peditricos: Santiago. Chile. Rev. Chil. Infectologa 2010, 27, 302–307. [Google Scholar]
- Grau-Cerrato, S.; Ferrández-Quirante, O. Farmacoeconomía del tratamiento de las candidiasis invasoras. Rev. Iberoam. Micol. 2009, 26, 90–93. [Google Scholar] [CrossRef] [PubMed]
- Cerrato, S.G.; Mateu-de Antonio, J.; Álvarez, J.S.; Jareño, M.M.; Sánchez, E.S.; Marín-Casino, M.; Terrés, C.R. Evaluación económica del uso de voriconazol versus anfotericina B en el tratamiento de la aspergilosis invasiva. Farm. Hosp. 2005, 29, 5–10. [Google Scholar] [CrossRef]
- Beauchemin, C.; Guinan, K.; Claveau, D.; Dufresne, S.F.; Rotstein, C. PIN44 Isavuconazole for the Treatment of Invasive Aspergillosis and Mucormycosis: A Canadian Cost-Utility Analysis. Value Health 2020, 23, S551–S552. [Google Scholar] [CrossRef]
- Harrington, R.; Lee, E.; Yang, H.; Wei, J.; Messali, A.; Azie, N.; Wu, E.Q.; Spalding, J. Cost-Effectiveness Analysis of Isavuconazole vs. Voriconazole as First-Line Treatment for Invasive Aspergillosis. Adv. Ther. 2017, 34, 207–220. [Google Scholar] [CrossRef]
- Floros, L.; Kuessner, D.; Posthumus, J.; Bagshaw, E.; Sjölin, J. Cost-effectiveness analysis of isavuconazole versus voriconazole for the treatment of patients with possible invasive aspergillosis in Sweden. BMC Infect. Dis. 2019, 19, 134. [Google Scholar] [CrossRef]
- Portal Estadístico del SNS. Ministerio de Sanidad, Servicios Sociales e Igualdad [Sede Web]. Available online: https://www.sanidad.gob.es (accessed on 16 December 2022).
- González-García, P.; Alonso-Sardón, M.; Rodríguez-Alonso, B.; Almeida, H.; Romero-Alegría, Á.; Vega-Rodríguez, V.J.; López-Bernús, A.; Muñoz-Bellido, J.L.; Muro, A.; Pardo-Lledías, J.; et al. How Has the Aspergillosis Case Fatality Rate Changed over the Last Two Decades in Spain? J. Fungi 2022, 8, 576. [Google Scholar] [CrossRef]
- Grau, S. Principales variables que determinan el coste económico en el tratamiento de una infección. Enfermedades Infecc. Microbiol. Clín. 2017, 35, 41–45. [Google Scholar] [CrossRef] [PubMed]
- Llácer, A.; Fernández-Cuenca, R.; Martínez-Navarro, F. Crisis económica y patología infecciosa. Informe SESPAS 2014. Gac. Sanit. 2014, 28, 97–103. [Google Scholar] [CrossRef][Green Version]
- Llamas, J.C.V.; Ruiz-Camps, I. Infección fúngica invasora en los pacientes hematológicos. Enfermedades Infecc. Microbiol. Clín. 2012, 30, 572–579. [Google Scholar] [CrossRef]
- Pérez-Rubio, A.; Platero, L.; Bouza, J.M.E. Gripe estacional en España: Carga clínica y económica y programas de vacunación. Med. Clín. 2019, 153, 16–27. [Google Scholar] [CrossRef]
- Ullmann, A.J.; Aguado, J.M.; Arikan-Akdagli, S.; Denning, D.W.; Groll, A.H.; Lagrou, K.; Lass-Flörl, C.; Lewis, R.E.; Munoz, P.; Verweij, P.E.; et al. Diagnosis and management of Aspergillus diseases: Executive summary of the 2017 ESCMID-ECMM-ERS guideline. Clin. Microbiol. Infect. 2018, 24, e1–e38. [Google Scholar] [PubMed]
- Brown, G.D.; Denning, D.W.; Gow, N.A.R.; Levitz, S.M.; Netea, M.G.; White, T.C. Hidden Killers: Human Fungal Infections. Sci. Transl. Med. 2012, 4, 165rv13. [Google Scholar] [CrossRef] [PubMed]
- Ergün, M.; Brüggemann, R.J.; Alanio, A.; Dellière, S.; van Arkel, A.; Bentvelsen, R.G.; Rijpstra, T.; van der Sar-van der Brugge, S.; Lagrou, K.; Janssen, N.A.; et al. Aspergillus Test Profiles and Mortality in Critically Ill COVID-19 Patients. J. Clin. Microbiol. 2021, 59, e01229-21. [Google Scholar] [CrossRef] [PubMed]
- Morales, M.A.A. Consecuencias de la covid-19 en la economía y las finanzas públicas en México: Más allá de la pandemia. El Trimest. Econ. 2022, 89, 829–864. [Google Scholar] [CrossRef]
- Flores, A.M.M.; Bonifaz, S.D.B.; Sobrino, J.L.B. Assessment of Three Risk Adjustment Systems as Predictors of the Consumption of Medicines and Medical Supplies at Polyvalent Hospitalization Units. Spain Rev. Española Salud Publica 2016, 90, e1–e10. [Google Scholar]
- Zlotnik, A.; Cuchi, M.A.; Pérez, M.C.P. Lifting the weight of a diagnosis-related groups family change: A comparison between refined and non-refined DRG systems for top-down cost accounting and efficiency indicators. Health Inf. Manag. J. 2015, 44, 12–19. [Google Scholar] [CrossRef]
- Krabbe-Alkemade, Y.; Groot, T. Performance differences between the episode-based DBC and diagnosis-related DRG case mix systems. Maandbl. Voor Acc. Bedrijfsecon. 2017, 91, 224–235. [Google Scholar] [CrossRef]
- Špacírová, Z.; Epstein, D.; Espín, J. Are costs derived from diagnosis-related groups suitable for use in economic evaluations? A comparison across nine European countries in the European Healthcare and Social Cost Database. Eur. J. Health Econ. 2022, 23, 1563–1575. [Google Scholar] [CrossRef] [PubMed]
- Folguera, J.; Buj, E.; Monterde, D.; Carot-Sans, G.; Cano, I.; Piera-Jiménez, J.; Arrufat, M. Retrospective analysis of hospitalization costs using two payment systems: The diagnosis related groups (DRG) and the Queralt system, a newly developed case-mix tool for hospitalized patients. Health Econ. Rev. 2024, 14, 45. [Google Scholar] [CrossRef]
Disclaimer/Publisher’s Note: The statements, opinions and data contained in all publications are solely those of the individual author(s) and contributor(s) and not of MDPI and/or the editor(s). MDPI and/or the editor(s) disclaim responsibility for any injury to people or property resulting from any ideas, methods, instructions or products referred to in the content. |
© 2024 by the authors. Licensee MDPI, Basel, Switzerland. This article is an open access article distributed under the terms and conditions of the Creative Commons Attribution (CC BY) license (https://creativecommons.org/licenses/by/4.0/).