Project Report

Environmental Factors Drive the Biogeographic Pattern of Hippophae rhamnoides Root Endophytic Fungal Diversity in the Arid Regions of Northwest China

College of Agriculture and Animal Husbandry, Qinghai University, Xining 810016, China
*
Author to whom correspondence should be addressed.
J. Fungi 2024, 10(10), 679; https://doi.org/10.3390/jof10100679
Submission received: 16 July 2024 / Revised: 7 September 2024 / Accepted: 27 September 2024 / Published: 29 September 2024
(This article belongs to the Section Fungal Evolution, Biodiversity and Systematics)

Abstract

:
Hippophae rhamnoides subsp. sinensis Rousi (Abbrev. H. rhamnoides) stands as a vital botanical asset in ameliorating the ecological landscape of the arid regions in Northwest China, where its rhizospheric microorganisms serve as linchpins in its growth and developmental dynamics. This study aimed to explore the community structure characteristics and origin differences of root endophytic fungi in H. rhamnoides. Samples were collected from 25 areas where H. rhamnoides is naturally distributed along an altitude gradient in the northwest region. Then, endophytic fungi from different regions were analyzed by using high-throughput sequencing technology to compare the structural characteristics of endophytic fungi and examine their association with environmental factors. FUNGuild was employed to analyze the community structure and functions of endophytic fungi, and the results showed that each region had its own dominant endophytic fungal flora, demonstrating the differences in origin of endophytic fungi, and the specific endophytic flora acquired from the original soil in the growing season of H. rhamnoides will help us construct the microecological community structure. Furthermore, the study identified and assessed the diversity of fungi, elucidating the species structure and highlighting dominant species. The RDA analysis revealed that available phosphorus (AP), available potassium (AK), and total nitrogen (TN) exhibit significant correlations with the composition and diversity of root-associated fungi. In conclusion, the fungal community structure is similar within the same region, while significant differences exist in the taxonomic structure and biodiversity among different regions. These findings shed light on the intricate interplay and mechanisms governing the ecological restoration of H. rhamnoides, offering a valuable framework for advancing green ecology initiatives and harnessing the potential of root-associated microorganisms in this species.

1. Introduction

Plant roots play a crucial role in ecological processes, which are widely perceived as contributing to plant health, growth, and biogeochemical cycles [1,2]. Endophytic fungi refers to fungi that live in plant tissues at specific or all stages of their life cycle but do not cause obvious harm to the plant [3,4]. Fungi in the rhizosphere play a crucial role in how plants cope with abiotic stresses caused by pathogenic bacteria [5,6,7] by improving the molecular exchange between soil microorganisms and root exudates, ultimately supporting healthy plant growth and triggering systemic resistance [8]. Root–microbe symbiotic relationships are key components of soil ecosystems [9], in which soil serves as the primary reservoir for numerous plant endophytes [10], and compounds released by plant roots have the ability to attract particular populations in the soil to the rhizosphere, leading to the formation of a rhizosphere microbial community closely intertwined with plants [11,12], so that the interactions among plants, microbes, and soil create a distinct soil ecosystem, offering a specialized growth environment conducive to plant development [13].
Previous studies have indicated that factors such as altitude, climate, soil variables, and vegetation characteristics significantly influence the composition and diversity of root endophytic fungal communities [14,15,16,17,18]. For instance, altitude can impact the diversity of root endophytic fungal communities, with noticeable differences along altitude gradients. Other factors, such as soil properties, climate, and vegetation, also affect the composition of fungi in plant rhizomes. Overall, there are varying degrees of correlation between geographical and climatic factors and the diversity of active ingredients in plants and fungi found within plant rhizomes. The environment plays a crucial role in determining the composition of fungi on a continental scale [19,20,21,22]. Root fungi exhibit similarities to soil microorganisms and respond quickly to soil microenvironments. Additionally, the fungi in plant rhizomes are not only influenced by the environment itself but also by plant types and genotypes [23]. As a more specialized environment, rhizomes exert a stronger selective pressure on fungal communities. Root-associated fungi facilitate nutrient absorption for plants, provide defense against pathogenic microorganisms, and regulate plant growth and development in response to the surrounding soil microenvironment [12,24].
Hippophae rhamnoides, a plant belonging to the genus Hippophae in the family Elaeagnaceae, is a pioneer tree species customarily used for afforestation in arid regions [25]. Its native drought-tolerant nature has made it particularly popular in Northwest China and has garnered significant attention from scientific researchers in recent years [26,27,28]. While some studies have investigated the rhizosphere soil microorganisms of H. rhamnoides [29,30,31], research on the endophytic fungi within its roots remains limited. Current studies primarily focus on the edible [32] and ecological [33,34] values of H. rhamnoides. The microecological structure of its rhizomes is largely unexplored, and the correlation with environmental factors has yet to be thoroughly investigated. This study endeavors to conduct an analysis and comparison of natural populations of H. rhamnoide across 25 research sites situated in the arid regions of Northwest China, employing advanced high-throughput sequencing technology (ITS) in conjunction with the FUNGuild database. This study will use high-throughput sequencing and bioinformatics to analyze root endophytic fungi, focusing on their community structure, functional characteristics, network relationships, and environmental associations. The anticipated findings are expected to deepen our understanding of the diversity and resources of H. rhamnoides endophytic fungi, providing a theoretical foundation for exploring cultivable microbial resources, maintaining healthy growth of H. rhamnoides, and preventing root diseases. Furthermore, this research will enhance our understanding of how environmental factors influence fungal communities impacting the growth and development of H. rhamnoides, thereby offering insights for green ecological protection, vegetation restoration, and the development and utilization of functional flora in the northwest region.

2. Materials and Methods

2.1. Sample Collection

Root samples of H. rhamnoides were collected from 25 distinct locations across the arid regions of Northwest China, encompassing Qinghai, Gansu, and Xinjiang, where the species naturally proliferates. The sites ranged in latitude from 32°87′ N to 46°63′ N and in longitude from 85°59′ E to 104°33′ E. Soil and root samples were collected between late June and the end of August 2023 (Figure 1, Appendix A). Three H. rhamnoides plants were randomly obtained from each location, with a minimum distance of greater than 8 m between plants. The H. rhamnoides roots were carefully collected using a sterilized shovel, ensuring the collection of fine roots and surrounding soil. The samples were stored in refrigerators for transportation to the laboratory, where impurities such as plant roots and stones were purified from the soil samples, mixed evenly, and sieved through a 2 mm soil sieve, while rhizomes were temporarily stored in an ice box and promptly brought back to the laboratory. The roots were rinsed with running water, followed by three rinses with sterile water, a 30 s soak in 75% ethanol, another rinse, an 8 min soak in 0.2% KMnO4, and three final rinses with sterile water to remove non-endophytic fungal interference.

2.2. Soil Physicochemical Analyses

The collected soil samples were sieved to remove debris and stored at −20 °C for the determination of their physical and chemical properties. Water content was determined using the drying method (LY/T1213-1999). Soil pH was measured in a 1:2.5 soil-to-water suspension with a pH meter (NY/T 1377-2007) (HSJ-5, INESA Scientific Instrument Co., Ltd., Shanghai, China). Salinity content was determined using the 15% H2O2 dry weight method (LY/T1251-1999). Total nitrogen (TN) was quantified by an elemental analyzer (LY/T1228-2015) (Elementar EL III, Elementar Analysensysteme GmbH, Langenselbold, Germany). Total phosphorus (TP) was determined with the molybdenum–antimony anti-colorimetric method (HJ632-2011) (T6 UV-Vis, Beijing Purkinje General Instrument Co., Ltd., Beijing, China). Available phosphorus (AP) was measured by the molybdenum–antimony anti-colorimetric method (HJ704-2014) (Multiskan GO 1510, Thermo Fisher Scientific, Vantaa, Finland). Available potassium (AK) was tested with a flame photometer (NY/T889-2004) (Licheng WGH6431, INESA Scientific Instrument Co., Ltd., Shanghai, China). Organic matter (OM) was quantified using the potassium dichromate volumetric method (NY/T1121.6-2006) (T6 UV-Vis, Beijing Purkinje General Instrument Co., Ltd., Beijing, China). Total potassium (TK) was measured with a flame photometer (LY/T1234-2015) (T6 UV-Vis, Beijing Purkinje General Instrument Co., Ltd., Beijing, China). Hydrolyzed nitrogen (HN) was determined using the alkaline diffusion method (LY/T1228-2015) (Elementar EL III, Elementar Analysensysteme GmbH, Langenselbold, Germany).

2.3. DNA Extraction, PCR Amplification, and High-Throughput Sequencing

H. rhamnoides root samples from various regions were finely ground into powder using liquid nitrogen, with 0.5 g of the resulting powder used for DNA extraction. The extraction followed the protocols outlined in a plant DNA extraction kit, and each sample was processed in triplicate. DNA concentration and purity were evaluated using 1% agarose gel electrophoresis and a nucleic acid analyzer. High-throughput sequencing was subsequently carried out by Beijing Novogene Bioinformatics Technology Co., Ltd. (Beijing, China), employing the universal primer pair ITS1F/ITS2R to amplify the fungal ITS region (ITS1F: 5′-CTTGGTCATTTAGAGGAAGTAA-3′; ITS2R: 5′-GCTGCGTTCTTCATCGATGC-3′). The PCR amplification reaction (20 μL) consisted of 2 μL of 10× Buffer, 2 μL of 2.5 mmol/L dNTPs, 0.8 μL each of the forward and reverse primers, 0.2 μL of rTaq polymerase, 0.2 μL of BSA, 10 ng of template DNA, and ddH2O to a total volume of 20 μL. The thermal cycling conditions were as follows: an initial denaturation at 95 °C for 3 min; 35 cycles of 95 °C for 30 s, 55 °C for 30 s, and 72 °C for 45 s; and a final extension at 72 °C for 5 min, with storage at 4 °C.

2.4. Statistical Analysis

Environmental factor data for bio1 (annual mean temperature) and bio12 (annual precipitation) were downloaded from the WorldClim website (https://www.worldclim.org/) (accessed on 12 May 2024) at a spatial resolution of 30 arc-seconds to analyze the correlation between these factors and root endophytic fungi. Initially, the original data for each sample were processed by splitting according to the barcode and subsequently removing the barcode and primers. PCR products were then detected, quantified, and used to construct the MiSeq library for Illumina MiSeq PE300 high-throughput sequencing. The R1 and R2 sequence data were then merged using FLASH v1.2.11 software. Quality control was conducted on the merged tags to obtain clean tags, and chimeras were filtered out to yield effective tags for further analysis. The DADA2 algorithm was employed to denoise the effective tags, resulting in the final amplicon sequence variants (ASVs). These ASVs underwent species annotation using the classify-sklearn algorithm in QIIME v2.0, employing a pre-trained naive Bayes classifier for each ASV, and species richness tables were subsequently generated at different classification levels using the software.
Statistical analysis of the sample community composition was performed at various taxonomic levels (kingdom, phylum, class, order, family, genus, and species). Subsequently, dilution curves, relative abundance heat maps, sample distance heat maps [35], and PCoA maps were generated using R4.0.3 software [36]. Functional prediction analysis of fungi was carried out using FUNGuild 1.0, and significant difference analysis of soil physical and chemical properties was performed using SPSS v21.

3. Results

3.1. Analysis of Soil Physicochemical Properties

The analysis of the physical and chemical properties of H. rhamnoides rhizosphere soil across different regions indicates that, except for the PA, GH, and Z3 areas, where the soil pH is mildly acidic, the soil in other regions is predominantly alkaline. Additionally, the northwest region is characterized by arid conditions and low rainfall, resulting in generally low soil water content and high salt levels, as shown in Table 1. Analysis revealed significant correlations between various environmental factors and the pH value, longitude, latitude, and altitude of the sampling points. Specifically, pH values were significantly correlated with TN, HN, TP, and OM across all regions. Longitude showed a significant correlation with AMP, while latitude was significantly correlated with both AMP and AMT. Altitude demonstrated significant correlations with TP, AK, AMP, and AMT. This demonstrates that soil composition varies significantly with changes in geographical environment, leading to variations in physical and chemical properties across different regions.

3.2. Quality Analysis of Fungal ITS Sequencing Results

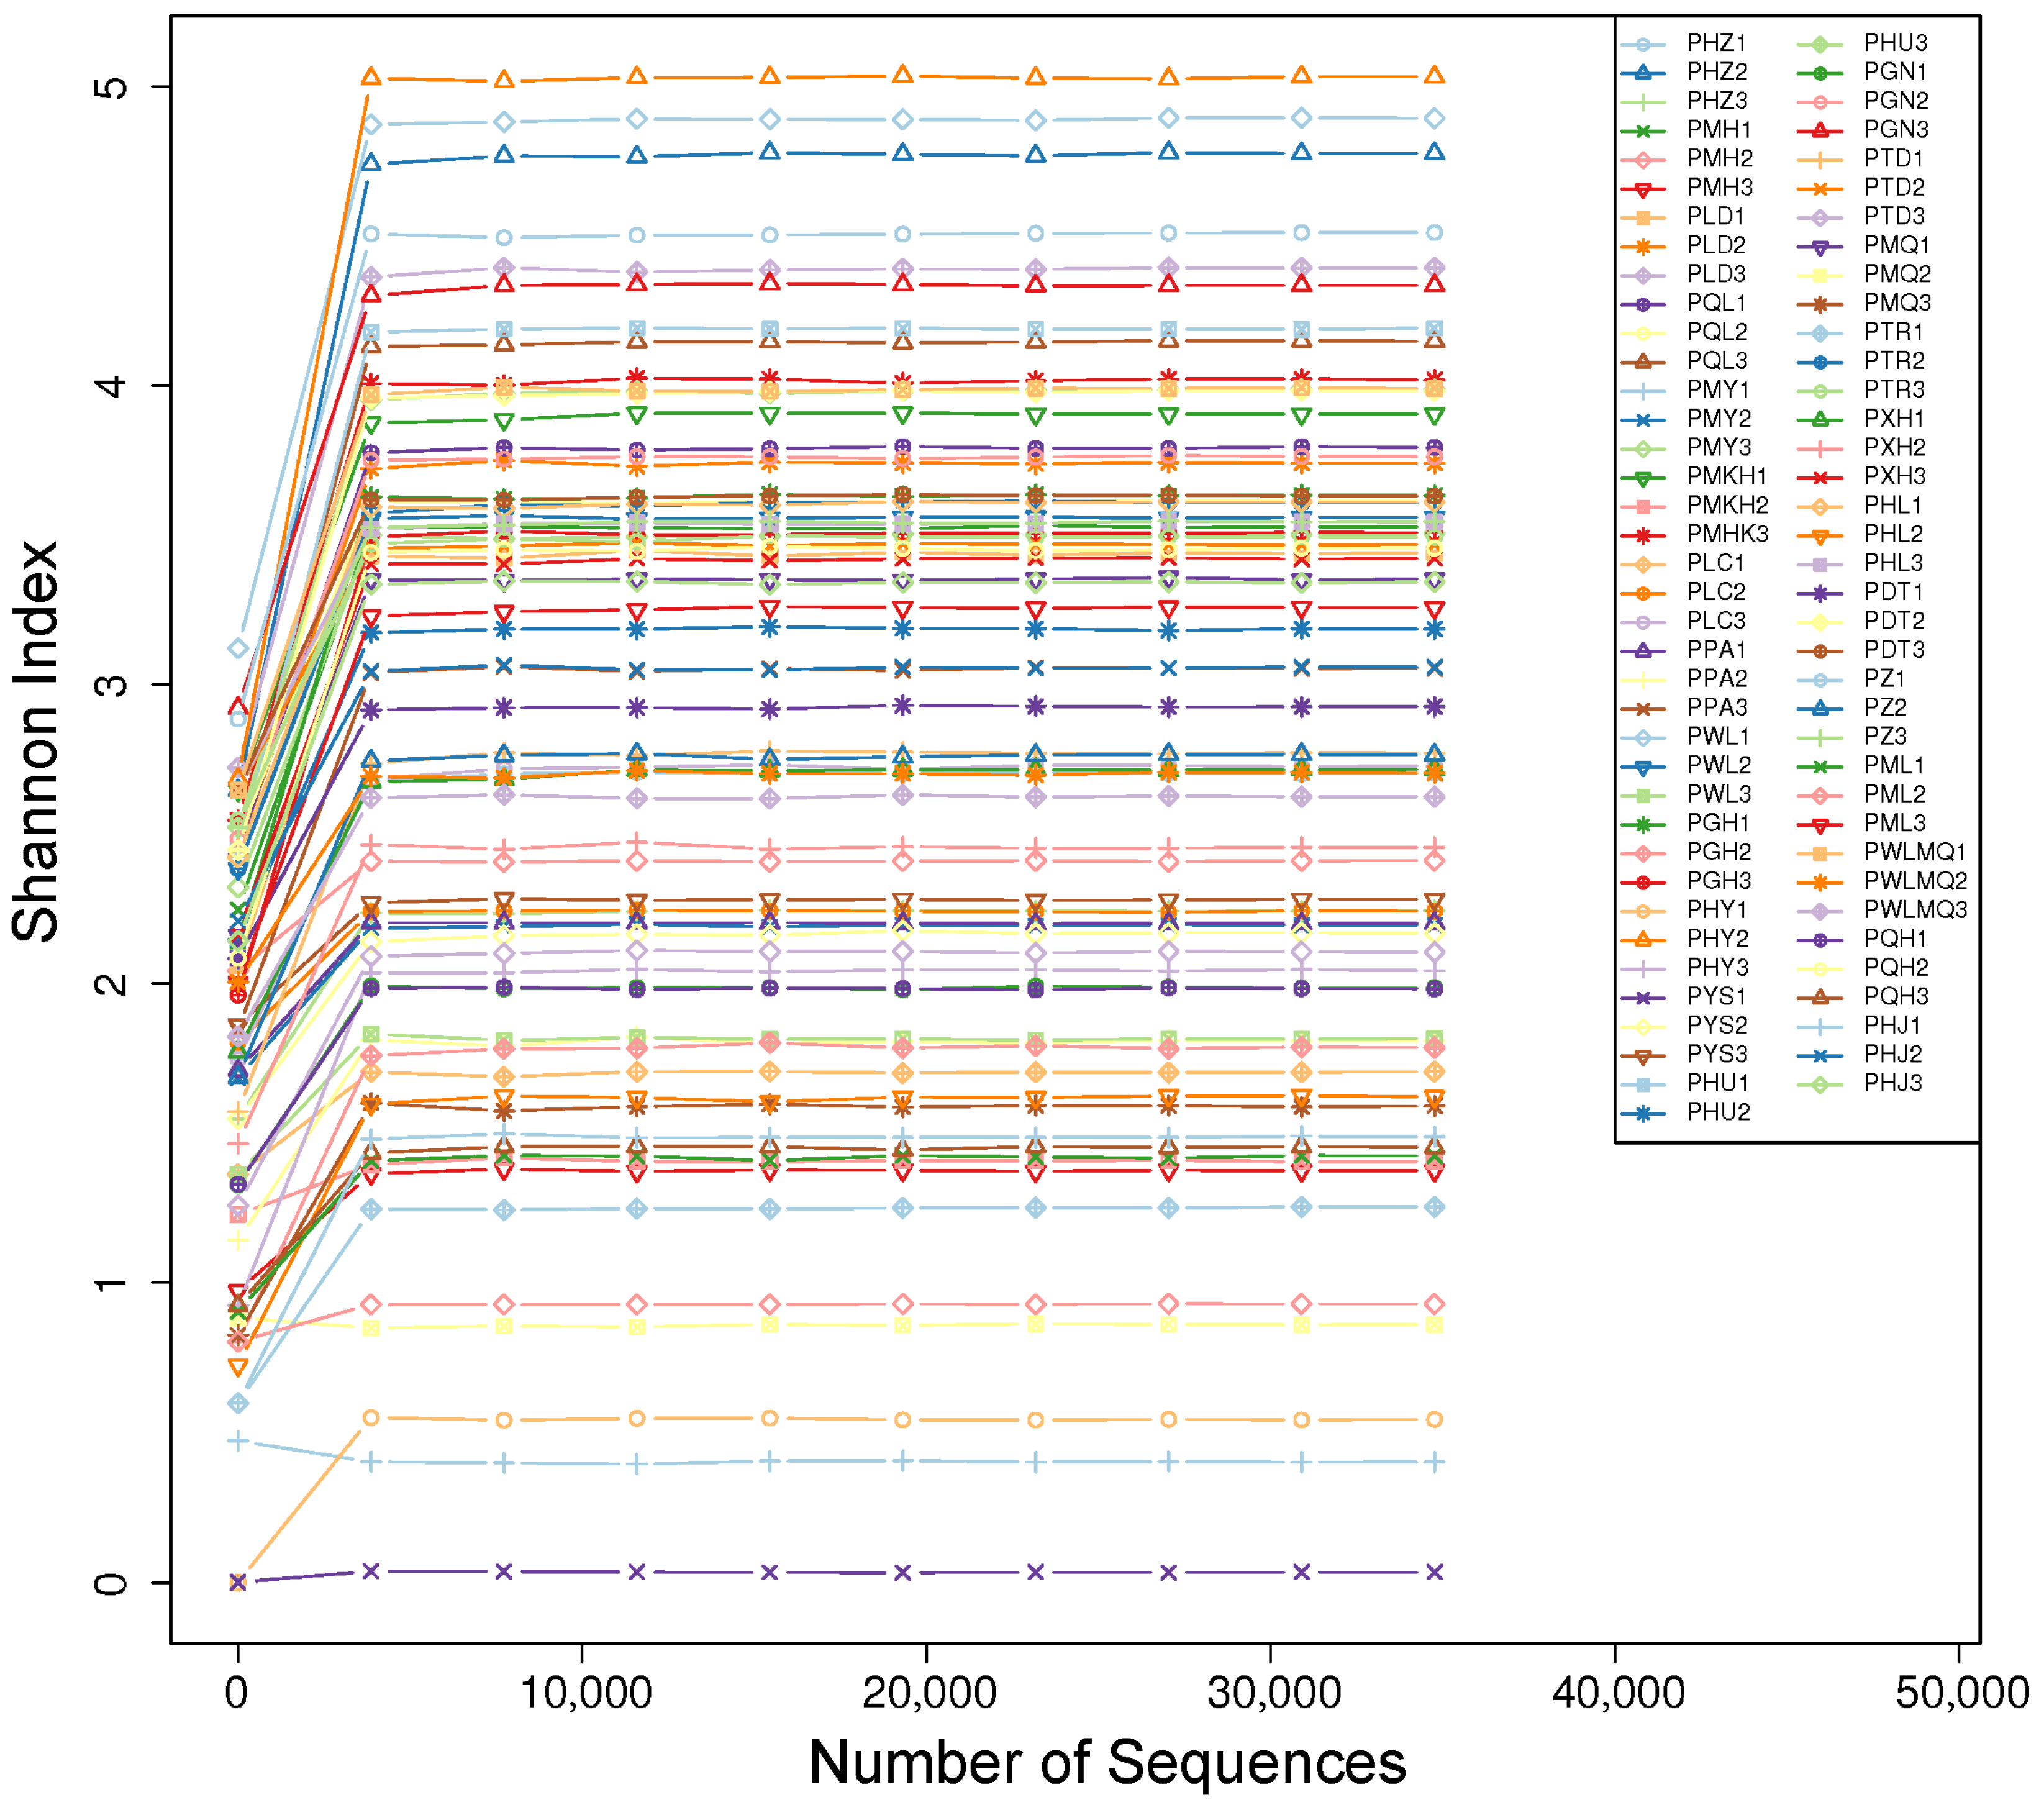
High-throughput sequencing of 75 H. rhamnoides rhizome samples from 25 distinct locations in the arid regions of Northwest China yielded a total of 2,161,934 optimized sequences with an average length of 224 bp. After denoising with the DADA2 method, each unique sequence is referred to as an ASV (amplicon sequence variant), which replaces OTUs (operational taxonomic units) to enhance the accuracy, comprehensiveness, and reproducibility of marker gene data analysis. Significant differences in ASV composition across different regions are shown in Table 2. Constructing a rarefaction curve at 100% similarity is a common method for assessing sample diversity within a group. The rarefaction curve (Figure 2) shows a gradual plateau as the number of extracted sequences increases, indicating that the sample size is sufficient. Further increasing the sequencing data may only capture a few low-abundance species, suggesting that the current sequencing results can realistically represent the fungal community in H. rhamnoides rhizosphere samples.

3.3. Venn Diagram Analysis

Notably, endophytic fungi in H. rhamnoides were significantly more abundant in high-altitude areas than in low-altitude areas. The study identified the top ten regions by ASV sequence richness as follows: P19, P6, P13, P21, P18, P4, P11, P1, P20, and P14. The altitude gradient in the study ranged from 1106.3 m to 3665.0 m. Low-altitude areas include P25, P24, P23, P7, and P17, with ASV values of 132, 157, 149, 120, and 159, respectively; high-altitude areas consist of P15, P5, P6, P14, and P12, with ASV values of 146, 154, 190, 202, and 116, respectively. P8, P18, P21, P13, and P9 were chosen based on a 100 m gradient, representing mid-altitude areas, with ASV values of 132, 256, 257, 266, and 200. The Venn diagram constructed based on different altitudes (Figure 3) indicates that P6 and P14, ranking second and tenth in ASV sequence richness, are the two high-altitude regions among the top ten. The total ASV species richness in rhizomes in mid-altitude areas was found to be higher compared to high-altitude and low-altitude areas. The study observed an initial increase followed by a decrease in fungal richness as altitude increased. High-altitude areas exhibited a larger difference in ASV species richness, while low-altitude areas showed a smaller difference.

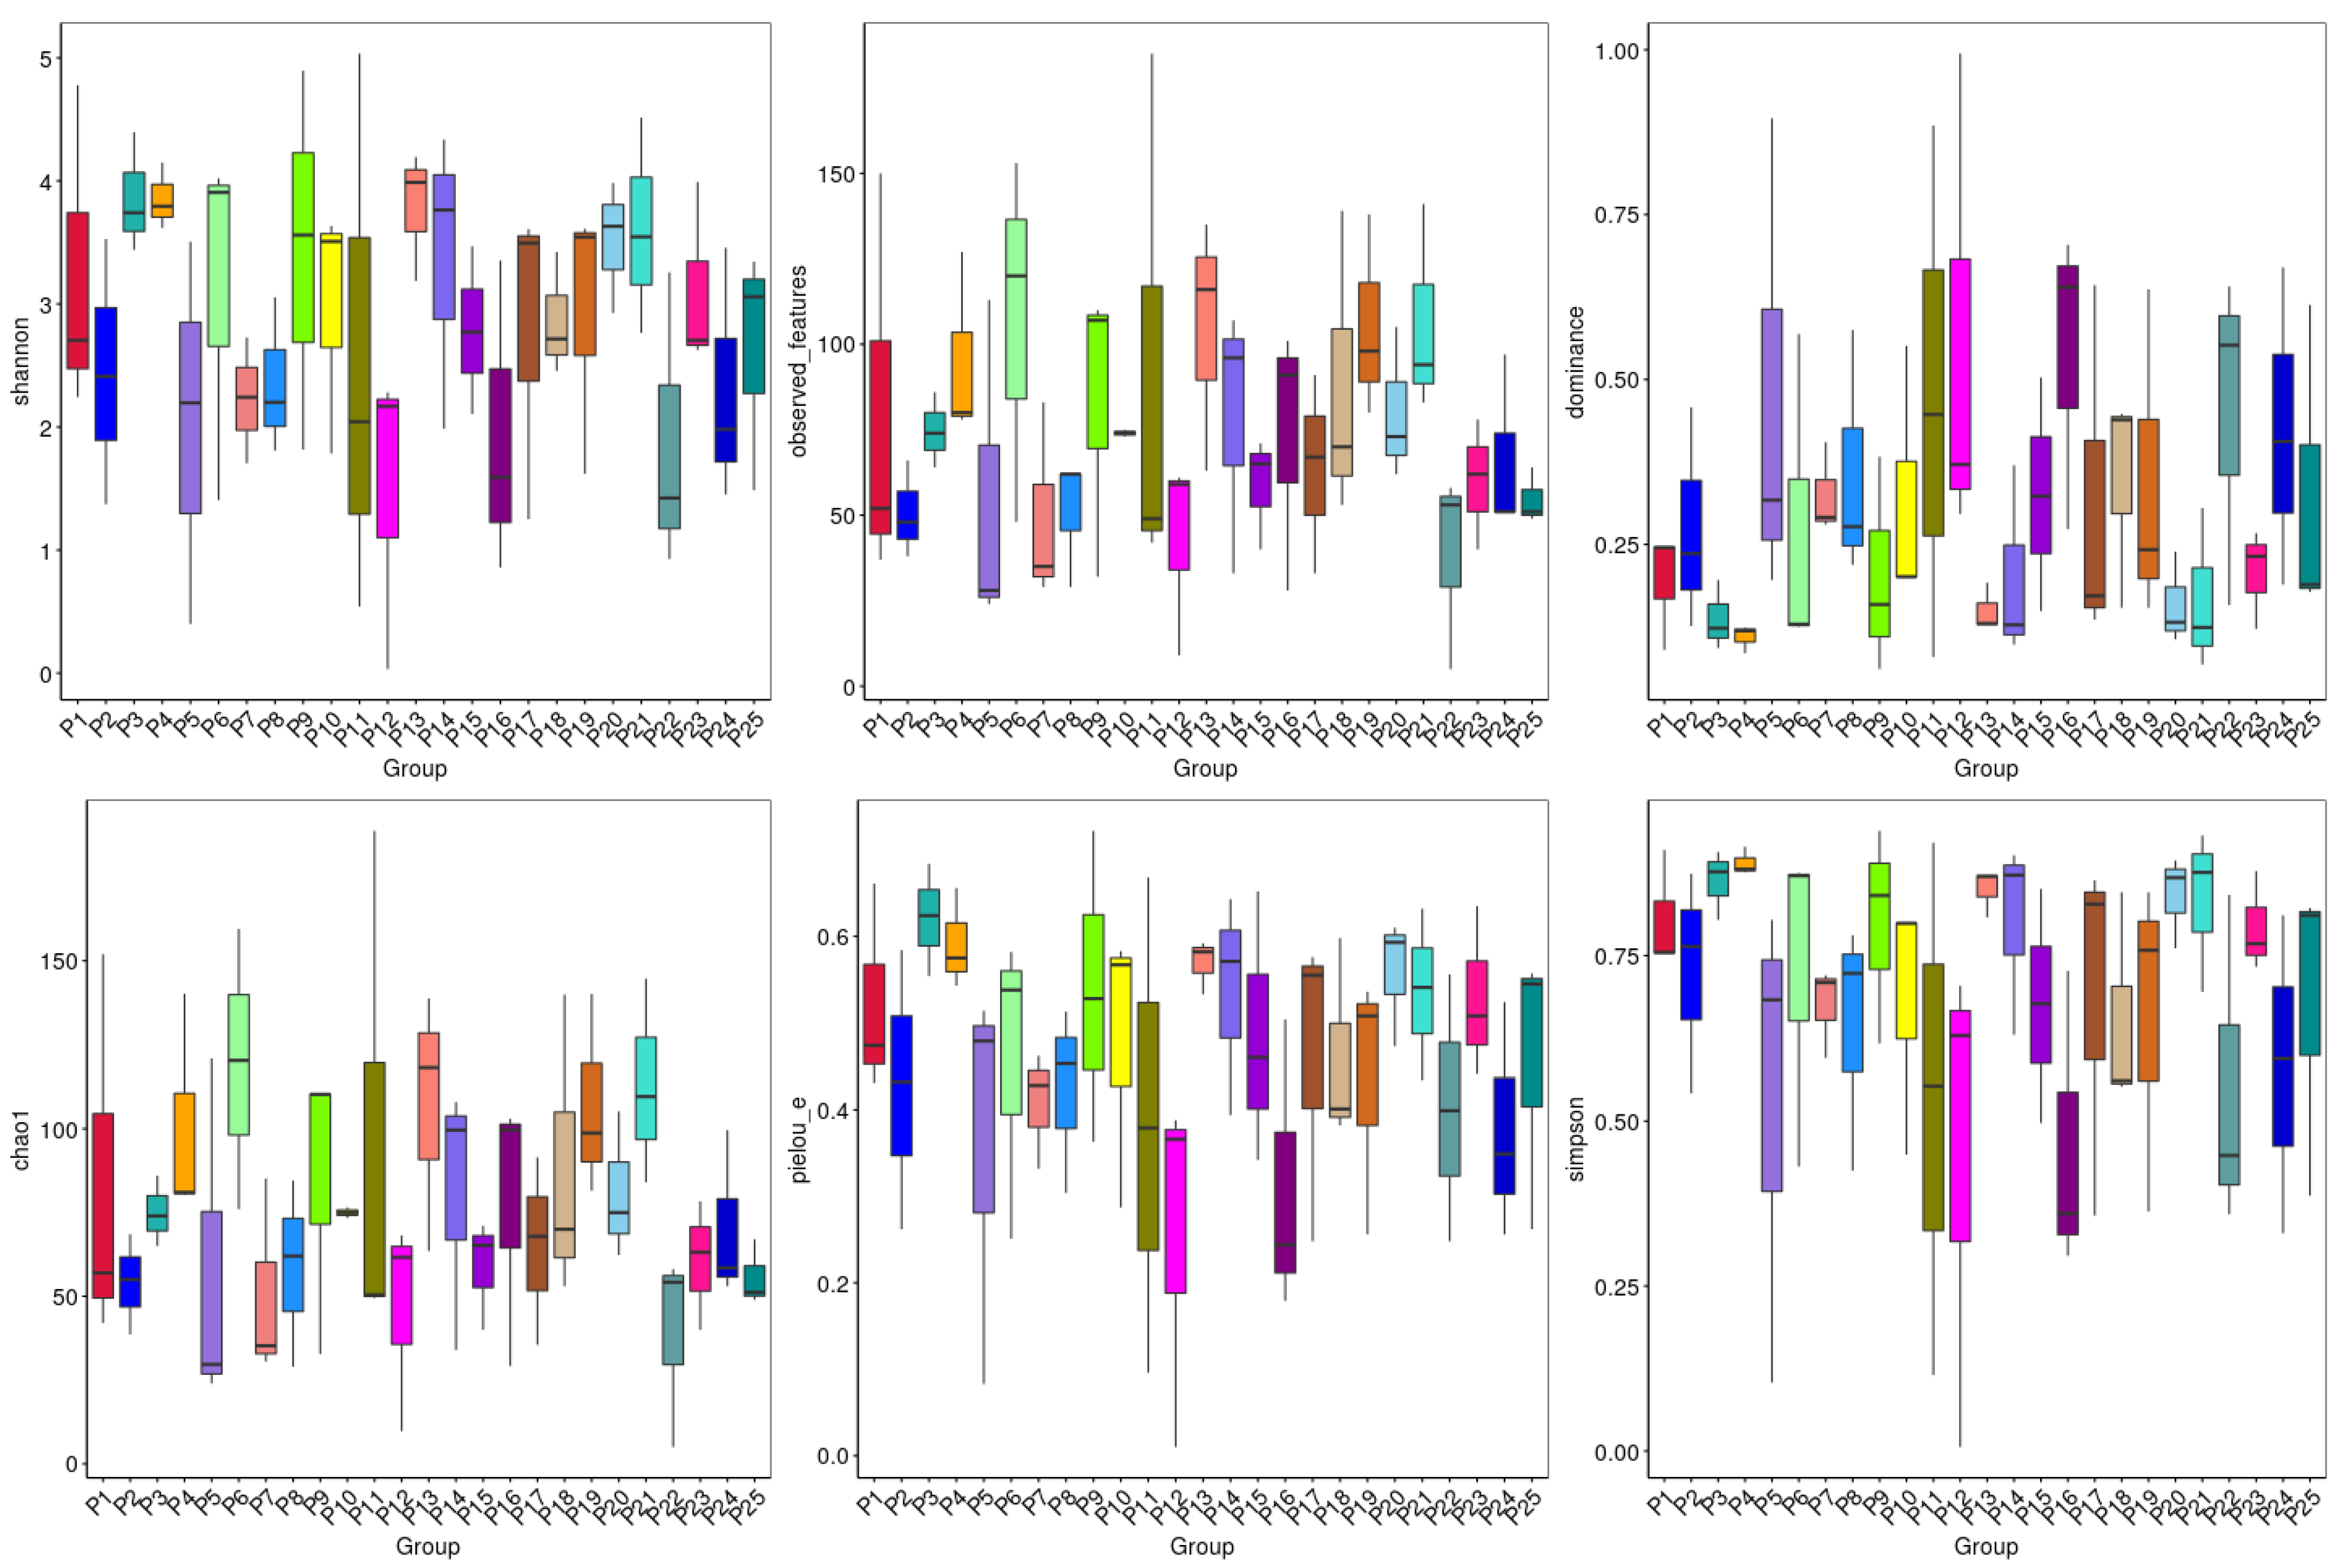
3.4. Alpha Diversity Analysis

Alpha diversity analysis assesses differences in fungus abundance and diversity among groups across various regions. The diversity index analysis of the sequencing results for each sample in this study is depicted in Figure 4 and Table 3. The alpha diversity index was employed for all samples. The Chao1 index indicates fungal community richness, with higher values signifying greater richness. The Shannon and Simpson indices reflect community diversity: higher Shannon index values indicate higher community diversity, whereas higher Simpson index values correspond to lower diversity. Coverage represents the community coverage rate.
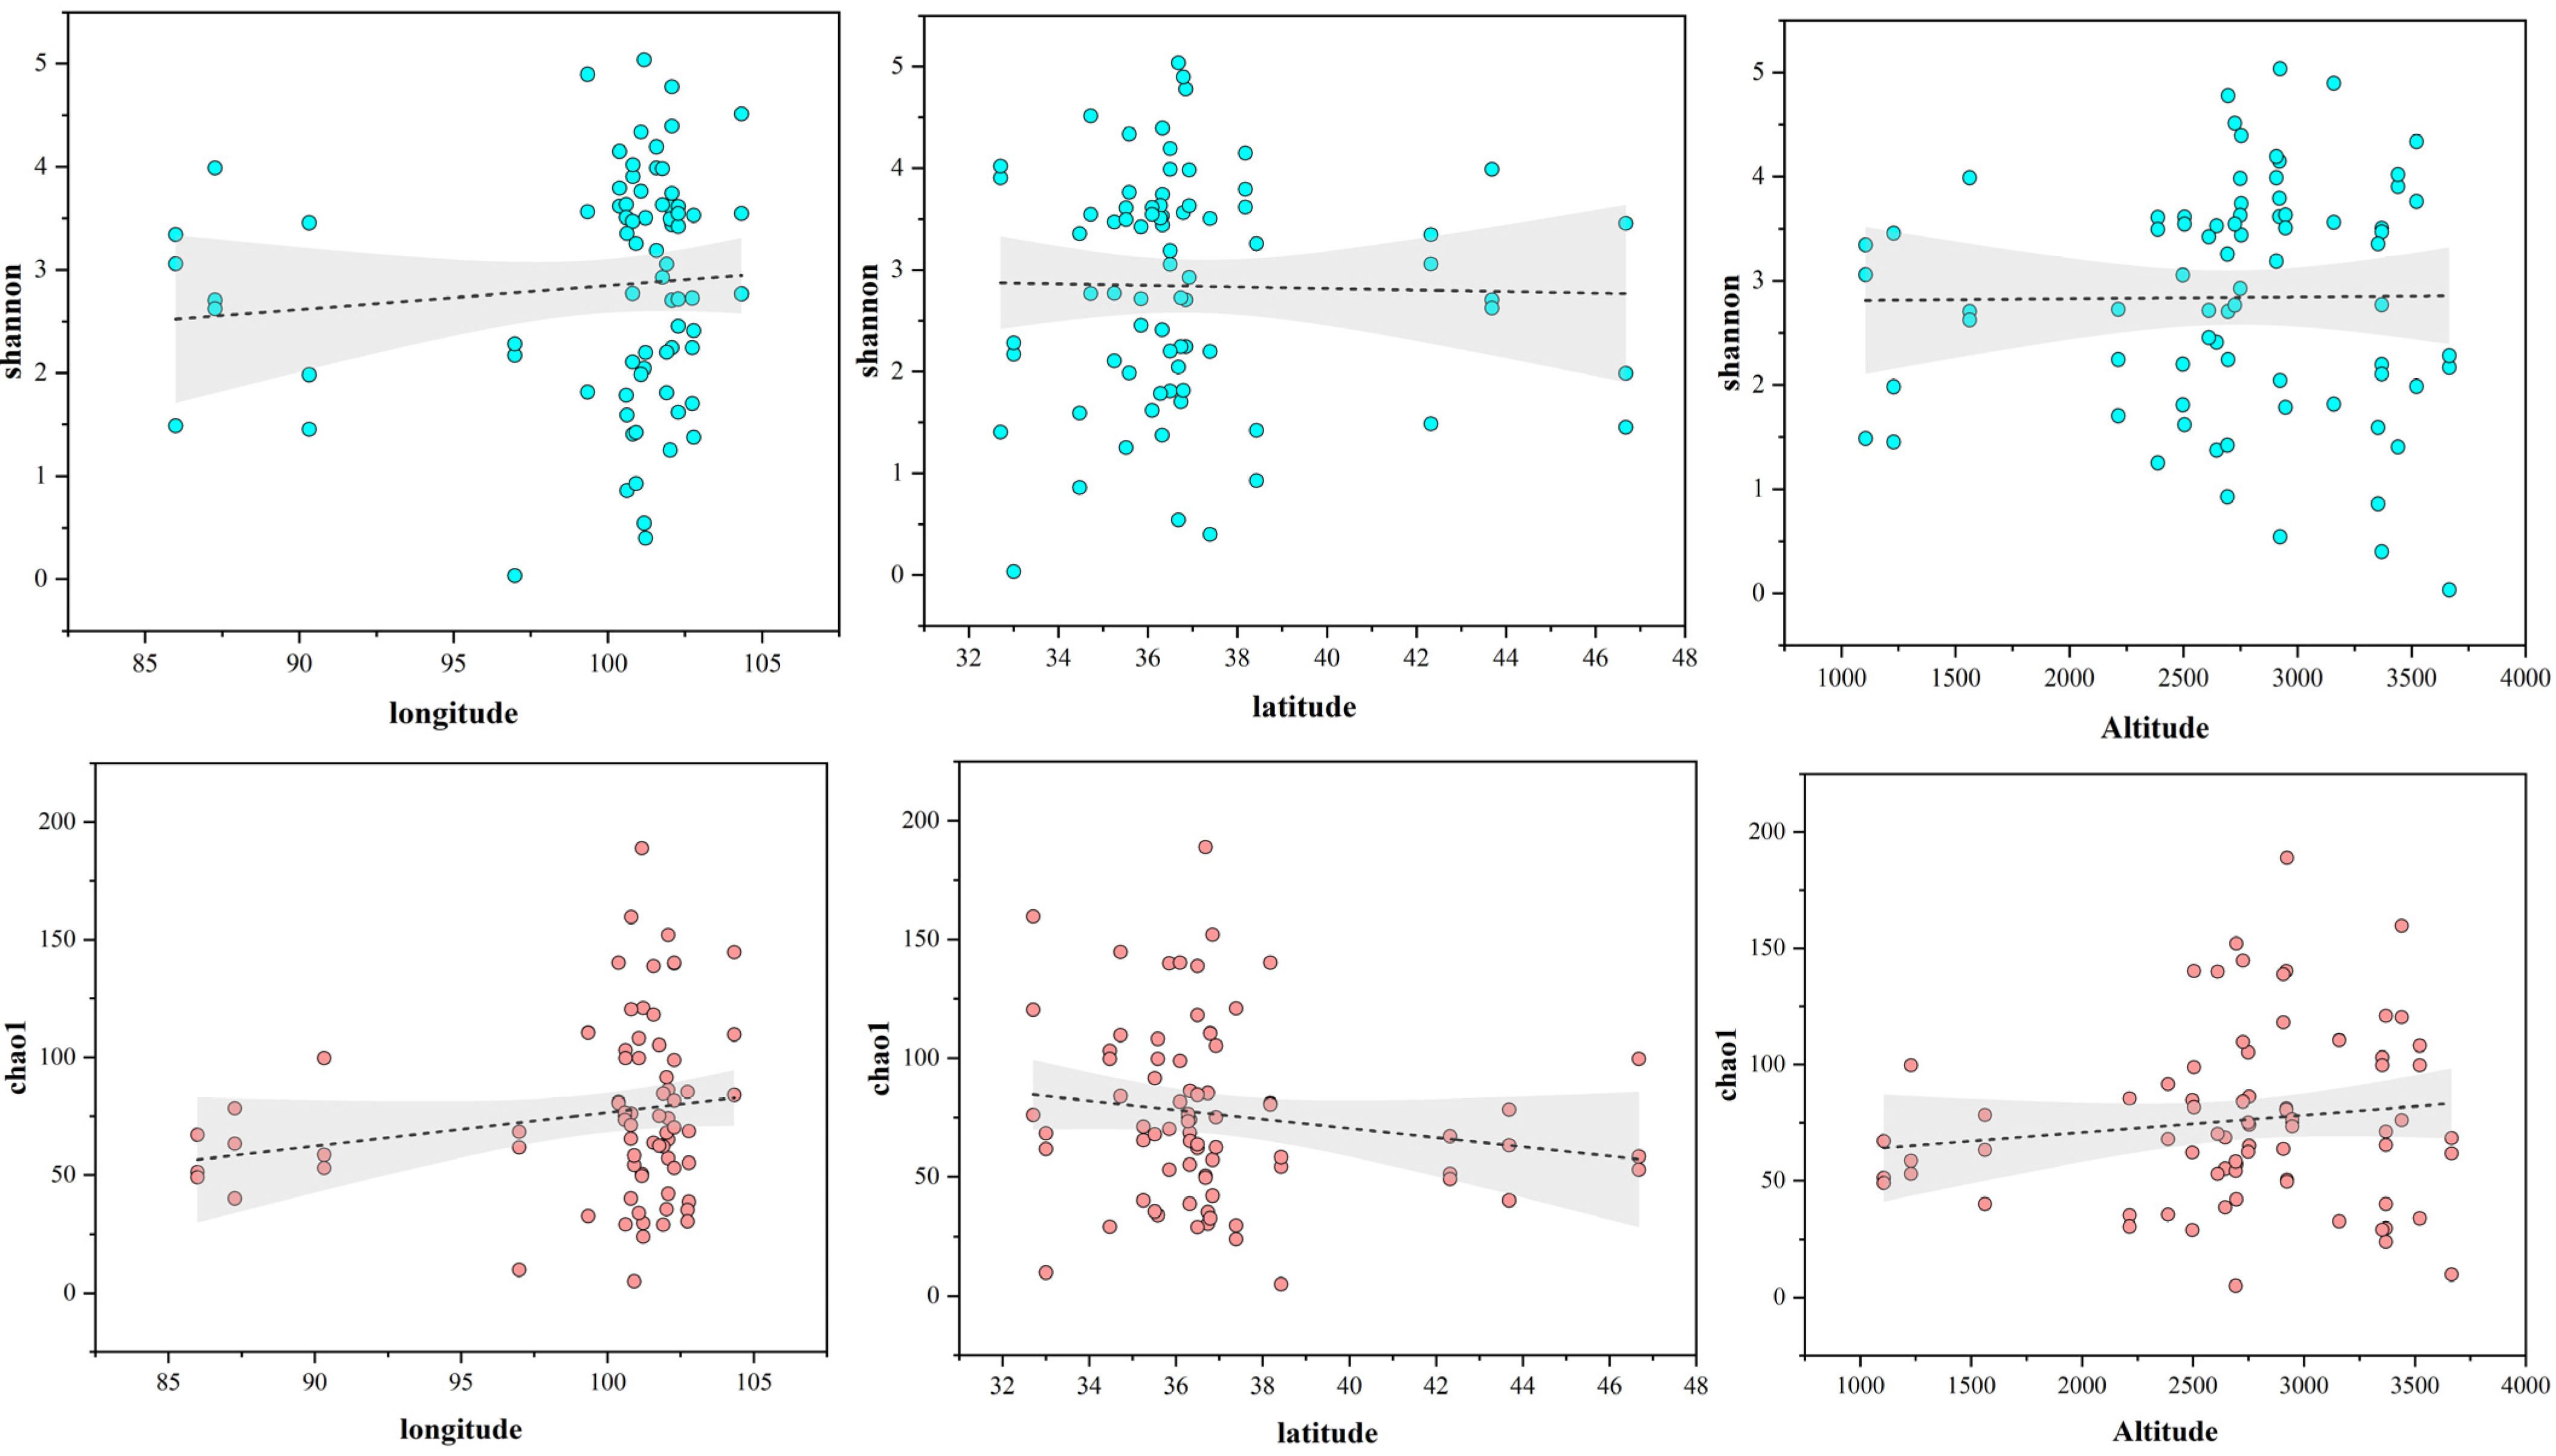
The research findings indicate that the sequencing depth of each sample is satisfactory, with a coverage index exceeding 99%, indicating sufficient detection for community diversity analysis. With increasing altitude, the Chao1 index initially rises and then declines, indicating a moderate increase in microbial abundance. Similarly, the Shannon index initially increases and then decreases with altitude, while the Simpson index exhibits an opposite trend. In terms of pH variation, the soil pH ranges between 6.46 and 8.72 (Table 1). The Chao1 index initially decreases and then rises, plummeting at a pH of 8.05 and sharply increasing at 8.28 (Table 3). Concurrently, the Shannon index also rises. Fungal diversity within H. rhamnoides rhizomes across 25 regions varies, with HL exhibiting the highest richness and ML the lowest; QL shows the highest community diversity and ML the lowest. Regional analysis reveals generally high fungal community diversity and richness across samples. Overall, fungal species diversity tends to increase and then decrease with rising altitude (Figure 5). General linear regression is commonly employed to explore the relationship between fungal community alpha diversity and geographical variables such as longitude, latitude, and altitude. The results indicate that the Shannon and Chao1 indices of fungi in H. rhamnoides roots do not exhibit significant correlations with longitude, latitude, or altitude.

3.5. Beta Diversity Analysis

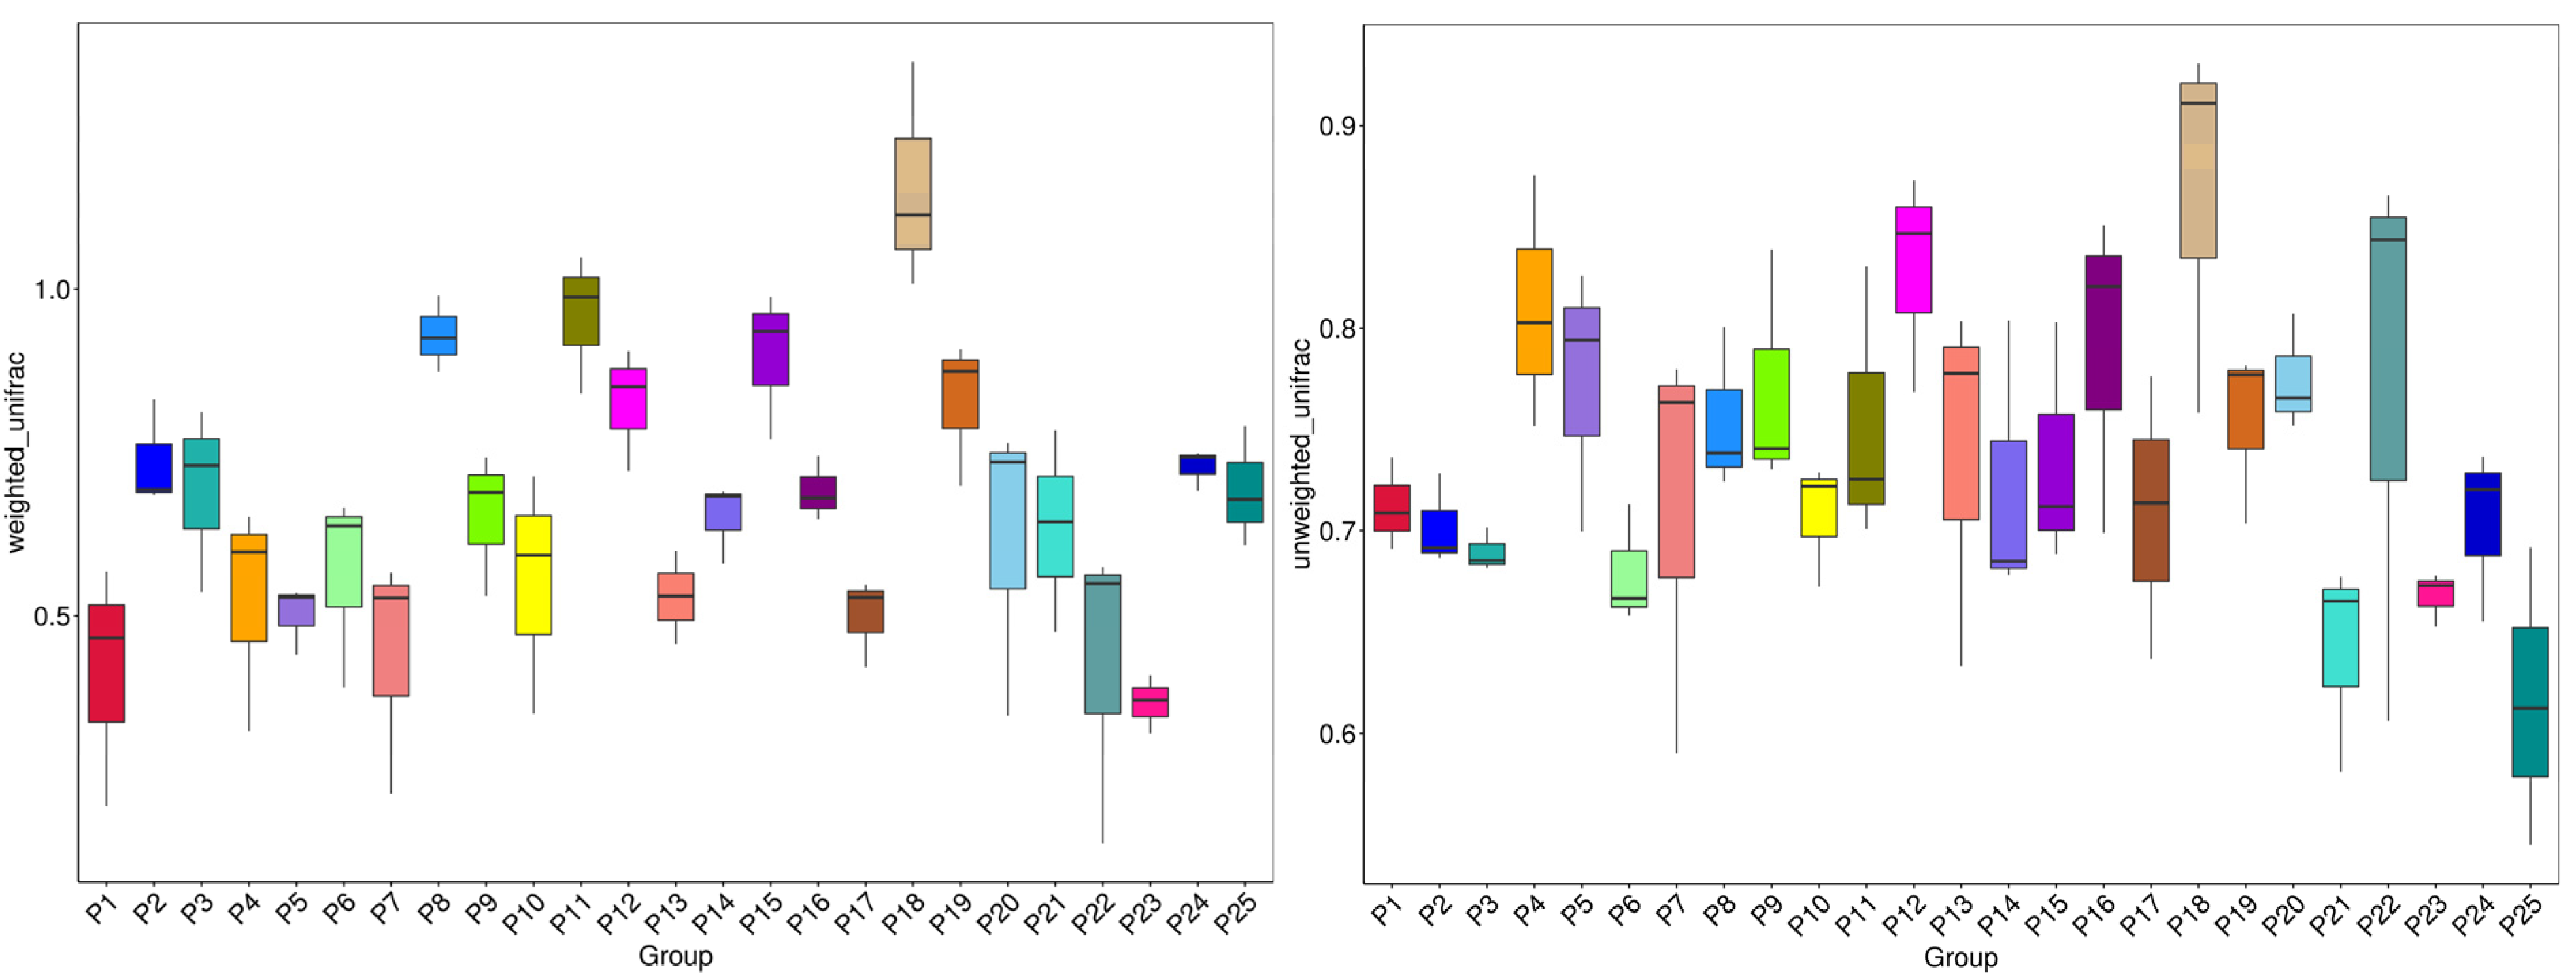
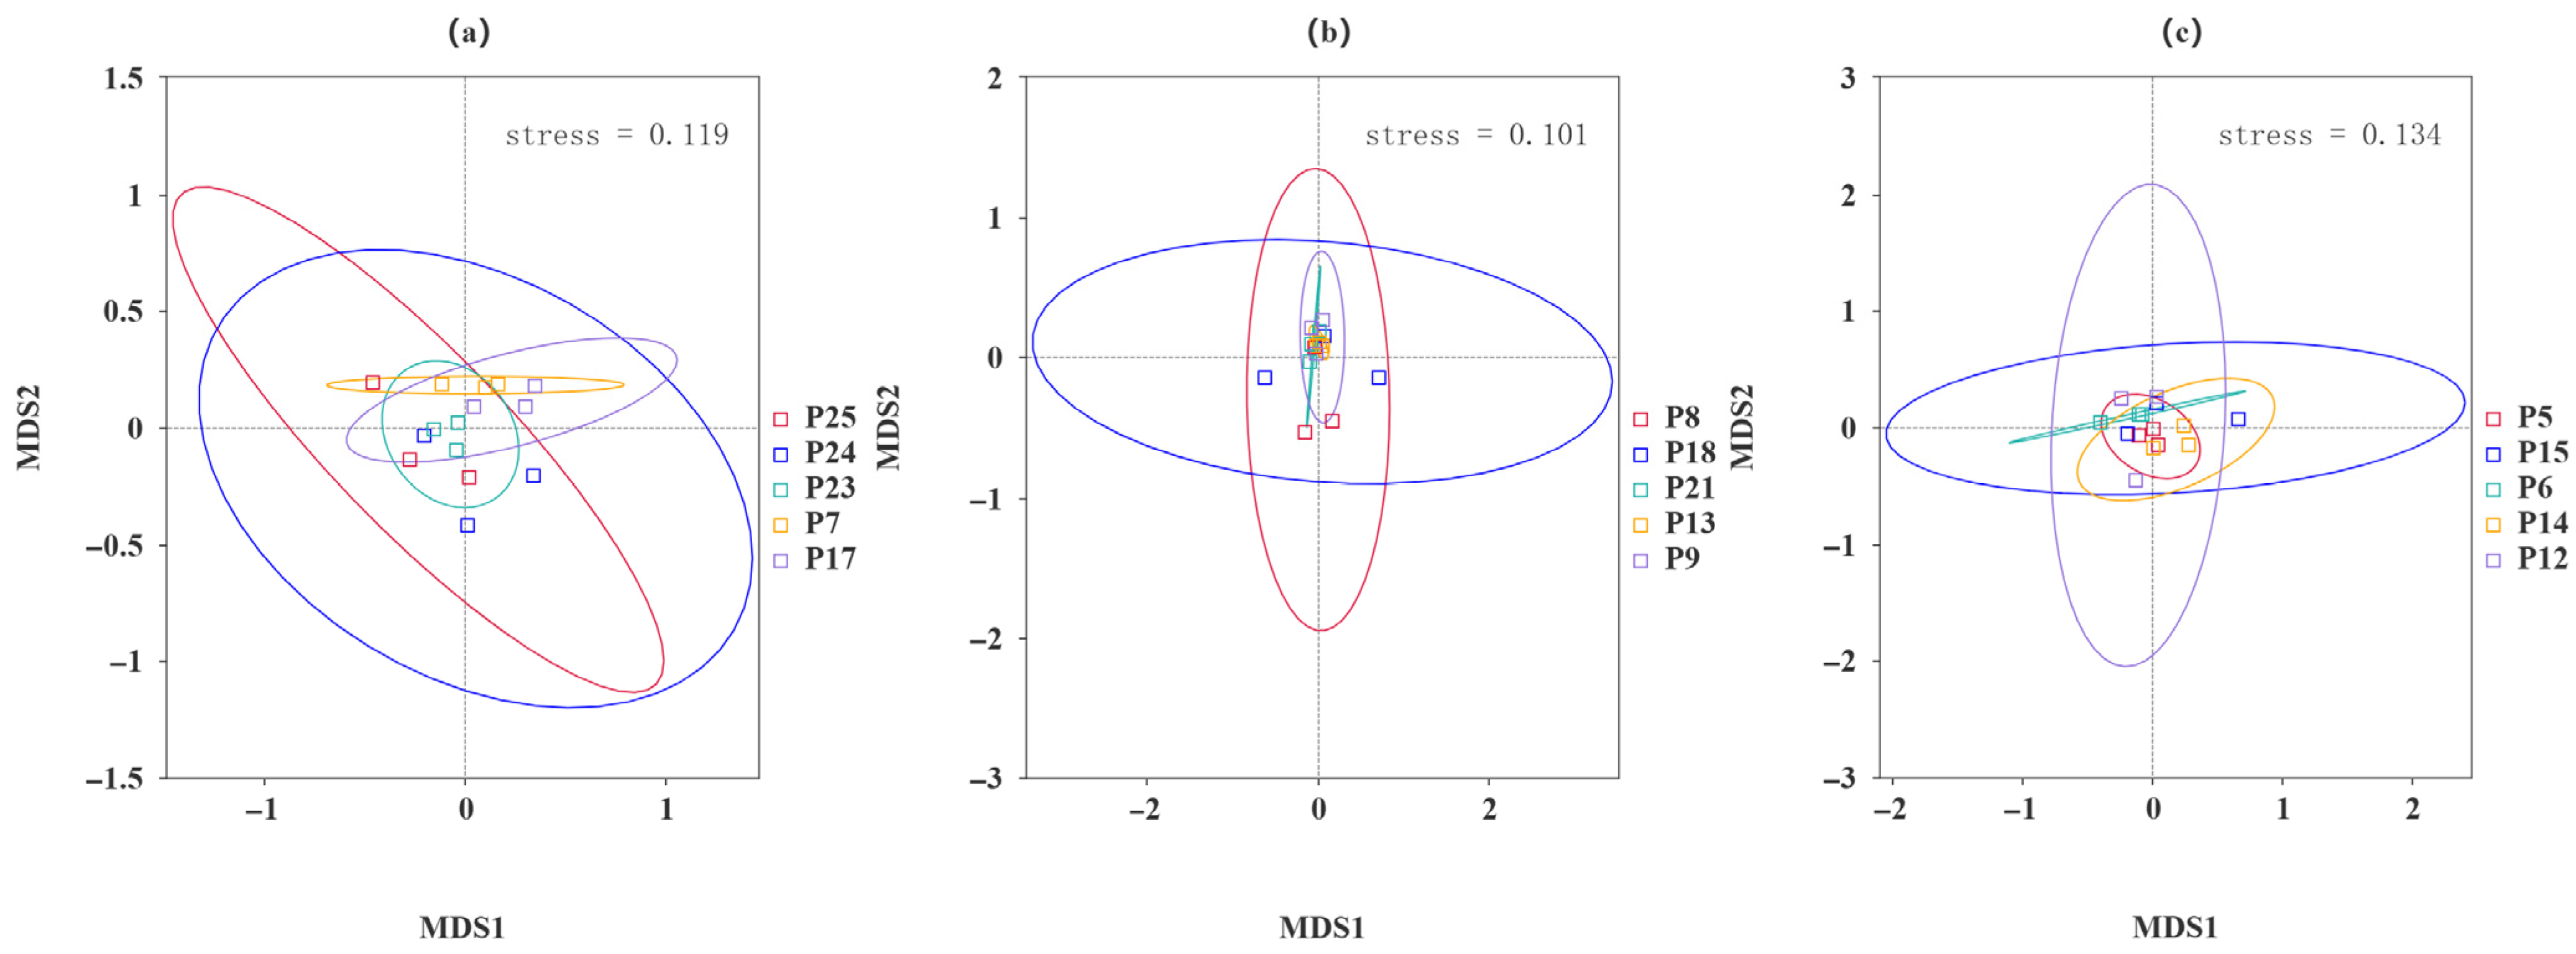
Beta diversity analysis of microbial community composition across samples is a crucial concept in ecology. It compares changes in species diversity among ecological communities. This study utilizes box plots to visualize unweighted Unifrac (Figure 6) [37,38], visually representing the distribution of beta diversity across various communities. The NMDS method is employed to analyze the beta diversity distribution in H. rhamnoides at varying altitudes, specifically focusing on fungi (Figure 7). By observing the distribution of different points in the plot, one can identify the aggregation patterns and diversity differences of fungi at specific altitudes.
The results depicted in Figure 8 illustrate a significant dispersion of samples from high and low altitudes, indicating notable differences and a lack of similarity in the fungal composition of the rhizomes. Conversely, samples from lower-altitude regions exhibit closer clustering, suggesting a relatively similar fungal composition in their roots.
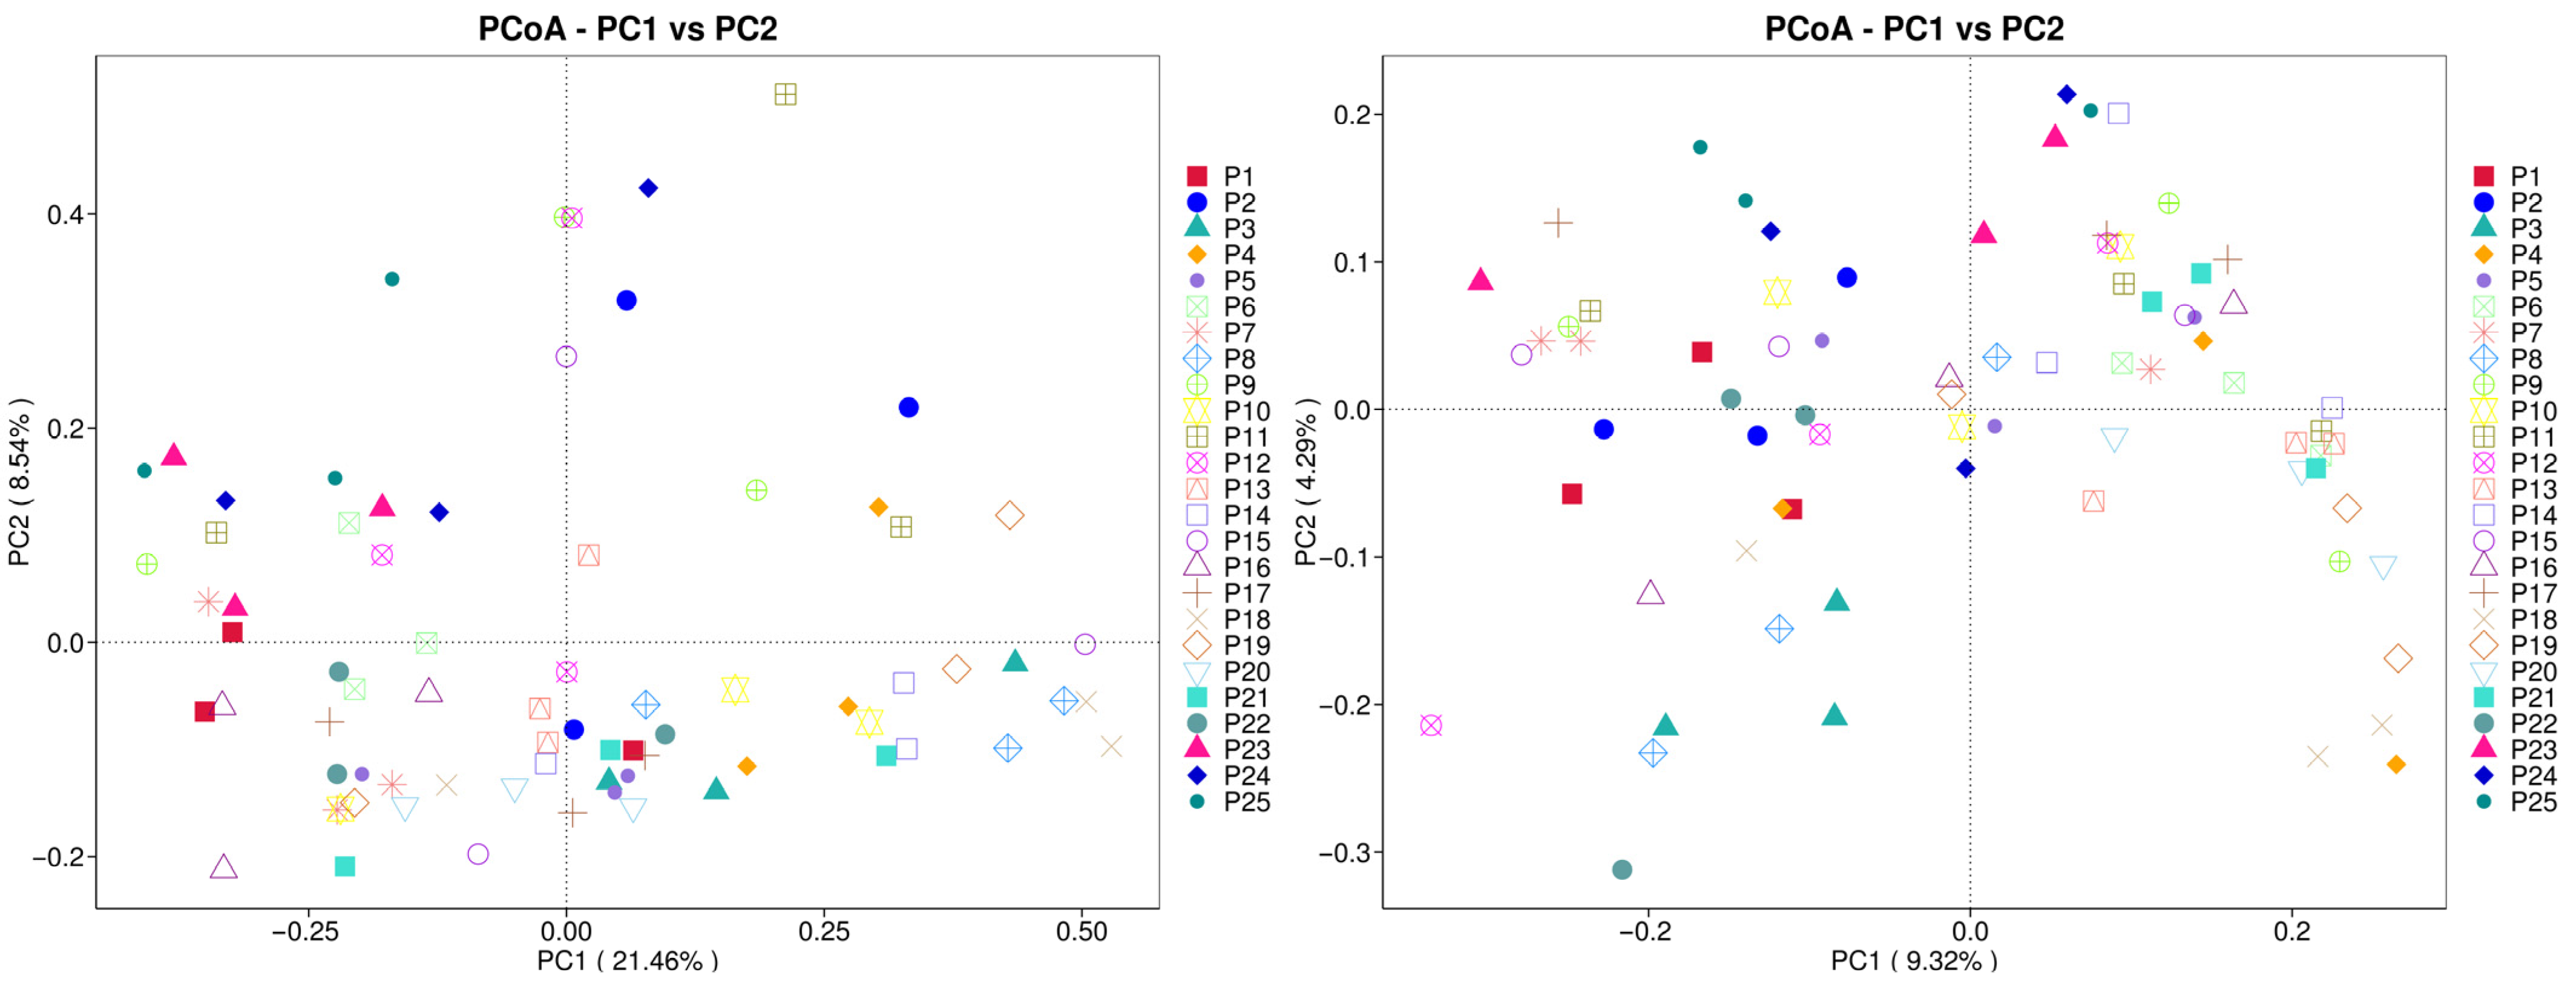
Principal coordinate analysis (PCoA) was performed on H. rhamnoides samples from various geographical locations to extract key elements and structures from multidimensional data using eigenvalues and eigenvectors. The analysis utilized both weighted Unifrac and unweighted Unifrac distances, with the principal coordinate combinations yielding the highest contribution rates selected for visualization. The results indicate distinct separations in compositions across different regions. The weighted Unifrac distance PCoA analysis accounted for 30% of the variation, with PC1 explaining 21.46% and PC2 explaining 8.54%. Similarly, the unweighted Unifrac distance PCoA analysis explained 30% of the variation, with PC1 explaining 9.32% and PC2 explaining 4.29%. The proximity of samples P23, P24, and P25 in low-altitude areas suggests a similar species composition structure among them.

3.6. Species Composition Analysis

Species with a relative abundance of >1% were considered the dominant fungal groups in this study. The classification of each ASV was performed using the QIIME2 classify-sklearn algorithm with a pre-trained naive Bayes tool for species annotation.
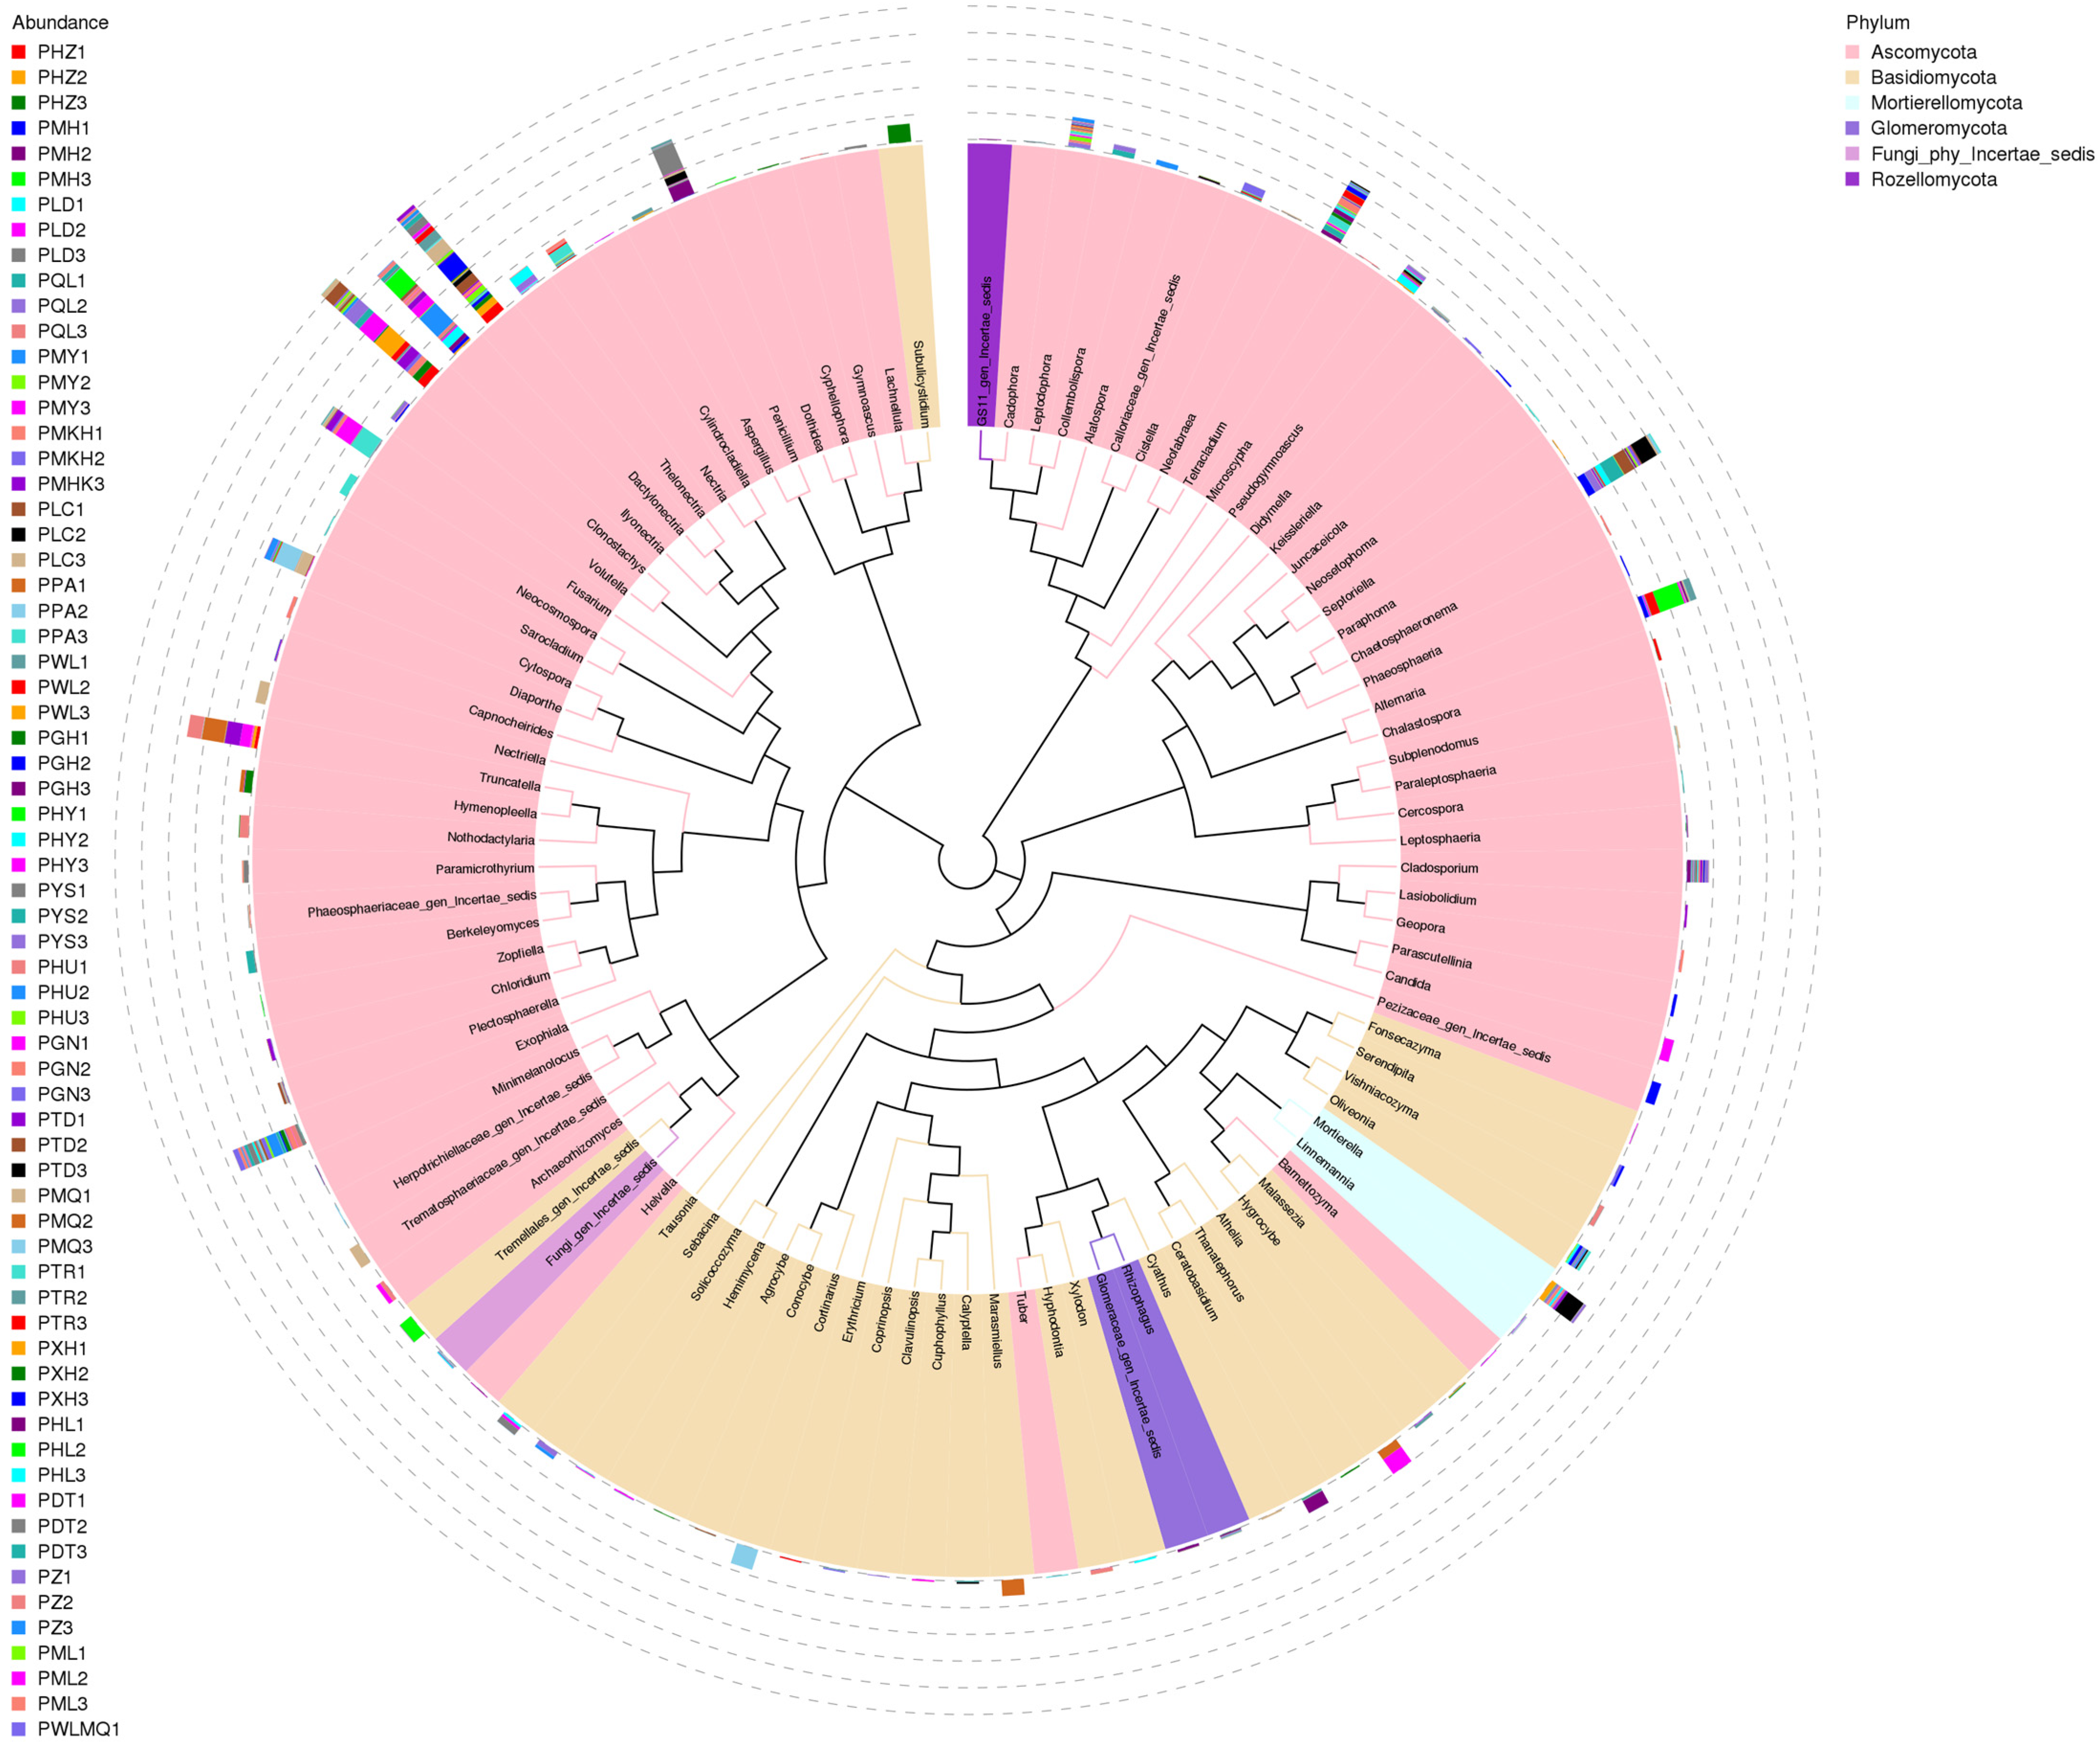
The number of fungi identified in the rhizomes of H. rhamnoides varied across different altitudes. The dominant fungal groups across different regions were primarily Ascomycota, Basidiomycota, Mortierellomycota, and Glomeromycota (Figure 9). The relative abundance of fungal in various plots exceeded 90%. At the genus classification level, representative sequences of the top 100 genera were obtained through sequence alignment, identifying 89 dominant fungal genera, including Dactylonectria, Hymenopleella, Truncatella, and Mortierella. These findings suggest a considerable overlap in fungal genera present in H. rhamnoides across different regions. The rhizomes exhibited a diverse fungal community structure, with variations in dominant fungal genera observed at different taxonomic levels. Notably, the distribution of each dominant fungal in different sample types showed distinct differences, although common dominant flora such as Penicillium and Paraphoma were identified, with P12 representing the lowest altitude and P25 the highest altitude.
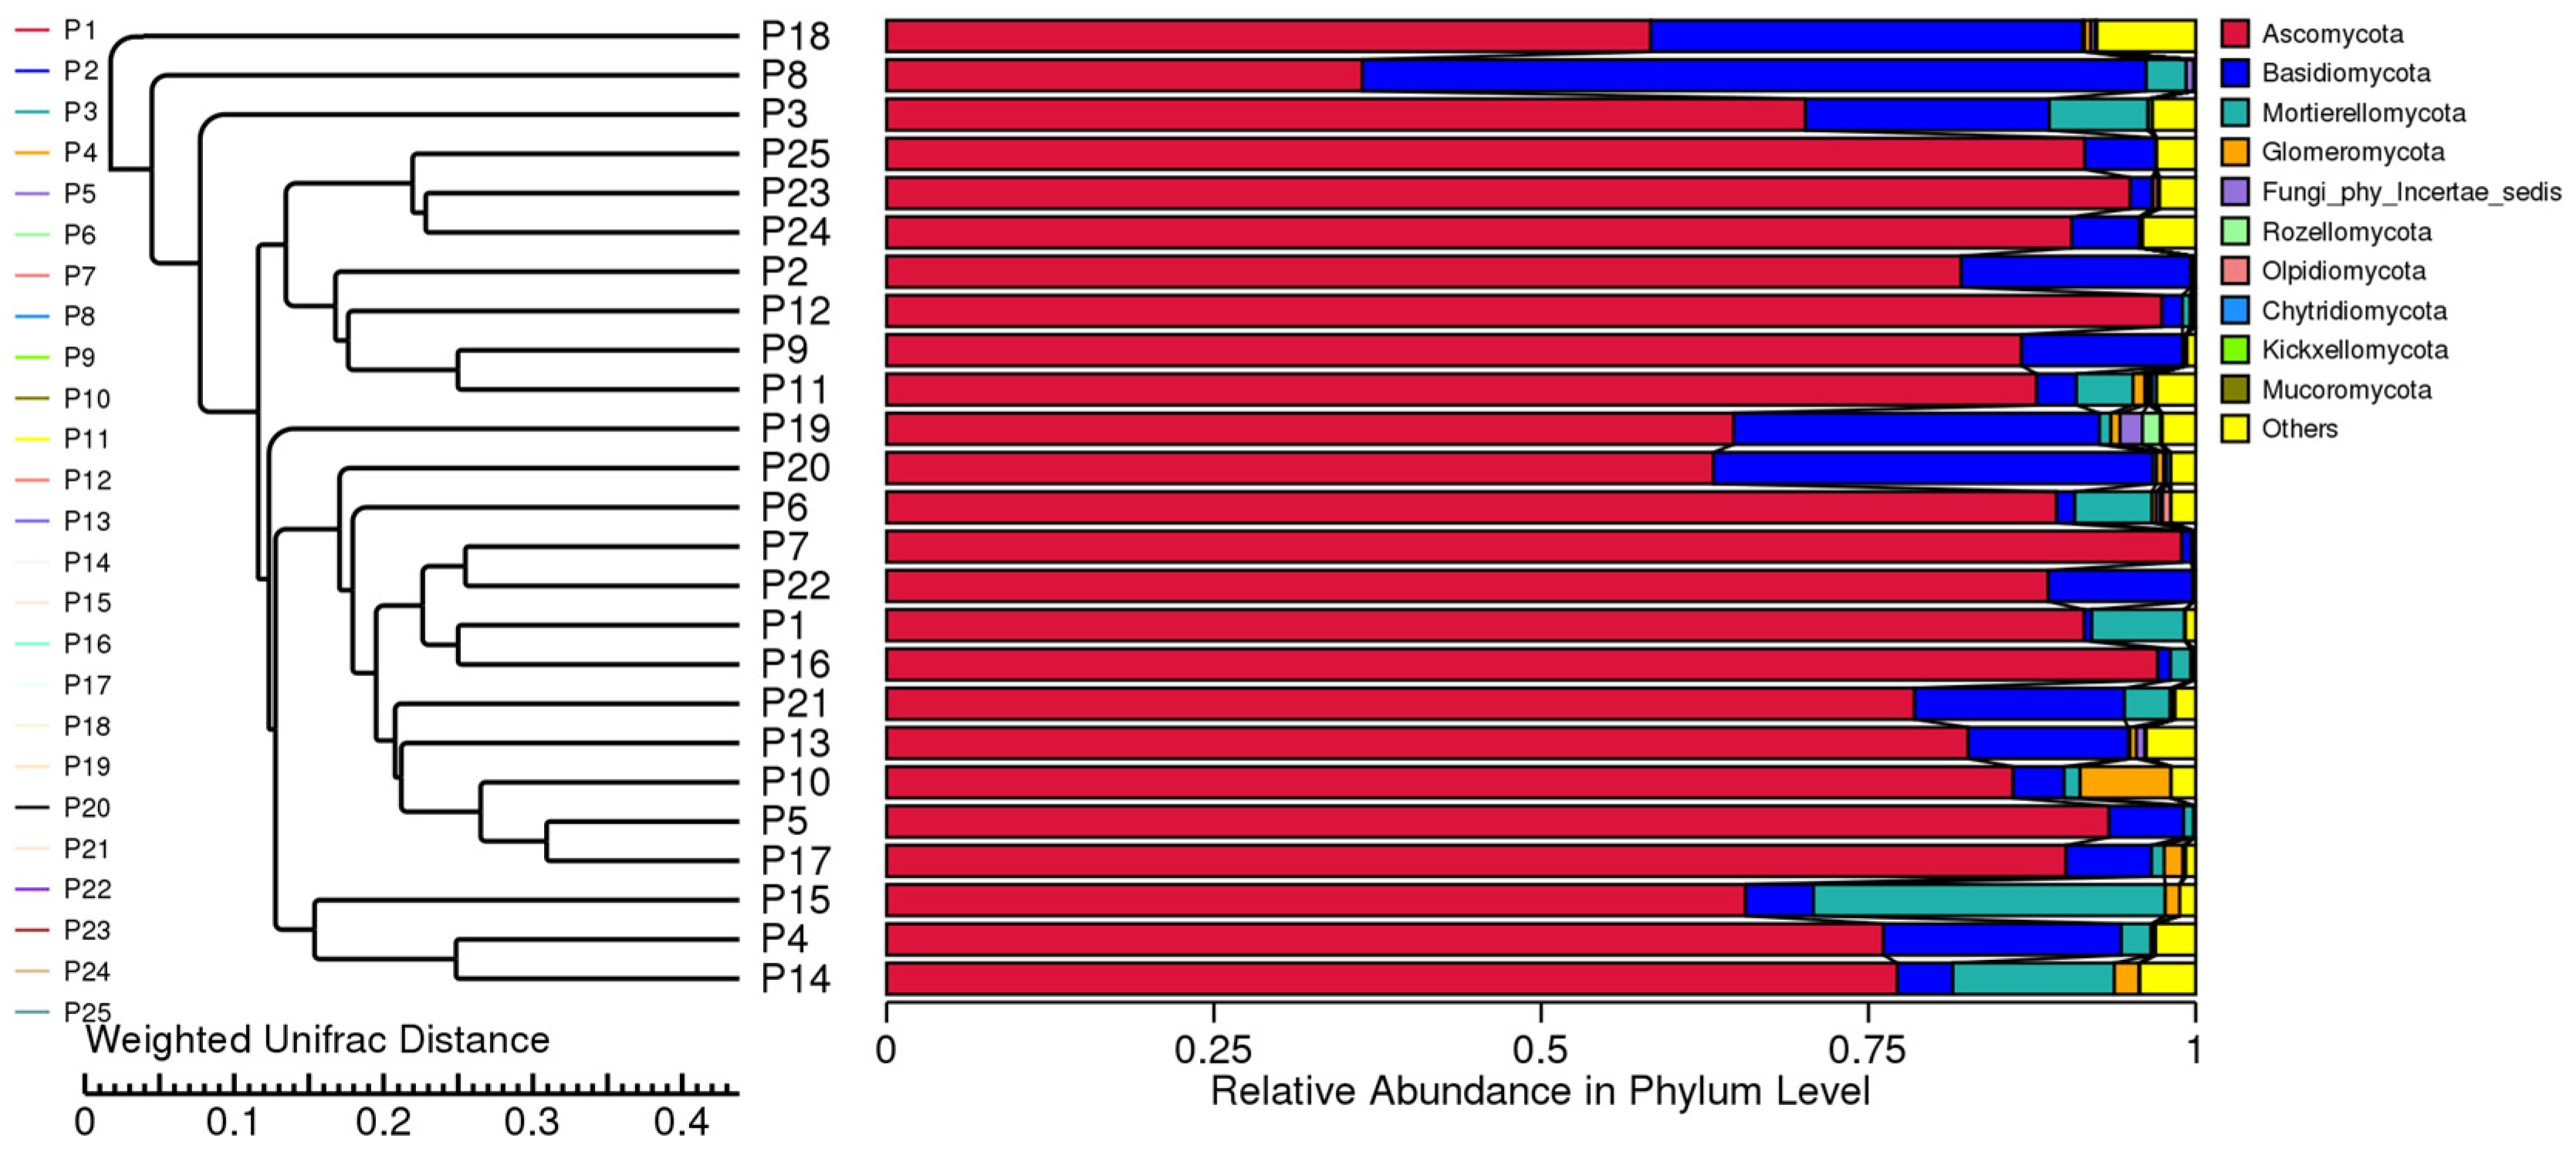
Cluster analysis was conducted on samples from 24 regions to explore similarities. A UPGMA cluster analysis using the weighted Unifrac distance matrix was performed, integrating clustering results with species abundance at the phylum level (Figure 10). The top 10 fungal groups were clustered based on relative abundance at the phylum level, revealing that H. rhamnoides samples with similar altitudes cluster together. Dominant phyla identified were Ascomycota, Basidiomycota, Mortierellomycota, and Glomeromycota. Variations in altitude were found to influence fungal composition, with rhizome fungi at lower altitudes showing higher structural similarity compared to those at higher altitudes, which consistent with the results of NMDS.

3.7. Origin Difference Analysis

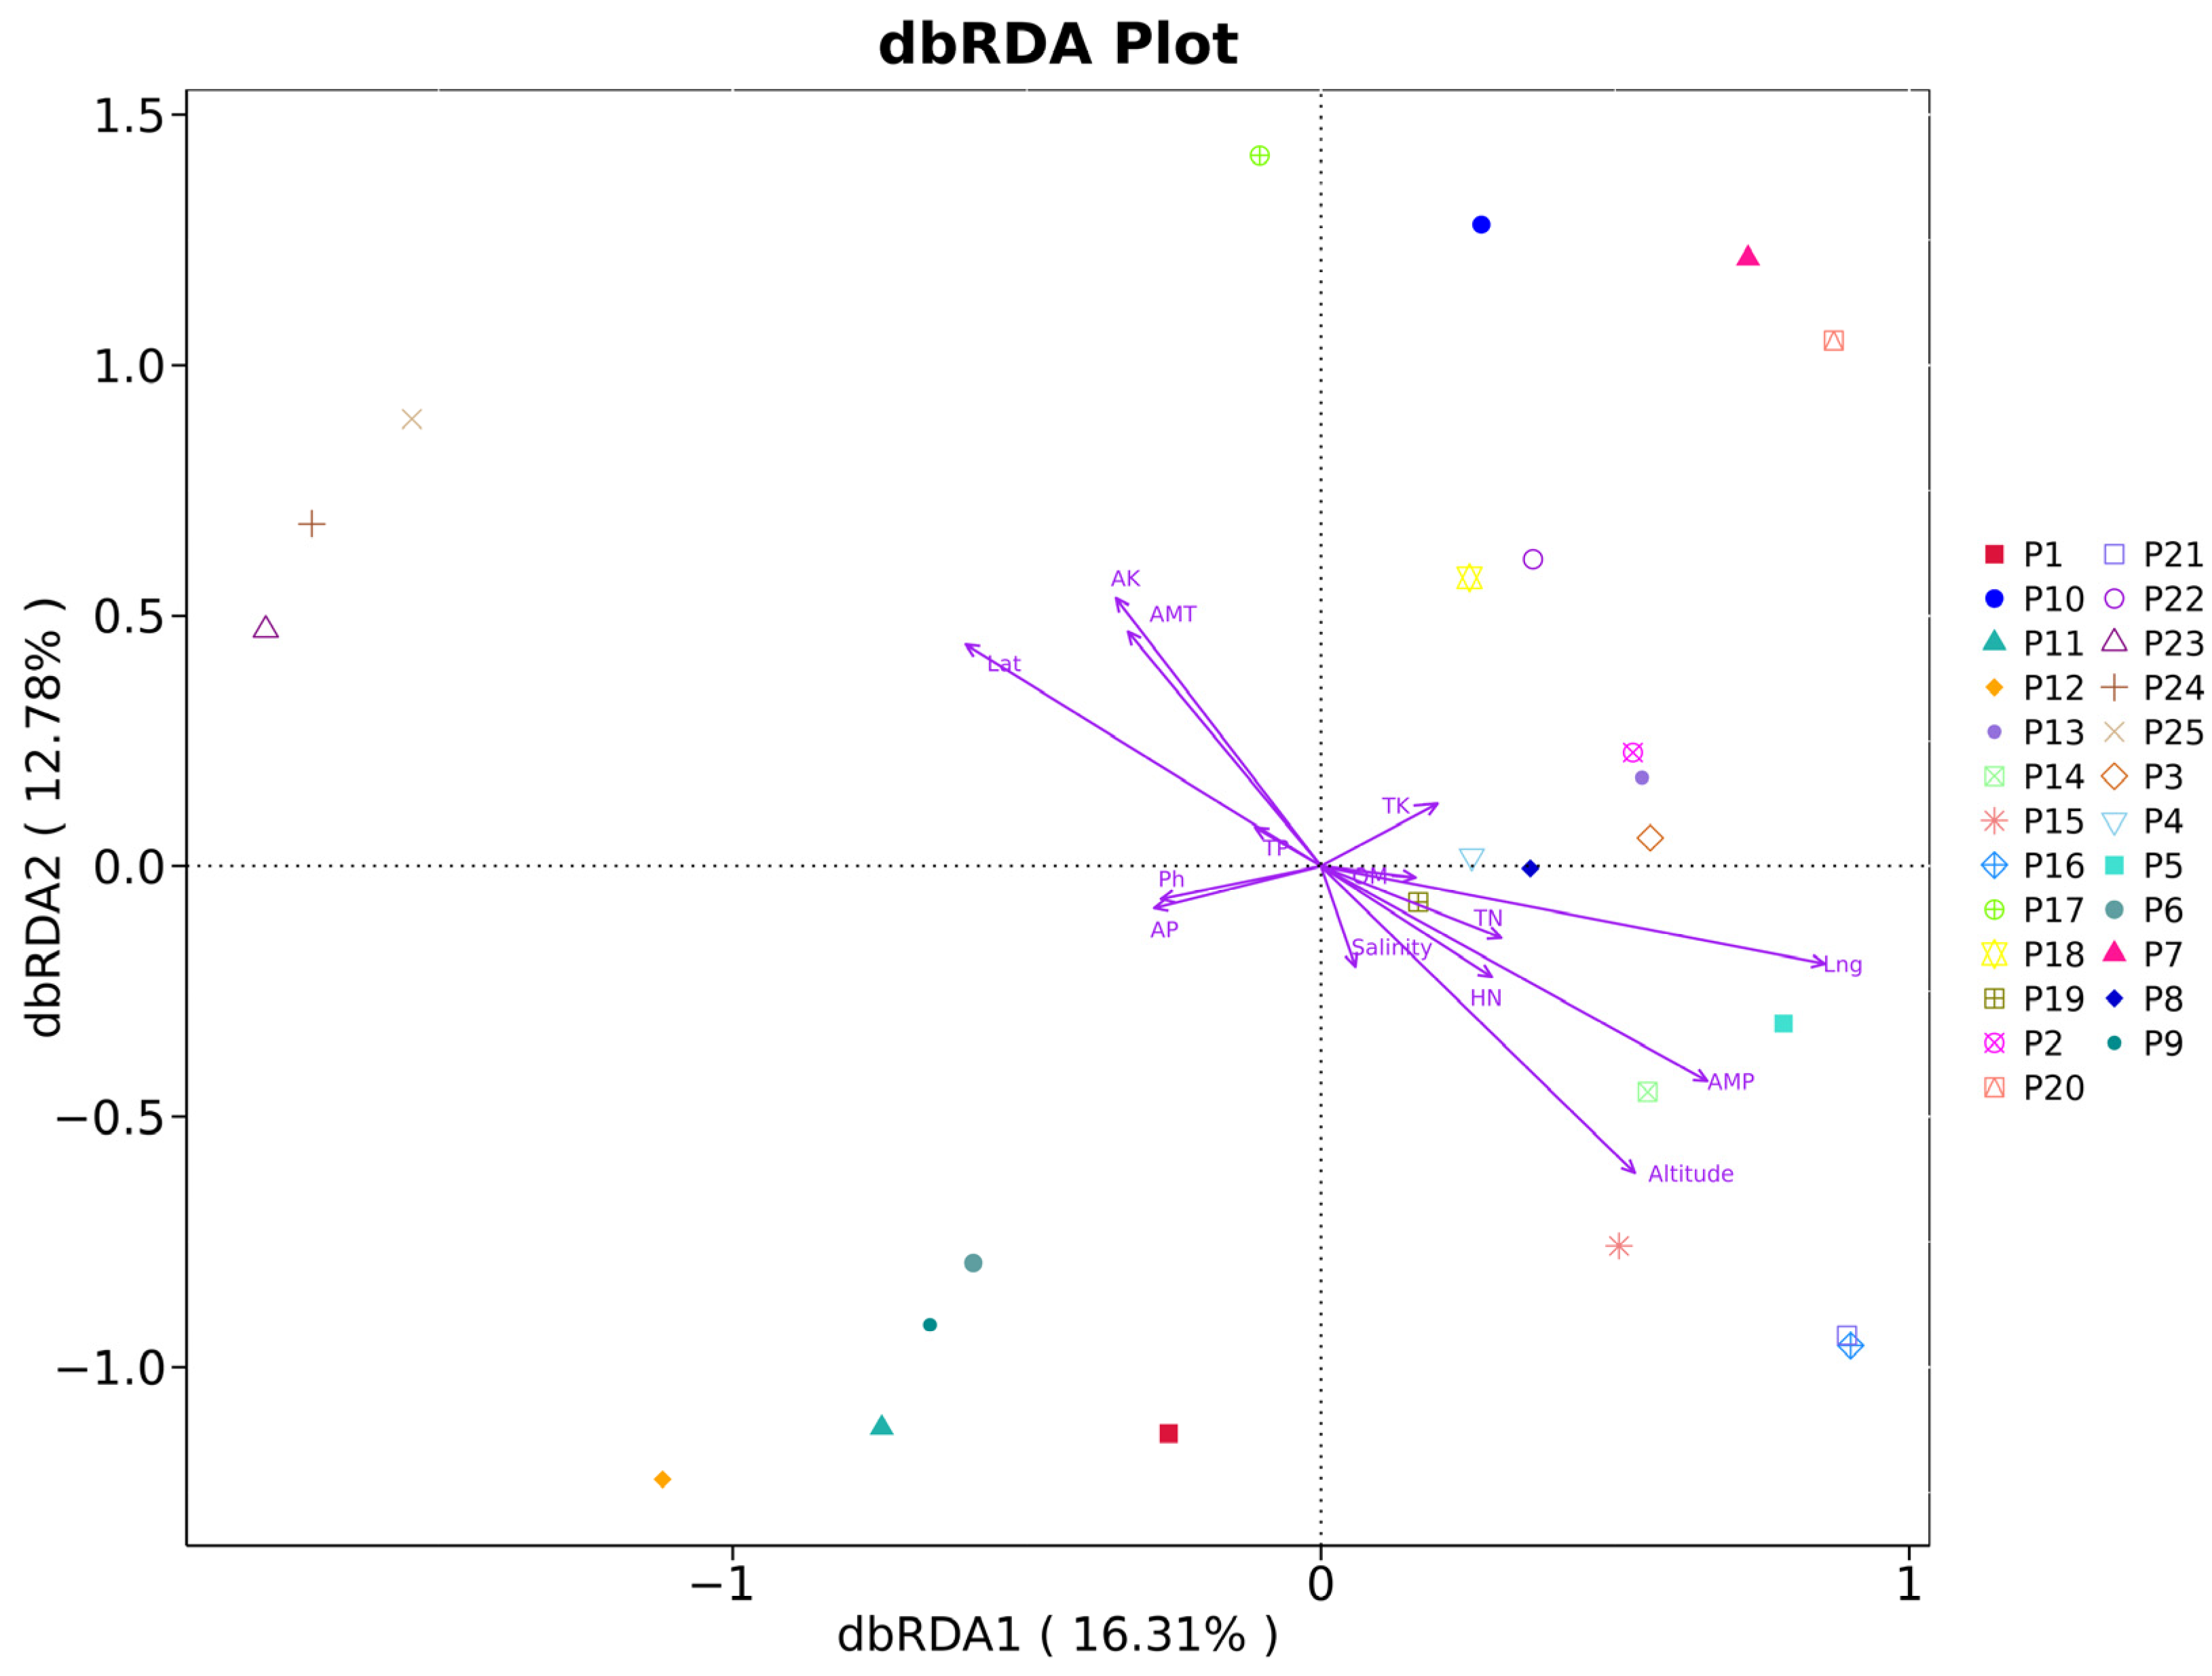
RDA analysis was conducted on the distribution data and environmental data of H. rhamnoides endophyte communities at the genus level across varying altitudes. The results presented in Figure 11 demonstrate that the first and second axes of the RDA explained a cumulative 29.09% of the variance, indicating the influence of soil environment on the fungal communities within the rhizomes. A permutation test (the Mantel test) revealed that soil environmental factors such as AP (r2 = 0.598, p = 0.027), AK (r2 = 0.098, p = 0.303), and TN (r2 = 0.082, p = 0.346) significantly shape the H. rhamnoide community, identifying them as key differentiating factors.
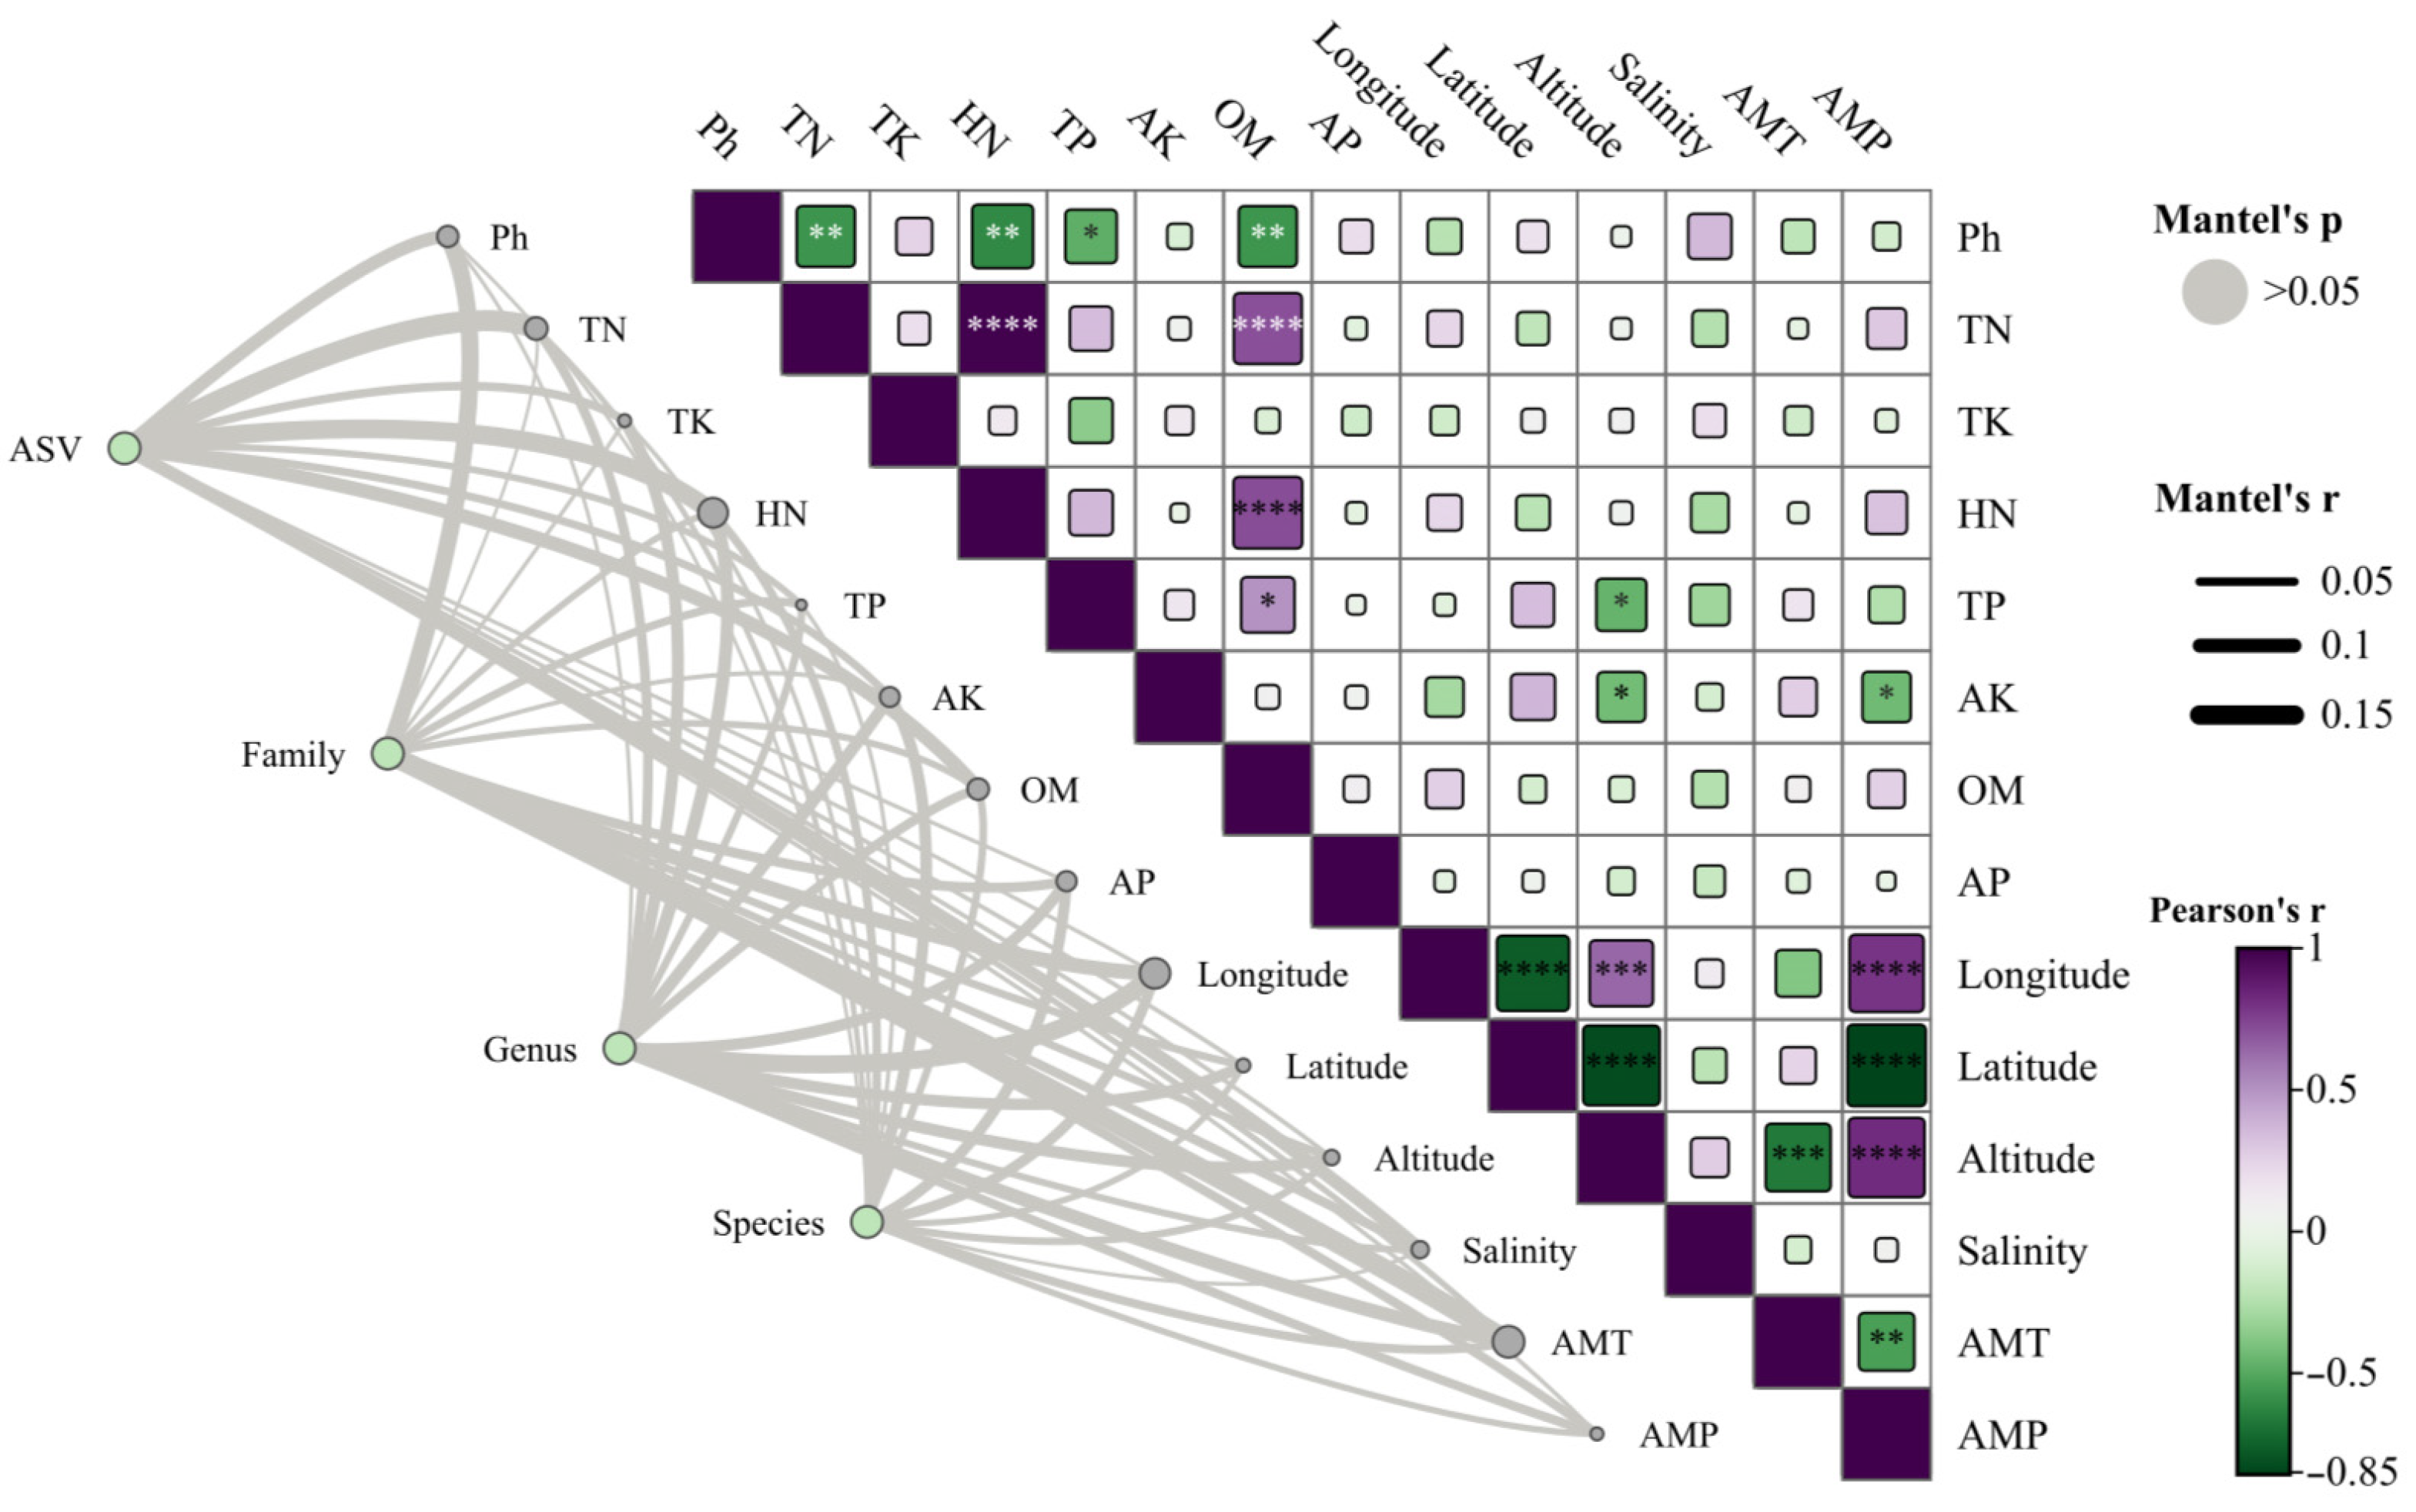
The correlation between 14 ecological factors, including longitude, latitude, altitude, AMT (annual mean temperature), AMP (annual mean precipitation), pH, salinity, TN (total nitrogen), TK (total potassium), TP (total phosphorus), AP (available phosphorus), OM (organic matter), AK (available potassium), and HN (hydrolyzable nitrogen), and root-associated fungi of H. rhamnoides classified by family, genus, and species, along with their ASV, was examined. Mantel correlation analysis revealed that environmental factors have a relatively minor impact on the root fungi of H. rhamnoides (Figure 12), suggesting a high degree of stability in the fungal community within the roots at a large scale. The Mantel test demonstrated a significant correlation between the physical and chemical properties of H. rhamnoides soil and variables such as AMT and AMP with altitude, longitude, and latitude. The results from the Pearson analysis can be seen in Figure 13. Specifically, AMP was significantly correlated with longitude (r2 = 0.62, p < 0.001), latitude (r2 = 0.99, p < 0.001), and altitude (r2 = 0.99, p < 0.001). Additionally, AMT was significantly associated with altitude (r2 = 0.44, p < 0.001). Soil pH showed significant correlations with TN (r2 = 0.95, p = 0.003), HN (r2 = 0.35, p = 0.001), and OM (r2 = 0.30, p = 0.003).

3.8. Fungal Community Function Prediction

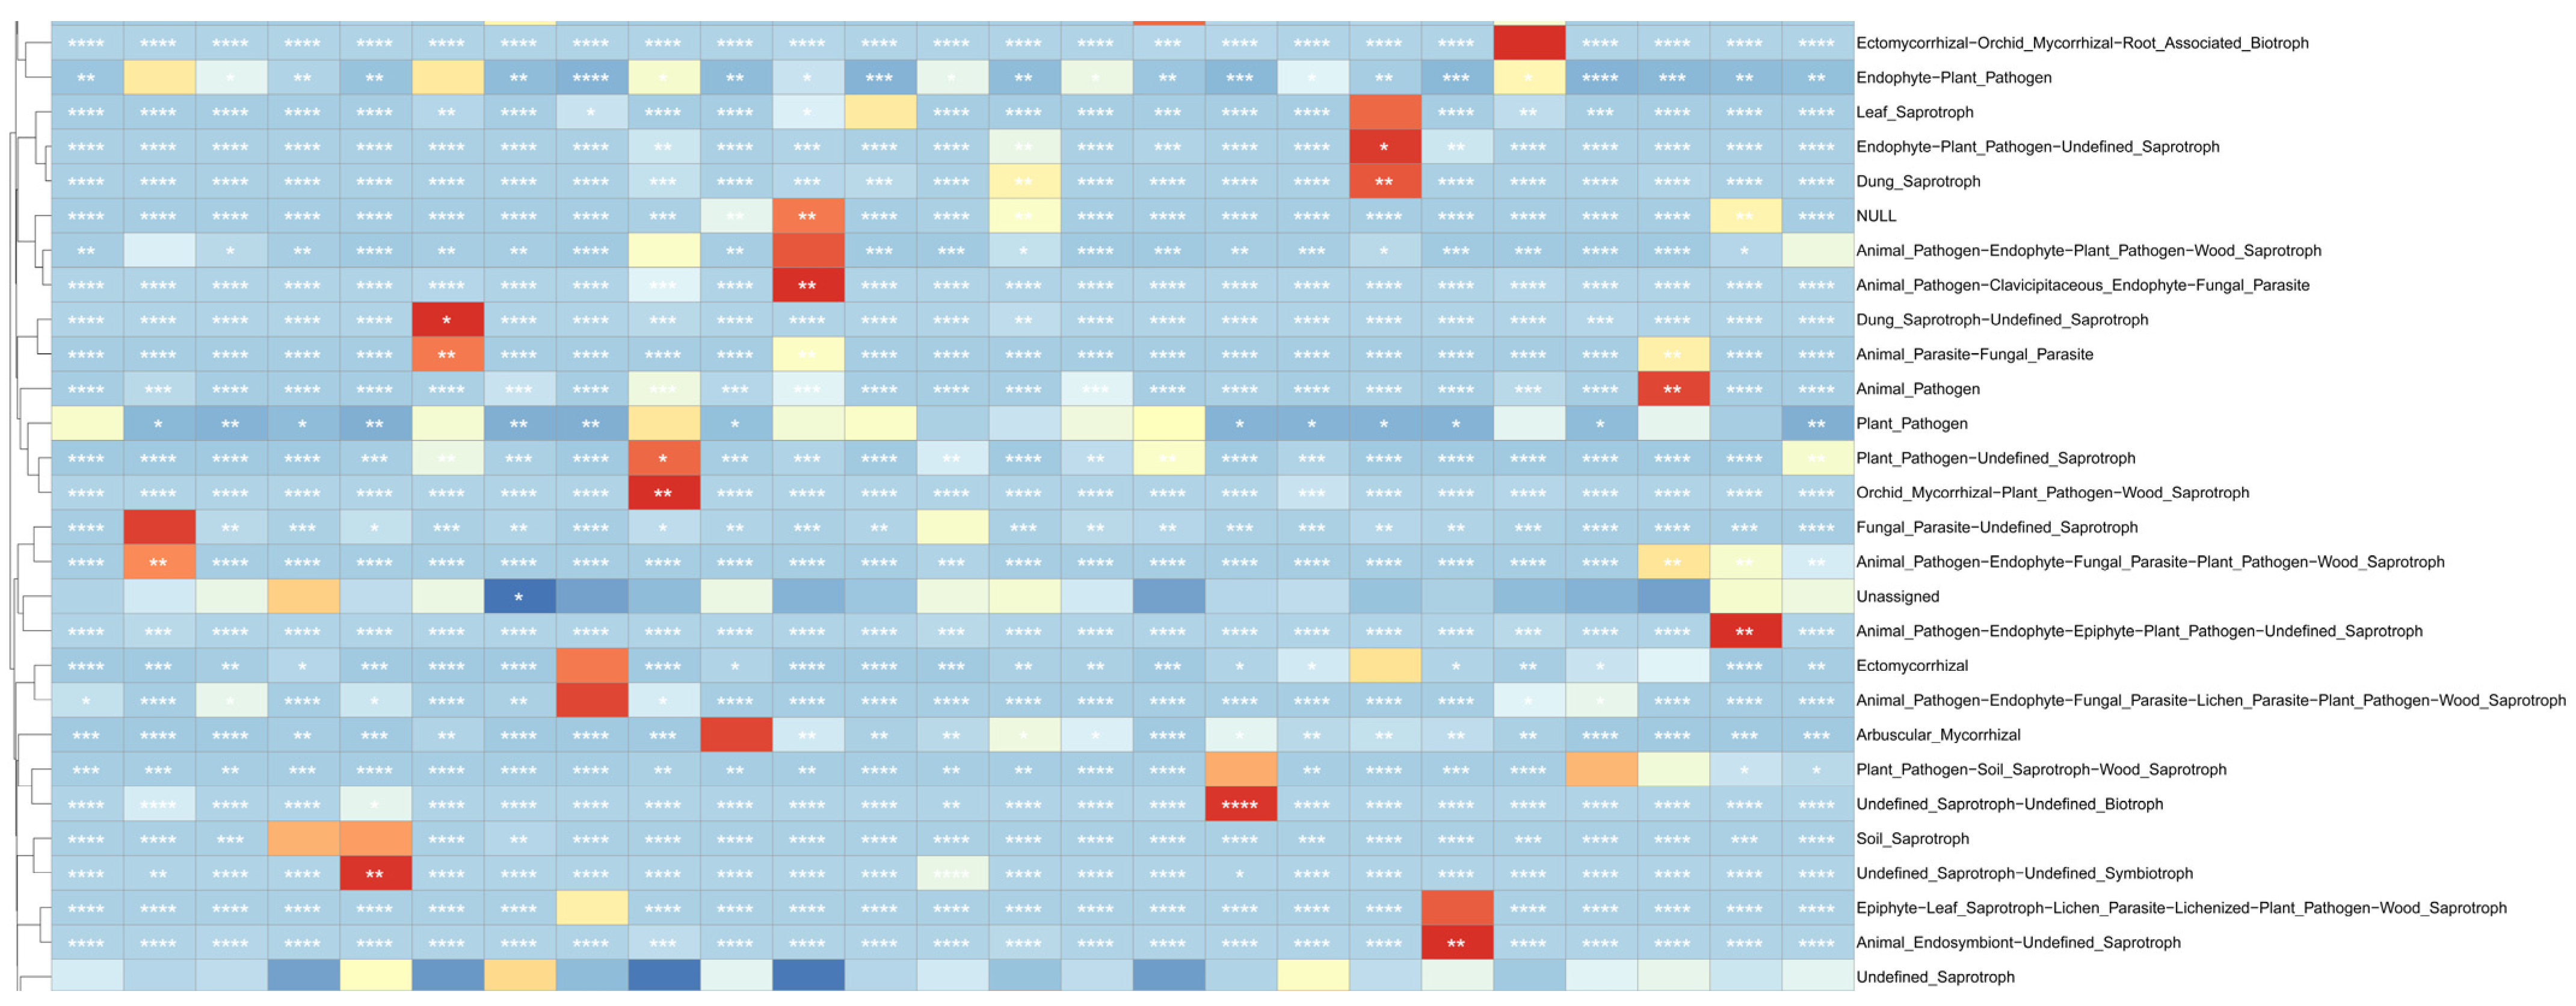
FUNGuild is a program designed to predict the ecological functions of fungi by analyzing marker gene sequencing profiles. This method offers a cost-effective and reliable alternative to metagenomic research for predicting functional potential. FUNGuild identified nine trophic types, including Saprotroph and Pathotroph–Saprotroph–Symbiotroph. Additionally, 53 ecological co-located groups were predicted across the samples, with the top ten relative abundances including Undefined_Saprotroph and Animal_Pathogen–Endophyte–Plant_Pathogen–Wood_Saprotroph (Figure 14). Notably, the results revealed a higher proportion of plant pathogenic fungi in H. rhamnoides from different regions. These asymptomatic plants may harbor pathogenic fungi that remain dormant or act as opportunistic pathogens. Further exploration is needed to unveil the potential physiological functions of these pathogenic fungi. The presence of undefined fungal groups and multiple ecological functional groups for certain fungi may be attributed to limitations in the reference species within the FUNGuild database, highlighting the need to enhance the accuracy of fungal community function prediction. Fungal community function prediction suggests that Saprotroph and Pathotroph–Saprotroph–Symbiotroph are the predominant groups of endophytic fungi in the fine roots of H. rhamnoides. The Animal_Pathogen–Endophyte–Plant_Pathogen–Wood_Saprotroph functional group exhibits significant abundances across different altitude conditions and sample variations. Furthermore, a heat map was generated using the top 35 abundant functions and their abundance information from the database (Figure 15), enabling clustering based on functional differences.

3.9. Fungal Molecular Network

By visualizing the interactions between microorganisms, ecological network analysis can simplify the complex structure of microbial communities. Variations in the types or quantities of fungal microorganisms in the fine roots of H. rhamnoides across different regions have led to corresponding changes in network size and complexity. This study compared the topological properties of fungal biocommunities within H. rhamnoides from various regions. The network connectivity distribution of fungal communities in the roots of H. rhamnoides in 25 regions conforms to the power law model. The clustering coefficient, average distance, and modularity of the microbial domain network differ significantly from those of a corresponding random network, indicating that the interconnections within the microbial network have significant deterministic properties, represented by modular structures (Figure 16). Intra- and inter-module connectivity define topological roles, categorized into module hubs, network hubs, peripheral nodes, and connector nodes. Network hubs and module hubs are highly connected within their respective modules, making them key players in the entire network. By calculating the Spearman correlation index for all samples, the correlation analysis between fungal species in rhizomes from 25 regions was visualized. The analysis identified six genera: Chytridiomycota, Mortierellomycota, Glomeromycota, Ascomycota, Basidiomycota, and Olpidiomycota.

4. Discussion

The growth and development of plants are intricately linked to their environment, with soil serving as the primary source of nutrients and root secretions playing a role in altering the soil’s physical and chemical properties. Root microorganisms, as essential components of the plant ecosystem, play a crucial role in the healthy growth of cultivated plants [39]. Numerous studies have demonstrated that root-associated microorganisms significantly impact the soil’s physical and chemical characteristics, and contribute to the creation of a unique soil environment [40,41,42]. Factors influencing root fungal structure vary across habitats, depending on plant type and growth conditions, underscoring the significant role of ‘plant–soil–microbe’ interactions in plant growth [15]. This study aimed to examine the community structure of fungi in the roots of H. rhamnoides from various locations, assess their geographical distribution patterns, and investigate their relationship with ecological and environmental factors. The research revealed significant variations in fungal diversity among H. rhamnoides roots at different sites, with mid-altitude regions showing higher diversity. This suggests that environmental factors across altitudes play a crucial role in shaping fungal communities within plant roots. Previous studies have indicated that root microbial diversity tends to be lower in high-latitude regions due to harsh climatic conditions like low temperatures, short growing seasons, and limited soil nutrients [43,44]. Conversely, microbial diversity is typically higher in roots from low-latitude regions, where warmer and more humid climates and active soil nutrient cycles create a favorable environment for microorganisms [45]. The alpha and beta diversity indices of fungi in H. rhamnoides rhizomes varied across 25 regions, showing differences in richness and community diversity. The highest fungal richness was observed in HL, while the lowest was in ML. Similarly, the highest fungal community diversity was in QL and the lowest in ML. Analysis of different regions indicated generally high fungal community diversity and richness in the samples. Overall, an increase in altitude was associated with an initial rise and subsequent decline in fungal species diversity, supporting the conclusion that fungal community diversity is highest in mid-altitude areas. NMDS and PCoA results revealed minimal differences in fungal structure in roots at mid-altitude areas, with greater dispersion in high- and low-altitude areas but similar species composition structures. Various environmental factors such as climate and soil play crucial roles in plant growth and development [46,47]. Factors such as humidity, temperature, salt content, and soil nutrient levels (e.g., longitude, latitude, altitude, AMT, AMP, pH, salinity, TN, TK, TP, AP, OM, AK, and HN) can significantly impact microorganisms. Research indicates that pH significantly influences microbial diversity and community composition, with neutral soils typically having a more pronounced effect compared to acidic or alkaline soils, as soil pH directly affects the physiological state and ecological niche of fungi, while indirectly influencing fungal communities by regulating the bioavailability of soil nutrients [48,49,50]. This study analyzed soil pH values ranging from 6.24 to 8.42. The results showed that the Chao1 index initially decreased and then increased when pH levels ranged from 6.46 to 8.01. A significant drop in the Chao1 index was observed at a pH of 8.05, followed by a sharp increase until reaching 8.28. Similarly, the Shannon index exhibited a decline followed by a sharp increase around the pH value of 8.05, while the Simpson index displayed an initial sharp increase followed by a decrease. These fluctuations were attributed to the proliferation of alkali-resistant fungi in alkaline soil. Previous studies have indicated that alkaline soil supports a higher abundance and diversity of saprotrophic fungi compared to neutral soil, as well as a richer and more diverse fungal community in the roots of H. rhamnoides [51,52]. Several studies have indicated that latitude, longitude, and annual precipitation play significant roles in fungal richness. Utilizing RDA and Mantel test analyses, this study identified longitude, AK, and HN as the primary factors influencing the variations in fungal communities within the rhizomes of H. rhamnoides. These findings provide additional evidence that geographical environmental factors drive the diversity of fungi in the roots of H. rhamnoides. Examination of fungi within the roots revealed that the dominant fungal groups belonged to four phyla: Ascomycota, Basidiomycota, Mortierellomycota, and Glomeromycota, with their combined relative abundance exceeding 90% in various plots. The taxonomic composition and relative abundance of dominant fungal groups varied across different regions, further supporting the notion that the geographical environment influences the richness of the fungal community. The findings of this study indicate that the fungal communities within H. rhamnoides roots exhibit regional variations influenced by environmental and geographical factors. The enrichment and depletion of certain fungi in H. rhamnoides suggest that plants can actively select fungal colonization. The diversity of fungi in plant rhizomes may not be solely induced by plant actions alone; interactions among microorganisms also play a significant role [53]. The 14 environmental factors investigated in this study comprehensively affect rhizosphere fungal communities and accurately reflect the relationship between plants and their environments.

5. Conclusions

A comprehensive study on the diversity of fungal communities in H. rhamnoides rhizomes across 25 regions revealed substantial fungal community and functional diversity in each region. Notably, both fungal community and functional diversity were higher in mid-altitude areas compared to low and high altitudes. Additionally, the intra-root similarity of fungal samples from low-altitude areas was higher than those from mid-altitude and high-altitude areas. The relative abundance of dominant fungal genera varied between different sampling points, while the community structure of samples from the same area exhibited high similarity. Among various ecological factors, including longitude, latitude, altitude, AMT, AMP, pH, salinity, TN, TK, TP, AP, OM, AK, and HN, it was found that environmental factors such as longitude, altitude, and soil AK play crucial roles in shaping the H. rhamnoides rhizome community. The species diversity and primary ecological functions of fungi in H. rhamnoides roots were found to vary based on their geographic origin, suggesting that the accumulation or depletion of various substances during growth leads to the formation of specific fungal communities in each region. These findings elucidate the diversity characteristics of fungi in H. rhamnoides rhizomes across different regions and provide valuable insights for the sustainable development and utilization of microorganisms in the rhizomes of H. rhamnoides in the northwest region.

Author Contributions

Conceptualization: Y.M. and G.Y.; data curation: Y.M., G.Y., and S.G.; formal analysis: Y.M., G.Y., and S.G.; funding acquisition: Y.M. and G.Y.; investigation: Y.M., G.Y., S.G., W.L., R.L., and Z.L.; methodology: Y.M., G.Y., and S.G.; writing—original draft: Y.M., G.Y., and S.G.; writing—review and editing: Y.M., G.Y., and S.G. All authors have read and agreed to the published version of the manuscript.

Funding

This research was supported by Qinghai Provincial Science and Technology Department (2024-ZJ-941), and Qinghai Province’s “Thousands of High-end Innovative Talents Program” (2020, 2022).

Institutional Review Board Statement

The experiments did not involve endangered or protected species. The data collection of plants was carried out with permission of related institutions and complied with national or international guidelines and legislation.

Informed Consent Statement

Not applicable.

Data Availability Statement

No new data were created or analyzed in this study.

Conflicts of Interest

The authors declare that they have no conflicts of interest.

Appendix A

Table A1. Sampling Plot Information of H. rhamnoides.
Sample Sample
Name
AddPessSoil TypeSample No.Latitude
(N°)
Longitude
(E°)
Altitude
/m
AMTAMP
HZP1Huzhu County, Haidong CitySandPHZ1, PHZ2, PHZ336.977102.0772696.31.715 126.085
MHP2Minhe County, Haidong CityLoamPMH1, PMH2, PMH336.376102.7822644.85.456 101.830
LDP3Ledu District, Haidong CityLoamPLD1, PLD2, PLD336.978102.0772753.51.715 126.085
QLP4Qilian County, Haibei Tibetan Autonomous PrefectureSandPQL1, PQL2, PQL338.076100.3782920.8−0.019 124.205
MYP5Menyuan County, Haibei Tibetan Autonomous PrefectureClayPMY1, PMY2, PMY337.755101.2203369.0−1.769 134.440
MKHP6Make River, Luoguoluo Tibetan Autonomous PrefectureClayPMKH1, PMKH2, PMKH332.874100.8203441.01.925 158.825
LCP7Liancheng, Lanzhou CityLoamPLC1, PLC2, PLC336.661102.7362214.64.394 101.465
PAP8Ping’an District, Haidong CityLoamPPA1, PPA2, PPA336.338101.9142497.83.779 114.900
WLP9Wulan County, Haixi Mongolian and Tibetan Autonomous PrefectureSandPWL1, PWL2, PWL336.66099.3413159.01.356 76.410
GHP10Gonghe County, Hainan Tibetan Autonomous PrefectureClayPGH1, PGH2, PGH336.311100.5952947.63.467 102.030
HYP11Huangyuan County, Xining CityLoamPHY1, PHY2, PHY336.545101.1842923.11.756 122.610
YSP12Yushu Tibetan Autonomous PrefectureLoamPYS1, PYS2, PYS333.00596.9923665.01.927 132.345
HUP13Huangzhong District, Xining CityClayPHU1, PHU2, PHU336.400101.5752906.81.863 124.360
GNP14Guinan County, Hainan Tibetan Autonomous PrefectureLoamPGN1, PGN2, PGN335.707101.0813522.10.252 120.735
TDP15Tongde County, Hainan Tibetan Autonomous PrefectureLoamPTD1, PTD2, PTD334.736100.8063369.01.473 124.870
MQP16Maqin County, Guoluo Tibetan Autonomous PrefectureLoamPMQ1, PMQ2, PMQ334.660100.6223353.50.615 125.880
TRP17Tongren City, Huangnan Tibetan Autonomous PrefectureClayPTR1, PTR2, PTR335.518102.0192387.95.525 114.660
XHP18Xunhua Salar Autonomous County, Haidong CityClayPXH1, PXH2, PXH335.716102.2872610.62.383 121.885
HLP19Haidong Hualong Hui Autonomous CountyClayPHL1, PHL2, PHL336.073102.2802503.93.667 114.750
DTP20Haidong Hualong Hui Autonomous CountyClayPDT1, PDT2, PDT337.002101.7712748.72.596 125.640
ZP21Dingxizhang County, Gansu ProvinceClayPZ1, PZ2, PZ334.823104.3302725.24.510 124.825
MLP22Minle County, Gansu ProvinceClayPML1, PML2, PML338.265100.9152692.50.881 116.380
WLMQP23urumqi county of xinjiangClayPWLMQ1, PWLMQ2, PWLMQ343.45187.2671562.53.717 63.720
QHP24Qinghe County, Altay Prefecture, Xinjiang Uygur Autonomous RegionSandPQH1, PQH2, PQH346.53290.3191230.02.206 29.035
HJP25Hejing County, Bayinguoleng Mongolian Autonomous Prefecture, XinjiangSandPHJ1, PHJ2, PHJ342.28285.9921106.310.763 31.560

References

  1. Bardgett, R.D.; Mommer, L.; De Vries, F.T. Going underground: Root traits as drivers of ecosystem processes. Trends Ecol. Evol. 2014, 29, 692–699. [Google Scholar] [CrossRef] [PubMed]
  2. Davy, A.J. 12 establishment and manipulation of plant populations and communities in terrestrial systems. In Handbook of Ecological Restoration; Cambridge University: Cambridge, UK, 2008; p. 223. [Google Scholar] [CrossRef]
  3. Liang, S.; Yingning ZO, U.; Bo SH, U.; Qiangsheng, W.U. Arbuscular mycorrhizal fungi and endophytic fungi differentially modulate polyamines or proline of peach in response to soil flooding. Pedosphere 2024, 34, 460–472. [Google Scholar] [CrossRef]
  4. Sieber, T.N. Endophytic fungi in forest trees: Are they mutualists? Fungal Biol. Rev. 2007, 21, 75–89. [Google Scholar] [CrossRef]
  5. Mamangkey, J.; Mendes, L.W.; Harahap, A.; Briggs, D.; Kayacilar, C. Endophytic bacteria and fungi from indonesian medicinal plants with antibacterial, pathogenic antifungal and extracellular enzymes activities: A review. Int. J. Sci. Technol. Manag. 2022, 3, 245–255. [Google Scholar] [CrossRef]
  6. Yan, L.; Zhu, J.; Zhao, X.; Shi, J.; Jiang, C.; Shao, D. Beneficial effects of endophytic fungi colonization on plants. Appl. Microbiol. Biotechnol. 2019, 103, 3327–3340. [Google Scholar] [CrossRef] [PubMed]
  7. Bandara, W.M.M.S.; Seneviratne, G.; Kulasooriya, S.A. Interactions among endophytic bacteria and fungi: Effects and potentials. J. Biosci. 2006, 31, 645–650. [Google Scholar] [CrossRef]
  8. Rodriguez, R.J.; White, J.F., Jr.; Arnold, A.E.; Redman, R.S. Fungal endophytes: Diversity and functional roles. New Phytol. 2009, 182, 314–330. [Google Scholar] [CrossRef]
  9. Kariman, K.; Barker, S.J.; Tibbett, M. Structural plasticity in root-fungal symbioses: Diverse interactions lead to improved plant fitness. PeerJ 2018, 6, e6030. [Google Scholar] [CrossRef]
  10. Duan, X.; Xu, F.; Qin, D.; Gao, T.; Shen, W.; Zuo, S.; Yu, B.; Xu, J.; Peng, Y.; Dong, J. Diversity and bioactivities of fungal endophytes from Distylium chinense, a rare waterlogging tolerant plant endemic to the Three Gorges Reservoir. BMC Microbiol. 2019, 19, 278. [Google Scholar] [CrossRef]
  11. Caracciolo, A.B.; Terenzi, V. Rhizosphere microbial communities and heavy metals. Microorganisms 2021, 9, 1462. [Google Scholar] [CrossRef]
  12. Pang, Z.; Chen, J.; Wang, T.; Gao, C.; Li, Z.; Guo, L.; Xu, J.; Cheng, Y. Linking plant secondary metabolites and plant microbiomes: A review. Front. Plant Sci. 2021, 12, 621276. [Google Scholar] [CrossRef] [PubMed]
  13. Philippot, L.; Raaijmakers, J.M.; Lemanceau, P.; van der Putten, W.H. Going back to the roots: The microbial ecology of the rhizosphere. Nat. Rev. Microbiol. 2013, 11, 789–799. [Google Scholar] [CrossRef] [PubMed]
  14. Li, Y.; Pan, J.; Zhang, R.; Wang, J.; Tian, D.; Niu, S. Environmental factors, bacterial interactions and plant traits jointly regulate epiphytic bacterial community composition of two alpine grassland species. Sci. Total. Environ. 2022, 836, 155665. [Google Scholar] [CrossRef] [PubMed]
  15. Perotti, E.B.; Pidello, A. Plant-soil-microorganism interactions on nitrogen cycle: Azospirillum inoculation. In Advances in Selected Plant Physiology Aspects; IntechOpen: London, UK, 2012; pp. 189–208. [Google Scholar] [CrossRef]
  16. Tedersoo, L.; Bahram, M.; Põlme, S.; Kõljalg, U.; Yorou, N.S.; Wijesundera, R.; Ruiz, L.V.; Vasco-Palacios, A.M.; Thu, P.Q.; Suija, A.; et al. Global diversity and geography of soil fungi. Science 2014, 346, 1256688. [Google Scholar] [CrossRef]
  17. Classen, A.T.; Sundqvist, M.K.; Henning, J.A.; Newman, G.S.; Moore, J.A.M.; Cregger, M.A.; Moorhead, L.C.; Patterson, C.M. Direct and indirect effects of climate change on soil microbial and soil microbial-plant interactions: What lies ahead? Ecosphere 2015, 6, 1–21. [Google Scholar] [CrossRef]
  18. Bahram, M.; Hildebrand, F.; Forslund, S.K.; Anderson, J.L.; Soudzilovskaia, N.A.; Bodegom, P.M.; Bengtsson-Palme, J.; Anslan, S.; Coelho, L.P.; Harend, H.; et al. Structure and function of the global topsoil microbiome. Nature 2018, 560, 233–237. [Google Scholar] [CrossRef]
  19. Glynou, K.; Ali, T.; Buch, A.; Kia, S.H.; Ploch, S.; Xia, X.; Çelik, A.; Thines, M.; Maciá-Vicente, J.G. The local environment determines the assembly of root endophytic fungi at a continental scale. Environ. Microbiol. 2016, 18, 2418–2434. [Google Scholar] [CrossRef]
  20. Johnson, D.; Martin, F.; Cairney, J.W.G.; Anderson, I.C. The importance of individuals: Intraspecific diversity of mycorrhizal plants and fungi in ecosystems. New Phytol. 2012, 194, 614–628. [Google Scholar] [CrossRef]
  21. Bahram, M.; Põlme, S.; Kõljalg, U.; Zarre, S.; Tedersoo, L. Regional and local patterns of ectomycorrhizal fungal diversity and community structure along an altitudinal gradient in the Hyrcanian forests of northern Iran. New Phytol. 2012, 193, 465–473. [Google Scholar] [CrossRef]
  22. Li, X.; Gai, J.; Cai, X.; Christie, P.; Zhang, F.; Zhang, J. Molecular diversity of arbuscular mycorrhizal fungi associated with two co-occurring perennial plant species on a Tibetan altitudinal gradient. Mycorrhiza 2014, 24, 95–107. [Google Scholar] [CrossRef]
  23. Edwards, J.; Johnson, C.; Santos-Medellín, C.; Lurie, E.; Podishetty, N.K.; Bhatnagar, S.; Eisen, J.A.; Sundaresan, V. Structure, variation, and assembly of the root-associated microbiomes of rice. Proc. Natl. Acad. Sci. USA 2015, 112, E911–E920. [Google Scholar] [CrossRef]
  24. Guo, X.; Gong, J. Differential effects of abiotic factors and host plant traits on diversity and community composition of root-colonizing arbuscular mycorrhizal fungi in a salt-stressed ecosystem. Mycorrhiza 2014, 24, 79–94. [Google Scholar] [CrossRef] [PubMed]
  25. He, C.Y.; Zhang, G.Y.; Zhang, J.G.; Duan, A.G.; Luo, H.M. Physiological, biochemical, and proteome profiling reveals key pathways underlying the drought stress responses of Hippophae rhamnoides. Proteomics 2016, 16, 2688–2697. [Google Scholar] [CrossRef] [PubMed]
  26. Dagar, J.C.; Tewari, V.P. Evolution of agroforestry as a modern science. In Agroforestry: Anecdotal to Modern Science; Springer: Berlin/Heidelberg, Germany, 2017; pp. 13–90. [Google Scholar] [CrossRef]
  27. Padulosi, S.; Thompson, J.; Rudebjer, P.G. Fighting Poverty, Hunger and Malnutrition with Neglected and Underuti-Lized Species: Needs, Challenges and the Way Forward; Bioversity International: Rome, Italy, 2013. [Google Scholar]
  28. Yin, R.; Zhao, M. Ecological restoration programs and payments for ecosystem services as integrated biophysical and socioeconomic processes—China’s experience as an example. Ecol. Econ. 2012, 73, 56–65. [Google Scholar] [CrossRef]
  29. Zhou, X.; Tian, L.; Zhang, J.; Ma, L.; Li, X.; Tian, C. Rhizospheric fungi and their link with the nitrogen-fixing Frankia harbored in host plant Hippophae rhamnoides L. J. Basic Microbiol. 2017, 57, 1055–1064. [Google Scholar] [CrossRef]
  30. Zhang, J.; Nasir, F.; Tian, L.; Bahadur, A.; Batool, A.; Ma, L.; Zhou, X.; Zhao, S.; Tian, C. Impact of ecological factors on the diversity and community assemblage of the bacteria harbored in the rhizosphere of Hippophae rhamnoides. Int. J. Agric. Biol. 2018, 20, 1632–1640. [Google Scholar]
  31. Luo, Y.J.; Sun, H.M.; He, N.; Yuan, L.J.; Xie, Y.Y. Isolation and antibacterial activity of actinomycetes from the nodules and rhizosphere soil of Hippophae rhamnoides in tibet. Biotechnol. Bull. 2021, 37, 225. [Google Scholar] [CrossRef]
  32. Wang, Z.; Zou, J.; Shi, Y.; Zhang, X.; Zhai, B.; Guo, D.; Sun, J.; Luan, F. Extraction techniques, structural features and biological functions of Hippophae rhamnoides polysaccharides: A review. Int. J. Biol. Macromol. 2024, 263, 130206. [Google Scholar] [CrossRef]
  33. Ma, Q.-G.; He, N.-X.; Huang, H.-L.; Fu, X.-M.; Zhang, Z.-L.; Shu, J.-C.; Wang, Q.-Y.; Chen, J.; Wu, G.; Zhu, M.-N.; et al. Hippophae rhamnoides L.: A comprehensive review on the botany, traditional uses, phytonutrients, health benefits, quality markers, and applications. J. Agric. Food Chem. 2023, 71, 4769–4788. [Google Scholar] [CrossRef]
  34. Krejcarová, J.; Straková, E.; Suchý, P.; Herzig, I.; Karásková, K. Sea buckthorn (Hippophae rhamnoides L.) as a potential source of nutraceutics and its therapeutic possibilities—A review. Acta Veter. Brno 2015, 84, 257–268. [Google Scholar] [CrossRef]
  35. Zapala, M.A.; Schork, N.J. Multivariate regression analysis of distance matrices for testing associations between gene expression patterns and related variables. Proc. Natl. Acad. Sci. USA 2006, 103, 19430–19435. [Google Scholar] [CrossRef] [PubMed]
  36. Algina, J.; Keselman, H.J. Comparing squared multiple correlation coefficients: Examination of a confidence interval and a test significance. Psychol. Methods 1999, 4, 76–83. [Google Scholar] [CrossRef]
  37. Lozupone, C.; Knight, R. UniFrac: A new phylogenetic method for comparing microbial communities. Appl. Environ. Microbiol. 2005, 71, 8228–8235. [Google Scholar] [CrossRef] [PubMed]
  38. Lozupone, C.; Lladser, M.E.; Knights, D.; Stombaugh, J.; Knight, R. UniFrac: An effective distance metric for microbial community comparison. ISME J. 2011, 5, 169–172. [Google Scholar] [CrossRef] [PubMed]
  39. Bever, J.D.; Platt, T.G.; Morton, E.R. Microbial population and community dynamics on plant roots and their feedbacks on plant communities. Annu. Rev. Microbiol. 2012, 66, 265–283. [Google Scholar] [CrossRef] [PubMed]
  40. Hartman, K.; Tringe, S.G. Interactions between plants and soil shaping the root microbiome under abiotic stress. Biochem. J. 2019, 476, 2705–2724. [Google Scholar] [CrossRef] [PubMed]
  41. Trivedi, P.; Batista, B.D.; Bazany, K.E.; Singh, B.K. Plant–microbiome interactions under a changing world: Responses, consequences and perspectives. New Phytol. 2022, 234, 1951–1959. [Google Scholar] [CrossRef] [PubMed]
  42. Saleem, M.; Law, A.D.; Sahib, M.R.; Pervaiz, Z.H.; Zhang, Q. Impact of root system architecture on rhizosphere and root microbiome. Rhizosphere 2018, 6, 47–51. [Google Scholar] [CrossRef]
  43. Martin, F.M.; Perotto, S.; Bonfante, P. Mycorrhizal fungi: A fungal community at the interface between soil and roots. In The Rhizosphere; CRC Press: Boca Raton, FL, USA, 2000; pp. 279–312. [Google Scholar]
  44. Maestre, F.T.; Benito, B.M.; Berdugo, M.; Concostrina-Zubiri, L.; Delgado-Baquerizo, M.; Eldridge, D.J.; Guirado, E.; Gross, N.; Kéfi, S.; Le Bagousse-Pinguet, Y.; et al. Biogeography of global drylands. New Phytol. 2021, 231, 540–558. [Google Scholar] [CrossRef]
  45. Hernández-Cáceres, D.; Stokes, A.; Angeles-Alvarez, G.; Abadie, J.; Anthelme, F.; Bounous, M.; Freschet, G.T.; Roumet, C.; Weemstra, M.; Merino-Martín, L.; et al. Vegetation creates microenvironments that influence soil microbial activity and functional diversity along an elevation gradient. Soil Biol. Biochem. 2022, 165, 108485. [Google Scholar] [CrossRef]
  46. Gray, S.B.; Brady, S.M. Plant developmental responses to climate change. Dev. Biol. 2016, 419, 64–77. [Google Scholar] [CrossRef] [PubMed]
  47. Lynch, J.P.; St. Clair, S.B. Mineral stress: The missing link in understanding how global climate change will affect plants in real world soils. Field Crop. Res. 2004, 90, 101–115. [Google Scholar] [CrossRef]
  48. Fierer, N.; Leff, J.W.; Adams, B.J.; Nielsen, U.N.; Bates, S.T.; Lauber, C.L.; Owens, S.; Gilbert, J.A.; Wall, D.H.; Caporaso, J.G. Cross-biome metagenomic analyses of soil microbial communities and their functional attributes. Proc. Natl. Acad. Sci. USA 2012, 109, 21390–21395. [Google Scholar] [CrossRef] [PubMed]
  49. Lauber, C.L.; Hamady, M.; Knight, R.; Fierer, N. Pyrosequencing-based assessment of soil pH as a predictor of soil bacterial community structure at the continental scale. Appl. Environ. Microbiol. 2009, 75, 5111–5120. [Google Scholar] [CrossRef]
  50. Liu, B.; Hu, Y.; Wang, Y.; Xue, H.; Li, Z.; Li, M. Effects of saline-alkali stress on bacterial and fungal community diversity in Leymus chinensis rhizosphere soil. Environ. Sci. Pollut. Res. 2022, 29, 70000–70013. [Google Scholar] [CrossRef]
  51. Xu, X.; Chen, C.; Zhang, Z.; Sun, Z.; Chen, Y.; Jiang, J.; Shen, Z. The influence of environmental factors on communities of arbuscular mycorrhizal fungi associated with Chenopodium ambrosioides revealed by MiSeq sequencing investigation. Sci. Rep. 2017, 7, srep45134. [Google Scholar] [CrossRef]
  52. Bai, X.; Zhang, E.; Wu, J.; Ma, D.; Zhang, C.; Zhang, B.; Liu, Y.; Zhang, Z.; Tian, F.; Zhao, H.; et al. Soil fungal community is more sensitive than bacterial community to modified materials application in saline–alkali land of Hetao Plain. Front. Microbiol. 2024, 15, 1255536. [Google Scholar] [CrossRef] [PubMed]
  53. Zhu, L.; Wei, Z.; Yang, T.; Zhao, X.; Dang, Q.; Chen, X.; Wu, J.; Zhao, Y. Core microorganisms promote the transformation of DOM fractions with different molecular weights to improve the stability during composting. Bioresour. Technol. 2020, 299, 122575. [Google Scholar] [CrossRef] [PubMed]
Figure 1. Map of the 25 field sites for fungal communities in the root rhizosphere and endosphere of H. rhamnoides in the arid regions of Northwest China.
Jof 10 00679 g001
Figure 2. Rarefaction curve analysis for all samples. The horizontal axis represents the sequencing depth, while the vertical axis represents the corresponding alpha diversity index. When the curve levels off, it indicates that the sequencing depth has reached a reasonable point, and additional data will not significantly impact the alpha diversity index.
Jof 10 00679 g002
Figure 3. Venn diagrams of endophytic fungus species in H. rhamnoides roots at different altitudes at the ASV level. (a) Low altitude; (b) mid-altitude; (c) high altitude. The colors represent different plots, and the numbers represent ASV counts.
Jof 10 00679 g003
Figure 4. Shannon index, observed features, dominance, Chao1 index, pielou-e, and Simpson index inter-group difference box plot. The horizontal axis of the box plot represents the groups, while the vertical axis represents the corresponding alpha diversity index values. Different colors represent different plots.
Jof 10 00679 g004
Figure 5. The relationship between endophytic fungus alpha diversity (Shannon and Chao1 indices) and geographical factors (longitude, latitude, and altitude). The different colored circles each represent samples from different sites.
Jof 10 00679 g005
Figure 6. Weighted and unweighted Unifrac distance box plots. Beta diversity analysis reflects the composition of biological communities between different samples. Different colors represent different plots.
Jof 10 00679 g006
Figure 7. NMDS distribution of fungi in rhizomes of H. rhamnoides at different altitudes. (a) Low altitude; (b) mid-altitude; (c) high altitude. NMDS analysis represents samples as points in a multidimensional space, where the degree of difference between samples is reflected by the distance between points. This analysis illustrates both inter-group and intra-group variations among the samples.
Jof 10 00679 g007
Figure 8. Weighted Unifrac distance 2D PCoA diagrams. The horizontal axis represents one principal component, while the vertical axis represents another principal component. The percentage indicates the contribution of each principal component to the variation among samples. Each point in the plot represents a sample, with samples from the same group denoted by the same color.
Jof 10 00679 g008
Figure 9. Representative sequences of the top 100 genera. (The colors of branches and sectors indicate their corresponding phylum, while the stacked column chart outside the sector ring represents the abundance distribution information of the genus in different samples).
Jof 10 00679 g009
Figure 10. UPGMA clustering tree based on weighted Unifrac distance. On the left is the UPGMA clustering tree structure, and on the right is the relative abundance distribution of species at the phylum level for each sample.
Jof 10 00679 g010
Figure 11. Environmental factors of rhizosphere soil of H. rhamnoide and db-RDA analysis. The axes represent major variation components, with arrows indicating the direction and strength of environmental variables. Points represent samples or species, and the proximity to an arrow suggests a stronger association with that variable. Longer arrows indicate a greater influence of the environmental variable.
Jof 10 00679 g011
Figure 12. Mantel test correlation heat map of fungi (family, genus, species, and ASV) and environmental factors (AMT, AMP, salinity, altitude, latitude, longitude, AP, OM, AK, TP, HN, TK, TN, and pH) in roots. The colors in the heat map represent the strength of the correlation. The significance levels are as follows: p < 0.05, one asterisk (*); p < 0.01, two asterisks (**); p < 0.001, three asterisks (***); p < 0.0001, four asterisks (****).
Jof 10 00679 g012
Figure 13. The relationship between soil physicochemical (TN, HN, OM, and pH) and geographical factors (AMT, AMP, altitude, latitude, and longitude). The different colored circles each represent samples from different sites.
Jof 10 00679 g013
Figure 14. Relative abundance plot. The horizontal axis represents the sample names; the vertical axis indicates the relative abundance. “Others” represents the sum of relative abundances for all functional information not included among the ten features shown in the figure. (a) Relative abundance of different trophic types; (b) relative abundance bar diagram of ecological function groups.
Jof 10 00679 g014
Figure 15. Functional annotations and their abundance information. The heat map displays the correlation between distance matrices, with each cell representing the correlation coefficient between two matrices. The colors indicate the strength and direction of the correlation. The significance levels are as follows: p < 0.05, one asterisk (*); p < 0.01, two asterisks (**); p < 0.001, three asterisks (***); p < 0.0001, four asterisks (****).
Jof 10 00679 g015
Figure 16. Molecular network diagram of intra-root fungi. The size of each genus represents its average relative abundance. Nodes of the same color represent the same phylum, and the thickness of the edges between nodes is proportional to the absolute value of the species interaction correlation coefficient. Red edges represent positive correlations between genera.
Jof 10 00679 g016
Table 1. Physicochemical property information of rhizosphere soil at sampling sites.
SamplepHMoistureSalinityTNg/kgTKg/kgHNmg/kgTPg/kgAKmg/kgOMg/kgAPmg/kg
P17.60014.5193.2703.050 15.489225.5540.75339.06556.7726.735
P28.07011.0934.3271.787 19.045106.0490.63667.98026.7042.097
P37.53032.7451.6135.972 20.600413.2710.991157.38695.3522.847
P47.9907.2092.4332.550 18.337181.0340.63547.38041.7691.204
P58.08018.1954.1801.321 19.33989.0880.51621.38822.7820.929
P67.65023.8791.0672.612 17.951198.9940.58621.16442.6553.069
P77.92010.7024.6372.634 19.223158.8220.72189.62944.4972.832
P86.85017.7261.4572.645 13.982199.8541.46419.00844.2690.795
P97.9204.2225.2570.903 18.32546.4340.56087.4779.0413.696
P106.85017.6320.8431.649 17.96598.3430.591215.69822.7291.254
P118.39016.9600.9102.140 16.081157.3880.74785.09138.0317.981
P128.0803.7215.0501.832 18.272127.1500.53290.19827.4586.109
P138.01019.7590.9671.913 18.256124.9270.61528.36531.1792.090
P148.3607.8130.8830.476 18.37421.1790.36618.4433.6520.511
P158.7207.6165.9400.613 20.67918.0100.55136.3993.6040.636
P167.75022.0091.9435.187 20.630373.0190.57133.4153.8633.306
P178.0507.4393.6072.222 17.206124.0720.676139.98340.5952.699
P188.28011.7790.7970.853 18.20144.8530.61354.28832.45017.454
P197.97012.2721.7801.981 17.660136.5790.679152.8019.5883.972
P207.48012.2881.7503.092 19.510213.3320.51466.05930.9303.160
P216.46028.3960.6975.003 18.552397.3731.16742.63098.5843.389
P227.84012.8301.5702.536 19.443158.5710.923135.01043.6171.182
P237.8907.2201.4803.299 19.760232.1050.793153.39549.1567.157
P248.3108.2491.2130.770 18.39229.0431.252144.1989.4555.728
P257.9506.9481.2471.124 18.58270.9070.60884.82916.1310.365
Table 2. Species classification of sampling sites.
SamplePhylumClassOrderFamilyGenusSpeciesASV
P161325395253216
P251329516565126
P361832587378197
P462141739184250
P551731485758146
P681840628491271
P761328455354120
P861730375451132
P961533578283200
P1051124375762196
P1181736618691236
P1271327374651116
P137193962100101266
P1451534516770202
P1541226445855154
P1661737649688190
P1751228546863159
P1871736567068256
P1982145668893281
P2081939577072210
P21819437410499257
P223122635474795
P2371330495354149
P2461529465961157
P2551026334447132
Table 3. Alpha diversity index for all samples.
SampleChao1DominanceGoods_CoverageObserved_FeaturesPielou_eShannonSimpson
P1232.1670.112170.5614.3570.9
P2134.50.09611270.5513.850.904
P3199.20.0711980.6384.8680.93
P4266.5450.05112510.635.0210.949
P5156.5450.25311470.4162.9970.747
P6280.4620.11112700.5284.2620.889
P7125.50.19111210.4383.0310.809
P8149.50.12111330.5483.8660.879
P9206.0770.09312010.584.4380.907
P10199.10.15811970.5193.9530.842
P11242.1110.1612360.5033.9680.84
P12123.2730.18711150.4413.0180.813
P13272.0910.06512650.6194.9840.935
P14204.60.07712010.6144.6960.923
P15153.0830.1111530.5854.2470.89
P16200.40.19711890.4313.2570.803
P171610.13411580.5343.9010.866
P18256.50.11712550.5484.3790.883
P19285.8330.11812800.5364.3540.882
P20212.2730.07712090.5924.5670.923
P21274.40.06212560.6144.9140.938
P2295.6670.2381940.4322.8310.762
P23150.5450.14711480.5223.7630.853
P24165.0670.18611560.4733.4440.814
P25132.50.13511310.5443.8240.865
Disclaimer/Publisher’s Note: The statements, opinions and data contained in all publications are solely those of the individual author(s) and contributor(s) and not of MDPI and/or the editor(s). MDPI and/or the editor(s) disclaim responsibility for any injury to people or property resulting from any ideas, methods, instructions or products referred to in the content.