Article

The Cardiovascular-Mortality-Based Estimate for Normal Range of the Ankle–Brachial Index (ABI)

1
Department of Surgery, University of Turku, 20500 Turku, Finland
2
Department of Vascular Surgery, Abdominal Center, Helsinki University Hospital and University of Helsinki, 00100 Helsinki, Finland
3
Centre for Vascular Surgery and Interventional Radiology, Tampere University Hospital, 33520 Tampere, Finland
4
Department of General Practice, University of Turku, 20500 Turku, Finland
5
Department of Surgery, Satasairaala, 28500 Pori, Finland
*
Author to whom correspondence should be addressed.
J. Cardiovasc. Dev. Dis. 2022, 9(5), 147; https://doi.org/10.3390/jcdd9050147
Submission received: 16 April 2022 / Revised: 2 May 2022 / Accepted: 3 May 2022 / Published: 5 May 2022

Abstract

:
Background: The ankle–brachial index (ABI) is a first-line examination in cardiovascular risk evaluation. Since cut-off values for normal ABI vary, the aim of the present study was to identify the cardiovascular-mortality-based estimate for the normal range of the ABI. After determining the reference range for the ABI, the corresponding toe–brachial index (TBI) and toe pressure for normal ABI were analyzed. Methods: All consecutive non-invasive pressure measurements in the vascular laboratory of a large university hospital 2011–2013 inclusive were collected and combined with patient characteristics and official dates and causes of death. Patients with an ABI range of 0.8–1.4 on both lower limbs were included in this study. Results: From 2751 patients, 868 had bilateral ABI values within the inclusion. Both ABI category ranges 0.80–0.89 and 0.90–0.99 had poorer survival compared to ABI categories 1.00–1.29 (p < 0.05). The 1-, 3-, and 5-year cardiovascular-death-free survival for respective ABI categories 0.80–0.99 vs. 1.00–1.29 were 90% vs. 96%, 84% vs. 92%, and 60% vs. 87%. The 1-, 3-, and 5-year overall survival for ABI categories 0.80–0.99 vs. 1.00–1.29 were 85% vs. 92%, 75% vs. 83%, and 42% vs. 74%. Conclusions: Borderline ABI (0.90–0.99) associates with higher overall and cardiovascular mortality compared to ABI values 1.00–1.29.

1. Introduction

Cardiovascular morbidity is a significant cause of functional disability and mortality [1]. Peripheral artery disease (PAD) is the strongest risk factor for major adverse cardiovascular events (MACE) and cardiovascular-associated mortality [1,2]. The ankle–brachial index (ABI) is the ratio between the ankle and brachial systolic blood pressures (SPB) and is a simple, non-invasive and inexpensive method to detect PAD that is also used to identify patients with high cardiovascular risk. The associations of abnormal ABI with the risk of cardiovascular events and death have been intensively studied. Nevertheless, there is a lack of consensus about normal ABI values, as these vary between 0.90 and 1.4 [2,3,4,5,6].
The lower limit for normal ABI is considered to be between 0.90 and 1.10 [7,8,9,10,11,12,13]. Previous studies suggest the lower cut-off level at 0.90 [2,5,6,14,15]. Several studies and consensus statements, however, propose a borderline range of 0.90–0.99, below which ABI is associated with an increased risk of cardiovascular morbidity and mortality [7,15,16,17,18]. Therefore, the lower cut-off value for normal ABI remains controversial.
A strong body of evidence concerning ABI and cardiovascular risk has hitherto omitted data for abnormally high ABI values [7,19]. Nonetheless, it is well established that the stiffening of the arterial wall and abnormally high ABI values are associated with an increased risk for cardiovascular events and even higher mortality than those values that are below normal [3,9,10,12]. According to the literature, the upper ABI cut-off for abnormal high ABI varies between 1.3 and 1.4 [3,9].
The aim of the present study was to identify the lower and upper cut-off values for normal ABI based on the cardiovascular mortality of the selected cohort.

2. Materials and Methods

The present study is a retrospective registry-based cohort study. The data consist of all consecutive ABI measurements performed in the vascular laboratory at the department of clinical physiology of the University Hospital of Turku from 1 January 2011 to 31 December 2013. All patients had leg-related symptoms, and ABI measurements were the first line of investigation before vascular consultation. The vascular laboratory serves as a single unit and provides standardized non-invasive pressure measurements that cover a population of 480,000 inhabitants. All non-emergent patients referred to vascular surgical outpatient treatment had ABI and toe–brachial index (TBI) measurements. Only patients with bilateral ABIs of 0.80–1.40 were included in the group since these individuals were considered to present normal or borderline ABI values and a low risk for cardiovascular and overall mortality. In the case of multiple measurements, the first measurement during the study period for each patient was recorded. Patient files were followed-up until 1 January 2020, which was considered the end of the study. The review board of the University of Turku reviewed and accepted the study (IRB number T344/2017). Due to the nature of the study, no informed consent from the patients was required.

2.1. Non-Invasive Pressure Measurements

Trained nurses took ABI, TBI, and toe pressure (TP) measurements in accordance with European Society for Vascular Surgery guidelines [2]. All measurements were performed with the patient in the supine position with the feet at heart level and in a standardized environment. The protocol entails the systolic arterial pressure of the anterior tibial and posterior tibial artery blood pressures being measured at the level of the ankle; for TP, it was measured at the big toe, and the systolic pressure of the brachial artery with measured with the laser Doppler method using a Periflux 6000 (Perimed AB, Järfälla, Sweden) device. When possible, non-invasive pressures were measured for both lower limbs. ABI was calculated by dividing the higher ankle SBP with the corresponding higher brachial SBP [3]. Only patients with ABI values between 0.80 and 1.40 on both limbs were included in the study cohort. The ABI of the limb with lower value was set as the index ABI. For the initial analyses, ABI indices were divided into 6 category ranges: 0.80–0.89, 0.90–0.99, 1.00–1.09, 1.10–1.19, 1.20–1.29, and 1.30–1.40.

2.2. Data Collection

Baseline characteristics and medical history of the patients were collected retrospectively from the Hospital District of Southwest Finland electronic patient registry, which covers all operation and patient records in the hospital district. Comorbidities were listed for each patient in accordance with the Finnish version of the ICD-10 (International Statistical Classification of Diseases and Related Health Problems). The causes and dates of death were provided by the Causes of Death Registry of Statistics Finland. The Causes of Death Registry registers all deaths of people with permanent residency in Finland. The registry comprises comprehensive data on mortality in Finland. Only 0.2% of all causes of death remain unspecified annually [20].

2.3. Statistical Analysis

All statistical analyses were performed using SPSS version 27 for (IBM, Armonk, NY, USA). Descriptive statistics were used to compare patient demographics. Mean values and standard deviation (SD) were applied for normal distributions. The Fisher’s exact test was applied to compare categorical variables, and the Student’s t-test and ANOVA were used to compare continuous variables after normal distributions of the values were tested using the Shapiro–Wilk test. Survival was calculated by Kaplan–Meier survival analysis, and risk analyses were conducted using multinominal logistic analyses. According to the power analysis for survival analyses, the sample size was estimated at 99 for each range category. p-values ≤0.05 were considered statistically significant.

3. Results

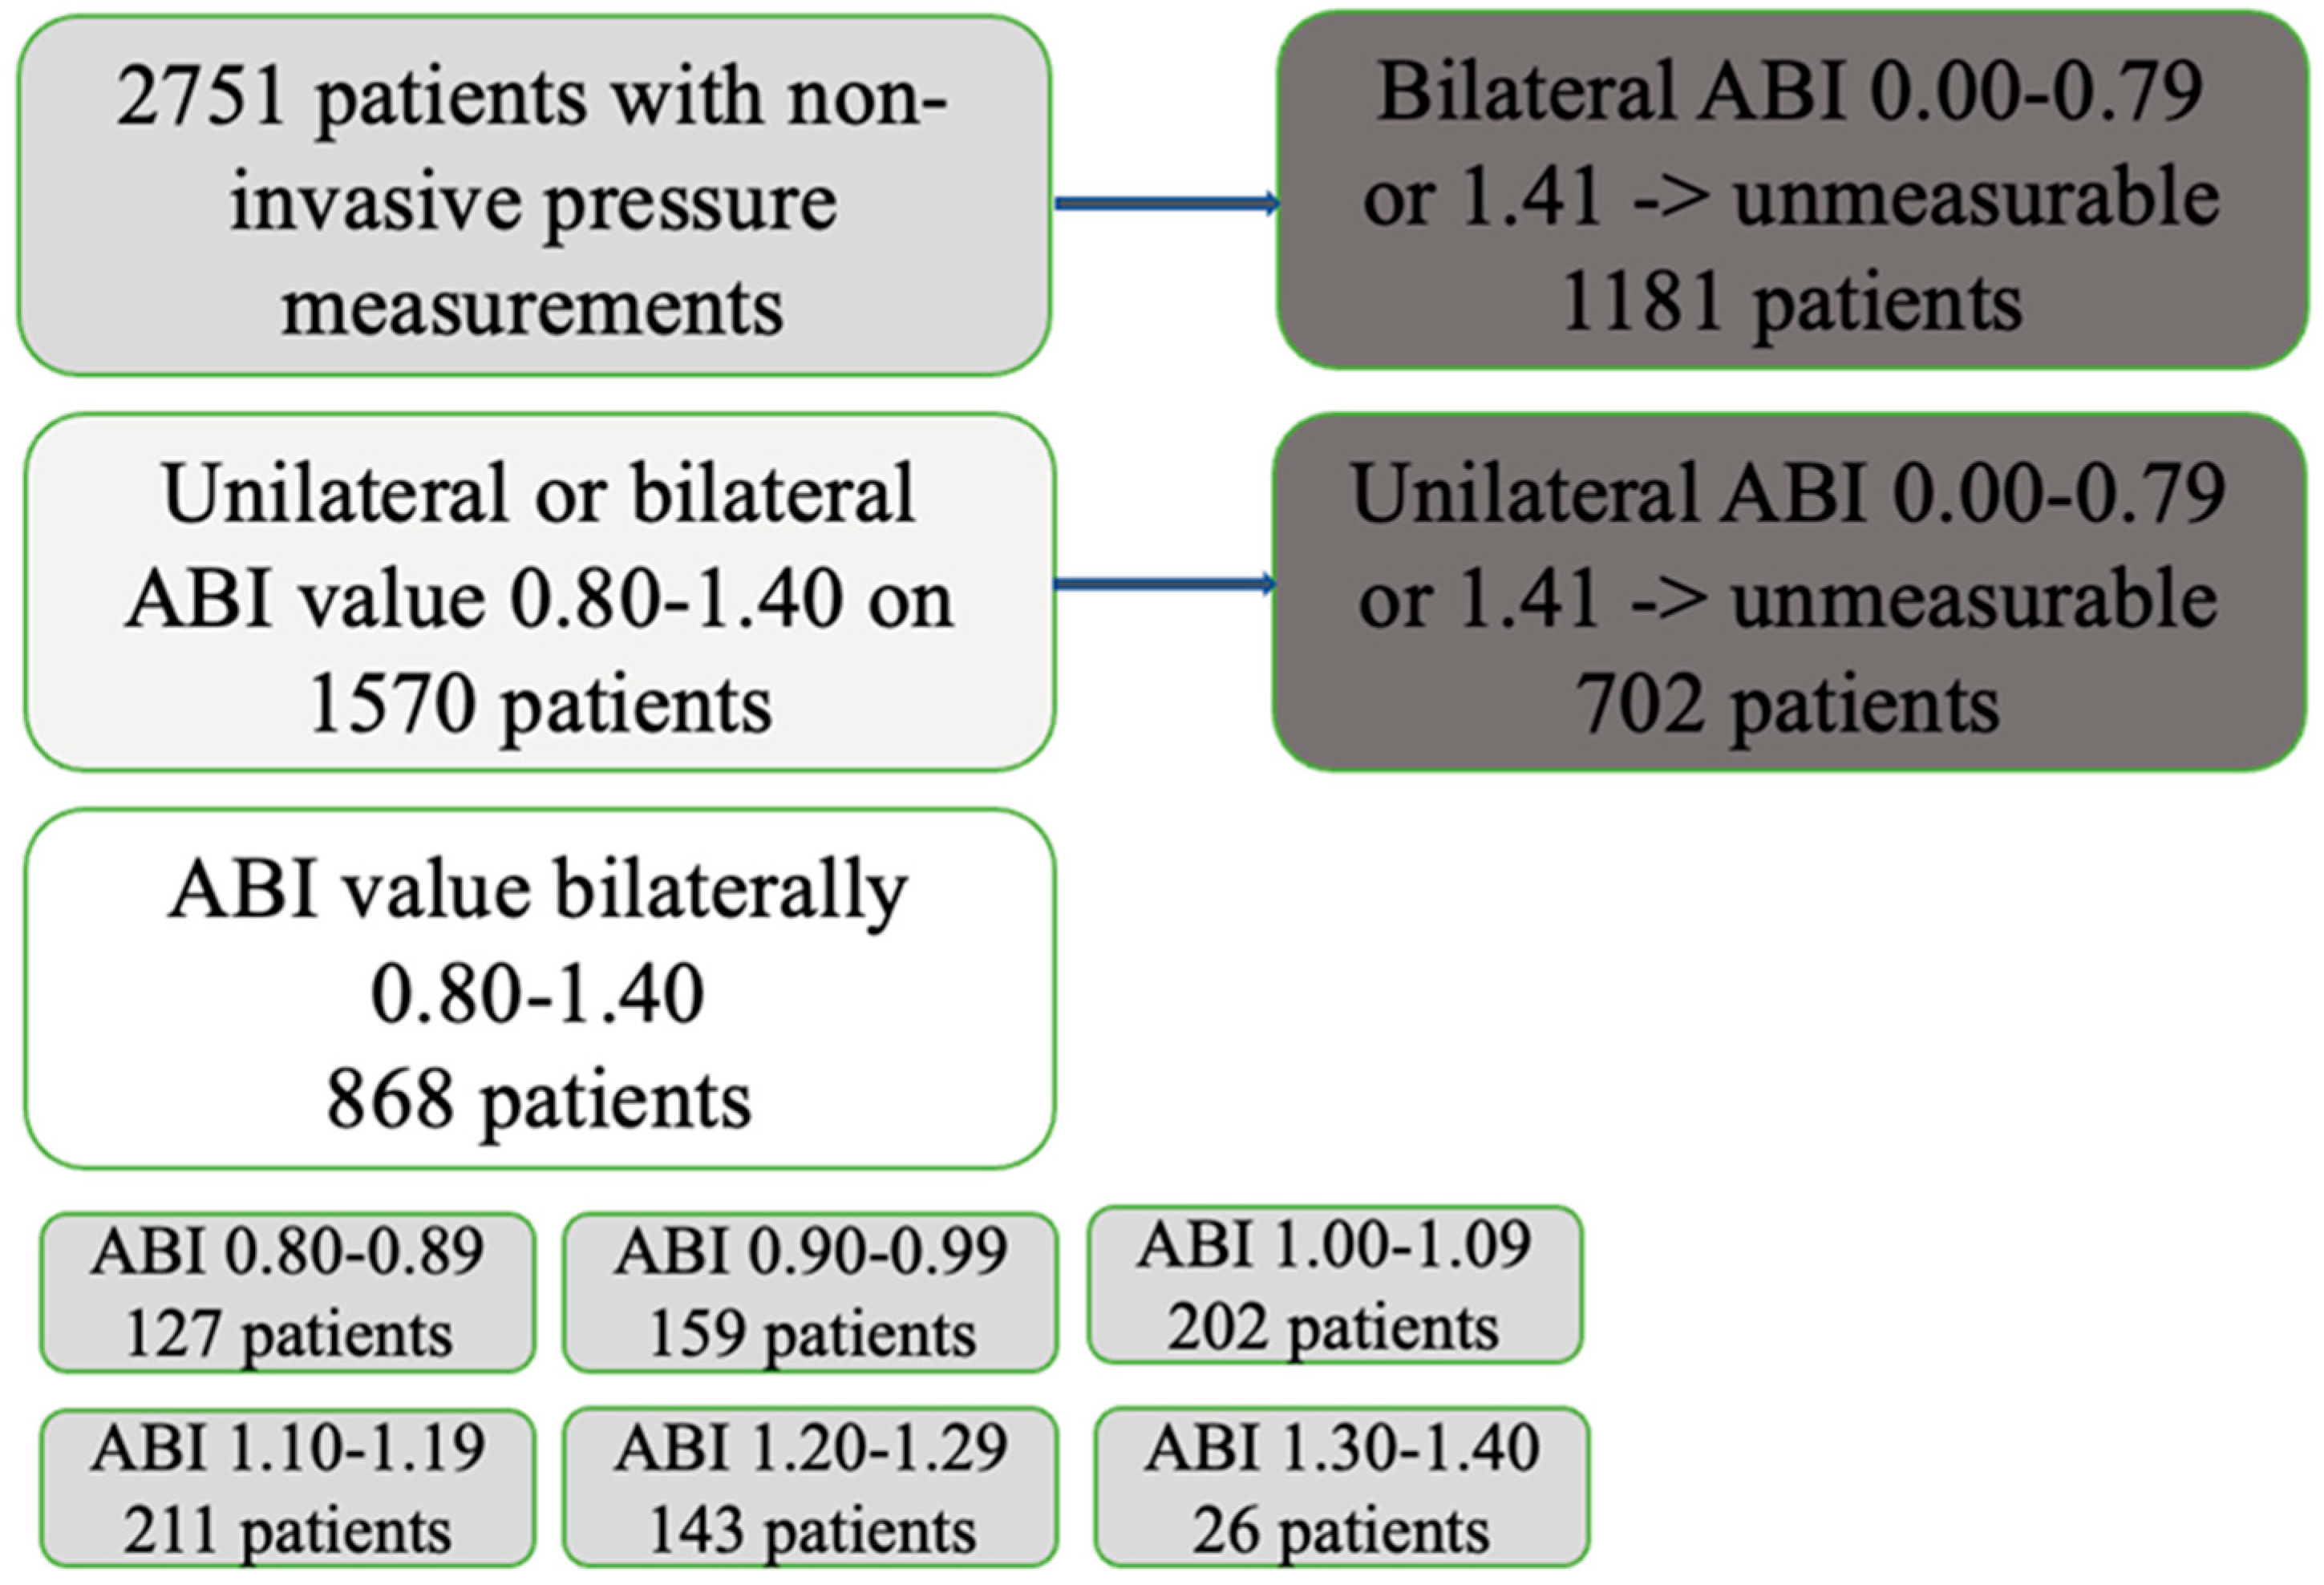
3.1. Study Cohort and Demography

A total of 2751 patients had non-invasive lower limb pressure measurements at the department of clinical physiology at Turku University Hospital during the study period. Of these, 868 had bilateral ABI values between 0.80 and 1.40 and were included in the study. Figure 1 shows the study flow chart, and Table 1 and Table 2 show the demography.

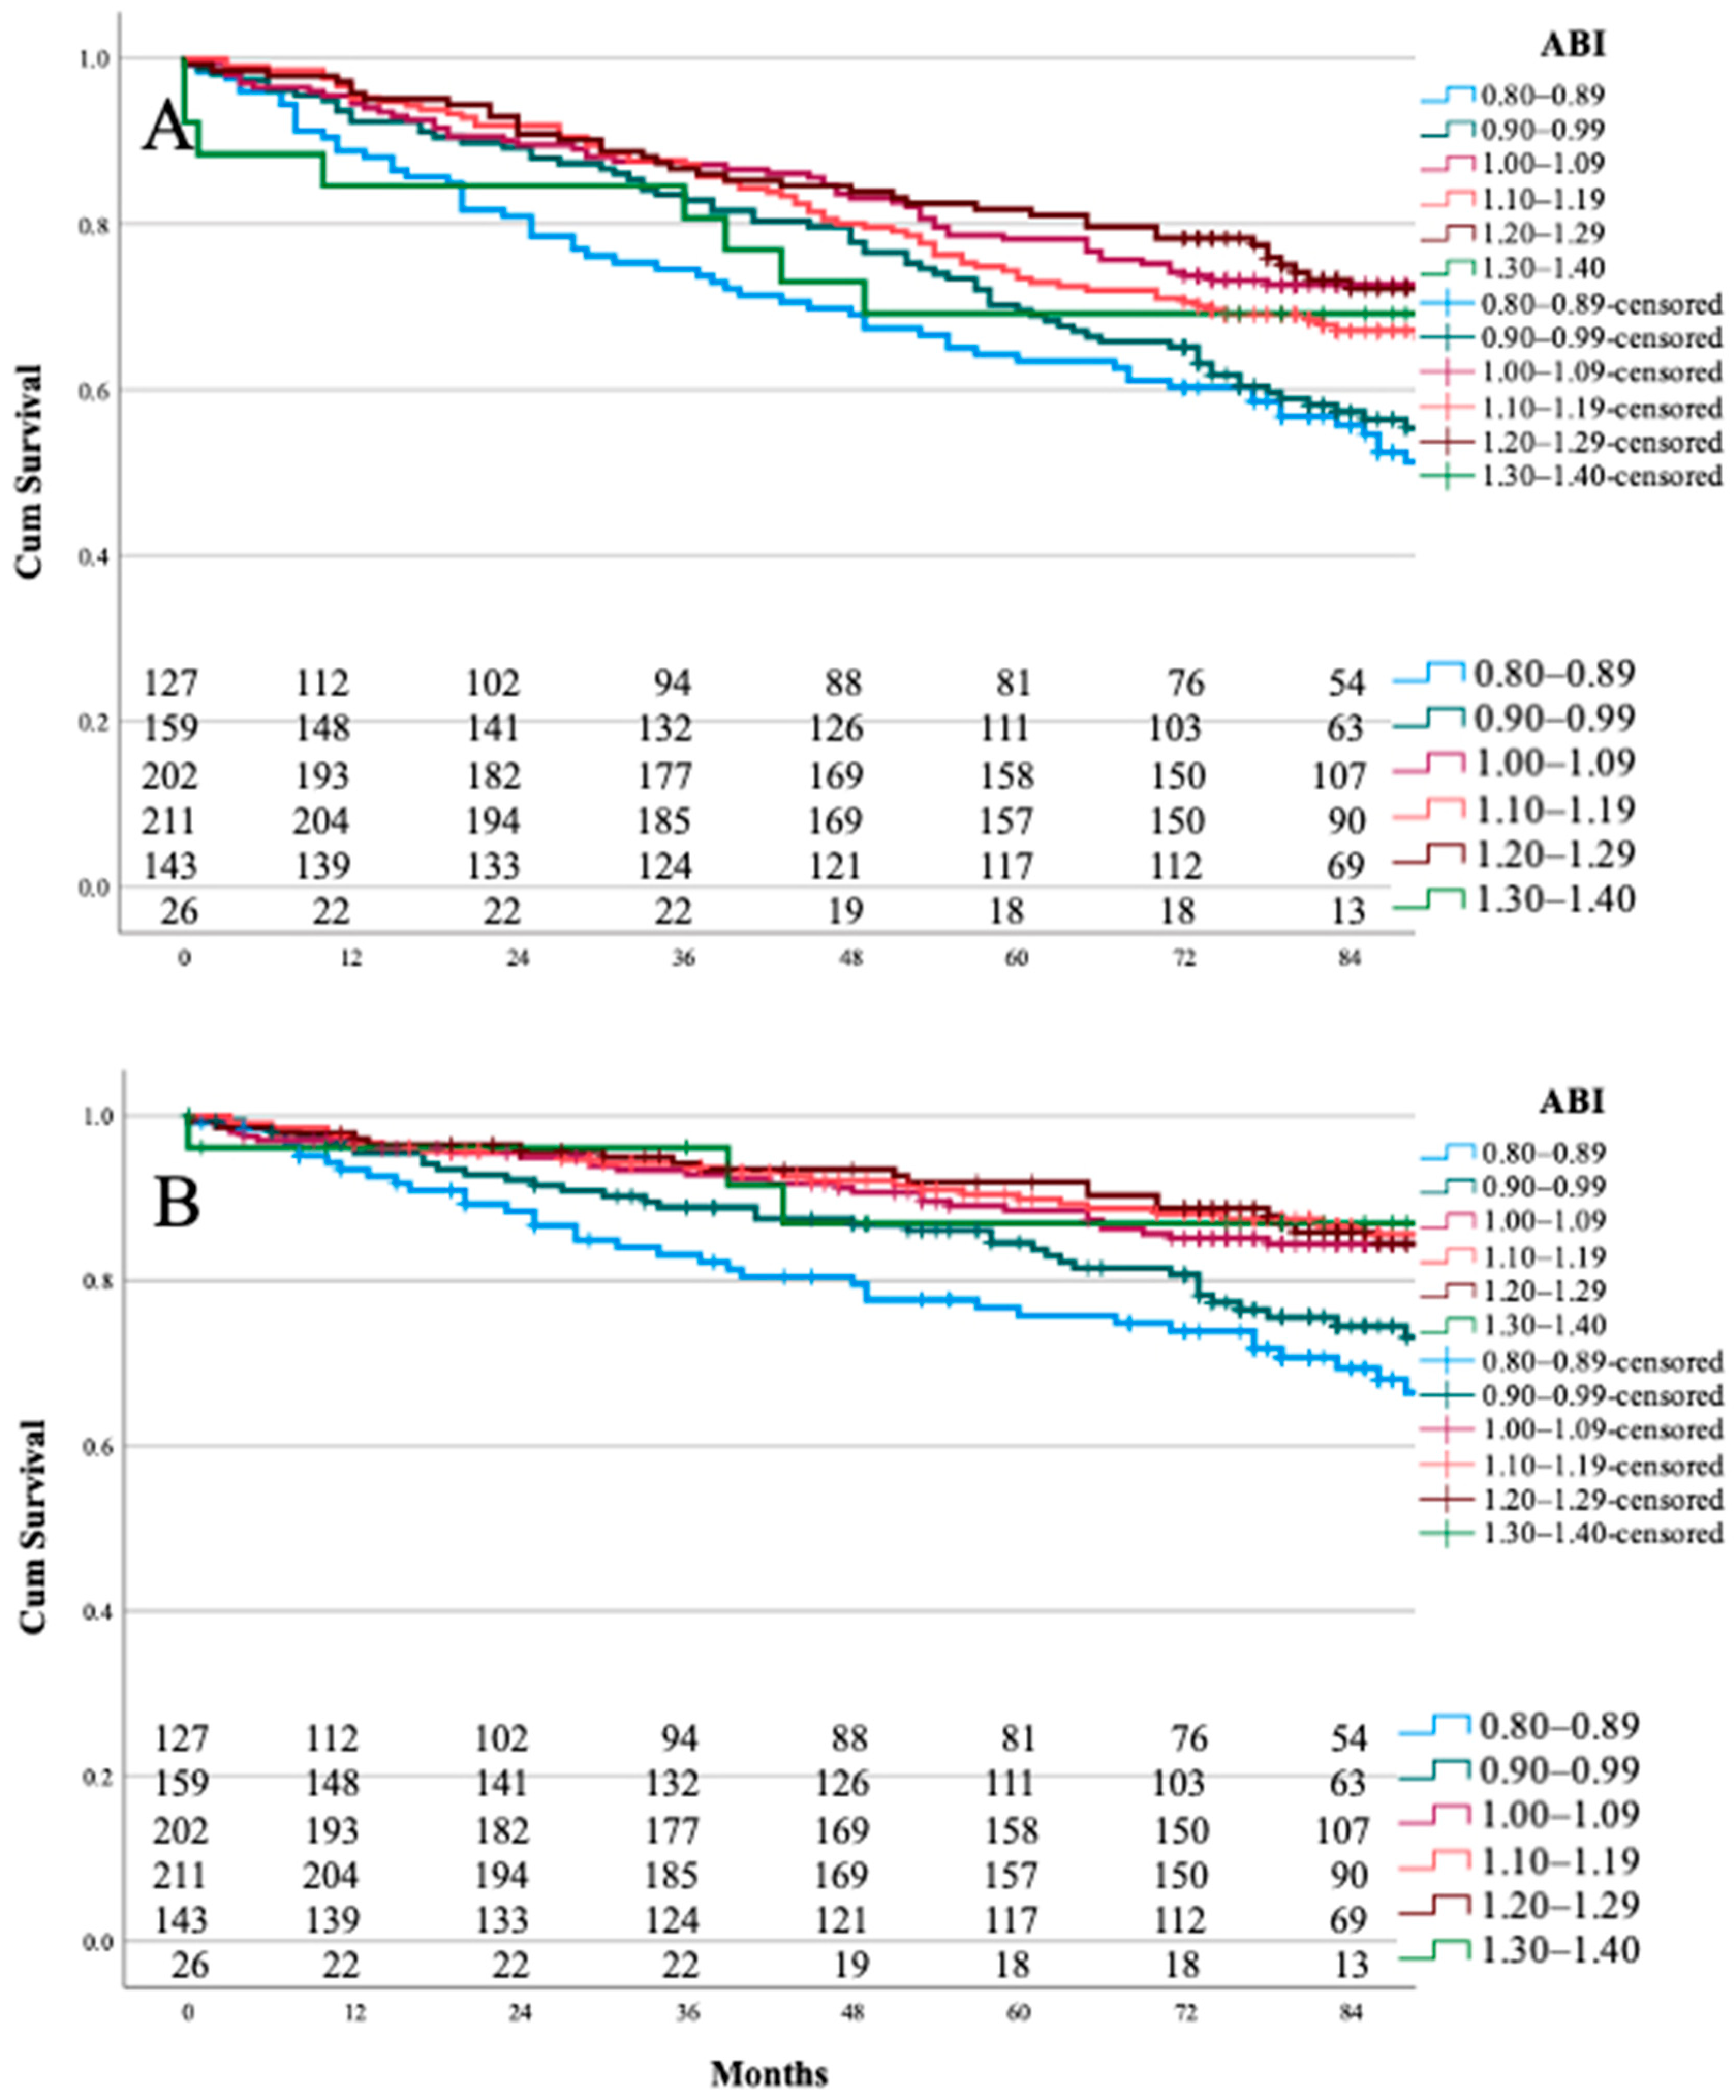
3.2. ABI Range Category and Survival

The estimated survivals and cardiovascular-death-free survivals and 1-, 3-, and 5-year survival rates for each ABI range category are presented in Table 3A,B.
The associations between age-adjusted overall mortality and ABI range category were assessed by multinominal logistic analyses. The ABI range category of 0.80–0.89 was set as the reference. Odds Ratio (OR) values for the ABI range categories were as follows: 0.90–0.99 OR = 0.949 (p = 0.841), 1.00–1.09 OR = 0.411 (p < 0.001), 1.10–1.19 OR = 0.526 (p < 0.01), 1.20–1.29 OR = 0.452 (p = 0.004), and 1.30–1.40 OR = 0.975 (p = 0.071). Correspondingly, the ORs for age-adjusted overall mortality for the ABI range category of 0.90–0.99 set as reference were: 0.80–0.89 OR = 1.05 (p = 0.841), 1.00–1.09 OR = 0.433 (p < 0.001), 1.10–1.19 OR = 0.554 (p = 0.011), 1.20–1.29 OR = 0.476 (p = 0.005), and 1.30–1.40 OR = 0.601 (p = 0.283)
Similarly, associations between age-adjusted cardiovascular mortality and the ABI range category were assessed. The ORs for the the ABI range category of 0.80–0.89 set as reference were: 0.90–0.99 OR = 0.856 (p = 0.579), 1.00–1.09 OR = 0.442 (p = 0.004), 1.10–1.19 OR = 0.348 (p < 0.001), 1.20–1.29 OR = 0.449 (p = 0.014), and 1.30–1.40 OR = 0.383 (p = 0.147). Correspondingly, the ORs for age-adjusted cardiovascular mortality for the ABI range category of 0.90–0.99 set as reference were: 0.80–0.89 OR = 1.17 (p = 0.579), 1.00–1.09 OR = 0.516 (p = 0.017), 1.10–1.19 OR = 0.406 (p = 0.002), 1.20–1.29 OR = 0.525 (p = 0.042), and 1.30–1.40 OR = 0.447 (p = 0.221)
The Kaplan–Meier curves for both overall and cardiovascular-death-free survivals are presented in Figure 2A,B.

3.3. TBI and Toe Pressure Values

The corresponding TBI and toe pressure values for patients with the highest cardiovascular-death-free survival (ABI 1.00–1.29) were calculated. A total of 582 patients with bilateral ABI (1.00–1.29) were identified. The mean TP for these patients was 97.1 mmHg (SD 25.7), and corresponding TBI values had a mean of 0.711 (SD 0.173).

4. Discussion

According to our present observations, the cardiovascular-death-free and overall survival for patients with ABI values between 1.00 and 1.29 are better compared to the ABI range of 0.80–0.90. The borderline ABI values of 0.90–0.99 are associated with increased mortality compared to the ABI range category of 1.00–1.29. Another non-invasive index TBI was measured based on these ABI values. The corresponding TBI for ABI values 1.00–1.29 was 0.711 (SD 0.173).

4.1. Normal Range for ABI

Although ABI is a potent tool for cardiovascular risk analyses, the normal lower cut-off value varies between 0.90 and 1.10 [7,13,18,19]. A majority of the literature and international guidelines state an ABI of 0.90 as the cut-off for a two-fold increased risk of a cardiovascular event [2,5,6]. Recently, borderline ABI has become accepted as a concept that refers to values between 0.90 and 0.99. Many cohort studies suggest that borderline ABI seems to be associated with increased cardiovascular morbidity and mortality [15,16,17,21] in comparison to the normal ABI range of 1.00–1.40. An IMPACT-ABI study on symptomatic peripheral arterial disease (PAD) patients demonstrated that even a 10% higher MACE at 4 years and cardiovascular death [17] among the borderline ABI group compared to ABI range category 1.00–1.40 is in line with the findings of an ARTPER cohort study with a 9-year follow-up. Borderline ABI patients are exposed to a higher incidence of MACE annually in comparison to those with normal ABIs (1.00–1.40) [21,22]. According to the present study and data obtained from other studies, the normal lower cut-off value for ABI is 1.00, and our data also demonstrate a 10% higher cardiovascular mortality rate for the borderline ABI category (0.90–0.99). Interestingly we did not detect significant differences between ABI ranges 0.80–0.89 and 0.90–0.99, although the survival curves showed small differences between categories.
The upper ABI cut-off value in cardiovascular risk evaluation is accepted as 1.30–1.40 [5,6,13,15,19,23,24]. A study that investigated the relationship between an elevated ABI and the presence of medial arterial calcification (MAC) containing type II diabetic patients demonstrated a test specificity of 15.7% and 30.9%, with a sensitivity of 93.6% and 83.6% for the corresponding cut-off values ≥1.40 and ≥1.30 [25]. In the present study, the approach to detecting the upper cut-off value was different. The cardiovascular-death-free and overall survival rates were compared between categories for every 0.1 increase for ABI values 0.80–1.40. The log-rank test, age-adjusted multilogistic binary analyses, and survival curves all supported similar survival for the ABI categories of 1.00–1.09, 1.10–1.19, and 1.20–1.29. Unfortunately, category 1.30–1.40 was underpowered, as it only contained 26 patients, but by using Kaplan–Meier curve analysis, we found the trend for cardiovascular-death-free survival was similar to that of ABI values of 1.00–1.29. In addition, the ratio of cardiovascular cause of death for ABI values 1.30–1.40 corresponded to the above-mentioned normal ABI values.

4.2. Normal TBI

Carter and Lezack suggested that normal values for TBI vary depending on the comorbidities [26]. The normal values that those authors found were as follows: “young normal” 0.86 ± 0.03, “old normal” 0.91 ± 0.04, patients with diabetes mellitus (DM) 0.83 ± 0.04, coronary artery disease 0.87 ± 0.04, and hypertension 0.81 ± 0.03 [26]. Later, the cut-off value for TBI recommended for patients with DM and abnormally high ABI (>1.40) was 0.70 for TBI [4,27]. The study by Hyun et al. set the range of normal TBI to 0.62–1.08 [13], which they suggested might have diluted the predictive value of TBI in their report. We measured the mean and median TBI for patients with the estimated normal ABI (1.00–1.40) to identify the normal TBI for the present cohort. Based on the present study’s data, the TBI corresponding to normal ABI was 0.711 (SD 0.173), which supports the normal TBI value found in recent guidelines [4]. However, the 0.10 discrepancy between normal values can be explained by a different approach compared to that used in the pioneering work of Carter and Lezack [4,26,27]. Recent guidelines and studies focus on the cut-off for a cardiovascular event and do not determine the normal value in subjects with no detectable PAD. To our knowledge, there is no detailed published analysis of cardiovascular and overall mortality of MACE, but the present study is based on categories with a relatively wide range of TBI values. Further studies are warranted to not only investigate the TBI value that is associated with a normal cardiovascular risk but also for patients without PAD who present with various comorbidities, including DM and coronary artery disease.

4.3. Normal TP

TP is widely used for detecting critical limb-threatening ischemia and malperfusion of the leg [5,6]. However, the value for normal toe pressure published in the literature is not reliable. Based on the present data for ABI, between 1.00 and 1.29, the mean toe pressure is 97.1 mmHg (SD 25.7).

4.4. Strengths and Limitations

Although the present study is based on a relatively large original cohort of patients, unfortunately, the anticipated number of patients in the range category ABI 1.30–1.40 has insufficient statistical power. The non-invasive pressure values were measured in a high-volume standardized vascular laboratory. Values were collected retrospectively from an electronic database as PDF files of the original datasheets. Due to the retrospective nature of our study, all demographic data were based on the official diagnosis. The accuracy was fair, but diagnoses such as atrial fibrillation might vary if treated and would be more reliably evaluated in an observational, prospective follow-up study.

5. Conclusions

Our present study data suggest that an ABI value of 1.00–1.29 is associated with a lower risk of cardiovascular mortality than ABI values < 1.00. The corresponding TBI for the ABI 1.00–1.29 is 0.711 (SD 0.173) and a toe pressure value of 97.1 mmHg (SD 25.7).

6. Patients

The present sample contains unselected patients with leg-related symptoms. Hospital policy requested non-invasive pressure measurements before considering elective vascular consultation. Therefore, the cohort contains a high number of patients with bilateral normal ABI values.

Author Contributions

Conceptualization, E.P., M.L., D.V., P.K., M.V. and H.H.; methodology, E.P., M.L., D.V., P.K., M.V. and H.H.; software, H.H.; validation, E.P., M.L., D.V., P.K., M.V. and H.H.; formal analysis, E.P. and H.H.; investigation, E.P., M.L., D.V. and H.H.; resources, H.H.; data curation, H.H.; writing—original draft preparation, E.P., M.L., D.V., P.K., M.V. and H.H.; writing—review and editing, E.P., M.L., D.V., P.K., M.V. and H.H; visualization, H.H.; supervision, H.H.; project administration, H.H.; funding acquisition, H.H. All authors have read and agreed to the published version of the manuscript.

Funding

This work was supported by federal research grants from both Turku University Hospital and Satasairaala. Suomen Kulttuurirahasto, The Satakunta fund also financially supported the work, grant number 75212239. The funders had no role in the study design, data collection and analyses, decision to publish, or preparation of the manuscript.

Institutional Review Board Statement

This study was conducted in accordance with the Declaration of Helsinki and approved by the review board of Turku University Hospital (IRB number T344/2017).

Informed Consent Statement

Patient consent was waived due to the retrospective nature of the study by the review board of Turku University Hospital.

Data Availability Statement

The data are available upon request. Turku CRC [email protected].

Acknowledgments

Authors want to thank Alisdair Mclean for reviewing and editing the manuscript.

Conflicts of Interest

The authors declare no conflict of interest.

References

  1. Roth, G.A.; Mensah, G.A.; Johnson, C.O.; Addolorato, G.; Ammirati, E.; Baddour, L.M.; Barengo, N.C.; Beaton, A.Z.; Benjamin, E.J.; Benziger, C.P.; et al. Global Burden of Cardiovascular Diseases and Risk Factors, 1990–2019: Update from the GBD 2019 Study. J. Am. Coll. Cardiol. 2020, 76, 2982–3021. [Google Scholar] [CrossRef] [PubMed]
  2. Aboyans, V.; Ricco, J.B.; Bartelink, M.E.L.; Bjorck, M.; Brodmann, M.; Cohnert, T. Editor’s Choice-2017 ESC Guidelines on the Diagnosis and Treatment of Peripheral Arterial Diseases, in collaboration with the European Society for Vascular Surgery (ESVS). Eur. J. Vasc. Endovasc. Surg. 2018, 55, 305–368. [Google Scholar] [CrossRef] [PubMed] [Green Version]
  3. Aboyans, V.; Criqui, M.H.; Abraham, P.; Allison, M.A.; Creager, M.A.; Diehm, C.; Fowkes, F.G.R.; Hiatt, W.R.; Jönsson, B.; Lacroix, P.; et al. Measurement and interpretation of the ankle-brachial index: A scientific statement from the American Heart Association. Circulation 2012, 126, 2890–2909. [Google Scholar] [CrossRef] [PubMed] [Green Version]
  4. Gerhard-Herman, M.D.; Gornik, H.L.; Barrett, C.; Barshes, N.R.; Corriere, M.A.; Drachman, D.E.; Fleisher, L.A.; Fowkes, F.G.R.; Hamburg, N.M.; Kinlay, S.; et al. 2016 AHA/ACC Guideline on the Management of Patients with Lower Extremity Peripheral Artery Disease: A Report of the American College of Cardiology/American Heart Association Task Force on Clinical Practice Guidelines. Circulation 2017, 135, e726–e779. [Google Scholar]
  5. Norgren, L.; Hiatt, W.R.; Dormandy, J.A.; Nehler, M.R.; Harris, K.A.; Fowkes, F.G.R. Inter-Society Consensus for the Management of Peripheral Arterial Disease (TASC II). J. Vasc. Surg. 2007, 45, S5–S67. [Google Scholar] [CrossRef] [Green Version]
  6. Norgren, L.; Hiatt, W.R.; Dormandy, J.A.; Nehler, M.R.; Harris, K.A.; Fowkes, F.G.; TASC II Working Group; Bell, K.; Caporusso, J.; Durand-Zaleski, I.; et al. Inter-Society Consensus for the Management of Peripheral Arterial Disease (TASC II). Eur. J. Vasc. Endovasc. Surg. 2007, 33, S1–S75. [Google Scholar] [CrossRef] [Green Version]
  7. Ankle Brachial Index Collaboration. Ankle brachial index combined with Framingham Risk Score to predict cardiovascular events and mortality: A meta-analysis. JAMA 2008, 300, 197–208. [Google Scholar] [CrossRef] [Green Version]
  8. Criqui, M.H.; McClelland, R.L.; McDermott, M.M.; Allison, M.; Blumenthal, R.S.; Aboyans, V.; Ix, J.H.; Burke, G.L.; Liu, K.; Shea, S. The ankle-brachial index and incident cardiovascular events in the MESA (Multi-Ethnic Study of Atherosclerosis). J. Am. Coll. Cardiol. 2010, 56, 1506–1512. [Google Scholar] [CrossRef]
  9. Wickström, J.-E.; Laivuori, M.; Aro, E.; Sund, R.; Hautero, O.; Venermo, M.; Jalkanen, J.; Hakovirta, H. Toe Pressure and Toe Brachial Index are Predictive of Cardiovascular Mortality, Overall Mortality, and Amputation Free Survival in Patients with Peripheral Artery Disease. Eur. J. Vasc. Endovasc. Surg. 2017, 53, 696–703. [Google Scholar] [CrossRef] [Green Version]
  10. Wickström, J.-E.; Virtanen, J.; Laivuori, M.; Jalkanen, J.; Venermo, M.; Hakovirta, H. Data on association of ankle pressure and ankle brachial index of symptomatic and contralateral lower extremities with overall and cardiovascular mortality in patients with lower extremity peripheral artery disease. Data Brief 2018, 20, 691–697. [Google Scholar] [CrossRef]
  11. Laivuori, M.; Hakovirta, H.; Kauhanen, P.; Sinisalo, J.; Sund, R.; Albäck, A.; Venermo, M. Toe pressure should be part of a vascular surgeon’s first-line investigation in the assessment of lower extremity artery disease and cardiovascular risk of a patient. J. Vasc. Surg. 2020, 73, 641–649. [Google Scholar] [CrossRef]
  12. Jalkanen, J.M.; Wickstrom, J.E.; Venermo, M.; Hakovirta, H.H. Data on amputation free survival of patients with lower limb peripheral artery disease classified according TASC II classification and a new crural index. Data Brief 2016, 8, 242–246. [Google Scholar] [CrossRef] [Green Version]
  13. Hyun, S.; Forbang, N.I.; Allison, M.A.; Denenberg, J.O.; Criqui, M.H.; Ix, J.H. Ankle-brachial index, toe-brachial index, and cardiovascular mortality in persons with and without diabetes mellitus. J. Vasc. Surg. 2014, 60, 390–395. [Google Scholar] [CrossRef] [Green Version]
  14. Korhonen, P.; Aarnio, P. Borderline peripheral arterial disease. Int. J. Angiol. 2008, 17, 175–177. [Google Scholar] [CrossRef] [Green Version]
  15. Grundy, S.M.; Stone, N.J.; Bailey, A.L.; Beam, C.; Birtcher, K.K.; Blumenthal, R.S.; Braun, L.T.; De Ferranti, S.; Faiella-Tommasino, J.; Forman, D.E.; et al. 2018 AHA/ACC/AACVPR/AAPA/ABC/ACPM/ADA/AGS/APhA/ASPC/NLA/PCNA Guideline on the Management of Blood Cholesterol: A Report of the American College of Cardiology/American Heart Association Task Force on Clinical Practice Guidelines. J. Am. Coll. Cardiol. 2019, 73, e285–e350. [Google Scholar] [CrossRef]
  16. Rooke, T.W.; Hirsch, A.T.; Misra, S.; Sidawy, A.N.; Beckman, J.; Findeiss, L.K.; Golzarian, J.; Gornik, H.L.; Halperin, J.L.; Jaff, M.R.; et al. 2011 ACCF/AHA Focused update of the guideline for the management of patients with peripheral artery disease (updating the 2005 guideline): A Report of the American College of Cardiology Foundation/American Heart Association Task Force on Practice Guidelines Developed in Collaboration With the Society for Cardiovascular Angiography and Interventions, Society of Interventional Radiology, Society for Vascular Medicine, and Society for Vascular Surgery. J. Vasc. Surg. 2011, 54, e32–e58. [Google Scholar] [CrossRef] [Green Version]
  17. Miura, T.; Minamisawa, M.; Ueki, Y.; Abe, N.; Nishimura, H.; Hashizume, N.; Mochidome, T.; Harada, M.; Oguchi, Y.; Yoshie, K.; et al. Impressive predictive value of ankle-brachial index for very long-term outcomes in patients with cardiovascular disease: IMPACT-ABI study. PLoS ONE 2017, 12, e0177609. [Google Scholar] [CrossRef] [Green Version]
  18. Tanaka, S.; Kaneko, H.; Kano, H.; Matsuno, S.; Suzuki, S.; Takai, H.; Otsuka, T.; Uejima, T.; Oikawa, Y.; Nagashima, K.; et al. The predictive value of the borderline ankle-brachial index for long-term clinical outcomes: An observational cohort study. Atherosclerosis 2016, 250, 69–76. [Google Scholar] [CrossRef] [Green Version]
  19. Papamichael, C.M.; Lekakis, J.P.; Stamatelopoulos, K.S.; Papaioannou, T.G.; Alevizaki, M.K.; Cimponeriu, A.T.; Kanakakis, J.E.; Papapanagiotou, A.; Kalofoutis, A.T.; Stamatelopoulos, S.F. Ankle-brachial index as a predictor of the extent of coronary atherosclerosis and cardiovascular events in patients with coronary artery disease. Am. J. Cardiol. 2000, 86, 615–618. [Google Scholar] [CrossRef]
  20. Finland, S. Statistics Finland-Quality Description: Causes of Death 2013. Available online: http://www.stat.fi/til/ksyyt/2013/ksyyt_2013_2014-12-30_laa_001_en.html (accessed on 30 September 2019).
  21. Alzamora, M.T.; Fores, R.; Pera, G.; Baena-Diez, J.M.; Valverde, M.; Toran, P. Low, borderline and normal ankle-brachial index as a predictor of incidents outcomes in the Mediterranean based-population ARTPER cohort after 9 years follow-up. PLoS ONE 2019, 14, e0209163. [Google Scholar] [CrossRef] [Green Version]
  22. O’Hare, A.M.; Katz, R.; Shlipak, M.G.; Cushman, M.; Newman, A.B. Mortality and cardiovascular risk across the ankle-arm index spectrum: Results from the Cardiovascular Health Study. Circulation 2006, 113, 388–393. [Google Scholar] [CrossRef] [Green Version]
  23. Alves, L.; Comas-Cufí, M.; Ponjoan, A.; Garcia-Gil, M.; Martí-Lluch, R.; Blanch, J.; Elosua-Bayes, M.; Parramon, D.; Camós, L.; Guzmán, L.E.; et al. Levels of ankle–brachial index and the risk of diabetes mellitus complications. BMJ Open Diabetes Res. Care 2020, 8, e000977. [Google Scholar] [CrossRef] [Green Version]
  24. Visonà, A.; De Paoli, A.; Fedeli, U.; Tonello, D.; Zalunardo, B.; Zanatta, N.; Martini, R.; Pesavento, R.; Cuppini, S.; Prior, M.; et al. Abnormal ankle-brachial index (ABI) predicts primary and secondary cardiovascular risk and cancer mortality. Eur. J. Intern. Med. 2020, 77, 79–85. [Google Scholar] [CrossRef]
  25. Hoek, A.G.; Zwakenberg, S.R.; Elders, P.J.; de Jong, P.A.; Spiering, W.; Bartstra, J.W.; Doesburg, T.; van der Heijden, A.A.; van der Schouw, Y.T.; Beulens, J.W.; et al. An elevated ankle-brachial index is not a valid proxy for peripheral medial arterial calcification. Atherosclerosis 2021, 323, 13–19. [Google Scholar] [CrossRef] [PubMed]
  26. Carter, S.A.; Lezack, J.D. Digital systolic pressures in the lower limb in arterial disease. Circulation 1971, 43, 905–914. [Google Scholar] [CrossRef] [PubMed] [Green Version]
  27. Darban Hosseini Amirkhiz, G.; Babaei, M.R.; Madani, N.H.; Khamseh, M.E. Toe-brachial index is beyond a peripheral issue in patients with type 2 diabetes. PLoS ONE 2021, 16, e0253138. [Google Scholar]
Figure 1. Flow chart of the study. Patients with bilateral ankle–brachial index (ABI) 0.80–1.40 were included in the initial survival analysis.
Jcdd 09 00147 g001
Figure 2. A-B Kaplan–Meier curves for 8-year survival for ABI 0.80–1.40. Panel (A), overall survival; (B), cardiovascular-death-free survival.
Jcdd 09 00147 g002
Table 1. Demography for study cohort of 868 patients with ABI 0.80–1.40.
ABI 0.80–1.40 (n = 868)
mean (SD)
Age67.9
n (%)
Sex male505 (58.2)
CAD236 (27.2)
CHF148 (17.1)
HT466 (53.7)
FA204 (23.5)
CeVD103 (11.9)
DM297 (34.2)
DMI58 (6.7)
DMII239 (27.6)
Dyslipidaemia195 (22.5)
CKD106 (12.2)
COPD87 (10.0)
Rheumatoid disease61 (7.0)
Varicose Ulcer97 (11.2)
CV death160 (18.4)
CAD = coronary artery disease, CHF = chronic heart failure, CKD = chronic kidney dysfunction, COPD = chronic obstructive pulmonary disease, CV = cardiovascular, CeVD = cerebrovascular disease, DM = diabetes mellitus, DM = diabetes mellitus, DM I = type I diabetes mellitus, DM II = type II diabetes mellitus, FA = atrial fibrillation, HT = hypertension, SE standard error.
Table 2. Demography for ABI range categories 0.80–0.89, 0.90–0.99, 1.00–1.09, 1.10–1.19, 1.20–1.29, and 1.30–1.40.
ABI Range Categories
0.80–0.890.90–0.991.00–1.091.10–1.191.20–1.291.30–1.40p value
Mean(SD)
Age70.8 (11.8)68.9 (15.2)68.11 (13.1)68.38 (13.5)64.2 (16.5)63.9 (15.0)<0.001
n(%)
Sex male79 (62.2985 (53.5)110 (54.5)120 (56.9)91 (63.6)20 (76.9)0.105
CAD42 (33.1)57 (35.8)60 (29.7)48 (22.7)21 (14.7)8 (30.8)<0.001
CHF32 (25.2)31 (19.5)28 (13.9)33 (15.6)18 (12.6)6 (23.1)0.053
HT68 (53.5)89 (56.0)111 (55.0)120 (56.9)69 (48.3)9 (34.6)0.238
FA32 (25.2)36 (22.6)47 (23.3)53 (25.1)29 (20.3)7 (26.9)0.893
CeVD16 (12.6)21 (13.2)21 (10.4)23 (10.9)18 (12.6)4 (15.4)0.904
DM43 (33.9)63 (39.6)55 (27.2)68 (32.2)54 (37.8)14 (53.8)0.034
DMI7 (5.5)12 (7.5)14 (6.9)13 (6.2)9 (6.3)3 (11.5)0.867
DMII37 (29.1)50 (31.4)42 (20.8)55 (26.1)45 (31.5)11 (42.3)0.065
Dyslipidaemia35 (27.8)44 (27.7)40 (19.8)38 (18.0)36 (25.2)2 (7.7)0.039
CKD19 (15.0)21 (13.2)22 (10.9)26 (12.3)14 (9.8)4 (15.4)0.759
COPD24 (18.9)22 (13.8)18 (8.9)14 (6.6)6 (4.2)3 (11.3)<0.001
Rheumatoid disease5 (3.9)9 (5.7)17 (8.4)13 (6.2)14 (9.8)3 (11.5)0.302
Varicose Ulcer11 (8.7)14 (8.8)31 (15.3)26 (12.3)13 (9.1)2 (7.7)0.312
CV death39 (30.7)41 (25.8)31 (15.3)27 (12.8)19 (13.3)3 (11.5)<0.001
CAD = coronary artery disease, CHF = chronic heart failure, CKD = chronic kidney dysfunction, COPD = chronic obstructive pulmonary disease, CV = cardiovascular, CeVD = cerebrovascular disease, DM = diabetes mellitus, DM I = type I diabetes mellitus, DM II = type II diabetes mellitus, FA = atrial fibrillation, HT = hypertension, SE standard error, p value for age AVOVA test, for categorical variables Fisher´s exact test.
Table 3. Survival and ABI range categories. The estimated overall survival and cardiovascular-death-free survivals in months (SE) of the ABI range categories are presented in Table 3A. Table 3B shows 1-, 3-, and 5-year survival rates for each category.
AMean Survival Mean CVDFS
ABIMonths (SE)p Valuep ValueMonths (SE)p Valuep Value
0.80–0.8973.0 (3.47)reference0.39384.2 (3.25)reference0.264
0.90–0.9978.8 (2.76)0.393reference90.0 (2.49)0.264reference
1.00–1.0987.8 (2.36)<0.001<0.00196.2 (1.91)<0.0010.013
1.10–1.1985.1 (2.28)0.0030.03097.6 (1.77)<0.0010.003
1.20–1.2989.4 (2.65)<0.001<0.00198.0 (2.06)<0.0010.006
1.30–1.4080.9 (7.97)0.1560.28096.8 (5.57)0.0710.176
B Survival CVDFS
ABI1-year3-year5-year1-year3-year5-year
0.80–0.8981%70%41%88%80%57%
0.90–0.9989%80%44%92%88%62%
1.00–1.0990%84%65%95%91%79%
1.10–1.1992%80%60%96%92%82%
1.20–1.2993%85%67%96%93%80%
1.30–1.4085%73%69%96%87%87%
ABI = ankle brachial index, CVDFS = cardiovascular death-free survival, p value log rank test, SE = standard error.
Publisher’s Note: MDPI stays neutral with regard to jurisdictional claims in published maps and institutional affiliations.

