Article

An Inverse Correlation between the Atherogenic Index of Plasma and Heart Failure: An Analysis of the National Health and Nutrition Examination Survey 2017–March 2020 Pre-Pandemic Data

Department of Structural Heart Disease, The First Affiliated Hospital of Xi’an Jiaotong University, Xi’an 710061, China
*
Author to whom correspondence should be addressed.
J. Cardiovasc. Dev. Dis. 2022, 9(12), 412; https://doi.org/10.3390/jcdd9120412
Submission received: 5 October 2022 / Revised: 15 November 2022 / Accepted: 21 November 2022 / Published: 23 November 2022
(This article belongs to the Special Issue Heart Failure: Clinical Diagnostics and Treatment)

Abstract

:
Aims: The atherogenic index of plasma (AIP) is associated with cardiovascular diseases. Nevertheless, limited studies have investigated the association between AIP and the risk of heart failure (HF) in the general population. This study aimed to explore the association between AIP and HF risk using a large-scale population dataset from the National Health and Nutrition Examination Survey (NHANES) 2017–March 2020 Pre-pandemic data. Methods: A total of 5598 individuals were included in the analysis of the association between AIP and HF from the NHANES database. The relationship between AIP and HF was examined using multivariate logistic regression and smooth curve fitting. An association between the two was detected based on the odds ratios (ORs) and 95% confidence intervals (CIs). Results: The overall prevalence of HF among the 5598 participants analyzed was 3.21%. Compared with individuals in the lowest quartile of AIP, participants in the higher quartiles showed a significantly reduced probability of HF. Smooth curve fitting analysis revealed a linear association between AIP and HF. Compared with individuals in Q1 of the AIP, participants in Q2 (OR = 0.38, 95% CI = 0.2–0.72, p = 0.0033), Q3 (OR = 0.24, 95% CI = 0.12–0.48, p < 0.0001), and Q4 (OR = 0.32, 95% CI = 0.14–0.74, p = 0.0075) had a significantly decreased risk of HF after adjusting for other risk factors. Analysis of subgroup strata revealed that AIP may interact with age and statin use (p for interaction = 0.012 and 0.0022, respectively). Conclusion: Our results suggest that a high AIP value is negatively correlated with HF prevalence. The AIP may be an effective method for identifying individuals at a high risk of HF.

1. Introduction

Heart failure (HF) is clinically characterized by impaired cardiac structure and function, quality of life, and altered neurohormonal regulation [1]. HF is a manifestation of a late stage in various heart diseases. HF affects an estimated 64.3 million people globally [2]. In the United States, a study based on the National Inpatient Sample found an increase in the number of hospitalization cases from 1,060,540 in 2008 to 1,270,360 in 2018 [3]. According to the American Heart Association, the prevalence of HF continues to rise, resulting in increased economic and social costs [4]. As the population age and cardiovascular diseases increase, the prevalence of HF is expected to continuously rise in the future. Therefore, to combat this growing trend, novel preventive measures targeting key risk factors are required urgently.
There are several etiologies of HF, such as coronary artery disease, rheumatic heart disease, cardiomyopathy, congenital heart disease, high blood pressure, and hyperthyroidism [5]. Among these diseases, ischemic HF is common. In 2010, North America, Oceania, and Eastern Europe had the highest prevalence of ischemic heart failure (>5 per 1000) [6]. Clinical trials and epidemiological studies indicate that patients with ischemic HF have a worse prognosis than those with non-ischemic HF [7]. A growing body of evidence suggests that unfavorable blood glucose and cholesterol levels are major risk factors for HF. There is a close relationship between blood lipid levels and HF syndrome [8]. Recently, the plasma lipid profile has been identified as an important risk factor and predictor of cardiovascular disease [9]. The atherogenic index of plasma (AIP), calculated using the formula of log (triglyceride/high-density lipoprotein cholesterol) [9], is a new index composed of triglycerides (TG) and high-density lipoprotein cholesterol (HDL-C) levels. AIP might have the potential of becoming HF biomarker. AIP not only accurately represents the true relationship between protective and atherogenic lipoproteins but also serves as a strong predictor of atherosclerosis and coronary heart disease [10]. However, to date, no study has investigated the association between AIP and HF. Therefore, we aimed to investigate the association between AIP and HF incidence in a large nationally representative sample of the U.S. population. We further explored the interactions and stratified confounders in the association of AIP and HF in different subgroups.

2. Materials and Methods

2.1. Study Population

The NHANES database is an ongoing cross-sectional nationally representative survey conducted by the National Center for Health Statistics (NCHS) to assess the health status of US residents. It is designed to supervise the health and nutritional status of civilian, non-institutionalized US inhabitants using a complex, multistage design with data released in two-year cycles. Details of the NHANES study design and data can be accessed at http://www.cdc.gov/nchs/nhanes.htm (accessed on 4 September 2022). The baseline demographic and health-related questions were collected through in-person interviews. In addition to home interviews, NHANES participants underwent health assessments at a mobile examination center (MEC), clinical examinations, and laboratory investigations. NHANES field operations were suspended in March 2020 due to the coronavirus disease 2019 (COVID-19) pandemic. For this reason, NHANES 2019–March 2020 cycle data were combined with the data collected from the NHANES 2017–2018 cycle and a national representative sample was created from NHANES 2017–March 2020 pre-pandemic data.
The present study analyzed the data of 7484 participants with AIP available from the NHANES 2017–March 2020 pre-pandemic. Figure 1 shows a flowchart of the study subject selection from the NHANES database. Subjects were excluded if they were younger than 18 years (n = 891), had a diagnostic history of cancer (n = 656), or were pregnant at the time of examination (n = 56). Participants with no information on their HF status were also excluded (n = 283). Finally, 5,598 eligible participants were included in the analysis. This study conforms to the ethical guidelines of the 1975 Declaration of Helsinki. This study used public data from the NHANES, which was approved by the Institutional Review Board (IRB).

2.2. Definitions of HF and AIP

Similar to previous studies, the incident of HF was based on self-reported “Yes” to the MCQ questionnaire by asking the question, “Has a doctor or other health professional ever told you that you had congestive heart failure?” [11]. AIP is mathematically derived from log10 (TG/HDL-C), which is a logarithmic relationship between TG and HDL-C [9]. Subsequently, all participants were classified into four groups according to their AIP quartiles.

2.3. Covariates

Demographic information and characteristics such as gender, age, race, waist circumference, education level, marital status, smoking history, stroke, coronary heart disease, heart attack (also called as myocardial infarction), angina, statin use, diabetes medication, and antihypertensive medication were obtained using standardized household questionnaires. Races were categorized as Mexican American, non-Hispanic white, non-Hispanic black, or others. Education levels were grouped into pre-high school, high school, and above high school. Marital status was divided into two categories, i.e., unmarried (never married/divorced/separated/widowed) and married (married/living with a partner). Smokers were classified into three categories: never, former, and current smokers. The participants measured their height and weight while wearing light clothing and no shoes. Body mass index (BMI) was calculated as weight (kg) divided by height squared (m). Based on the BMI, participants were divided into three groups: normal (18.5 < BMI < 25 kg/m2), overweight (25 ≤ BMI ≤ 30 kg/m2), and obese (BMI > 30 kg/m2)
The estimated glomerular filtration rate (eGFR) was calculated using the Chronic Kidney Disease Epidemiology Collaboration (CKD-EPI) equation [12] and was grouped into three categories <60 mL/min/1.73 m2, 60–90 mL/min/1.73 m2, and ≥90 mL/min/1.73 m2. Diabetes was defined as self-reported physician-diagnosed diabetes, medication to lower blood glucose or HbA1c level of less than 6.5%. A history of hypertension was defined as a self-reported hypertension diagnosis, diastolic blood pressure ≥90 mmHg, systolic blood pressure ≥140 mmHg or use of anti-hypertensive medication. MetS was defined according to the 2009 joint statement of the International Diabetes Federation (IDF) [13]. The selection of other laboratory test indicators was based on the previous literature, which included glucose (mg/dL), HbA1c (%), aspartate aminotransferase (AST), alanine aminotransferase (ALT), total protein (g/L), albumin (g/L), globulin (g/L), creatinine (mg/dL), uric acid (mg/dL), blood urea nitrogen (mg/dL), triglyceride (mg/dL), total cholesterol (mg/dL), HDL cholesterol (mg/dL), LDL cholesterol (mg/dL), and high-sensitivity C-reactive protein (hs-CRP). A detailed description of testing procedures and quality control strategies can be found on the NHANES webpage (https://www.cdc.gov/nchs/nhanes/ (accessed on 4 September 2022)).

2.4. Statistical Analysis

Data analysis was performed using EmpowerStats version 4.1 and R version 4.0.3 software. Since the NHANES used a complex multistage sample design, statistical analysis was performed using appropriate NHANES sampling weights. Continuous variables were expressed as a survey-weighted mean (95% CI) and categorical variables were presented as a survey-weighted percentage (95% CI). All individuals were divided into four groups according to the quartiles of the AIP level: Q1 (<−0.34), Q2 (−0.34 to −0.12), Q3 (−0.12 to 0.1), and Q4 (≥0.1). The first quintile was used as a reference group. Analysis of the trend between the quartiles was performed using a general linear model. The association between AIP and HF was examined using logistic regression analysis. Variables with more than 10% missing values were excluded from the model. The variance inflation factor (VIF) was used to check for multicollinearity, and variables with a VIF greater than 5 were excluded. Covariates were selected as potential confounders in the final models if they changed the AIP estimates on HF risk by more than 10% or were notably associated with the HF [14]. The multivariate logistic regression models included the unadjusted model, minimally adjusted model 1 (adjusted for gender, age, BMI, education level, and smoking), and a fully adjusted model 2 (adjusted for gender, age, BMI, education level, smoking, coronary heart disease, heart attack, angina, stroke, MetS, diabetes, eGFR, hypertension, glucose, HbA1c, ALT, albumin, globulin, creatinine, blood urea nitrogen, HDL cholesterol, hs-CRP, statin use, diabetes medication, and antihypertensive medication). We also performed additional analyses using AIP as a continuous variable. The association between the two was assessed by logistic regression using the same models. We also investigated the nonlinear dose–response relationship between the AIP and incident HF using smooth curve fitting. To test for interactions, we performed the stratified analyses using the Wald test. A significant interaction p-value indicates a population with special characteristics. A non-significant interaction p-value implies that the different levels of analysis are consistent and reliable. Stratified analyses according to gender (female and male), age (<60 years and ≥60 years), coronary heart disease (yes and no), myocardial infarction (yes and no), MetS (yes and no), smoking (never, former, now), eGFR (<60 mL/min/1.73 m2, 60–90 mL/min/1.73 m2, and ≥90 mL/min/1.73 m2), BMI (<25 kg/m2, 25–30 kg/m2, and ≥30 kg/m2), and statin use (yes and no) were performed to explore potential modifying effects.
Sensitivity analyses were performed to test the robustness of the results. First, multiple imputations of missing values were analyzed ten times. The estimates from each model were combined by the Rubin rule using the pool() function of the mice package. Secondly, as the presence of unmeasured confounding factors in observational epidemiology is inevitable, a sensitivity analysis using the E-value algorithm was employed to address the possible effect of unmeasured confounding on the primary results. The E-value represents the minimum strength at which a confounder needs to be associated with both HF and AIP to fully explain their observed association [15].

3. Results

3.1. Baseline Characteristics of Included Individuals

A total of 5598 participants were enrolled in the study. Of these, 180 (3.21%) were diagnosed with HF. The weight demographics of the participants as per their AIP quartile are shown in Table 1. AIP was associated with age, gender, BMI, waist circumference, race/ethnicity, education level, smoking, fasting blood glucose, HbA1c, ALT, albumin, globulin, uric acid, triglyceride, total cholesterol, HDL cholesterol, LDL cholesterol, hs-CRP, coronary heart disease, heart attack, angina, MetS, diabetes, hypertension, statin use, and diabetes medication (all p < 0.05).

3.2. AIP and the Risk of HF

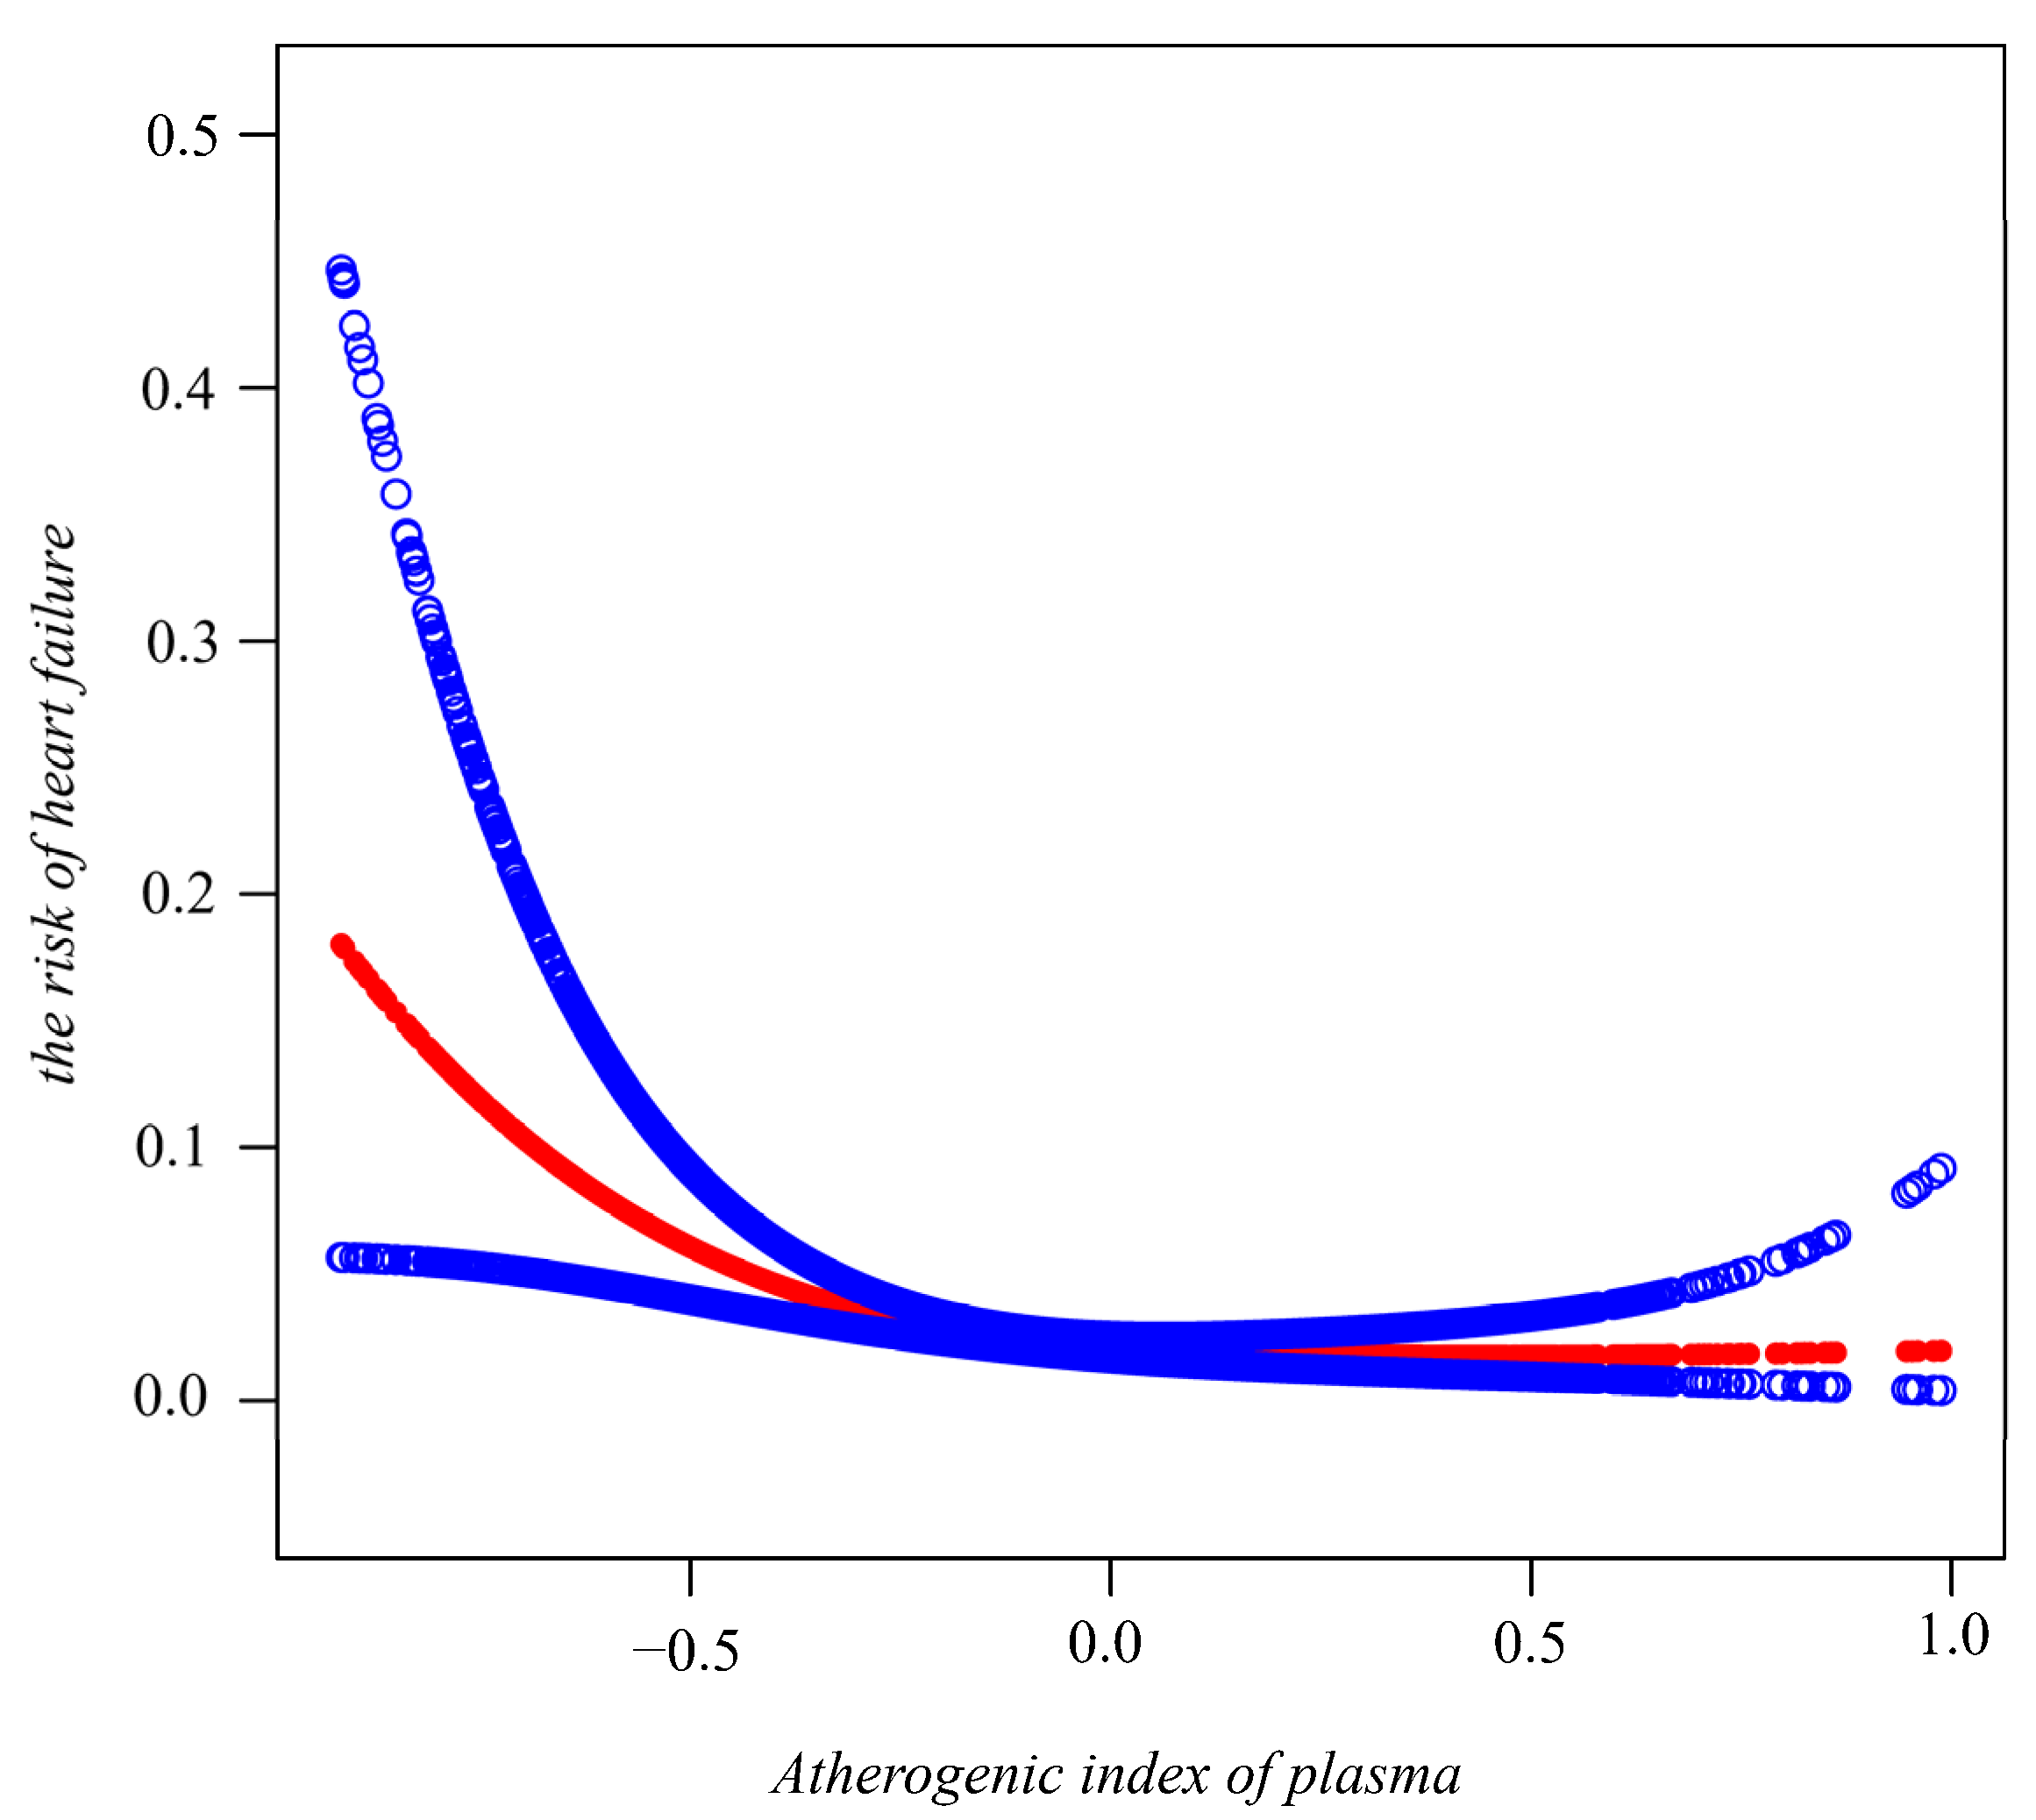
On the whole, a smooth curve fitting demonstrated a downward trend between AIP and HF prevalence. From the diagram, it can be seen that the slope in the first quarter is steep, while in the remaining quarters it continues to descend, i.e., the incident HF decreased relatively rapidly and subsequently became steady, gradually (Figure 2). Table 2 shows the crude and fully adjusted associations between AIP and incident HF. In the fully adjusted model, individuals in Q1 were used as references and participants in the highest quartile (Q4) showed a reduced risk of HF (OR = 0.32, 95% CI = 0.14–0.74; p = 0.0075). Further, individuals in Q2 (OR = 0.38, 95% CI = 0.20–0.72; p = 0.0033) and Q3 (OR = 0.24, 95% CI = 0.12–0.48; p < 0.0001) displayed an inverse relationship between AIP and HF. When using AIP as a continuous variable, the results were unchanged. In the fully adjusted model, after controlling for confounders, each unit of increased AIP was associated with a 72% decreased risk of HF (aHR = 0.28; 95% CI: 0.10–0.78; p = 0.0154).

3.3. Stratified Analysis and Sensitivity Analyses

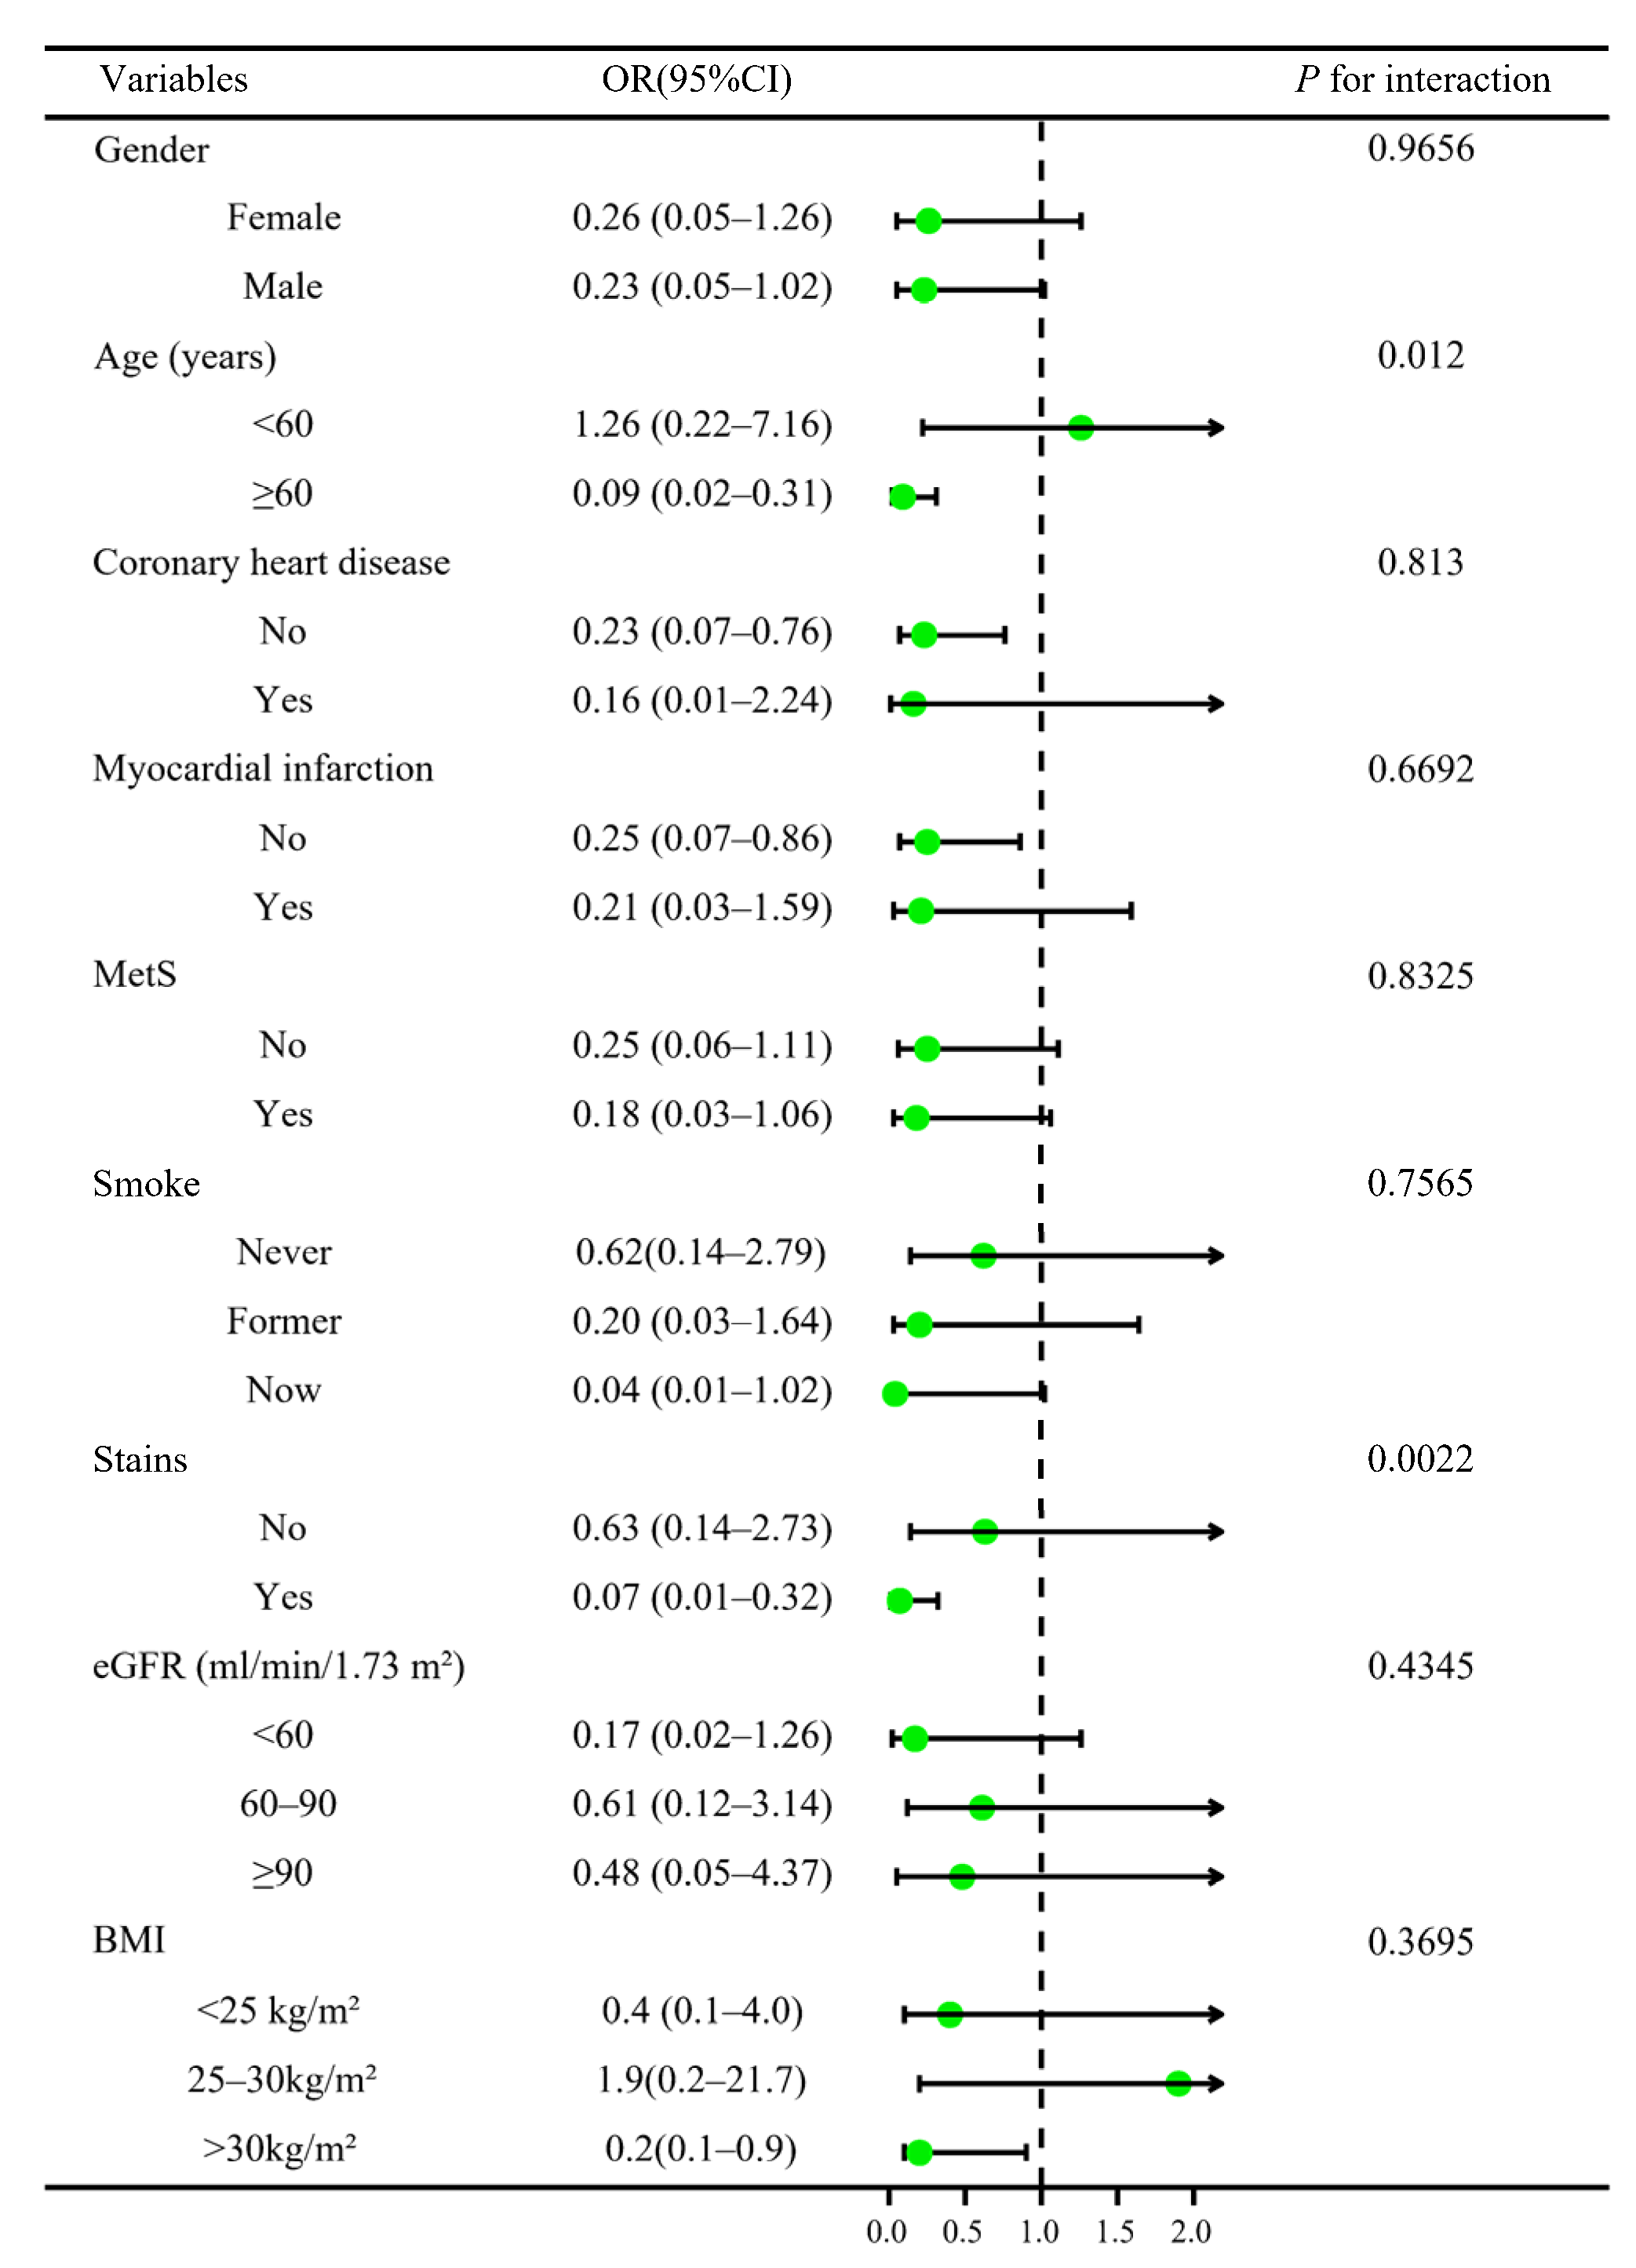
For a more detailed analysis of the association between AIP and HF, we divided patients based on their demographic characteristics. Stratified analyses were conducted in different subgroups to identify interactions and confounders that may affect the association between AIP and HF (Figure 3). Results indicated that age (<60 and ≥60 years) had different effects on the association between AIP and HF (p for interaction = 0.012). The inverse association between AIP and incident HF was more pronounced in individuals over 60 years of age. At the same time, statin use also appeared to interact with the association between AIP and HF (p for interaction = 0.0022).
Sensitivity analyses using 10 rounds of multiple imputation data did not significantly alter the main findings (Figure S1). Using AIP as a continuous variable, the association between AIP and incident HF remained significant when combined with 10 rounds of multiple imputations into the final estimates (OR = 0.37, 95% CI = 0.14–0.98, p = 0.0485). After full adjustment, compared with individuals in Q1, AIP was still inversely associated with HF in Q2 (OR = 0.44, 95% CI = 0.24–0.82, p = 0.0099), Q3 (OR = 0.27, 95% CI = 0.13–0.54, p < 0.001), and Q4 (OR = 0.44, 95% CI = 0.19–0.99, p = 0.032). Furthermore, the E-value (and its lower limit of 95% CI) for the relationship between AIP and the prevalence of HF was 3.19 (1.52) (Figure S2). The result can be interpreted as unmeasured confounders with 1.52-fold risk ratios associated with both AIP and HF, respectively, outweighed measured confounders, but weaker confounders did not. Therefore, the E-value provided evidence that the study was robust.

4. Discussion

In this large-sample cross-sectional study, the results indicate that after adjusting for multiple relevant confounders, individuals with high AIP levels had an adverse association with HF. Therefore, maintaining a high AIP may help in reducing the risk of HF. To the best of our knowledge, this is the first study to demonstrate a relationship between AIP and incident HF in a large representative sample of US adults. Our results fill an information gap on the association of AIP and incident HF by demonstrating an inverse relationship.
AIP, calculated as log10 (TG/HDL-C), was originally developed as a biomarker of plasma atherosclerosis and is now being used as a predictive index for coronary artery disease [16,17]. AIP has also been proposed as a clinical indicator of cardiovascular and metabolic disorders [18]. There is evidence that dyslipidemia is a major risk factor for coronary artery disease [19]. After adjusting for multiple traditional cardiovascular risk factors, AIP was found to be significantly associated with cardiovascular risk. This could be an effective method for selecting individuals at high cardiovascular risk [20]. Multiple causes contribute to HF, leading to high all-cause mortality in hospitals. Therefore, it is important to identify modifiable risk factors from a public health perspective to prevent HF. As an important risk factor for HF, modifying lipids can reduce the risk of HF [21].
AIP can be used as a marker for the presence of small dense LDL (sd-LDL) [16]. An increase in AIP is correlated with larger LDL particles, making it an ideal indicator of atherogenic lipoproteins. Dobiosova first defined the AIP in 2001 and suggested that it could be used as a biomarker for plasma atherogenicity due to its relationship with LDL-C particle size [16]. The sd-LDL invades the arterial wall and forms deposits more readily, it is more sensitive to oxidative stress and is readily oxidized to LDL. Upon phagocytosis by macrophages, oxidized LDL becomes foam cells thereby worsening atherosclerosis [22]. Atherogenic lipoproteins, with smaller particle sizes, migrate more easily and are oxidized, thereby accelerating atherosclerosis that exacerbates coronary artery disease [23]. Previous studies have found an association between AIP and small, dense lipoprotein particles, which can be used as a marker of atherogenicity [24]. In HF patients, HDL-C was significantly lower and TG levels were significantly higher than in controls [22]. Increased inflammatory conditions and decreased HDL-C levels in HF suggest that dyslipidemia has an atherosclerotic effect [25]. HDL-C has antithrombotic, anti-inflammatory, antioxidant, and antiatherogenic effects. HDL may reduce thrombus formation by reducing platelet reactivity and aggregability. Furthermore, previous studies have demonstrated that AIP is positively associated with TG, TC, and LDL-C, and negatively with HDL-C [26,27,28]. Furthermore, our stratified analyses identified a specific population where individuals in different age groups (<60 and ≥60 years) and with statin use contribute differently to the association between AIP and HF. AIP not only accurately represents the link between protective and atherogenic lipoproteins but also acts as a powerful predictor of atherosclerosis and CAD [10]. AIP values below 0.11 are associated with low CVD risk, while those between 0.11 and 0.21 and above 0.21 are associated with intermediate and increased CVD risk [29]. In most previous studies, the AIP was compared between patients with overt CAD and controls. However, the results were inconsistent [30,31]. Thus, further studies with a larger number of participants are warranted to explore the detailed mechanisms that a high AIP value is negatively correlated with HF prevalence.
This study had some limitations. First, the findings of this study may not be applicable to the other ethnic groups because we included individuals from the US only. Thus, the findings of this study need to be validated in other populations. Second, we were unable to compare the association between the AIP and the incidence of HF in different heart failure subgroups since the ejection fraction was unavailable in NHANES. Third, despite adjusting for most demographic and clinical variables, the possibility of unmeasured confounding remains. However, we obtained robust results via multiple sensitivity analyses and the evaluation of E-values. These results support the robustness of our conclusions. Besides, the inclusion of variables is based on the standard that introducing covariates in the basic model or eliminating covariates in the final model has a more than 10% influence on the regression coefficient of AIP, not the “10 Events Per Variable (EPV)” criterion. This may also have some influence on the results.

5. Conclusions

The current investigation showed that a high AIP value is negatively correlated with the prevalence of HF. The AIP can be an effective method for identifying individuals at high risk of HF. Further studies are required to determine whether interfering with AIP will reduce incident HF in clinical practice.

Supplementary Materials

The following supporting information can be downloaded at: https://www.mdpi.com/article/10.3390/jcdd9120412/s1, Figure S1: Pooled ORs for the atherogenic index of plasma and incident heart failure for multiple imputations (10 rounds) of missing data; Figure S2: E-value for the lower 95% CI, point estimate of the atherogenic index of plasma, and incident heart failure. The value of the joint minimum strength of association on the risk ratio scale that an unmeasured confounder must have with the exposure and outcome to fully describe the AIP and HF hazard ratios.

Author Contributions

J.X. and H.W. were responsible for the study concept. J.X., L.H., H.X. and X.X. were responsible for the acquisition, analysis or interpretation of data. J.X., L.H., H.X. and X.X. were responsible for the drafting of the manuscript. All authors have read and agreed to the published version of the manuscript.

Funding

This research received no external funding.

Institutional Review Board Statement

The study was conducted in accordance with the Declaration of Helsinki. Because the NHANES database was de-identified and publicly available, this study was not requiring institutional review board approval.

Informed Consent Statement

Patient consent was waived due to that the NHANES database was de-identified and publicly available.

Data Availability Statement

Publicly available dataset was analyzed in this study. The National Health and Nutrition Examination Survey dataset are publicly available at https://www.cdc.gov/nchs/nhanes/index.htm (accessed on 4 September 2022).

Acknowledgments

The authors thank the National Center for Health Statistics of the Centers for Disease Control and Prevention for sharing the National Health and Nutrition Examination Survey (NHANES) data.

Conflicts of Interest

The authors declare no conflict of interest.

References

  1. Davison, B.; Cotter, G. Why is heart failure so important in the 21st century? Eur. J. Heart Fail. 2015, 17, 122–124. [Google Scholar] [CrossRef]
  2. Global, regional, and national incidence, prevalence, and years lived with disability for 354 diseases and injuries for 195 countries and territories, 1990-2017: A systematic analysis for the Global Burden of Disease Study 2017. Lancet 2018, 392, 1789–1858. [CrossRef] [PubMed] [Green Version]
  3. Clark, K.A.A.; Reinhardt, S.W.; Chouairi, F.; Miller, P.E.; Kay, B.; Fuery, M.; Guha, A.; Ahmad, T.; Desai, N.R. Trends in Heart Failure Hospitalizations in the US from 2008 to 2018. J. Card. Fail. 2022, 28, 171–180. [Google Scholar] [CrossRef] [PubMed]
  4. Heidenreich, P.A.; Trogdon, J.G.; Khavjou, O.A.; Butler, J.; Dracup, K.; Ezekowitz, M.D.; Finkelstein, E.A.; Hong, Y.; Johnston, S.C.; Khera, A.; et al. Forecasting the future of cardiovascular disease in the United States: A policy statement from the American Heart Association. Circulation 2011, 123, 933–944. [Google Scholar] [CrossRef] [PubMed] [Green Version]
  5. Ziaeian, B.; Fonarow, G.C. Epidemiology and aetiology of heart failure. Nat. Rev. Cardiol. 2016, 13, 368–378. [Google Scholar] [CrossRef] [Green Version]
  6. Moran, A.E.; Forouzanfar, M.H.; Roth, G.A.; Mensah, G.A.; Ezzati, M.; Flaxman, A.; Murray, C.J.; Naghavi, M. The global burden of ischemic heart disease in 1990 and 2010: The Global Burden of Disease 2010 study. Circulation 2014, 129, 1493–1501. [Google Scholar] [CrossRef]
  7. Follath, F. Ischemic versus non-ischemic heart failure: Should the etiology be determined? Heart Fail Monit. 2001, 1, 122–125. [Google Scholar]
  8. Kalantar-Zadeh, K.; Block, G.; Horwich, T.; Fonarow, G.C. Reverse epidemiology of conventional cardiovascular risk factors in patients with chronic heart failure. J. Am. Coll. Cardiol. 2004, 43, 1439–1444. [Google Scholar] [CrossRef] [Green Version]
  9. Niroumand, S.; Khajedaluee, M.; Khadem-Rezaiyan, M.; Abrishami, M.; Juya, M.; Khodaee, G.; Dadgarmoghaddam, M. Atherogenic Index of Plasma (AIP): A marker of cardiovascular disease. Med. J. Islamic Repub. Iran 2015, 29, 240. [Google Scholar]
  10. Nwagha, U.I.; Ikekpeazu, E.J.; Ejezie, F.E.; Neboh, E.E.; Maduka, I.C. Atherogenic index of plasma as useful predictor of cardiovascular risk among postmenopausal women in Enugu, Nigeria. Afr. Health Sci. 2010, 10, 248–252. [Google Scholar]
  11. Sattler, E.L.P.; Ishikawa, Y.; Trivedi-Kapoor, R.; Zhang, D.; Quyyumi, A.A.; Dunbar, S.B. Association between the Prognostic Nutritional Index and Dietary Intake in Community-Dwelling Older Adults with Heart Failure: Findings from NHANES III. Nutrients 2019, 11, 2608. [Google Scholar] [CrossRef] [Green Version]
  12. Levey, A.S.; Stevens, L.A.; Schmid, C.H.; Zhang, Y.L.; Castro, A.F., 3rd; Feldman, H.I.; Kusek, J.W.; Eggers, P.; Van Lente, F.; Greene, T.; et al. A new equation to estimate glomerular filtration rate. Ann. Intern. Med. 2009, 150, 604–612. [Google Scholar] [CrossRef]
  13. Alberti, K.G.; Eckel, R.H.; Grundy, S.M.; Zimmet, P.Z.; Cleeman, J.I.; Donato, K.A.; Fruchart, J.C.; James, W.P.; Loria, C.M.; Smith, S.C., Jr. Harmonizing the metabolic syndrome: A joint interim statement of the International Diabetes Federation Task Force on Epidemiology and Prevention; National Heart, Lung, and Blood Institute; American Heart Association; World Heart Federation; International Atherosclerosis Society; and International Association for the Study of Obesity. Circulation 2009, 120, 1640–1645. [Google Scholar] [CrossRef]
  14. Jaddoe, V.W.; de Jonge, L.L.; Hofman, A.; Franco, O.H.; Steegers, E.A.; Gaillard, R. First trimester fetal growth restriction and cardiovascular risk factors in school age children: Population based cohort study. BMJ 2014, 348, g14. [Google Scholar] [CrossRef] [Green Version]
  15. VanderWeele, T.J.; Ding, P. Sensitivity Analysis in Observational Research: Introducing the E-Value. Ann. Intern. Med. 2017, 167, 268–274. [Google Scholar] [CrossRef] [Green Version]
  16. Dobiásová, M.; Frohlich, J. The plasma parameter log (TG/HDL-C) as an atherogenic index: Correlation with lipoprotein particle size and esterification rate in apoB-lipoprotein-depleted plasma (FER(HDL)). Clin. Biochem. 2001, 34, 583–588. [Google Scholar] [CrossRef]
  17. Guo, Q.; Zhou, S.; Feng, X.; Yang, J.; Qiao, J.; Zhao, Y.; Shi, D.; Zhou, Y. The sensibility of the new blood lipid indicator--atherogenic index of plasma (AIP) in menopausal women with coronary artery disease. Lipids Health Dis. 2020, 19, 27. [Google Scholar] [CrossRef] [Green Version]
  18. Shin, H.R.; Song, S.; Cho, J.A.; Ly, S.Y. Atherogenic Index of Plasma and Its Association with Risk Factors of Coronary Artery Disease and Nutrient Intake in Korean Adult Men: The 2013-2014 KNHANES. Nutrients 2022, 14, 1071. [Google Scholar] [CrossRef]
  19. Goliasch, G.; Wiesbauer, F.; Blessberger, H.; Demyanets, S.; Wojta, J.; Huber, K.; Maurer, G.; Schillinger, M.; Speidl, W.S. Premature myocardial infarction is strongly associated with increased levels of remnant cholesterol. J. Clin. Lipidol. 2015, 9, 801–806.e801. [Google Scholar] [CrossRef]
  20. Kim, S.H.; Cho, Y.K.; Kim, Y.J.; Jung, C.H.; Lee, W.J.; Park, J.Y.; Huh, J.H.; Kang, J.G.; Lee, S.J.; Ihm, S.H. Association of the atherogenic index of plasma with cardiovascular risk beyond the traditional risk factors: A nationwide population-based cohort study. Cardiovasc. Diabetol. 2022, 21, 81. [Google Scholar] [CrossRef]
  21. Velagaleti, R.S.; Massaro, J.; Vasan, R.S.; Robins, S.J.; Kannel, W.B.; Levy, D. Relations of lipid concentrations to heart failure incidence: The Framingham Heart Study. Circulation 2009, 120, 2345–2351. [Google Scholar] [CrossRef] [PubMed] [Green Version]
  22. Anber, V.; Griffin, B.A.; McConnell, M.; Packard, C.J.; Shepherd, J. Influence of plasma lipid and LDL-subfraction profile on the interaction between low density lipoprotein with human arterial wall proteoglycans. Atherosclerosis 1996, 124, 261–271. [Google Scholar] [CrossRef] [PubMed]
  23. Frohlich, J.; Dobiásová, M. Fractional esterification rate of cholesterol and ratio of triglycerides to HDL-cholesterol are powerful predictors of positive findings on coronary angiography. Clin. Chem. 2003, 49, 1873–1880. [Google Scholar] [CrossRef] [PubMed]
  24. Younis, N.N.; Soran, H.; Pemberton, P.; Charlton-Menys, V.; Elseweidy, M.M.; Durrington, P.N. Small dense LDL is more susceptible to glycation than more buoyant LDL in Type 2 diabetes. Clin. Sci. 2013, 124, 343–349. [Google Scholar] [CrossRef] [PubMed] [Green Version]
  25. Karadağ, M.K.; Yıldırım, E. Relationship of atherogenic index of plasma and mean platelet volume with ejection fraction in ischemic and nonischemic heart failure. Biomark. Med. 2019, 13, 175–183. [Google Scholar] [CrossRef]
  26. Bo, M.S.; Cheah, W.L.; Lwin, S.; Moe Nwe, T.; Win, T.T.; Aung, M. Understanding the Relationship between Atherogenic Index of Plasma and Cardiovascular Disease Risk Factors among Staff of an University in Malaysia. J. Nutr. Metab. 2018, 2018, 7027624. [Google Scholar] [CrossRef]
  27. Zhu, X.; Yu, L.; Zhou, H.; Ma, Q.; Zhou, X.; Lei, T.; Hu, J.; Xu, W.; Yi, N.; Lei, S. Atherogenic index of plasma is a novel and better biomarker associated with obesity: A population-based cross-sectional study in China. Lipids Health Dis. 2018, 17, 37. [Google Scholar] [CrossRef] [Green Version]
  28. Huang, F.; Liu, Q.; Zhang, Q.; Wan, Z.; Hu, L.; Xu, R.; Cheng, A.; Lv, Y.; Wang, L. Sex-Specific Association between Serum Vitamin D Status and Lipid Profiles: A Cross-Sectional Study of a Middle-Aged and Elderly Chinese Population. J. Nutr. Sci. Vitaminol. 2020, 66, 105–113. [Google Scholar] [CrossRef]
  29. Dobiásová, M.; Frohlich, J.; Sedová, M.; Cheung, M.C.; Brown, B.G. Cholesterol esterification and atherogenic index of plasma correlate with lipoprotein size and findings on coronary angiography. J. Lipid Res. 2011, 52, 566–571. [Google Scholar] [CrossRef] [Green Version]
  30. Wu, T.T.; Gao, Y.; Zheng, Y.Y.; Ma, Y.T.; Xie, X. Atherogenic index of plasma (AIP): A novel predictive indicator for the coronary artery disease in postmenopausal women. Lipids Health Dis. 2018, 17, 197. [Google Scholar] [CrossRef]
  31. Nansseu, J.R.; Moor, V.J.; Nouaga, M.E.; Zing-Awona, B.; Tchanana, G.; Ketcha, A. Atherogenic index of plasma and risk of cardiovascular disease among Cameroonian postmenopausal women. Lipids Health Dis. 2016, 15, 49. [Google Scholar] [CrossRef]
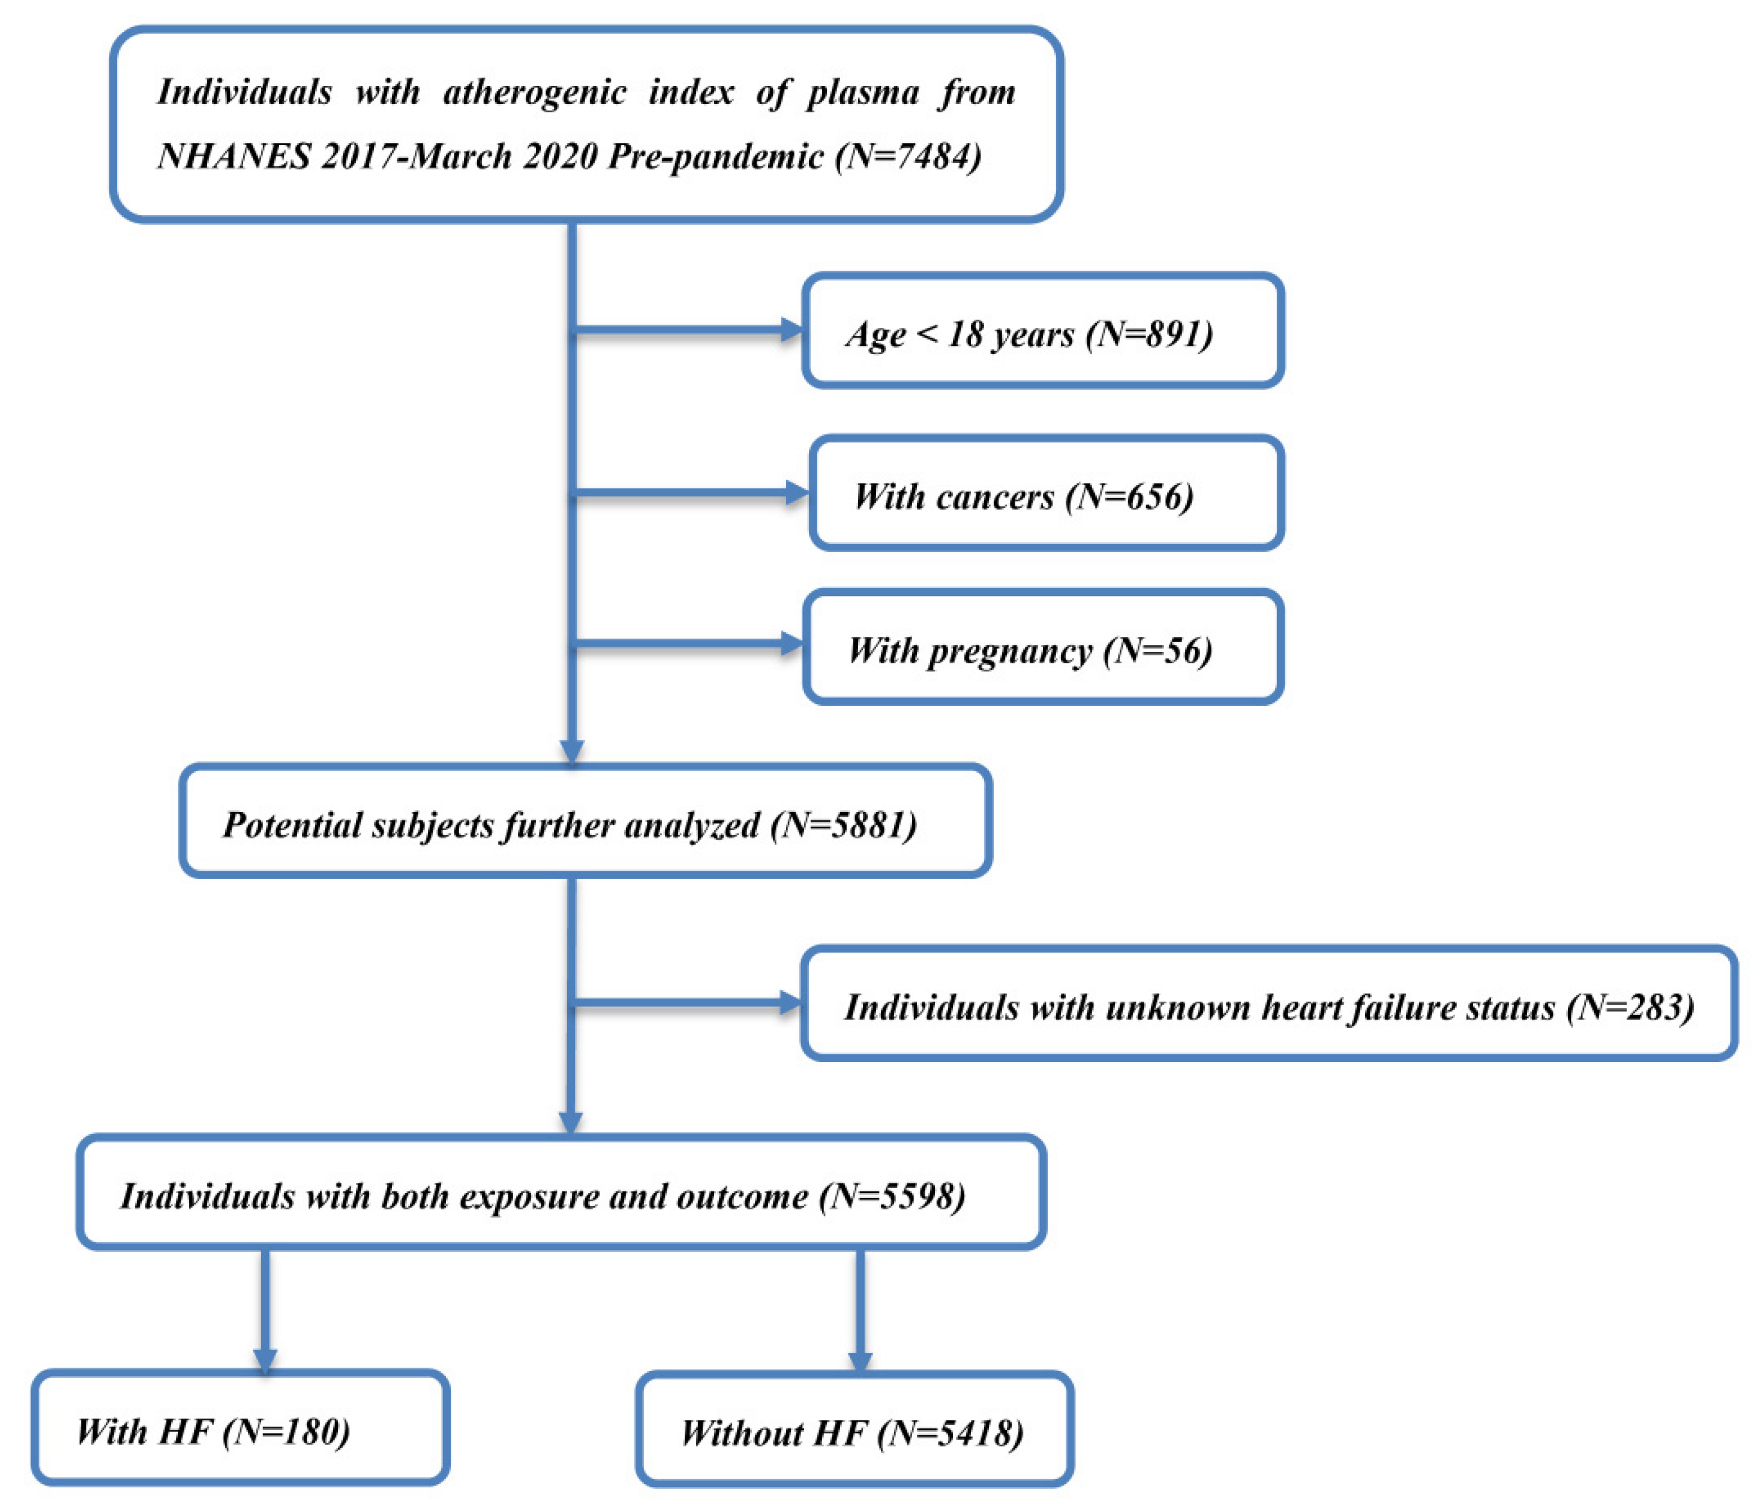
Figure 1. A detailed flowchart of study population selection.
Jcdd 09 00412 g001
Figure 2. Association between the atherogenic index of plasma and incident heart failure using smooth curve fitting analysis. Adjusted for gender, age, BMI, education level, smoke, coronary heart disease, heart attack, angina, stroke, MetS, diabetes, eGFR, hypertension, glucose, HbA1c, ALT, albumin, globulin, creatinine, blood urea nitrogen, HDL cholesterol, hs-CRP, statins use, diabetes medication, and antihypertensive medication. The red and blue lines demonstrate the estimated values and their corresponding 95% CIs, respectively.
Jcdd 09 00412 g002
Figure 3. Forest plots of stratified analyses of atherogenic index of plasma and incident heart failure. Age, gender, BMI, education level, smoke, coronary heart disease, heart attack, angina, stroke, MetS, diabetes, eGFR, hypertension, glucose, HbA1c, ALT, albumin, globulin, creatinine, blood urea nitrogen, HDL cholesterol, hs-CRP, statins use, diabetes medication, and antihypertensive medication were all adjusted except the stratification variable itself.
Jcdd 09 00412 g003
Table 1. Baseline characteristics of included individuals according to atherogenic index of plasma quartiles, weighted.
Q1Q2Q3Q4p-Value
Age (years)43.07 (41.14, 44.99)45.93 (44.20, 47.65)47.51 (45.49, 49.53)48.05 (46.06, 50.04)0.0202
BMI (kg/m2)25.98 (25.32, 26.65)28.70 (27.48, 29.93)31.20 (30.58, 31.81)32.29 (31.20, 33.38)<0.0001
Waist circumference (cm)90.09 (88.37, 91.81)97.92 (95.22, 100.62)104.21 (102.48, 105.94)107.66 (105.18, 110.14)<0.0001
eGFR (ml/min/1.73 m2)99.51 (95.99, 103.04)97.19 (94.74, 99.63)95.55 (93.19, 97.92)94.80 (92.21, 97.40)0.2329
Glucose (mg/dl)100.20 (99.33, 101.08)104.51 (102.91, 106.10)109.69 (106.68, 112.71)123.53 (117.08, 129.98)<0.0001
HbA1c (%)5.35 (5.31, 5.39)5.50 (5.44, 5.57)5.72 (5.64, 5.80)6.03 (5.87, 6.19)<0.0001
ALT (IU/L)20.17 (17.21, 23.12)21.97 (19.88, 24.06)23.72 (21.67, 25.77)27.52 (26.14, 28.89)0.0022
AST (IU/L)23.29 (20.99, 25.59)22.22 (20.53, 23.92)21.78 (20.17, 23.40)22.26 (21.59, 22.94)0.7912
Total protein (g/L)71.09 (70.23, 71.94)70.72 (70.26, 71.19)71.08 (70.69, 71.48)70.80 (70.10, 71.50)0.4635
Albumin (g/L)41.27 (40.69, 41.85)40.49 (40.06, 40.92)39.98 (39.55, 40.41)40.38 (39.82, 40.93)0.0054
Globulin (g/L)29.81 (29.10, 30.52)30.23 (29.86, 30.61)31.10 (30.75, 31.45)30.42 (29.90, 30.95)0.0033
Creatinine (mg/dl)0.84 (0.82, 0.87)0.86 (0.83, 0.89)0.87 (0.85, 0.90)0.90 (0.86, 0.95)0.0952
Uric acid (mg/dl)4.83 (4.69, 4.97)5.32 (5.18, 5.47)5.70 (5.54, 5.86)5.96 (5.78, 6.14)<0.0001
Blood urea nitrogen (mg/dl)14.32 (13.70, 14.94)13.82 (13.33, 14.32)14.24 (13.76, 14.72)15.22 (14.32, 16.11)0.0778
Triglyceride (mg/dl)49.28 (47.76, 50.79)75.86 (72.84, 78.88)109.00 (106.89, 111.10)207.61 (191.35, 223.86)<0.0001
Total cholesterol (mg/dl)176.11 (171.32, 180.90)182.52 (176.68, 188.35)186.87 (181.56, 192.19)199.78 (195.03, 204.54)<0.0001
HDL cholesterol (mg/dl)69.71 (67.70, 71.71)55.98 (54.23, 57.74)48.84 (47.75, 49.93)41.09 (40.11, 42.07)<0.0001
LDL cholesterol (mg/dl)96.58 (92.56, 100.61)111.39 (106.98, 115.80)116.24 (111.91, 120.56)119.13 (115.17, 123.09)<0.0001
hs-CRP (mg/L)2.31 (1.72, 2.90)4.26 (3.04, 5.48)4.26 (3.70, 4.81)4.51 (3.57, 5.45)0.0001
Sex <0.0001
Female60.76 (53.83, 67.29)52.89 (45.27, 60.37)47.27 (42.08, 52.51)34.72 (26.26, 44.27)
Male39.24 (32.71, 46.17)47.11 (39.63, 54.73)52.73 (47.49, 57.92)65.28 (55.73, 73.74)
Race/ethnicity <0.0001
Mexican American6.84 (3.77, 12.10)8.79 (4.69, 15.89)11.53 (7.82, 16.68)13.25 (9.09, 18.92)
Non-Hispanic Black17.37 (12.21, 24.11)14.70 (11.47, 18.63)9.71 (6.26, 14.76)5.39 (3.17, 9.02)
Non-Hispanic White59.84 (52.59, 66.68)59.81 (52.22, 66.95)57.27 (52.48, 61.93)61.76 (56.49, 66.78)
Others15.95 (11.85, 21.12)16.70 (11.24, 24.11)21.49 (16.81, 27.05)19.60 (15.75, 24.11)
Education level <0.0001
Less Than High School7.73 (5.14, 11.48)9.52 (7.11, 12.63)14.07 (11.02, 17.80)17.26 (13.33, 22.06)
High school or GED25.05 (20.16, 30.67)25.37 (19.67, 32.07)32.66 (27.11, 38.75)28.94 (24.26, 34.11)
Above high school67.22 (60.87, 72.99)65.11 (57.20, 72.27)53.26 (46.93, 59.49)53.80 (47.14, 60.33)
Marital status 0.0880
Unmarried44.65 (36.10, 53.53)38.87 (33.49, 44.53)34.52 (27.61, 42.14)35.02 (27.97, 42.79)
Married55.35 (46.47, 63.90)61.13 (55.47, 66.51)65.48 (57.86, 72.39)64.98 (57.21, 72.03)
Coronary heart disease 0.0289
No97.46 (94.57, 98.83)98.50 (96.79, 99.31)97.10 (94.65, 98.45)94.18 (87.05, 97.50)
Yes2.54 (1.17, 5.43)1.50 (0.69, 3.21)2.90 (1.55, 5.35)5.82 (2.50, 12.95)
Heart attach 0.0013
No99.31 (98.03, 99.76)97.01 (94.23, 98.48)96.20 (92.97, 97.97)94.37 (88.90, 97.23)
Yes0.69 (0.24, 1.97)2.99 (1.52, 5.77)3.80 (2.03, 7.03)5.63 (2.77, 11.10)
Angina <0.0001
No99.56 (98.59, 99.86)98.79 (97.28, 99.46)97.60 (95.23, 98.80)93.86 (87.88, 96.99)
Yes0.44 (0.14, 1.41)1.21 (0.54, 2.72)2.40 (1.20, 4.77)6.14 (3.01, 12.12)
Stroke 0.4363
No98.57 (96.80, 99.37)97.51 (95.34, 98.69)97.01 (94.57, 98.37)97.40 (95.82, 98.39)
Yes1.43 (0.63, 3.20)2.49 (1.31, 4.66)2.99 (1.63, 5.43)2.60 (1.61, 4.18)
MetS <0.0001
No94.41 (90.13, 96.90)89.10 (84.11, 92.66)68.12 (60.91, 74.55)33.62 (23.75, 45.17)
Yes5.59 (3.10, 9.87)10.90 (7.34, 15.89)31.88 (25.45, 39.09)66.38 (54.83, 76.25)
Smoke 0.0049
Never62.15 (55.96, 67.97)60.21 (51.53, 68.29)58.19 (53.14, 63.07)46.39 (39.26, 53.66)
Former25.77 (19.78, 32.84)23.45 (17.57, 30.56)22.18 (16.67, 28.87)30.67 (25.98, 35.79)
Now12.08 (7.96, 17.91)16.34 (12.81, 20.61)19.63 (14.04, 26.76)22.95 (16.96, 30.29)
Diabetes <0.0001
No96.21 (94.89, 97.20)93.59 (91.00, 95.47)83.82 (79.51, 87.37)72.91 (67.96, 77.36)
Yes3.79 (2.80, 5.11)6.41 (4.53, 9.00)16.18 (12.63, 20.49)27.09 (22.64, 32.04)
Hypertension 0.0004
No71.77 (61.89, 79.92)70.89 (63.22, 77.53)55.24 (47.32, 62.90)54.14 (45.93, 62.14)
Yes28.23 (20.08, 38.11)29.11 (22.47, 36.78)44.76 (37.10, 52.68)45.86 (37.86, 54.07)
Statins use <0.0001
No86.39 (80.93, 90.47)89.58 (85.13, 92.81)81.94 (78.13, 85.21)75.97 (69.22, 81.64)
Yes13.61 (9.53, 19.07)10.42 (7.19, 14.87)18.06 (14.79, 21.87)24.03 (18.36, 30.78)
Antidiabetic drugs <0.0001
No97.10 (95.81, 98.01)94.91 (92.84, 96.40)86.35 (82.79, 89.26)77.71 (72.23, 82.38)
Yes2.90 (1.99, 4.19)5.09 (3.60, 7.16)13.65 (10.74, 17.21)22.29 (17.62, 27.77)
Antihypertensive drugs 0.1399
No98.05 (96.25, 99.00)95.48 (90.46, 97.92)95.14 (91.78, 97.17)94.93 (92.20, 96.74)
Yes1.95 (1.00, 3.75)4.52 (2.08, 9.54)4.86 (2.83, 8.22)5.07 (3.26, 7.80)
Mean for continuous variables: The p-value was calculated by the weighted linear regression. Percent for categorical variables: p-value was calculated by weighted chi-square test.
Table 2. Associations between the atherogenic index of plasma and the risk of heart failure.
Exposure Non-Adjusted
OR (95%CI), p-Value
Adjust I
OR (95%CI), p-Value
Adjust II
OR (95%CI), p-Value
AIP2.47 (1.57, 3.89) <0.00011.73 (1.00, 2.99) 0.04810.28 (0.10, 0.78) 0.0154
AIP quartile
Q11(Reference)1(Reference)1(Reference)
Q21.18 (0.74, 1.87) 0.49370.99 (0.60, 1.62) 0.96480.38 (0.20, 0.72) 0.0033
Q31.03 (0.64, 1.65) 0.91730.64 (0.39, 1.07) 0.08790.24 (0.12, 0.48) <0.0001
Q42.16 (1.43, 3.27) 0.00031.41 (0.89, 2.24) 0.14330.32 (0.14, 0.74) 0.0075
Non-adjusted model adjusts for: None. Adjust I model adjust for: sex, age (continuous variable), BMI (continuous variable), education level, and smoke; Adjust II model adjust for: sex, age, BMI, education level, smoke, coronary heart disease, heart attack, angina, stroke, MetS, diabetes, eGFR, hypertension, glucose, HbA1c, ALT, albumin, globulin, creatinine, blood urea nitrogen, HDL cholesterol, hs-CRP, statins use, antidiabetic drug, and antihypertensive drug.
Publisher’s Note: MDPI stays neutral with regard to jurisdictional claims in published maps and institutional affiliations.