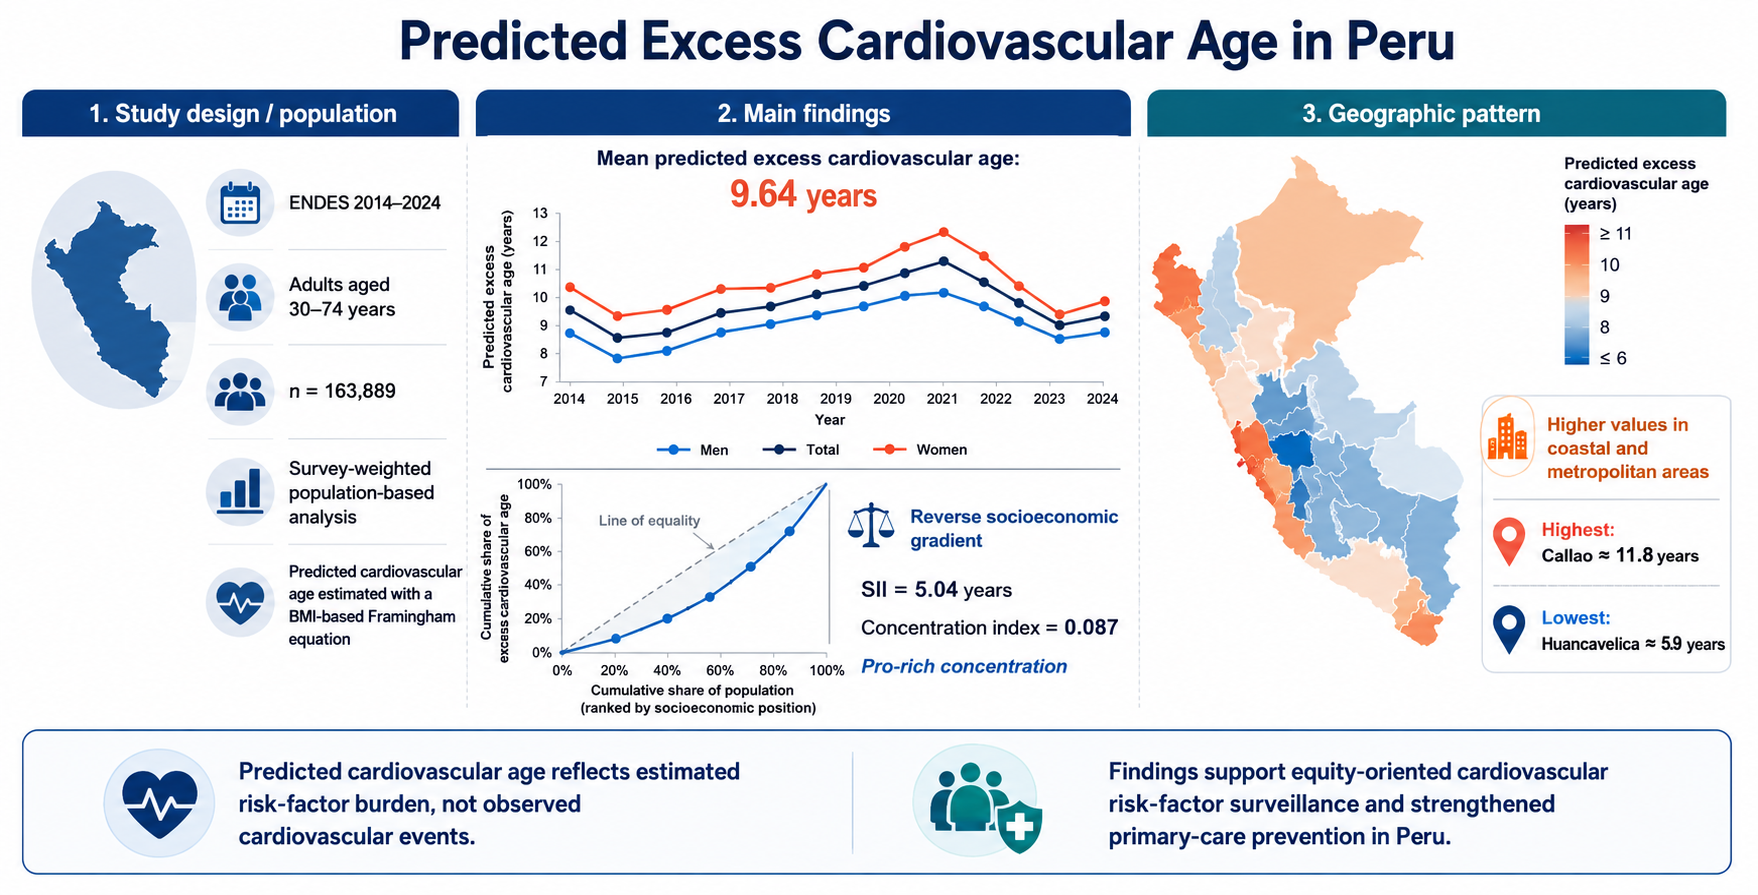

Predicted Excess Cardiovascular Age and a Reverse Socioeconomic Gradient in a Middle-Income Latin American Country: A Population-Based Analysis of 163,889 Peruvians

 , ,
, ,
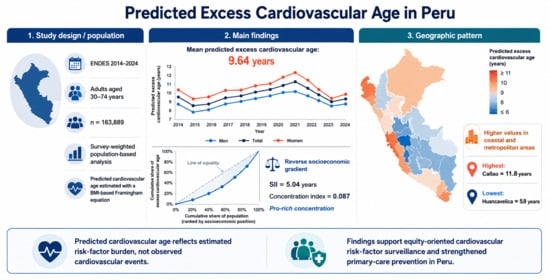
Abstract
1. Introduction
2. Materials and Methods
2.1. Study Design
2.2. Data Source
2.3. Study Population and Eligibility Criteria
2.4. Study Variables
2.4.1. Outcome
2.4.2. Main Exposure Variables
2.4.3. Covariates and Components of the Framingham Equation
2.5. Statistical Analysis
2.6. Ethical Considerations
3. Results
3.1. Participant Selection
3.2. Characteristics of the Study Population
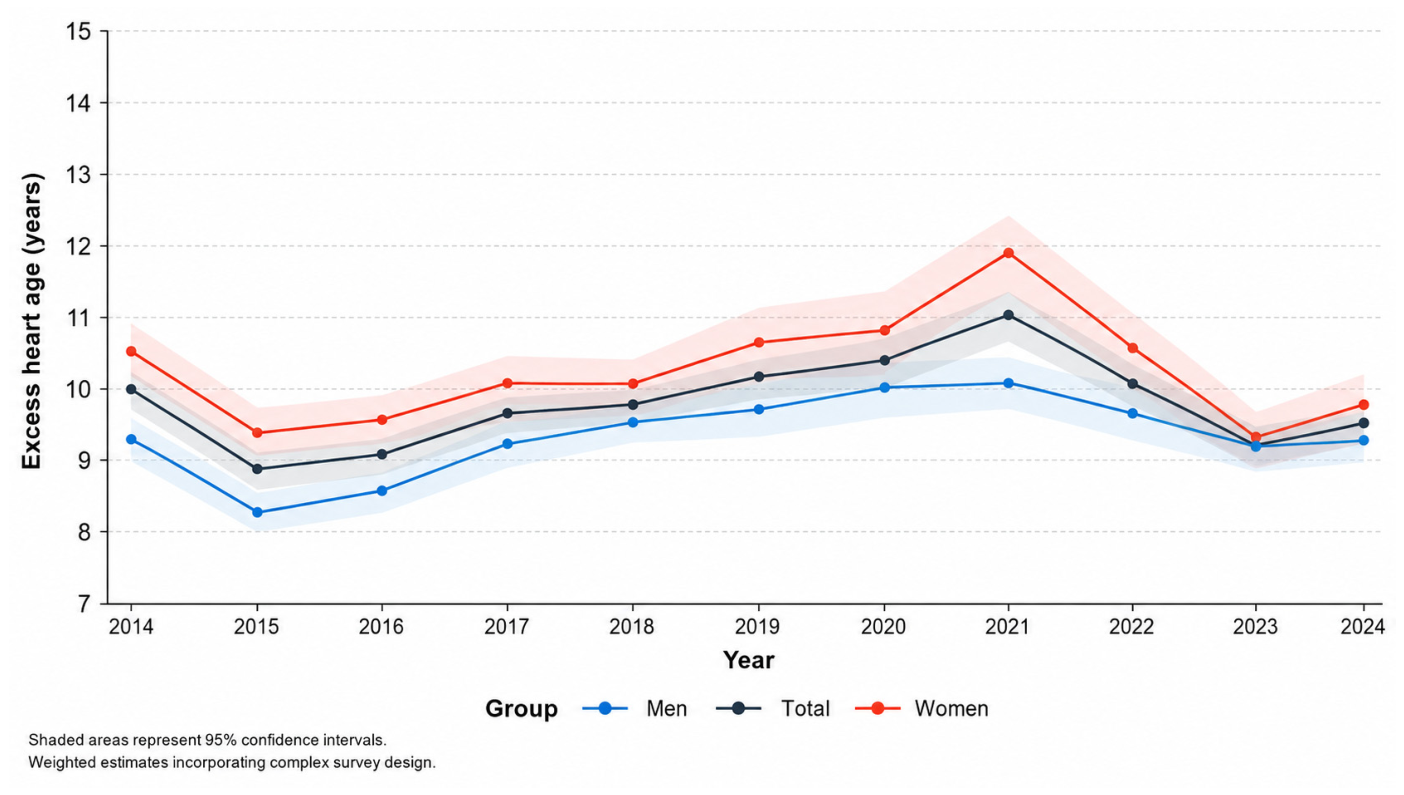
3.3. Temporal Variation in Excess Cardiovascular Age (2014–2024)
3.4. Distribution of Excess Cardiovascular Age in the Population
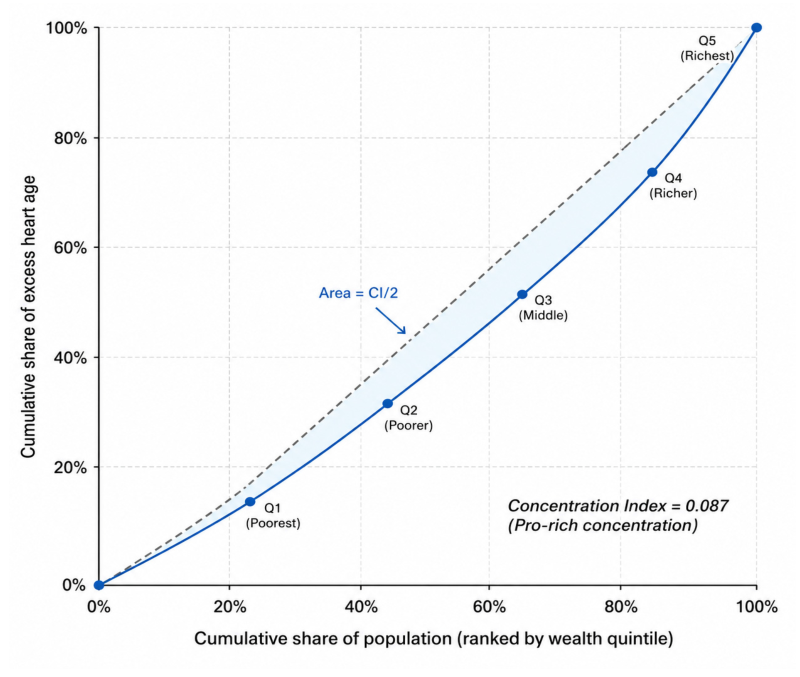
3.5. Socioeconomic Inequalities in Excess Cardiovascular Age
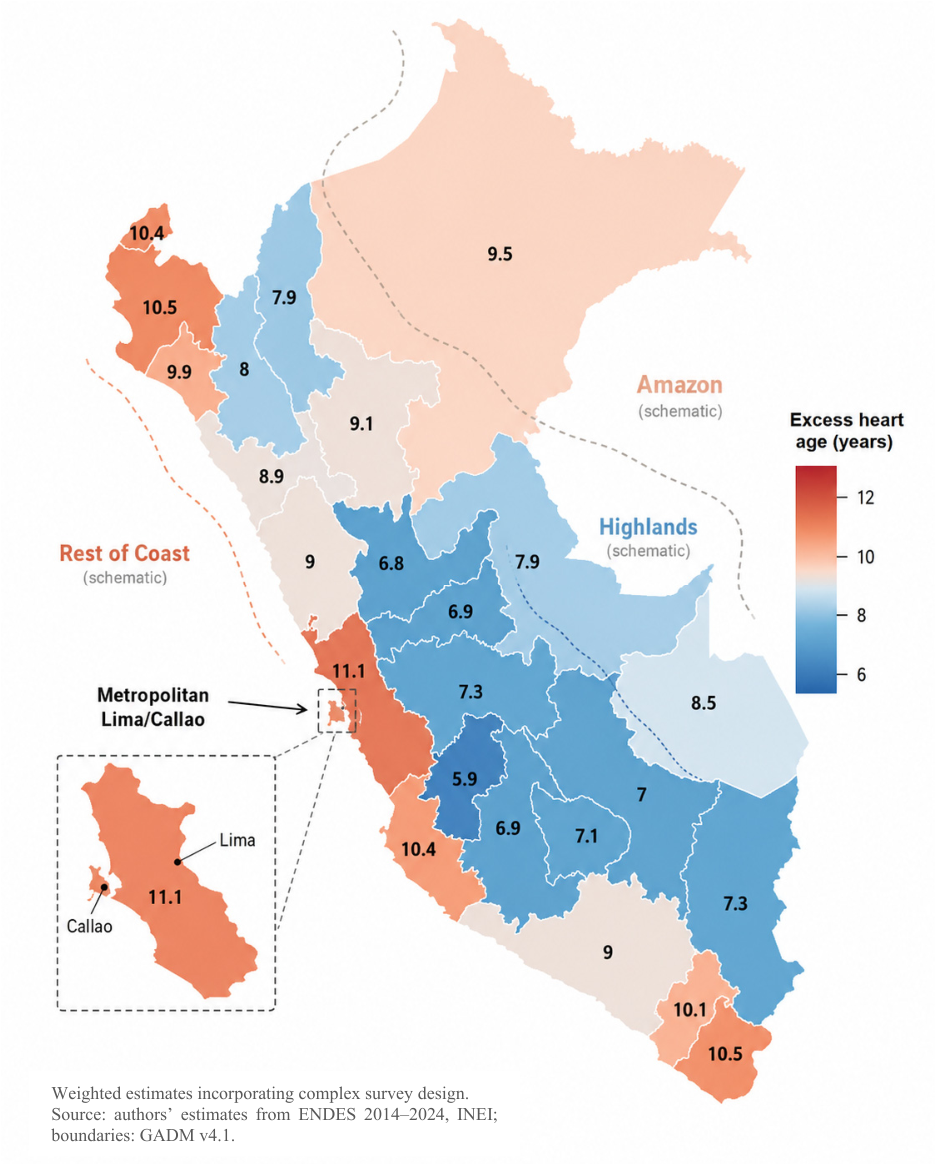
3.6. Geographic Inequalities in Excess Cardiovascular Age
4. Discussion
4.1. Main Findings
4.2. Comparison with Other Studies
4.3. Surveillance-Oriented Implications for Cardiovascular Risk-Factor Prevention
4.4. Limitations
5. Conclusions
Supplementary Materials
Author Contributions
Funding
Institutional Review Board Statement
Informed Consent Statement
Data Availability Statement
Acknowledgments
Conflicts of Interest
References
- Global Burden of Cardiovascular Diseases and Risks 2023 Collaborators. Global, Regional, and National Burden of Cardiovascular Diseases and Risk Factors in 204 Countries and Territories, 1990–2023. J. Am. Coll. Cardiol. 2025, 86, 2167–2243. [CrossRef] [Scilit] [PubMed]
- Niessen, L.W.; Mohan, D.; Akuoku, J.K.; Mirelman, A.J.; Ahmed, S.; Koehlmoos, T.P.; Trber, A.; Obber, C.; Gustafsson-Wright, E. Tackling Socioeconomic Inequalities and Non-communicable Diseases in Low-income and Middle-income Countries under the Sustainable Development Agenda. Lancet 2018, 391, 2036–2046. [Google Scholar] [CrossRef] [Scilit] [PubMed]
- Rosengren, A.; Smyth, A.; Rangarajan, S.; Ramasundarahettige, C.; Bangdiwala, S.I.; AlHabib, K.F.; Avezum, A.; Bengtsson Boström, K.; Chifamba, J.; Gulec, S.; et al. Socioeconomic Status and Risk of Cardiovascular Disease in 20 Low-income, Middle-income, and High-income Countries: The Prospective Urban Rural Epidemiologic (PURE) Study. Lancet Glob. Health 2019, 7, e748–e760. [Google Scholar] [CrossRef] [Scilit] [PubMed]
- Jiwani, S.S.; Carrillo-Larco, R.M.; Hernández-Vásquez, A.; Barrientos-Gutiérrez, T.; Basto-Abreu, A.; Gutierrez, L.; Irazola, V.; Nieto-Martínez, R.; Nishi, N.; Ochoa-Avilés, A.; et al. The Shift of Obesity Burden by Socioeconomic Status between 1998 and 2017 in Latin America and the Caribbean: A Cross-sectional Series Study. Lancet Glob. Health 2019, 7, e1644–e1654. [Google Scholar] [CrossRef] [Scilit] [PubMed]
- Carrillo-Larco, R.M.; Guzman-Vilca, W.C.; Leon-Velarde, F.; Bernabe-Ortiz, A.; Jimenez, M.M.; Penny, M.E.; Pérez-Lu, J.E.; Taype-Rondan, A.; García, P.J.; Moscoso-Porras, M.; et al. Peru—Progress in Health and Sciences in 200 Years of Independence. Lancet Reg. Health Am. 2022, 7, 100148. [Google Scholar] [CrossRef] [Scilit] [PubMed]
- Visseren, F.L.J.; Mach, F.; Smulders, Y.M.; Carballo, D.; Koskinas, K.C.; Bäck, M.; Benetos, A.; Biffi, A.; Boavida, J.-M.; Capodanno, D.; et al. 2021 ESC Guidelines on Cardiovascular Disease Prevention in Clinical Practice. Eur. Heart J. 2021, 42, 3227–3337. [Google Scholar] [CrossRef] [Scilit] [PubMed]
- Guzman-Vilca, W.C.; Quispe-Villegas, G.A.; Carrillo-Larco, R.M. Predicted Heart Age Profile across 41 Countries: A Cross-sectional Study of Nationally Representative Surveys in Six World Regions. eClinicalMedicine 2022, 52, 101688. [Google Scholar] [CrossRef] [Scilit] [PubMed]
- Bakhit, M.; Fien, S.; Abukmail, E.; Jones, M.; Clark, J.; Scott, A.M.; Del Mar, C.; Hoffmann, T. Cardiovascular Disease Risk Communication and Prevention: A Meta-analysis. Eur. Heart J. 2024, 45, 998–1013. [Google Scholar] [CrossRef] [Scilit] [PubMed]
- von Elm, E.; Altman, D.G.; Egger, M.; Pocock, S.J.; Gøtzsche, P.C.; Vandenbroucke, J.P.; STROBE Initiative. The Strengthening the Reporting of Observational Studies in Epidemiology (STROBE) Statement: Guidelines for Reporting Observational Studies. Lancet 2007, 370, 1453–1457. [Google Scholar] [CrossRef] [Scilit] [PubMed]
- Instituto Nacional de Estadística e Informática (INEI). Demographic and Family Health Survey (ENDES) 2023: Technical Sheet. Available online: https://proyectos.inei.gob.pe/iinei/srienaho/Descarga/FichaTecnica/887-Ficha.pdf (accessed on 10 February 2026).
- D’Agostino, R.B., Sr.; Vasan, R.S.; Pencina, M.J.; Wolf, P.A.; Cobain, M.; Massaro, J.M.; Kannel, W.B. General Cardiovascular Risk Profile for Use in Primary Care: The Framingham Heart Study. Circulation 2008, 117, 743–753. [Google Scholar] [CrossRef] [Scilit] [PubMed]
- Global Administrative Areas (GADM). GADM Database of Global Administrative Areas, Version 4.1: Peru Level-1 Administrative Boundaries. Available online: https://geodata.ucdavis.edu/gadm/gadm4.1/json/gadm41_PER_1.json (accessed on 1 March 2026).
- Tripathy, J.P. Secondary Data Analysis: Ethical Issues and Challenges. Iran. J. Public Health 2013, 42, 1478–1479. [Google Scholar] [CrossRef] [Scilit] [PubMed]
- Yang, Q.; Zhou, W.; Tong, X.; Zhang, Z.; Merritt, R.K. Predicted Heart Age and Life’s Essential 8 among U.S. Adults: NHANES 2015–March 2020. Am. J. Prev. Med. 2025, 68, 98–106. [Google Scholar] [CrossRef] [Scilit] [PubMed]
- Di Cesare, M.; Khang, Y.H.; Asaria, P.; Blakely, T.; Cowan, M.J.; Farzadfar, F.; Guerrero, R.; Ikeda, N.; Kyobutungi, C.; Msyamboza, K.P.; et al. Inequalities in Non-communicable Diseases and Effective Responses. Lancet 2013, 381, 585–597. [Google Scholar] [CrossRef] [Scilit] [PubMed]
- Corsi, D.J.; Subramanian, S.V. Socioeconomic Gradients and Distribution of Diabetes, Hypertension, and Obesity in India. JAMA Netw. Open 2019, 2, e190411. [Google Scholar] [CrossRef] [Scilit] [PubMed]
- Neuman, M.; Kawachi, I.; Gortmaker, S.; Subramanian, S.V. Urban-rural Differences in BMI in Low- and Middle-income Countries: The Role of Socioeconomic Status. Am. J. Clin. Nutr. 2013, 97, 428–436. [Google Scholar] [CrossRef] [Scilit] [PubMed]
- Miranda, J.J.; Gilman, R.H.; Smeeth, L. Differences in Cardiovascular Risk Factors in Rural, Urban and Rural-to-urban Migrants in Peru. Heart 2011, 97, 787–796. [Google Scholar] [CrossRef] [Scilit] [PubMed]
- Yusuf, S.; Hawken, S.; Ounpuu, S.; Dans, T.; Avezum, A.; Lanas, F.; McQueen, M.; Budaj, A.; Pais, P.; Varigos, J.; et al. Effect of Potentially Modifiable Risk Factors Associated with Myocardial Infarction in 52 Countries (the INTERHEART Study): Case-control Study. Lancet 2004, 364, 937–952. [Google Scholar] [CrossRef] [Scilit] [PubMed]
- NCD Risk Factor Collaboration (NCD-RisC). Worldwide Trends in Hypertension Prevalence and Progress in Treatment and Control from 1990 to 2019: A Pooled Analysis of 1201 Population-representative Studies with 104 Million Participants. Lancet 2021, 398, 957–980. [Google Scholar] [CrossRef] [Scilit] [PubMed]
- Ettehad, D.; Emdin, C.A.; Kiran, A.; Anderson, S.G.; Callender, T.; Emberson, J.; Chalmers, J.; Rodgers, A.; Rahimi, K. Blood Pressure Lowering for Prevention of Cardiovascular Disease and Death: A Systematic Review and Meta-analysis. Lancet 2016, 387, 957–967. [Google Scholar] [CrossRef] [Scilit] [PubMed]
- Taillie, L.S.; Reyes, M.; Colchero, M.A.; Popkin, B.; Corvalán, C. An Evaluation of Chile’s Law of Food Labeling and Advertising on Sugar-sweetened Beverage Purchases from 2015 to 2017: A Before-and-after Study. PLoS Med. 2020, 17, e1003015. [Google Scholar] [CrossRef] [Scilit] [PubMed]
- Taillie, L.S.; Bercholz, M.; Popkin, B.; Rebolledo, N.; Reyes, M.; Corvalán, C. Decreases in Purchases of Energy, Sodium, Sugar, and Saturated Fat 3 Years after Implementation of the Chilean Food Labeling and Marketing Law: An Interrupted Time Series Analysis. PLoS Med. 2024, 21, e1004463. [Google Scholar] [CrossRef] [Scilit] [PubMed]
- Colchero, M.A.; Popkin, B.M.; Rivera, J.A.; Ng, S.W. Beverage Purchases from Stores in Mexico under the Excise Tax on Sugar Sweetened Beverages: Observational Study. BMJ 2016, 352, h6704. [Google Scholar] [CrossRef] [Scilit] [PubMed]
- Tan, C.E.; Glantz, S.A. Association between Smoke-free Legislation and Hospitalizations for Cardiac, Cerebrovascular, and Respiratory Diseases: A Meta-analysis. Circulation 2012, 126, 2177–2183. [Google Scholar] [CrossRef] [Scilit] [PubMed]
- Khunti, K.; Aroda, V.R.; Aschner, P.; Chan, J.C.N.; Del Prato, S.; Hambling, C.E.; Harris, S.; Lamber, A.; Mata-Cases, M.; Seidu, S.; et al. The Impact of the COVID-19 Pandemic on Diabetes Services: Planning for a Global Recovery. Lancet Diabetes Endocrinol. 2022, 10, 890–900. [Google Scholar] [CrossRef] [Scilit] [PubMed]
- Xie, Y.; Xu, E.; Bowe, B.; Al-Aly, Z. Long-term Cardiovascular Outcomes of COVID-19. Nat. Med. 2022, 28, 583–590. [Google Scholar] [CrossRef] [Scilit] [PubMed]



| Characteristic | Total (n = 163,889) | Women (n = 86,914) | Men (n = 76,975) |
|---|---|---|---|
| Age, years, mean (SD) | 47.8 (11.9) | 47.6 (11.8) | 48.0 (12.0) |
| Age group, n (%) | |||
| 30–39 years | 50,124 (30.6) | 27,033 (31.1) | 23,091 (29.8) |
| 40–49 years | 45,678 (27.9) | 24,512 (28.2) | 21,166 (27.5) |
| 50–59 years | 38,234 (23.3) | 20,145 (23.2) | 18,089 (23.5) |
| 60–74 years | 29,853 (18.2) | 15,224 (17.5) | 14,629 (19.0) |
| Educational level, n (%) | |||
| No schooling/Pre-primary | 8956 (5.5) | 7234 (8.3) | 1722 (2.2) |
| Primary | 52,345 (31.9) | 31,456 (36.2) | 20,889 (27.1) |
| Secondary | 58,234 (35.5) | 28,567 (32.9) | 29,667 (38.5) |
| Higher | 44,354 (27.1) | 19,657 (22.6) | 24,697 (32.1) |
| Wealth quintile, n (%) | |||
| Q1 (Poorest) | 46,897 (18.2) | 25,123 (18.5) | 21,774 (17.9) |
| Q2 (Poor) | 39,104 (18.8) | 20,856 (19.1) | 18,248 (18.6) |
| Q3 (Middle) | 31,409 (20.0) | 16,534 (19.8) | 14,875 (20.1) |
| Q4 (Rich) | 25,794 (21.0) | 13,567 (20.8) | 12,227 (21.2) |
| Q5 (Richest) | 20,685 (22.0) | 10,834 (21.8) | 9851 (22.2) |
| Natural region, n (%) | |||
| Metropolitan Lima | 17,234 (32.5) | 9123 (32.8) | 8111 (32.2) |
| Rest of Coast | 38,567 (24.3) | 20,345 (24.1) | 18,222 (24.5) |
| Highlands | 72,456 (27.8) | 38,234 (27.9) | 34,222 (27.7) |
| Amazon | 35,632 (15.4) | 19,212 (15.2) | 16,420 (15.6) |
| Area of residence, n (%) | |||
| Urban | 94,567 (76.8) | 50,234 (77.1) | 44,333 (76.5) |
| Rural | 69,322 (23.2) | 36,680 (22.9) | 32,642 (23.5) |
| Cardiovascular risk factors | |||
| SBP, mmHg, mean (SD) | 121.4 (17.8) | 117.2 (17.1) | 126.1 (17.5) |
| BMI, kg/m2, mean (SD) | 27.4 (4.8) | 27.9 (5.1) | 26.8 (4.3) |
| Current smoker, n (%) | 12,345 (7.5) | 2456 (2.8) | 9889 (12.8) |
| Diabetes, n (%) | 9876 (6.0) | 5234 (6.0) | 4642 (6.0) |
| Antihypertensive treatment, n (%) | 18,567 (11.3) | 11,234 (12.9) | 7333 (9.5) |
| Cardiovascular indicators | |||
| Cardiovascular age, years, mean (SD) | 57.4 (15.2) | 57.3 (14.8) | 57.5 (15.6) |
| Excess cardiovascular age, years, mean (SD) | 9.64 (11.2) | 9.73 (10.8) | 9.54 (11.6) |
| 10-year CVD risk, %, mean (SD) | 8.2 (9.4) | 5.1 (6.2) | 11.7 (11.2) |
| Characteristic | Total | Women | Men |
|---|---|---|---|
| Total | 9.64 (9.48; 9.80) | 9.73 (9.52; 9.94) | 9.54 (9.33; 9.75) |
| Age group | |||
| 30–39 years | 5.12 (4.92; 5.32) | 5.84 (5.58; 6.10) | 4.32 (4.08; 4.56) |
| 40–49 years | 8.45 (8.21; 8.69) | 9.12 (8.82; 9.42) | 7.71 (7.41; 8.01) |
| 50–59 years | 12.34 (12.02; 12.66) | 12.89 (12.49; 13.29) | 11.73 (11.33; 12.13) |
| 60–74 years | 14.56 (14.18; 14.94) | 13.21 (12.75; 13.67) | 15.97 (15.47; 16.47) |
| Wealth quintile | |||
| Q1 (Poorest) | 7.14 (7.00; 7.29) | 8.09 (7.83; 8.34) | 6.19 (6.03; 6.34) |
| Q2 (Poor) | 8.70 (8.53; 8.87) | 9.30 (9.02; 9.58) | 8.18 (7.98; 8.38) |
| Q3 (Middle) | 9.88 (9.68; 10.08) | 10.32 (10.02; 10.62) | 9.43 (9.18; 9.68) |
| Q4 (Rich) | 10.74 (10.52; 10.97) | 10.89 (10.57; 11.21) | 10.54 (10.24; 10.84) |
| Q5 (Richest) | 11.25 (11.01; 11.50) | 11.20 (10.86; 11.54) | 11.32 (11.00; 11.64) |
| Natural region | |||
| Metropolitan Lima | 11.17 (10.95; 11.39) | 11.54 (11.22; 11.86) | 10.78 (10.48; 11.08) |
| Rest of Coast | 10.30 (10.15; 10.46) | 10.68 (10.42; 10.94) | 9.94 (9.72; 10.16) |
| Highlands | 7.45 (7.33; 7.57) | 7.89 (7.69; 8.09) | 6.94 (6.78; 7.10) |
| Amazon | 8.32 (8.16; 8.49) | 8.72 (8.48; 8.96) | 7.89 (7.67; 8.11) |
| Area of residence | |||
| Urban | 10.28 (10.17; 10.40) | 10.56 (10.40; 10.72) | 9.99 (9.83; 10.15) |
| Rural | 7.25 (7.10; 7.39) | 8.11 (7.88; 8.34) | 6.36 (6.18; 6.54) |
| Educational level | |||
| No schooling/Pre-primary | 8.23 (7.89; 8.57) | 8.45 (8.05; 8.85) | 7.56 (6.98; 8.14) |
| Primary | 8.67 (8.49; 8.85) | 9.12 (8.86; 9.38) | 8.01 (7.77; 8.25) |
| Secondary | 9.45 (9.27; 9.63) | 9.78 (9.52; 10.04) | 9.13 (8.89; 9.37) |
| Higher | 10.89 (10.67; 11.11) | 10.98 (10.66; 11.30) | 10.78 (10.48; 11.08) |
| Indicator | Total | Women | Men |
|---|---|---|---|
| Gaps by wealth quintile | |||
| Excess in Q1 (poorest), years | 7.14 | 8.09 | 6.19 |
| Excess in Q5 (richest), years | 11.25 | 11.20 | 11.32 |
| Absolute gap (Q5–Q1), years | 4.11 | 3.11 | 5.13 |
| 95% CI | (3.82; 4.40) | (1.78; 4.44) | (3.78; 6.48) |
| Relative gap (Q5/Q1) | 1.58 | 1.38 | 1.83 |
| Inequality indices | |||
| SII, years | 5.04 | 3.90 | 6.14 |
| 95% CI | (4.71; 5.37) | (3.36; 4.44) | (5.80; 6.48) |
| RII | 1.71 | 1.48 | 1.99 |
| Concentration index | 0.087 | 0.065 | 0.111 |
| Gaps by area of residence | |||
| Absolute gap (Urban–Rural), years | 3.04 | 2.45 | 3.63 |
| Relative gap (Urban/Rural) | 1.42 | 1.30 | 1.57 |
| Gaps by natural region | |||
| Absolute gap (Lima–Highlands), years | 3.72 | 3.65 | 3.84 |
| Relative gap (Lima/Highlands) | 1.50 | 1.46 | 1.55 |
Disclaimer/Publisher’s Note: The statements, opinions and data contained in all publications are solely those of the individual author(s) and contributor(s) and not of MDPI and/or the editor(s). MDPI and/or the editor(s) disclaim responsibility for any injury to people or property resulting from any ideas, methods, instructions or products referred to in the content. |
© 2026 by the authors. Licensee MDPI, Basel, Switzerland. This article is an open access article distributed under the terms and conditions of the Creative Commons Attribution (CC BY) license.
Share and Cite
Vera-Ponce, V.J.; Ballena-Caicedo, J.; Briceño-Chavez, J.E.; Cusma-Regalado, K.; Zuzunaga-Montoya, F.E.; Bautista Zuta, J.C.; Poemape Mestanza, R.L. Predicted Excess Cardiovascular Age and a Reverse Socioeconomic Gradient in a Middle-Income Latin American Country: A Population-Based Analysis of 163,889 Peruvians. J. Cardiovasc. Dev. Dis. 2026, 13, 318. https://doi.org/10.3390/jcdd13070318
Vera-Ponce VJ, Ballena-Caicedo J, Briceño-Chavez JE, Cusma-Regalado K, Zuzunaga-Montoya FE, Bautista Zuta JC, Poemape Mestanza RL. Predicted Excess Cardiovascular Age and a Reverse Socioeconomic Gradient in a Middle-Income Latin American Country: A Population-Based Analysis of 163,889 Peruvians. Journal of Cardiovascular Development and Disease. 2026; 13(7):318. https://doi.org/10.3390/jcdd13070318
Chicago/Turabian StyleVera-Ponce, Víctor Juan, Jhosmer Ballena-Caicedo, Jhofree Einstein Briceño-Chavez, Kevin Cusma-Regalado, Fiorella E. Zuzunaga-Montoya, Julio César Bautista Zuta, and Rossmery Leonor Poemape Mestanza. 2026. "Predicted Excess Cardiovascular Age and a Reverse Socioeconomic Gradient in a Middle-Income Latin American Country: A Population-Based Analysis of 163,889 Peruvians" Journal of Cardiovascular Development and Disease 13, no. 7: 318. https://doi.org/10.3390/jcdd13070318
APA StyleVera-Ponce, V. J., Ballena-Caicedo, J., Briceño-Chavez, J. E., Cusma-Regalado, K., Zuzunaga-Montoya, F. E., Bautista Zuta, J. C., & Poemape Mestanza, R. L. (2026). Predicted Excess Cardiovascular Age and a Reverse Socioeconomic Gradient in a Middle-Income Latin American Country: A Population-Based Analysis of 163,889 Peruvians. Journal of Cardiovascular Development and Disease, 13(7), 318. https://doi.org/10.3390/jcdd13070318