
Lipomatous Hypertrophy of the Interatrial Septum (LHIS) a Biomarker for Cardiovascular Protection? A Hypothesis Generating Case–Control Study

 , ,
, ,  , and
, and
Abstract
1. Introduction
2. Materials and Methods
2.1. Study Cohort
2.2. Inclusion Criteria
- (1)
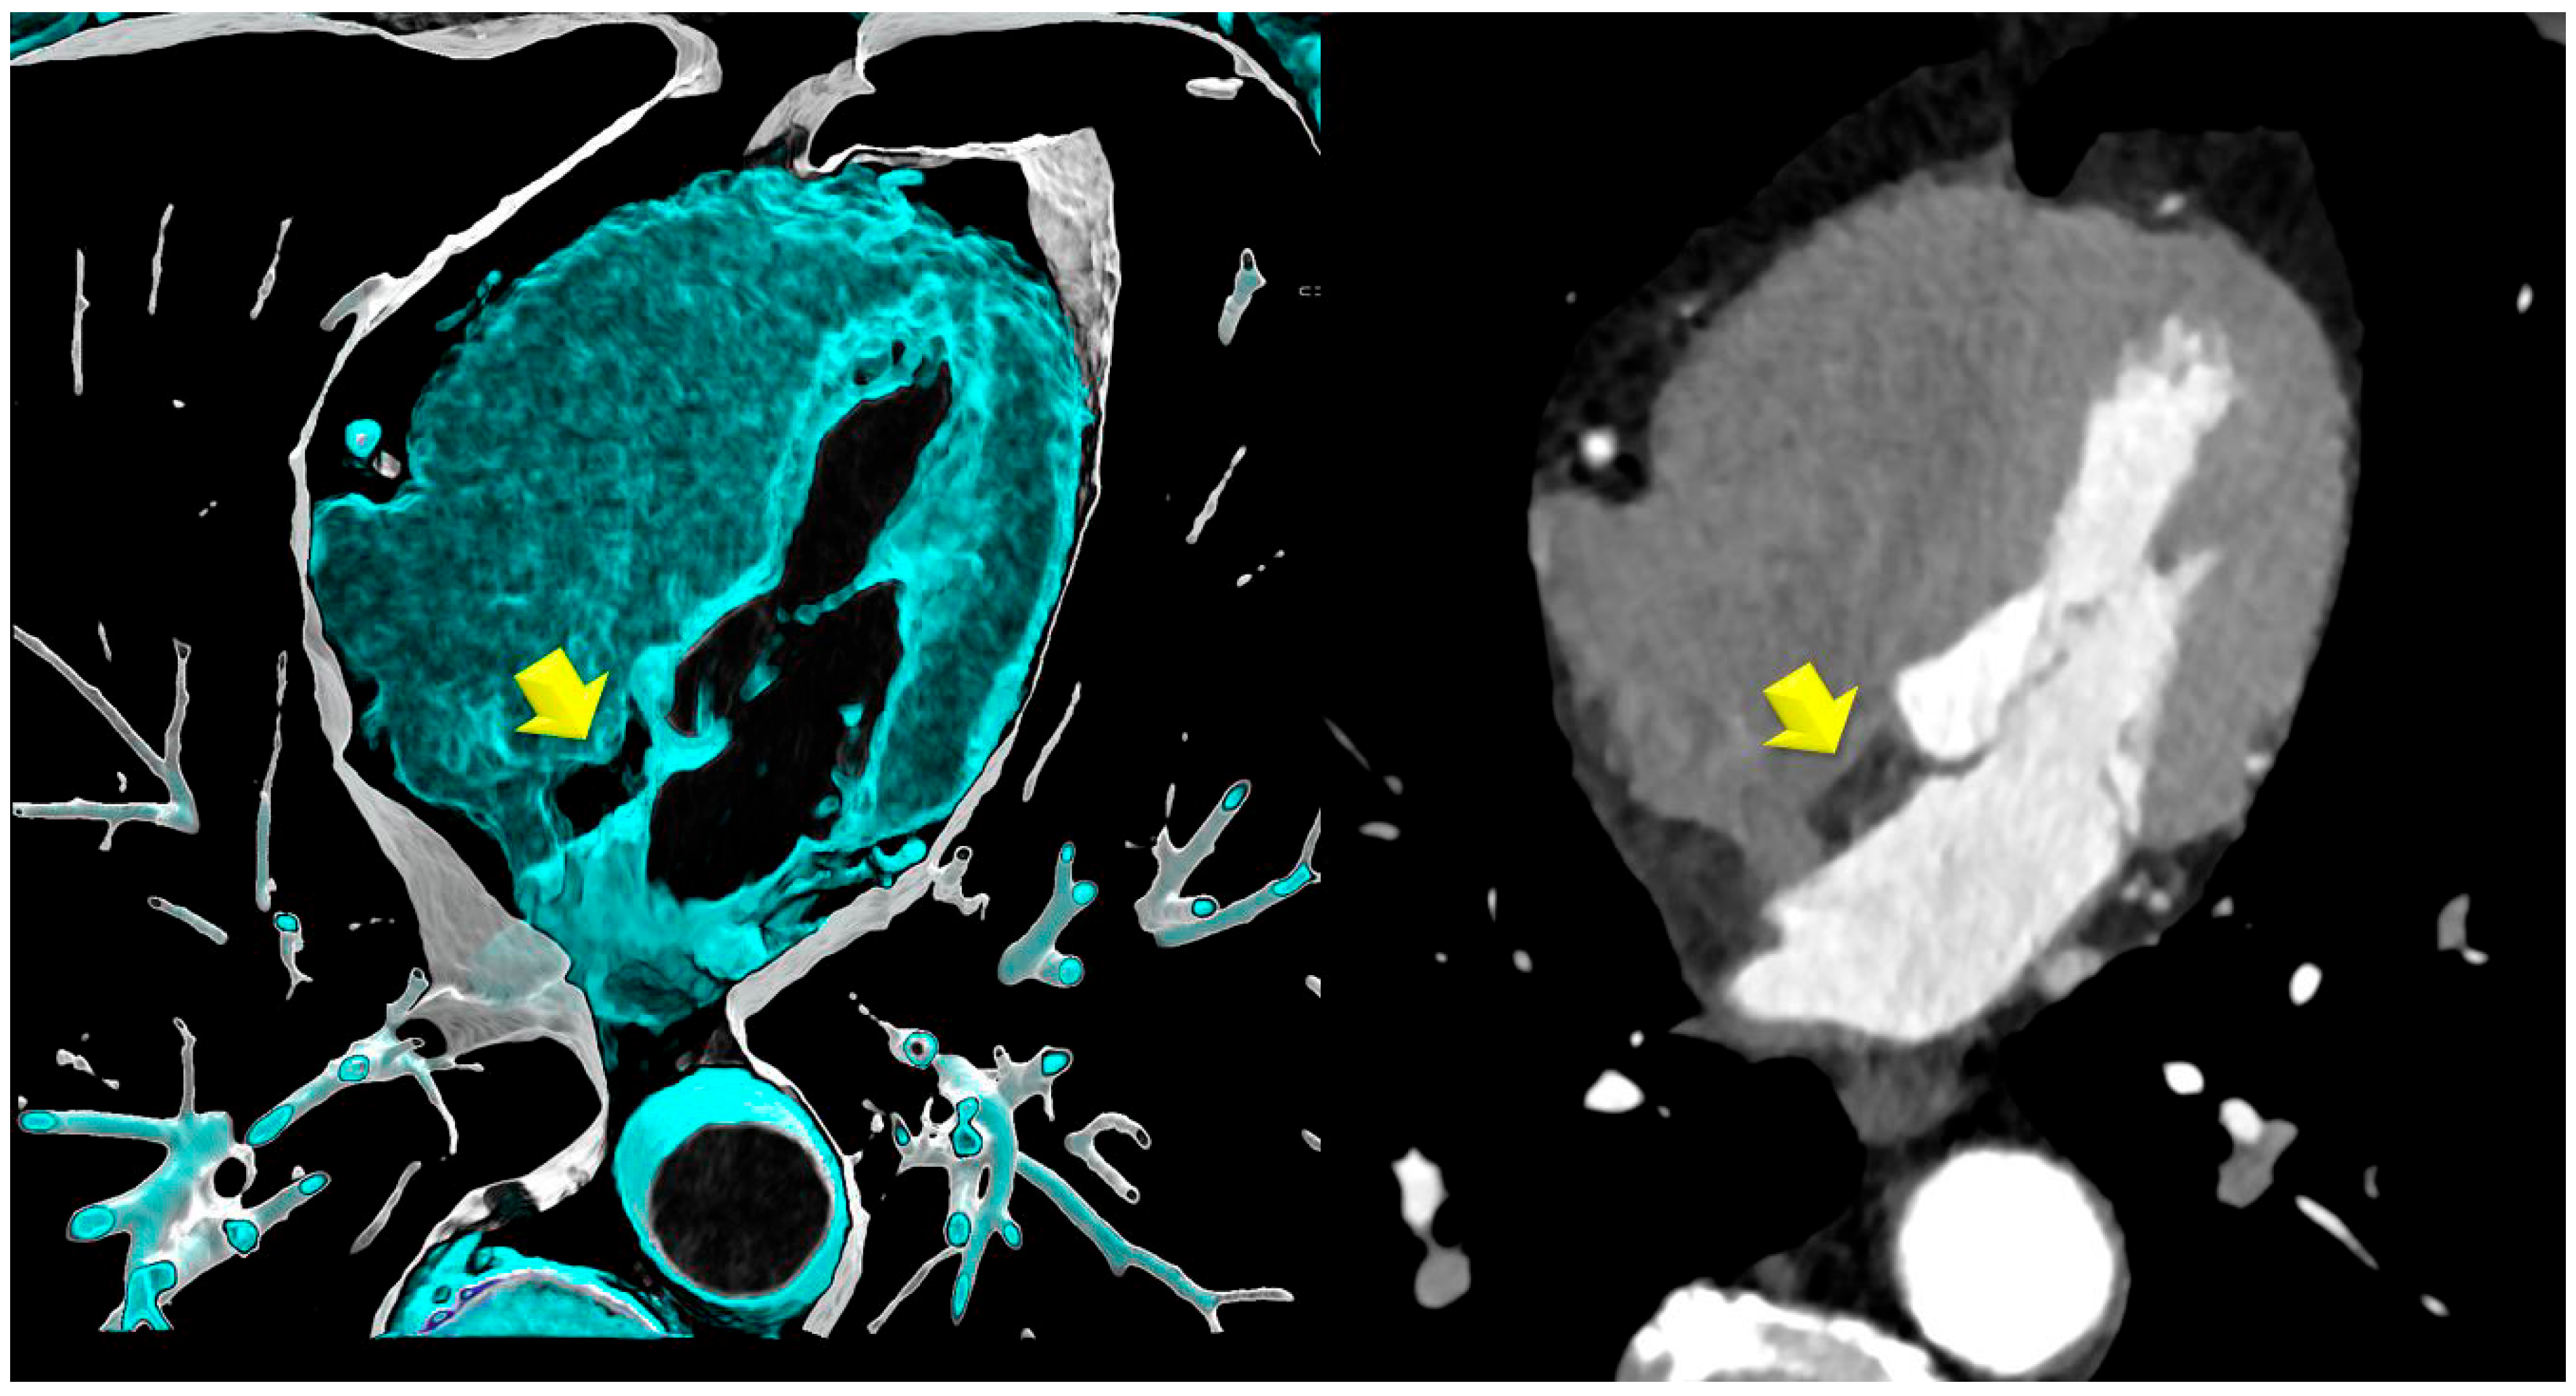
- Lipomatous hypertrophy of the interatrial septum (LHIS): This is defined as a mass-like lipomatous tissue infiltration of the entire interatrial septum from cranial to caudal, sparring the fossa ovalis, with a “dumb-bell” configuration with >than 5 mm width.The maximal width was identified on axial images and measured with a digital caliper. The maximal length was defined as the distance from the anterior to the posterior borders.
- (2)
- Control group (CR): Patients were propensity score-matched for age, body mass index (BMI), and the major cardiovascular risk factors (smoking, arterial hypertension, positive family history, dyslipidemia, and diabetes), with a matching level of 0.05. Further, the groups were balanced for the co-morbidity COPD. All CT scans were reviewed for the absence of LHIS by an experienced observer (a board-certified radiologist with >10 years of experience in cardiac CT).
- (1)
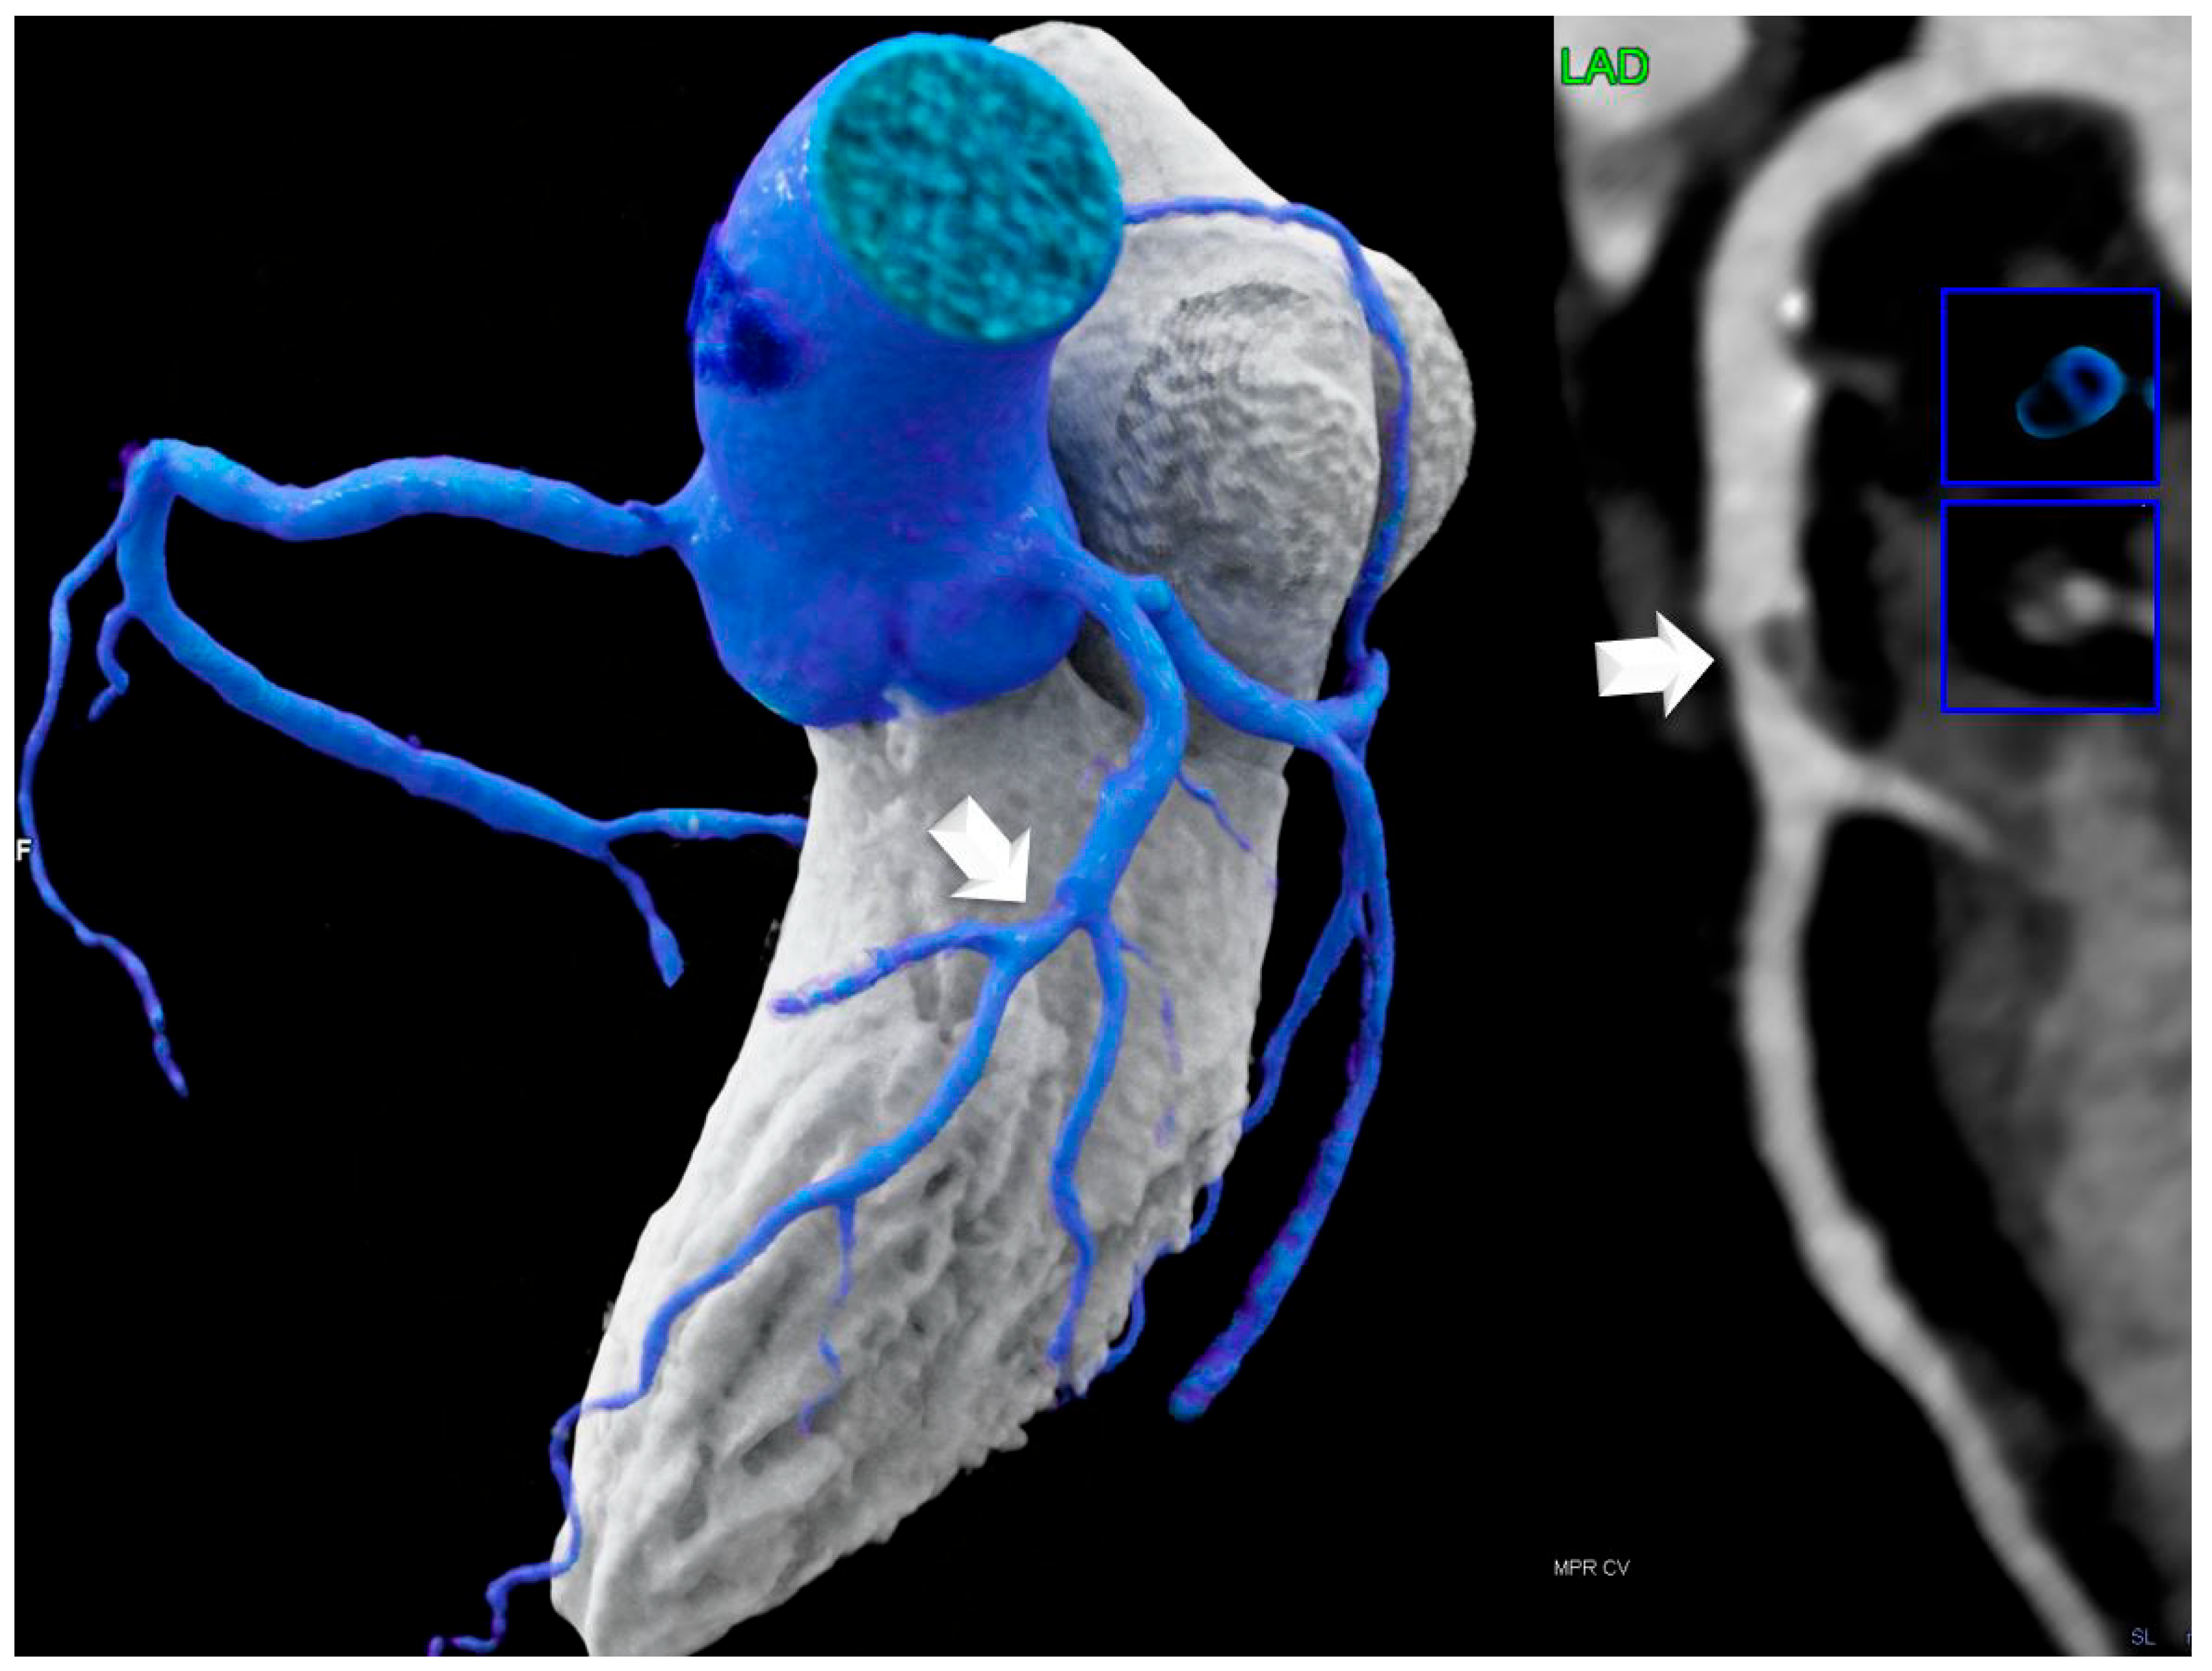
- Coronary stenosis severity was scored visually according to CAD-RADSTM [15] classification as minimal (CADRADS-1) < 25%, mild (CADRADS-2) 25–49.9%, moderate (CADRADS-3) 50–69.9%, severe (CADRADS-4) ≥ 70–99%, and occluded 100% (CADRADS-5) on a per-coronary segment-base (AHA-modified-17-segment classification), assisted by quantitative stenosis measurement using curved multiplanar reformations (MPR).
- (2)
- For coronary plaque phenotypes, high-risk-plaque (HRP) analysis was carried out according to the CADRADS [16]. Low attenuation plaque (LAP) was defined as a hypoattenuating lesion with <150 HU. CT-density was screened with the “pixel lens,” and the lowest HU were recorded. LAP < 30 HU was defined as lipid-rich necrotic core [8] and LAP < 60 HU as fibrofatty plaque. A napkin-ring sign was defined as a lesion with an outer high-density rim with an inner hypodense area [16]. Spotty calcification was defined as a calcification of less than 3 mm size. Positive remodeling was defined as a remodeling index (RI) of >1.1. A patient was labeled as “HRP” if a minimum of two criteria were present, and if at least one LAP < 30 HU or LAP < 60 HU was present per patient. Coronary CTA analysis was performed by one highly experienced reader (>5–10 years cardiac CT). The number of HRP criteria per patient was recorded (n = 2, n = 3, or n = 4), and the sum of HRP was calculated for each group. HRP analysis was repeated by a second observer with 3 years cardiac CT experience after 1 year, and by the same observer (with 10 years of cardiac CT experience) another 1 year.
- (3)
- Coronary plaque burden was classified according to the CADRADS 2.0 [16]. P-classification was as follows: P0 (no plaque); P1 (mild plaque burden, segment involvement score (SIS) < 2 = 1–2 vessels with mild amount of plaque); P2 (moderate, SIS 3–4); P3 (severe, SIS 5–7); and P4 (extensive plaque CAC > 1000 AU, SIS > 8).
- (4)
- Non-coronary CTA parameters: CT density of LHIS was measured. A circular region-of-interest (ROI) was placed in the area of maximal LHIS width, and CT density (HU) was measured. LHIS width and length were also measured.
3. Results
4. Discussion
5. Conclusions
Clinical Translation Statement
Author Contributions
Funding
Institutional Review Board Statement
Informed Consent Statement
Data Availability Statement
Conflicts of Interest
Abbreviations
| LHIS | lipomatous hypertrophy of the interatrial septum |
| CTA | computed tomography angiography |
| CAD | coronary artery disease |
| HRP | high-risk plaque |
| CAC | coronary artery calcium score |
| HU | Hounsfield units |
| CR | controls |
| CV | cardiovascular |
References
- Martin, S.S.; Aday, A.W.; Allen, N.B.; Almarzooq, Z.I.; Anderson, C.A.M.; Arora, P.; Avery, C.L.; Baker-Smith, C.M.; Bansal, N.; Beaton, A.Z.; et al. 2025 Heart Disease and Stroke Statistics: A Report of US and Global Data From the American Heart Association. Circulation 2025, 151, e41–e660. [Google Scholar]
- Rana, J.S.; Tabada, G.H.; Solomon, M.D.; Lo, J.C.; Jaffe, M.G.; Sung, S.H.; Ballantyne, C.M.; Go, A.S. Accuracy of the Atherosclerotic Cardiovascular Risk Equation in a Large Contemporary, Multiethnic Population. J. Am. Coll. Cardiol. 2016, 67, 2118–2130. [Google Scholar] [CrossRef] [PubMed] [PubMed Central]
- SCORE2 Working Group; ESC Cardiovascular Risk Collaboration. SCORE2 risk prediction algorithms: New models to estimate 10-year risk of cardiovascular disease in Europe. Eur. Heart J. 2021, 42, 2439–2454. [Google Scholar] [CrossRef] [PubMed] [PubMed Central]
- Blaha, M.J.; Cainzos-Achirica, M.; Dardari, Z.; Blankstein, R.; Shaw, L.J.; Rozanski, A.; Rumberger, J.A.; Dzaye, O.; Michos, E.D.; Berman, D.S.; et al. All-cause and cause-specific mortality in individuals with zero and minimal coronary artery calcium: A long-term, competing risk analysis in the Coronary Artery Calcium Consortium. Atherosclerosis 2020, 294, 72–79. [Google Scholar] [CrossRef] [PubMed]
- van Rosendael, A.R.; Shaw, L.J.; Xie, J.X.; Dimitriu-Leen, A.C.; Smit, J.M.; Scholte, A.J.; van Werkhoven, J.M.; Callister, T.Q.; DeLago, A.; Berman, D.S.; et al. Superior Risk Stratification With Coronary Computed Tomography Angiography Using a Comprehensive Atherosclerotic Risk Score. JACC Cardiovasc. Imaging 2019, 12, 1987–1997. [Google Scholar] [CrossRef] [PubMed] [PubMed Central]
- Xie, J.X.; Cury, R.C.; Leipsic, J.; Crim, M.T.; Berman, D.S.; Gransar, H.; Budoff, M.J.; Achenbach, S.; Ó Hartaigh, B.; Callister, T.Q.; et al. The Coronary Artery Disease-Reporting and Data System (CAD-RADS): Prognostic and Clinical Implications Associated With Standardized Coronary Computed Tomography Angiography Reporting. JACC Cardiovasc. Imaging 2018, 11, 78–89. [Google Scholar] [CrossRef] [PubMed]
- Nurmohamed, T.P.V.; Nurmohamed, N.S.; Min, J.K.; Anthopolos, R.; Reynolds, H.R.; Earls, J.P.; Crabtree, T.; Mancini, G.B.J.; Leipsic, J.; Budoff, M.J.; et al. Atherosclerosis quantification and cardiovascular risk: The ISCHEMIA trial. Eur. Heart J. 2024, 45, 3735–3747. [Google Scholar] [CrossRef] [PubMed]
- Williams, M.C.; Kwiecinski, J.; Doris, M.; McElhinney, P.; D’Souza, M.S.; Cadet, S.; Adamson, P.D.; Moss, A.J.; Alam, S.; Hunter, A.; et al. Low-Attenuation Noncalcified Plaque on Coronary Computed Tomography Angiography Predicts Myocardial Infarction: Results From the Multicenter SCOT-HEART Trial (Scottish Computed Tomography of the HEART). Circulation 2020, 141, 1452–1462. [Google Scholar] [CrossRef]
- Goeller, M.; Achenbach, S.; Marwan, M.; Doris, M.K.; Cadet, S.; Commandeur, F.; Chen, X.; Slomka, P.J.; Gransar, H.; Cao, J.J.; et al. Epicardial adipose tissue density and volume are related to subclinical atherosclerosis, inflammation and major adverse cardiac events in asymptomatic subjects. J. Cardiovasc. Comput. Tomogr. 2018, 12, 67–73. [Google Scholar] [CrossRef]
- Oikonomou, E.K.; Antonopoulos, A.S.; Schottlander, D.; Marwan, M.; Mathers, C.; Tomlins, P.; Siddique, M.; Klüner, L.V.; Shirodaria, C.; Mavrogiannis, M.C.; et al. Standardized measurement of coronary inflammation using cardiovascular computed tomography: Integration in clinical care as a prognostic medical device. Cardiovasc. Res. 2021, 117, 2677–2690. [Google Scholar] [CrossRef]
- Lacaita, P.G.; Senoner, T.; Bilgeri, V.; Rauch, S.; Barbieri, F.; Kindl, B.; Plank, F.; Dichtl, W.; Deeg, J.; Widmann, G.; et al. The interaction of lipomatous hypertrophy of the interatrial septum with pericardial adipose tissue biomarkers by computed tomography. Eur. Radiol. 2024, 35, 2189–2199. [Google Scholar] [CrossRef]
- Fan, C.M.; Fischman, A.J.; Kwek, B.H.; Abbara, S.; Aquino, S.L. Lipomatous hypertrophy of the interatrial septum: Increased uptake on FDG PET. Am. J. Roentgenol. 2005, 184, 339–342. [Google Scholar] [CrossRef] [PubMed]
- Becher, T.; Palanisamy, S.; Kramer, D.J.; Eljalby, M.; Marx, S.J.; Wibmer, A.G.; Butler, S.D.; Jiang, C.S.; Vaughan, R.; Schöder, H.; et al. Brown adipose tissue is associated with cardiometabolic health. Nat. Med. 2021, 27, 58–65. [Google Scholar] [CrossRef] [PubMed] [PubMed Central]
- Aldiss, P.; Davies, G.; Woods, R.; Budge, H.; Sacks, H.S.; Symonds, M.E. ‘Browning’ the cardiac and peri-vascular adipose tissues to modulate cardiovascular risk. Int. J. Cardiol. 2017, 228, 265–274. [Google Scholar] [CrossRef]
- Knuuti, J.; Wijns, W.; Saraste, A.; Capodanno, D.; Barbato, E.; Funck-Brentano, C.; Prescott, E.; Storey, R.F.; Deaton, C.; Cuisset, T.; et al. ESC Scientific Document Group. 2019 ESC Guidelines for the diagnosis and management of chronic coronary syndromes. Eur. Heart J. 2020, 41, 407–477. [Google Scholar] [CrossRef] [PubMed]
- Agatston, A.S.; Janowitz, W.R.; Hildner, F.J.; Zusmer, N.R.; Viamonte, M.; Detrano, R. Quantification of coronary artery calcium using ultrafast computed tomography. J. Am. Coll. Cardiol. 1990, 15, 827–832. [Google Scholar] [CrossRef] [PubMed]
- Cury, R.C.; Abbara, S.; Achenbach, S.; Berman, D.; Bittencourt, M.; Budoff, M.; Chinnaiyan, K.; Choi, A.D.; Ghoshhajra, B.; Jacobs, J.; et al. CAD-RADSTM: Coronary Artery Disease—Reporting and Data System: An Expert Consensus Document of the Society of Cardiovascular Computed Tomography (SCCT), the American College of Radiology (ACR) and the North American Society for Cardiovascular Imaging (NASCI). Endorsed by the American College of Cardiology. J. Am. Coll. Radiol. 2016, 13, 1458–1466.e9. [Google Scholar]
- Maurovich-Horvat, P.; Schlett, C.L.; Alkadhi, H.; Nakano, M.; Otsuka, F.; Stolzmann, P.; Scheffel, H.; Ferencik, M.; Kriegel, M.F.; Seifarth, H.; et al. The napkin-ring sign indicates advanced atherosclerotic lesions in coronary CT angiography. JACC Cardiovasc. Imaging 2012, 5, 1243–1252. [Google Scholar] [CrossRef]
- Williams, B.; Mancia, G.; Spiering, W.; Agabiti Rosei, E.; Azizi, M.; Burnier, M.; Clement, D.L.; Coca, A.; De Simone, G.; Dominiczak, A.; et al. 2018 ESC/ESH Guidelines for the management of arterial hypertension. Eur. Heart J. 2018, 39, 3021–3104. [Google Scholar] [CrossRef]
- Societies, E.N.C.; Mach, F.; Baigent, C.; Taskinen, M.-R. 2019 ESC/EAS guidelines for the management of dyslipidaemias: Lipid modification to reduce cardiovascular risk. Atherosclerosis 2019, 290, 140–205. [Google Scholar] [CrossRef] [PubMed]
- Cosentino, F.; Grant, P.J.; Aboyans, V.; Bailey, C.J.; Ceriello, A.; Delgado, V.; Federici, M.; Filippatos, G.; Grobbee, D.E.; Hansen, T.B.; et al. 2019 ESC Guidelines on diabetes, pre-diabetes, and cardiovascular diseases developed in collaboration with the EASD. Eur. Heart J. 2020, 41, 255–323. [Google Scholar] [CrossRef]
- Page, D.L. Lipomatous hypertrophy of the cardiac interatrial septum. Hum. Pathol. 1970, 1, 151–163. [Google Scholar] [CrossRef] [PubMed]
- Hagan, K.; Mszar, R.; Cainzos-Achirica, M.; Blaha, M.J.; Shapiro, M.D.; Arias, L.; Saxena, A.; Cury, R.; Budoff, M.J.; Feldman, T.; et al. Low-density lipoprotein-cholesterol and subclinical coronary atherosclerosis in a middle-aged asymptomatic U.S. population: The Miami Heart Study at Baptist Health South Florida. Atherosclerosis 2024, 397, 118551. [Google Scholar] [CrossRef] [PubMed]
- Manubolu, V.S.; Verghese, D.; Lakshmanan, S.; Alalawi, L.; Kinninger, A.; Bitar, J.A.; Calicchio, F.; Ahmad, K.; Ghanem, A.; Javier, D.A.; et al. Coronary computed tomography angiography evaluation of plaque morphology and its relationship to HDL and total cholesterol to HDL ratio. J. Clin. Lipidol. 2022, 16, 715–724. [Google Scholar] [CrossRef] [PubMed]
- Banach, M.; Serban, C.; Sahebkar, A.; Mikhailidis, D.P.; Ursoniu, S.; Ray, K.K.; Rysz, J.; Toth, P.P.; Muntner, P.; Mosteoru, S.; et al. Lipid and Blood Pressure Meta-analysis Collaboration (LBPMC) Group. Impact of statin therapy on coronary plaque composition: A systematic review and meta-analysis of virtual histology intravascular ultrasound studies. BMC Med. 2015, 13, 229. [Google Scholar] [CrossRef] [PubMed] [PubMed Central]
- Lee, S.E.; Chang, H.J.; Sung, J.M.; Park, H.B.; Heo, R.; Rizvi, A.; Lin, F.Y.; Kumar, A.; Hadamitzky, M.; Kim, Y.J.; et al. Effects of Statins on Coronary Atherosclerotic Plaques: The PARADIGM Study. JACC Cardiovasc. Imaging 2018, 11, 1475–1484. [Google Scholar] [CrossRef]
- Park, H.B.; Arsanjani, R.; Sung, J.M.; Heo, R.; Lee, B.K.; Lin, F.Y.; Hadamitzky, M.; Kim, Y.J.; Conte, E.; Andreini, D.; et al. Impact of statins based on high-risk plaque features on coronary plaque progression in mild stenosis lesions: Results from the PARADIGM study. Eur. Heart J. Cardiovasc. Imaging 2023, 24, 1536–1543. [Google Scholar] [CrossRef]
- Puri, R.; Nicholls, S.J.; Shao, M.; Kataoka, Y.; Uno, K.; Kapadia, S.R.; Tuzcu, E.M.; Nissen, S.E. Impact of statins on serial coronary calcification during atheroma progression and regression. J. Am. Coll. Cardiol. 2015, 65, 1273–1282. [Google Scholar] [CrossRef] [PubMed]
- van Rosendael, A.R.; Narula, J.; Lin, F.Y.; van den Hoogen, I.J.; Gianni, U.; Al Hussein Alawamlh, O.; Dunham, P.C.; Peña, J.M.; Lee, S.E.; Andreini, D.; et al. Association of High-Density Calcified 1K Plaque With Risk of Acute Coronary Syndrome. JAMA Cardiol. 2020, 5, 282–290. [Google Scholar] [CrossRef] [PubMed] [PubMed Central]
- Yong, Y.; Giovannucci, J.; Pang, S.N.; Hong, W.; Han, D.; Berman, D.S.; Dey, D.; Nicholls, S.J.; Nerlekar, N.; Lin, A. Coronary Artery Calcium Density and Risk of Cardiovascular Events: A Systematic Review and Meta-Analysis. JACC Cardiovasc. Imaging 2024, 18, 249–304. [Google Scholar] [CrossRef] [PubMed]
- Stuijfzand, W.J.; van Rosendael, A.R.; Lin, F.Y.; Chang, H.J.; van den Hoogen, I.J.; Gianni, U.; Choi, J.H.; Doh, J.H.; Her, A.Y.; Koo, B.K.; et al. CREDENCE Investigators. Stress Myocardial Perfusion Imaging vs Coronary Computed Tomographic Angiography for Diagnosis of Invasive Vessel-Specific Coronary Physiology: Predictive Modeling Results From the Computed Tomographic Evaluation of Atherosclerotic Determinants of Myocardial Ischemia (CREDENCE) Trial. JAMA Cardiol. 2020, 5, 1338–1348. [Google Scholar] [CrossRef] [PubMed] [PubMed Central]
- Feuchtner, G.M.; Lacaita, P.G.; Bax, J.J.; Rodriguez, F.; Nakanishi, R.; Pontone, G.; Mushtaq, S.; Buechel, R.R.; Gräni, C.; Patel, A.R.; et al. AI-Quantitative CT Coronary Plaque Features Associate with a Higher Relative Risk in Women: CONFIRM2-Registry. Circ. Cardiovasc. Imaging 2025, 18, e018235. [Google Scholar] [CrossRef] [PubMed]
- Rovetto, C.; Niemann, T.; Almeida, G.; Aghapour Zangeneh, F.; Chikh Bakri, I.; Sartoretti, T.; Halfmann, M.C.; Emrich, T.; Euler, A. Assessment of inter- and intrareader agreement among different stenosis quantification methods in coronary CT angiography. Eur. J. Radiol. 2025, 186, 112059. [Google Scholar] [CrossRef] [PubMed]
- Bernardo, R.; Nurmohamed, N.S.; Bom, M.J.; Jukema, R.; de Winter, R.W.; Sprengers, R.; Stroes, E.S.G.; Min, J.K.; Earls, J.; Danad, I.; et al. Diagnostic accuracy in coronary CT angiography analysis: Artificial intelligence versus human assessment. Open Heart 2025, 12, e003115. [Google Scholar] [CrossRef] [PubMed] [PubMed Central]
- Kuester, L.B.; Fischman, A.J.; Fan, C.M.; Halpern, E.F.; Aquino, S.L. Lipomatous hypertrophy of the interatrial septum: Prevalence and features on fusion 18F fluorodeoxyglucose positron emission tomography/CT. Chest 2005, 128, 3888–3893. [Google Scholar] [CrossRef] [PubMed]

| LHIS N = 71 | Controls N = 71 | ||
|---|---|---|---|
| Age (yrs) | 61.1 ± 9.9 | 60.6 ± 11.4 | 0.754 |
| women | 5 (7%) | 4 (5.6%) | 0.999 |
| BMI kg/m2 | 28.9 ± 4.4 | 27.6 ± 4.8 | 0.096 |
| AFIB | 7 (9.8%) | 12 (16.9%) | 0.324 |
| COPD | 5 (7%) | 4 (5.6%) | 0.999 * |
| CVRF | |||
| Smoking | 34 (47.9%) | 35 (49.3%) | 0.999 |
| Arterial hypertension | 40 (56.3%) | 33 (46.5%) | 0.316 |
| Positive Family History | 26 (36.6%) | 29 (40.8%) | 0.730 |
| Dyslipidemia | 41 (57.7%) | 38 (53.5%) | 0.612 |
| Diabetes | 19 (26.7%) | 16 (22.5%) | 0.559 |
| CTA results | |||
| HRP | 15 (21.1%) | 29 (40.8%) | 0.011 |
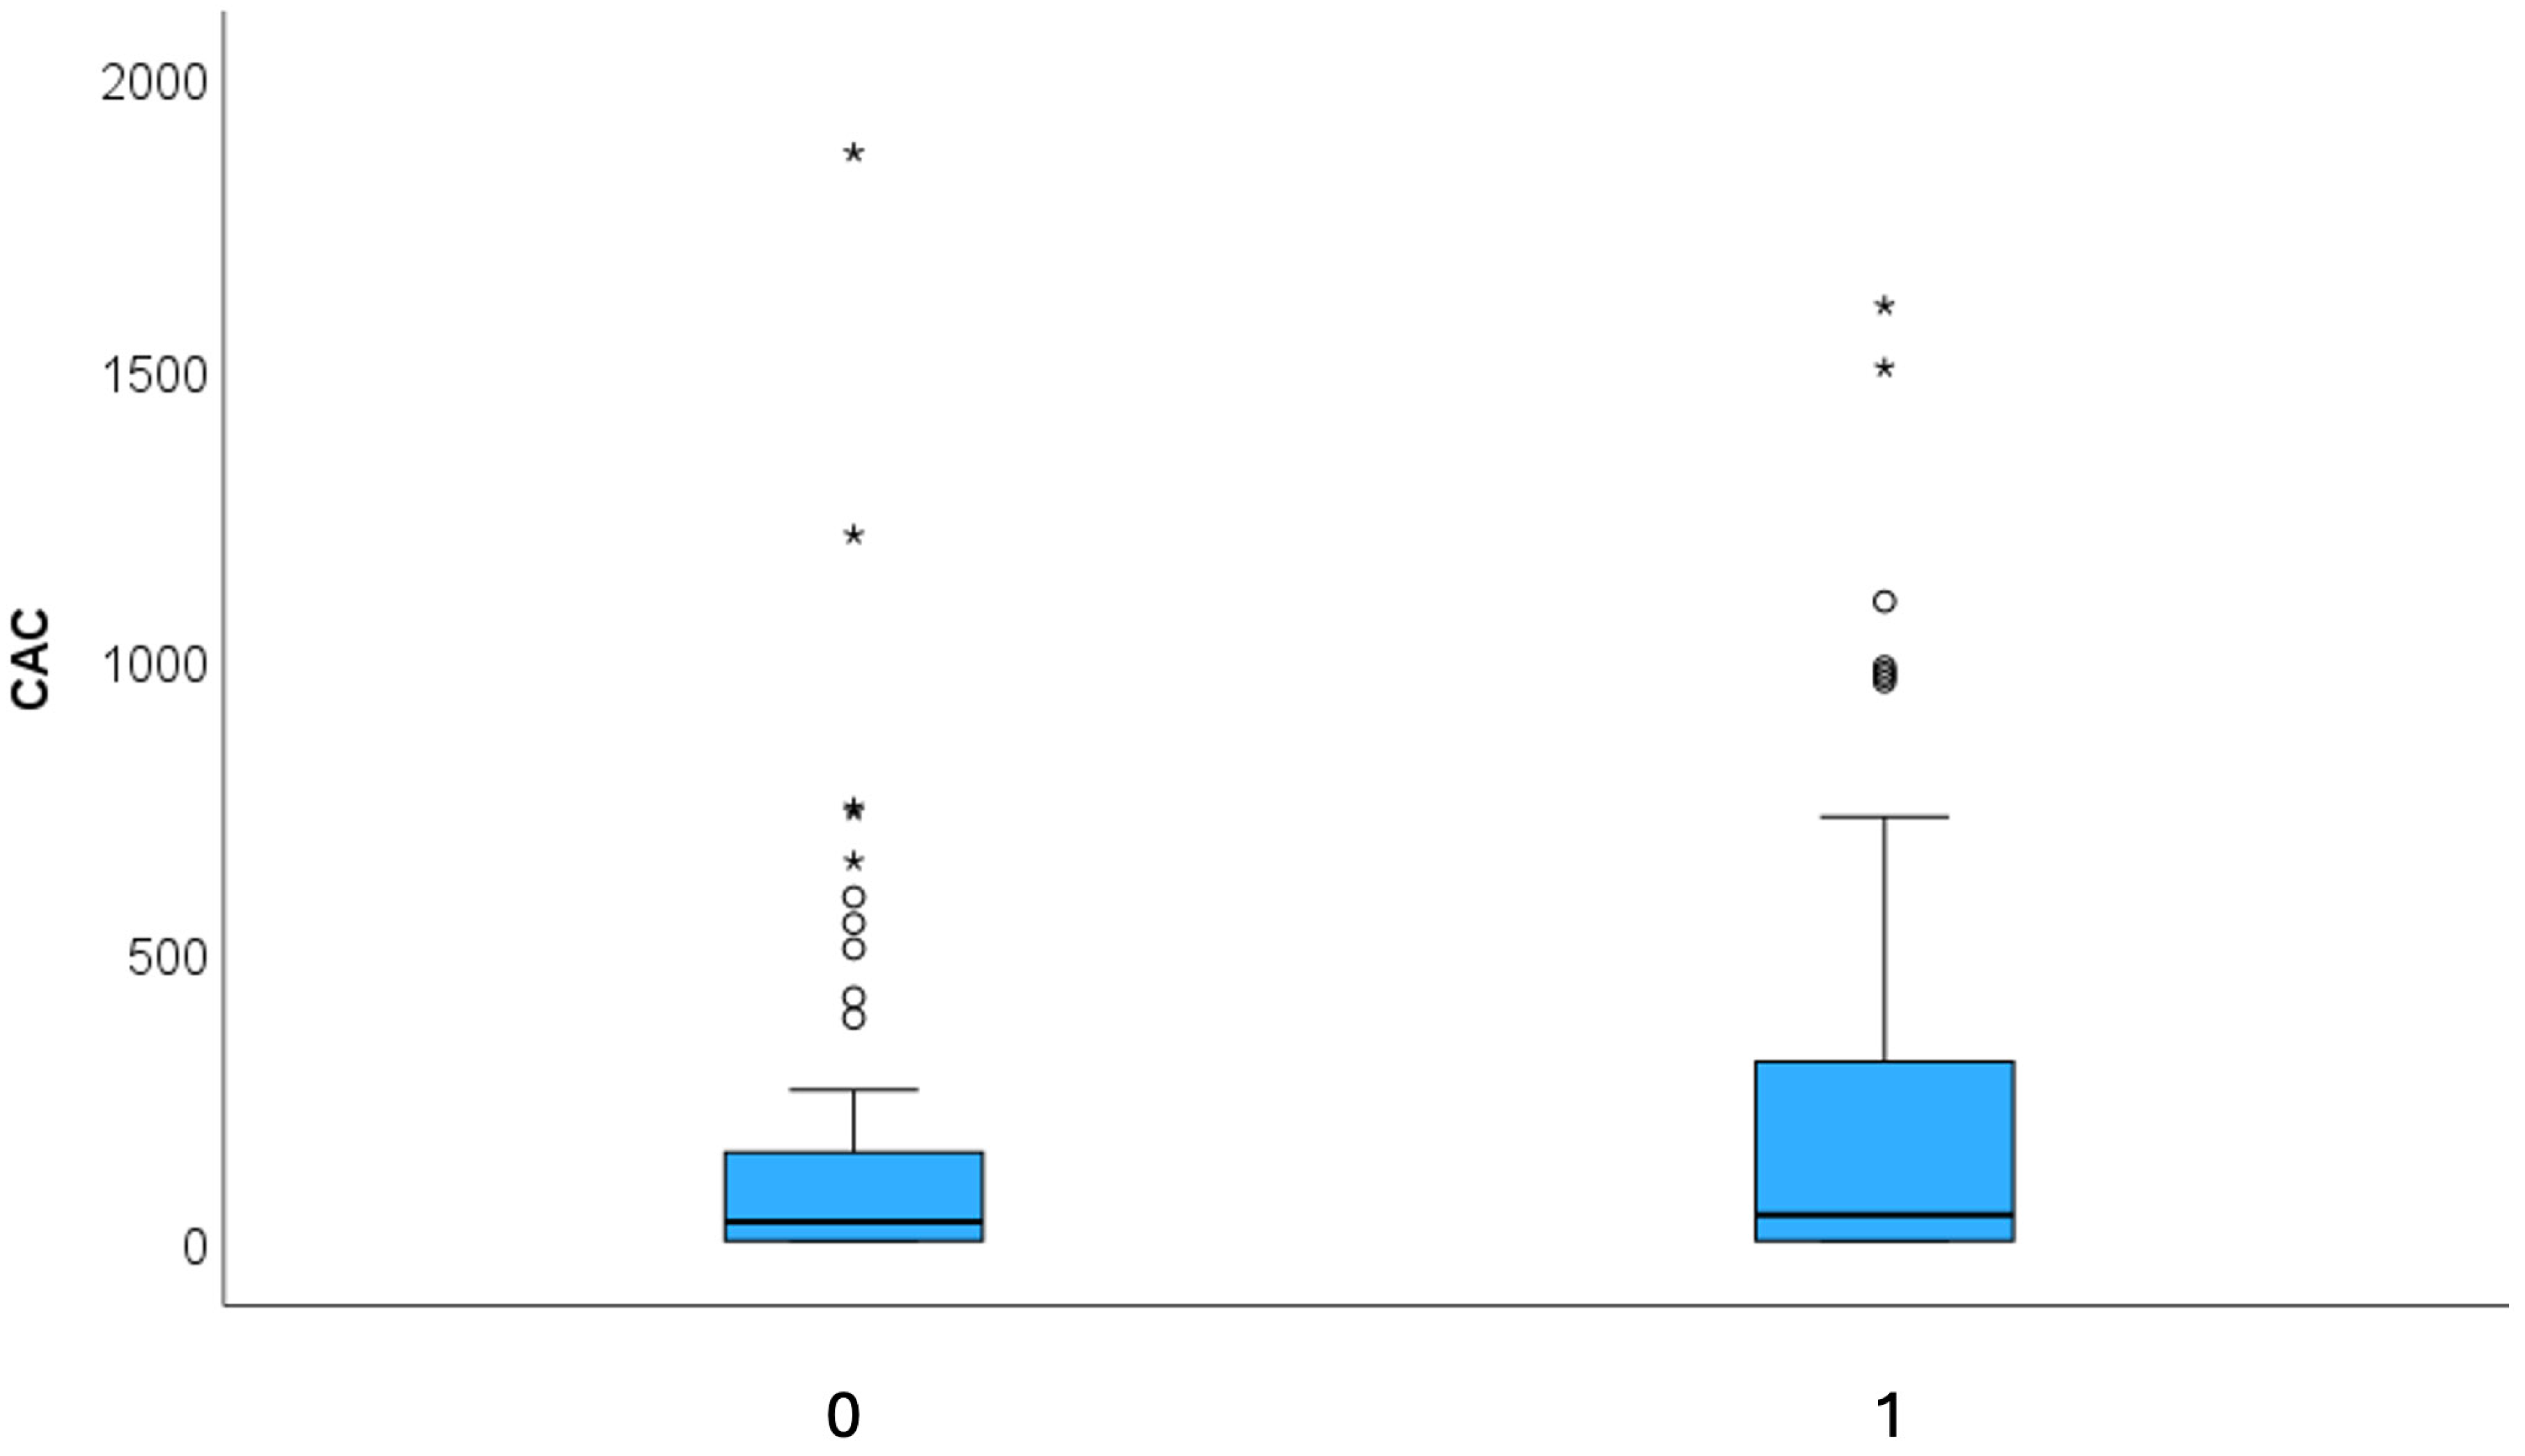
| CAC (AU) | Mean 291.86 ± 565 Median 32.8 (IQR 152.5) | Mean 186.1 ± 408 Median 44.9 (IQR 316.3) | 0.827 |
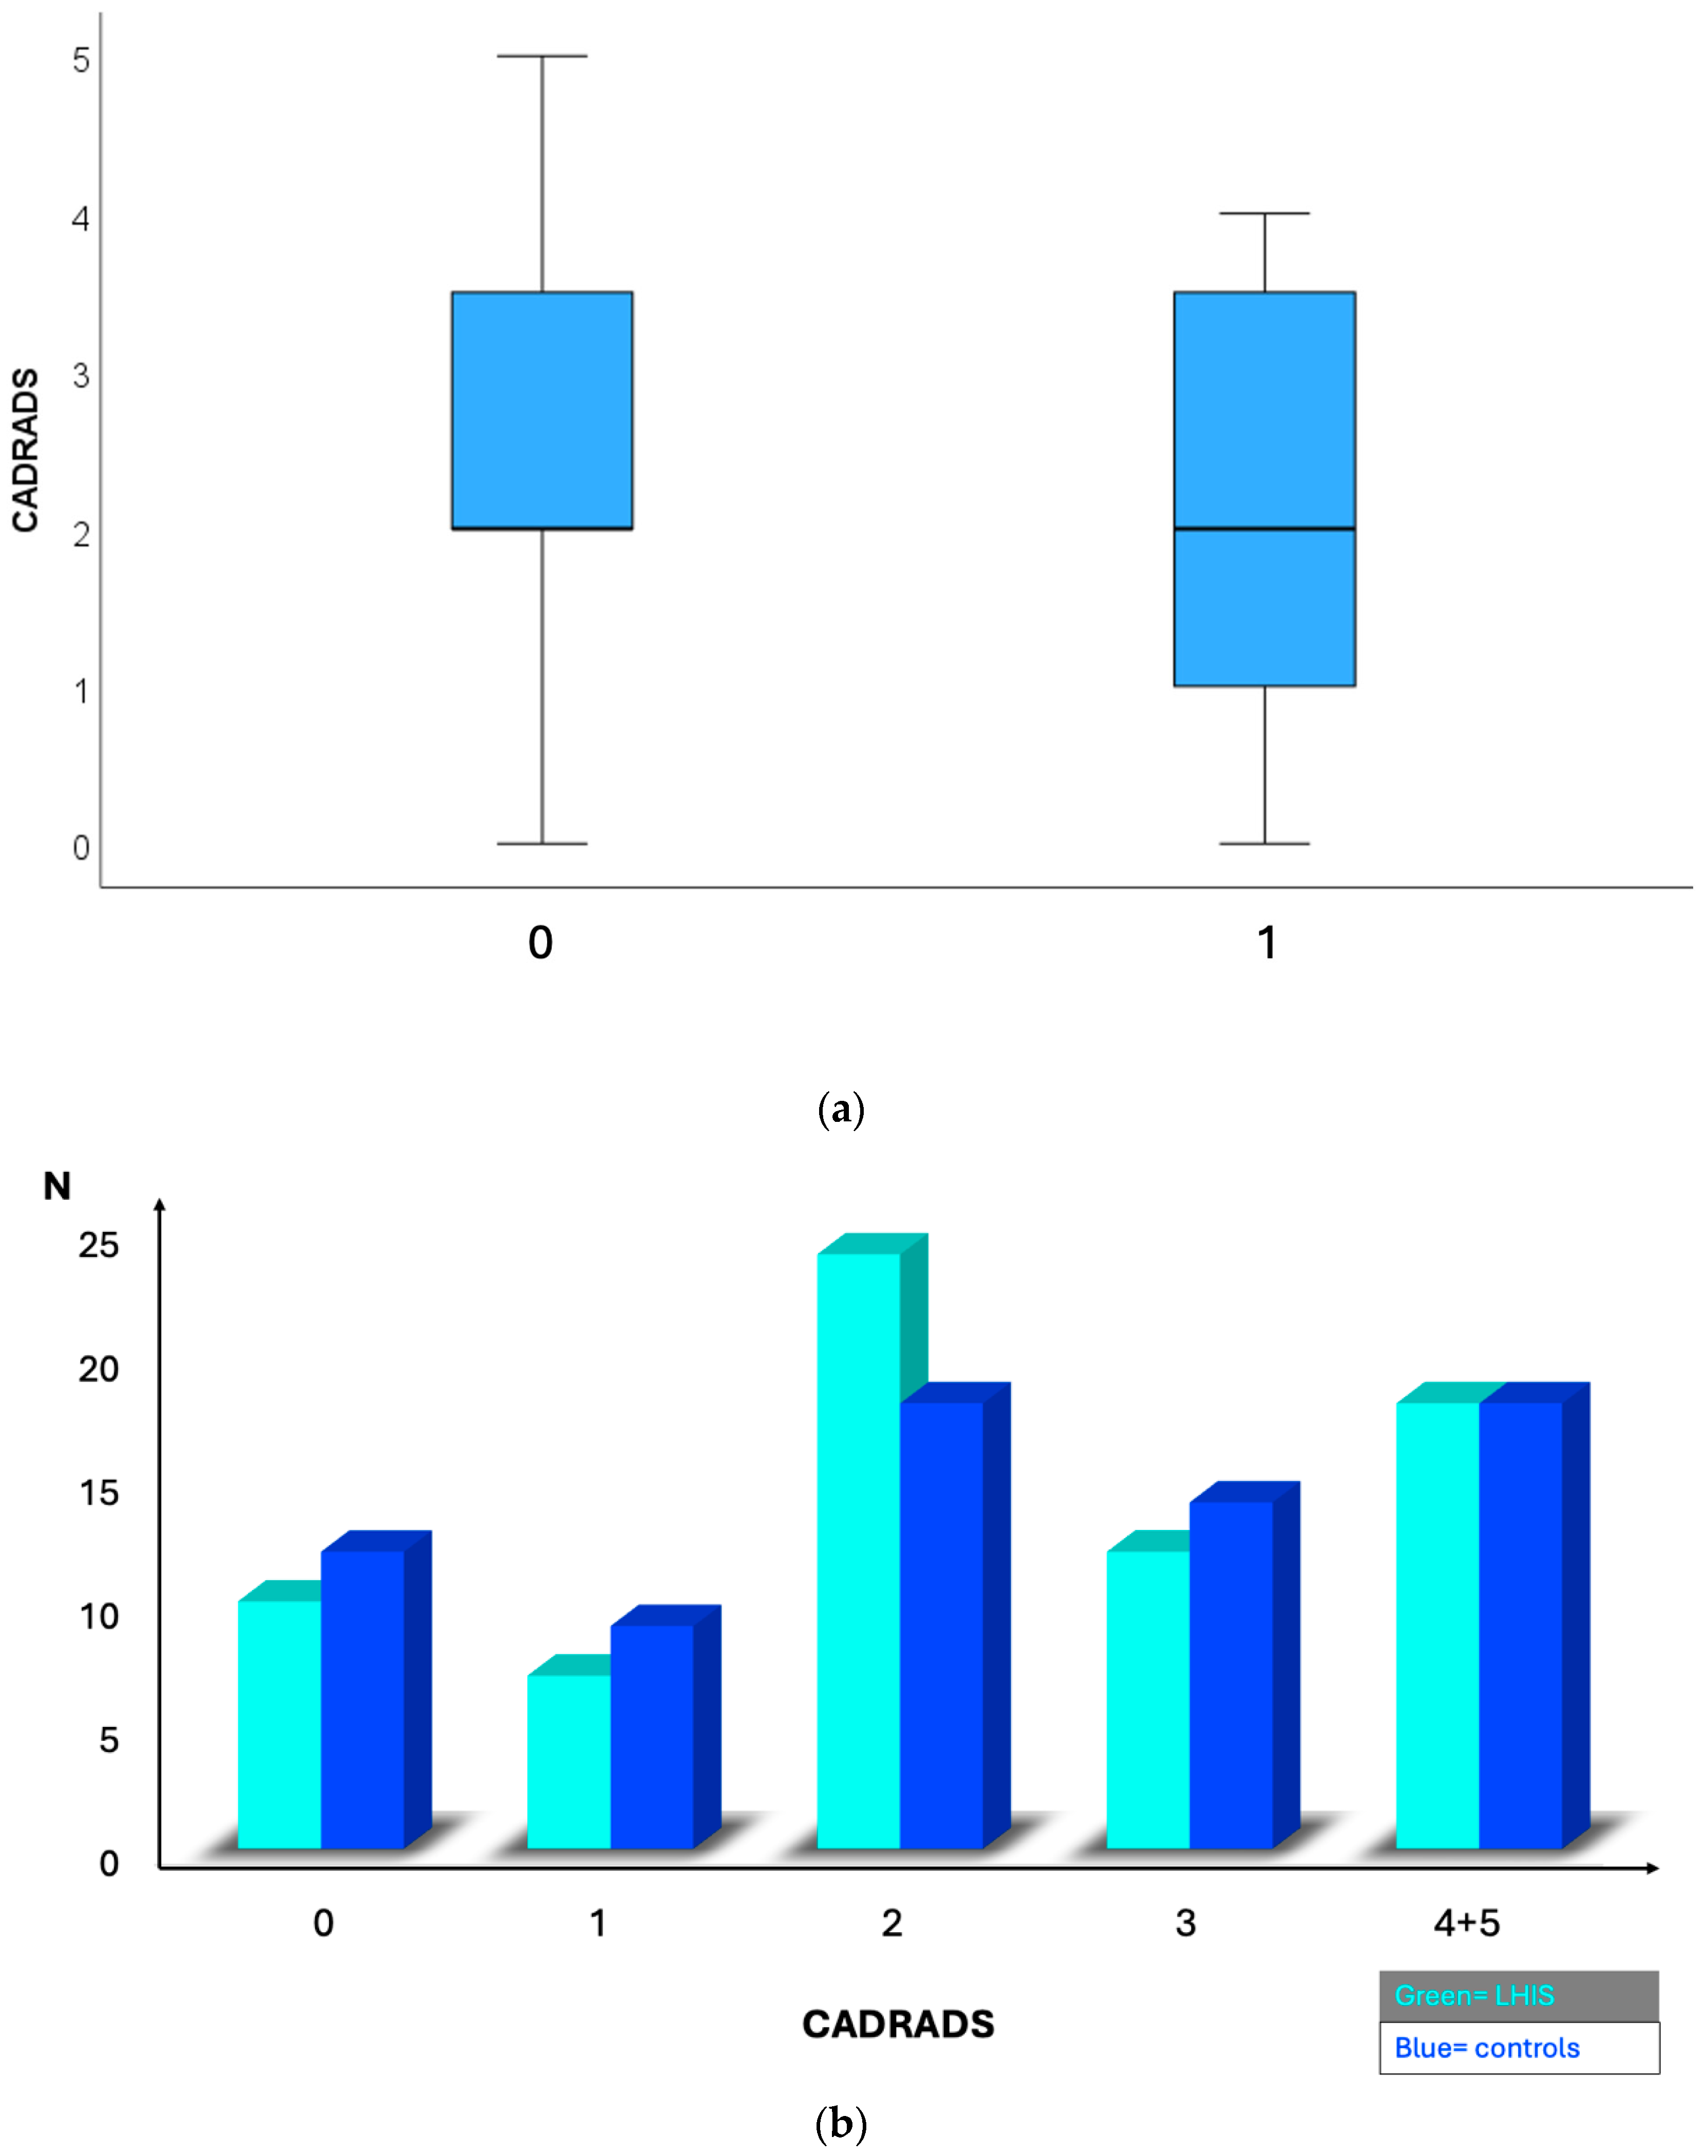
| CADRADS | Mean 2.23 ± 0.17 | Mean 2.30 ± 0.16 | 0.329 |
| Median 2 (IQR 3) | Median 2 (IQR 2) | ||
| 0 | 10 (14.1%) | 12 (16.9%) | |
| 1 | 7 (9.9%) | 9 (12.7%) | |
| 2 | 24 (33.8%) | 18 (25.4%) | |
| 3 | 12 (16.9%) | 14 (19.7%) | |
| 4 | 17 (23.9%) | 18 (25.45) | 0.358 |
| 5 | 1 (1.4%) | 0 (0%) | |
| Obstructive disease rate (>50% stenosis) | 30 (42.3%) | 32 (45.1%) | 0.866 |
| Medication | |||
| Statins | 35 (49.3%) | 26 (36.6%) | 0.136 |
| Lipid panels | |||
| Cholesterol (mg/dL) | 190.15 ± 43.4 | 191.7 ± 49.02 | 0.868 |
| c-LDL (mg/dL) | 123.8 ± 41.6 | 117.2 ± 44.5 | 0.479 |
| HDL (mg/dL) | 52.1 ± 14.9 | 53.8 ± 17.9 | 0.611 |
| TG (mg/dL) | 130.7 ± 10.9 | 158.6 ± 18.6 | 0.309 |
| LHIS N = 71 | Controls N = 71 | ||
|---|---|---|---|
| ICA N (%) | 24 (33.8%) | 38 (53.5%) | 0.027 |
| ICA > 50% | 19 (26.7%) | 17 (23.9%) | 0.847 |
| Revascularization rate | 17 (23.9%) | 11 (15.5%) | 0.293 |
| N = 13 PCI | N = 11 PCI | ||
| N = 4 CABG | N = 0 CABG | ||
| Death | 1 MCI (CV death) | 1 (* non-cardiac) | 0.999 |
| ACS (STEMI or NSTEMI) | 1 (NSTEMI) | 1 (STEMI) | 0.999 |
Disclaimer/Publisher’s Note: The statements, opinions and data contained in all publications are solely those of the individual author(s) and contributor(s) and not of MDPI and/or the editor(s). MDPI and/or the editor(s) disclaim responsibility for any injury to people or property resulting from any ideas, methods, instructions or products referred to in the content. |
© 2025 by the authors. Licensee MDPI, Basel, Switzerland. This article is an open access article distributed under the terms and conditions of the Creative Commons Attribution (CC BY) license (https://creativecommons.org/licenses/by/4.0/).
Share and Cite
Lacaita, P.G.; Bilgeri, V.; Barbieri, F.; Scharll, Y.; Dichtl, W.; Widmann, G.; Feuchtner, G.M. Lipomatous Hypertrophy of the Interatrial Septum (LHIS) a Biomarker for Cardiovascular Protection? A Hypothesis Generating Case–Control Study. J. Cardiovasc. Dev. Dis. 2025, 12, 301. https://doi.org/10.3390/jcdd12080301
Lacaita PG, Bilgeri V, Barbieri F, Scharll Y, Dichtl W, Widmann G, Feuchtner GM. Lipomatous Hypertrophy of the Interatrial Septum (LHIS) a Biomarker for Cardiovascular Protection? A Hypothesis Generating Case–Control Study. Journal of Cardiovascular Development and Disease. 2025; 12(8):301. https://doi.org/10.3390/jcdd12080301
Chicago/Turabian StyleLacaita, Pietro G., Valentin Bilgeri, Fabian Barbieri, Yannick Scharll, Wolfgang Dichtl, Gerlig Widmann, and Gudrun M. Feuchtner. 2025. "Lipomatous Hypertrophy of the Interatrial Septum (LHIS) a Biomarker for Cardiovascular Protection? A Hypothesis Generating Case–Control Study" Journal of Cardiovascular Development and Disease 12, no. 8: 301. https://doi.org/10.3390/jcdd12080301
APA StyleLacaita, P. G., Bilgeri, V., Barbieri, F., Scharll, Y., Dichtl, W., Widmann, G., & Feuchtner, G. M. (2025). Lipomatous Hypertrophy of the Interatrial Septum (LHIS) a Biomarker for Cardiovascular Protection? A Hypothesis Generating Case–Control Study. Journal of Cardiovascular Development and Disease, 12(8), 301. https://doi.org/10.3390/jcdd12080301