Thirty-Day and One-Year All-Cause Mortality of ST-Segment Elevation Myocardial Infarction in Johannesburg, South Africa: Insights from the STEMI HOC-1 Prospective Study


Abstract

1. Introduction
2. Materials and Methods
2.1. Study Design
2.2. Setting
2.3. Study Definitions
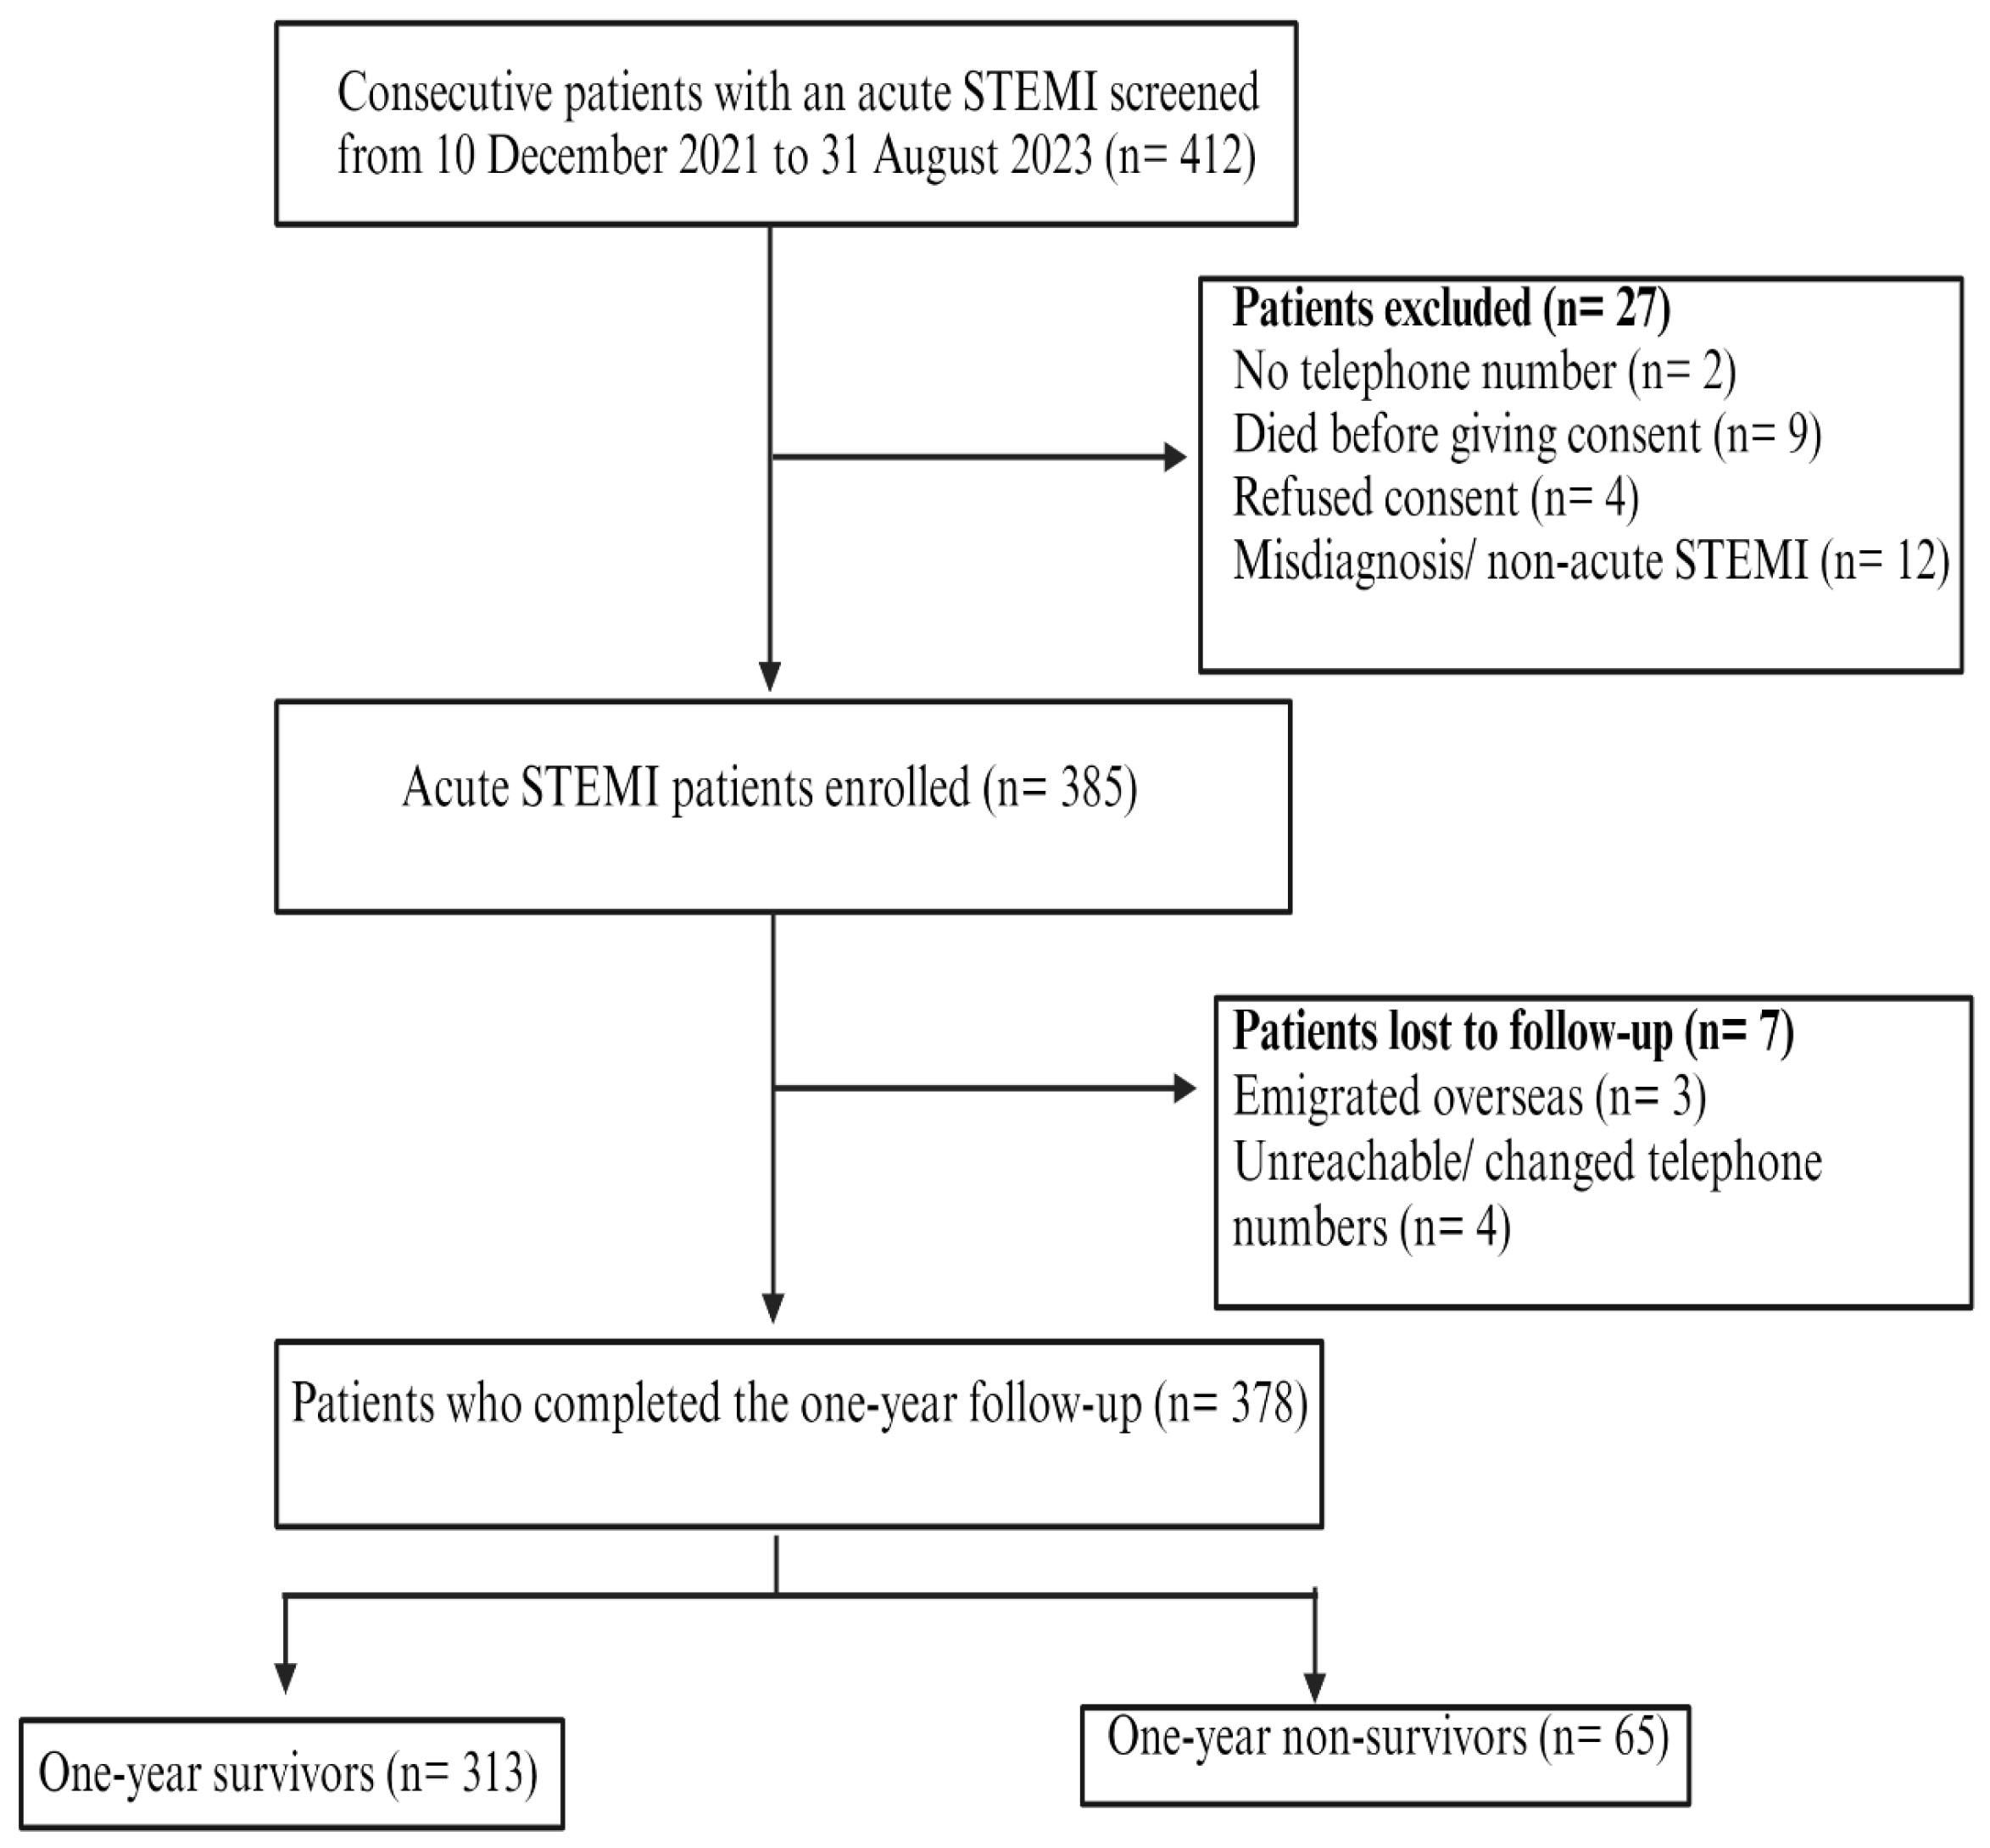
2.4. Study Participants
2.5. Data Sources
2.6. Study Sample Size Calculations
2.7. Statistical Analyses
2.8. Ethical Approval and Consent to Participate
3. Results
3.1. Demographics and Risk Factor Profile
3.2. Clinical Presentation, Time to ECG Diagnosis, and Diagnostic Clinical Investigations
3.3. Coronary Reperfusion, Angiographic Findings, and Time Delays to Reperfusion
3.4. In-Hospital Clinical Outcomes and Length of Stay
3.5. Mortality Outcomes of the Different Reperfusion Strategies
3.6. Thirty-Day Clinical Outcomes
3.7. One-Year Clinical Outcomes
3.8. Adherence to Guideline-Directed Medical Therapy (GDMT) at 30 Days and One-Year Follow-Up
3.9. Baseline Predictors of 30-Day Mortality
3.10. Baseline Predictors of One-Year Mortality
4. Discussion
4.1. Mortality Outcomes
4.2. Demographics
4.3. Risk Factor Profile and Comorbidities
4.4. Serum Cardiac Biomarkers of STEMI
4.5. Time Delays and Coronary Reperfusion Strategies Outcomes
4.6. Baseline Clinical Predictors of 30-Day and One-Year All-Cause Mortality
4.7. Limitations
5. Conclusions
Author Contributions
Funding
Institutional Review Board Statement
Informed Consent Statement
Data Availability Statement
Acknowledgments
Conflicts of Interest
Abbreviations
| ASCVD | atherosclerotic cardiovascular disease |
| CV | cardiovascular |
| DCA | diagnostic coronary angiography |
| ECG | electrocardiogram |
| IHD | ischaemic heart disease |
| HIC | high-income countries |
| LMIC | low-or middle-income countries |
| PCI | percutaneous coronary intervention |
| SA | South Africa |
| sSA | sub-Saharan Africa |
| STEMI | ST-elevation myocardial infarction |
| SUA | serum uric acid |
References
- World Health Organization. The Top 10 Causes of Death: WHO. 2020. Available online: https://www.who.int/news-room/fact-sheets/detail/the-top-10-causes-of-death (accessed on 24 November 2024).
- Toshima, T.; Hirayama, A.; Watanabe, T.; Goto, J.; Kobayashi, Y.; Otaki, Y.; Wanezaki, M.; Nishiyama, S.; Kutsuzawa, D.; Kato, S.; et al. Unmet needs for emergency care and prevention of prehospital death in acute myocardial infarction. J. Cardiol. 2021, 77, 605–612. [Google Scholar] [CrossRef]
- Byrne, R.A.; Rossello, X.; Coughlan, J.J.; Barbato, E.; Berry, C.; Chieffo, A.; Claeys, M.J.; Dan, G.-A.; Dweck, M.R.; Galbraith, M.; et al. 2023 ESC Guidelines for the management of acute coronary syndromes. Eur. Heart J. 2023, 44, 3720–3826. [Google Scholar] [CrossRef] [PubMed]
- Fazel, R.; Joseph, T.I.; Sankardas, M.A.; Pinto, D.S.; Yeh, R.W.; Kumbhani, D.J.; Nallamothu, B.K. Comparison of Reperfusion Strategies for ST-Segment–Elevation Myocardial Infarction: A Multivariate Network Meta-analysis. J. Am. Heart Assoc. 2020, 9, e015186. [Google Scholar] [CrossRef] [PubMed]
- Armstrong, P.W.; Gershlick, A.; Goldstein, P.; Wilcox, R.; Danays, T.; Bluhmki, E.; Van de Werf, F. The Strategic Reperfusion Early After Myocardial Infarction (STREAM) study. Am. Heart J. 2010, 160, 30–35.e1. [Google Scholar] [CrossRef] [PubMed]
- Ndaba, L.; Mutyaba, A.; Mpanya, D.; Tsabedze, N. In-Hospital Mortality Outcomes of ST-Segment Elevation Myocardial Infarction: A Cross-Sectional Study from a Tertiary Academic Hospital in Johannesburg, South Africa. J. Cardiovasc. Dev. Dis. 2023, 10, 348. [Google Scholar] [CrossRef]
- Tickley, I.; Van Blydenstein, S.A.; Meel, R. Time to thrombolysis and factors contributing to delays in patients presenting with ST-elevation myocardial infarction at Chris Hani Baragwanath Academic Hospital, Johannesburg, South Africa. SAMJ S. Afr. Med. J. 2023, 113, 53–58. [Google Scholar] [CrossRef]
- Mayosi, B.M.; Flisher, A.J.; Lalloo, U.G.; Sitas, F.; Tollman, S.M.; Bradshaw, D. The burden of non-communicable diseases in South Africa. Lancet 2009, 374, 934–947. [Google Scholar] [CrossRef]
- Sliwa, K.; Wilkinson, D.; Hansen, C.; Ntyintyane, L.; Tibazarwa, K.; Becker, A.; Stewart, S. Spectrum of heart disease and risk factors in a black urban population in South Africa (the Heart of Soweto Study): A cohort study. Lancet 2008, 371, 915–922. [Google Scholar] [CrossRef]
- Mandelzweig, L.; Battler, A.; Boyko, V.; Bueno, H.; Danchin, N.; Filippatos, G.; Gitt, A.; Hasdai, D.; Hasin, Y.; Marrugat, J.; et al. The second Euro Heart Survey on acute coronary syndromes: Characteristics, treatment, and outcome of patients with ACS in Europe and the Mediterranean Basin in 2004. Eur. Heart J. 2006, 27, 2285–2293. [Google Scholar] [CrossRef]
- Fanta, K.; Daba, F.B.; Asefa, E.T.; Melaku, T.; Chelkeba, L.; Fekadu, G.; Gudina, E.K. Management and 30-Day Mortality of Acute Coronary Syndrome in a Resource-Limited Setting: Insight From Ethiopia. A Prospective Cohort Study. Front. Cardiovasc. Med. 2021, 8, 707700. [Google Scholar] [CrossRef]
- Desta, D.M.; Nedi, T.; Hailu, A.; Atey, T.M.; Tsadik, A.G.; Asgedom, S.W.; Kasahun, G.G.; Ayalew, E. Treatment outcome of acute coronary syndrome patients admitted to Ayder Comprehensive Specialized Hospital, Mekelle, Ethiopia; A retrospective cross-sectional study. PLoS ONE 2020, 15, e0228953. [Google Scholar] [CrossRef]
- Wang, H.; Yang, J.; Sao, J.; Zhang, J.; Pang, X. The prediction of cardiac events in patients with acute ST segment elevation myocardial infarction: A meta–analysis of serum uric acid. Open Life Sci. 2018, 13, 413–421. [Google Scholar] [CrossRef]
- Demiray, A.; Afsar, B.; Covic, A.; Kuwabara, M.; Ferro, C.J.; Lanaspa, M.A.; Johnson, R.J.; Kanbay, M. The Role of Uric Acid in the Acute Myocardial Infarction: A Narrative Review. Angiology 2022, 73, 9–17. [Google Scholar] [CrossRef] [PubMed]
- Kroll, K.; Bukowski, T.R.; Schwartz, L.M.; Knoepfler, D.; Bassingthwaighte, J.B. Capillary endothelial transport of uric acid in guinea pig heart. Am. J. Physiol.-Heart Circ. Physiol. 1992, 262, H420–H431. [Google Scholar] [CrossRef] [PubMed]
- Trkulja, V.; Car, S. On-admission serum uric acid predicts outcomes after acute myocardial infarction: Systematic review and meta-analysis of prognostic studies. Croat. Med. J. 2012, 53, 162–172. [Google Scholar] [CrossRef]
- Mandurino-Mirizzi, A.; Cornara, S.; Somaschini, A.; Demarchi, A.; Galazzi, M.; Puccio, S.; Montalto, C.; Crimi, G.; Ferlini, M.; Camporotondo, R.; et al. Elevated serum uric acid is associated with a greater inflammatory response and with short- and long-term mortality in patients with ST-segment elevation myocardial infarction undergoing primary percutaneous coronary intervention. Nutr. Metab. Cardiovasc. Dis. 2021, 31, 608–614. [Google Scholar] [CrossRef]
- Rong, J.; Fang, C.; Chen, X.; Hong, C.; Huang, L. Association of serum uric acid with prognosis in patients with myocardial infarction: An update systematic review and meta-analysis. BMC Cardiovasc. Disord 2023, 23, 512. [Google Scholar] [CrossRef]
- Badianyama, M.; Mutyaba, A.; Nel, S.; Tsabedze, N. ST-segment elevation myocardial infarction heart of Charlotte one-year (STEMI HOC-1) study: A prospective study protocol. BMC Cardiovasc. Disord. 2023, 23, 396. [Google Scholar] [CrossRef]
- Schamroth, C. Management of acute coronary syndrome in South Africa: Insights from the ACCESS (Acute Coronary Events—A Multinational Survey of Current Management Strategies) registry. Cardiovasc. J. Afr. 2012, 23, 365–370. [Google Scholar] [CrossRef]
- Cilliers, J.C.D.; Joubert, L.; Beyers, B.; Ngarande, E.; Herbst, P.; Doubell, A.; Pecoraro, A. The incidence and outcomes of high-risk acute coronary syndromes in Western Cape Province, South Africa: A prospective cohort study. S. Afr. Med. J. 2023, 113, 25–29. [Google Scholar]
- Joubert, L.H.; Herbst, P.G.; Doubell, A.F.; Pecoraro, A.J.K. Clinical v. laboratory-based screening for COVID-19 in asymptomatic patients requiring acute cardiac care. S. Afr. Med. J. 2020, 110, 13088. [Google Scholar] [CrossRef]
- Hertz, J.T.; Sakita, F.M.; Kweka, G.L.; Limkakeng, A.T.; Galson, S.W.; Ye, J.J.; Tarimo, T.G.; Temu, G.; Thielman, N.M.; Bettger, J.P.; et al. Acute myocardial infarction under-diagnosis and mortality in a Tanzanian emergency department: A prospective observational study. Am. Heart J. 2020, 226, 214–221. [Google Scholar] [CrossRef]
- Paul, G.J.; Sankaran, S.; Saminathan, K.; Iliyas, M.; Sethupathy, S.; Saravanan, S.; Prabhu, S.S.; Kurian, S.; Srinivas, S.; Anurag, P.; et al. Outcomes of ST Segment Elevation Myocardial Infarction without Standard Modifiable Cardiovascular Risk Factors—Newer Insights from a Prospective Registry in India. Glob. Heart 2023, 18, 13. [Google Scholar] [CrossRef] [PubMed]
- El Khoudary, S.R.; Aggarwal, B.; Beckie, T.M.; Hodis, H.N.; Johnson, A.E.; Langer, R.D.; Limacher, M.C.; Manson, J.E.; Stefanick, M.L.; Allison, M.A. Menopause Transition and Cardiovascular Disease Risk: Implications for Timing of Early Prevention: A Scientific Statement From the American Heart Association. Circulation 2020, 142, e506–e532. [Google Scholar] [CrossRef] [PubMed]
- Steyn, K.; Sliwa, K.; Hawken, S.; Commerford, P.; Onen, C.; Damasceno, A.; Ounpuu, S.; Yusuf, S. Risk factors associated with myocardial infarction in Africa: The INTERHEART Africa study. Circulation 2005, 112, 3554–3561. [Google Scholar] [CrossRef] [PubMed]
- N’Guetta, R.; Yao, H.; Ekou, A.; N’Cho-Mottoh, M.P.; Angoran, I.; Tano, M.; Konin, C.; Coulibaly, I.; Anzouan-Kacou, J.B.; Seka, R.; et al. Prevalence and characteristics of acute coronary syndromes in a sub-Saharan Africa population. Ann. Cardiol. D’angeiologie 2016, 65, 59–63. [Google Scholar] [CrossRef]
- Bahrami, H.; Budoff, M.; Haberlen, S.A.; Rezaeian, P.; Ketlogetswe, K.; Tracy, R.; Palella, F.; Witt, M.D.; McConnell, M.V.; Kingsley, L.; et al. Inflammatory Markers Associated With Subclinical Coronary Artery Disease: The Multicenter AIDS Cohort Study. J. Am. Heart Assoc. 2016, 5, e003371. [Google Scholar] [CrossRef]
- Hyle, E.P.; Mayosi, B.M.; Middelkoop, K.; Mosepele, M.; Martey, E.B.; Walensky, R.P.; Bekker, L.-G.; Triant, V.A. The association between HIV and atherosclerotic cardiovascular disease in sub-Saharan Africa: A systematic review. BMC Public Health 2017, 17, 954. [Google Scholar] [CrossRef]
- Johnson, R.J.; Sanchez Lozada, L.G.; Lanaspa, M.A.; Piani, F.; Borghi, C. Uric Acid and Chronic Kidney Disease: Still More to Do. Kidney Int. Rep. 2023, 8, 229–239. [Google Scholar] [CrossRef]
- Uys, F.; Beeton, A.T.; van der Walt, S.; Lamprecht, M.; Verryn, M.; Vallie, Y.; Stokes, D.; Millar, R.S.; Viljoen, C.A. Profile and management of acute coronary syndromes at primary- and secondary-level healthcare facilities in Cape Town. Cardiovasc. J. Afr. 2022, 33, 138–144. [Google Scholar] [CrossRef]
- Mabuza, L.H.; Mntla, P.S. Generalist practitioners’ self-rating and competence in electrocardiogram interpretation in South Africa. Afr. J. Prim. Health Care Amp Fam. Med. 2020, 12, 1–7. [Google Scholar] [CrossRef]
- Meel, R.; Gonçalves, R. Time to fibrinolytics for acute myocardial infarction: Reasons for delays at Steve Biko Academic Hospital, Pretoria, South Africa. S. Afr. Med. Journal. 2015, 106, 92. [Google Scholar] [CrossRef] [PubMed]
- Stassen, W.; Wallis, L.; Vincent-Lambert, C.; Castren, M.; Kurland, L. The proportion of South Africans living within 60 and 120 minutes of a percutaneous coronary intervention facility. Cardiovasc. J. Afr. 2018, 29, 6–11. [Google Scholar] [CrossRef] [PubMed]
- Belle, L.; Cayla, G.; Cottin, Y.; Coste, P.; Khalife, K.; Labèque, J.N.; Farah, B.; Perret, T.; Goldstein, P.; Gueugniaud, P.Y.; et al. French Registry on Acute ST-elevation and non-ST-elevation Myocardial Infarction 2015 (FAST-MI 2015). Design and baseline data. Arch. Cardiovasc. Dis. 2017, 110, 366–378. [Google Scholar] [CrossRef]
- Hochman, J.S.; Lamas, G.A.; Buller, C.E.; Dzavik, V.; Reynolds, H.R.; Abramsky, S.J.; Forman, S.; Ruzyllo, W.; Maggioni, A.P.; White, H.; et al. Coronary Intervention for Persistent Occlusion after Myocardial Infarction. N. Engl. J. Med. 2006, 355, 2395–2407. [Google Scholar] [CrossRef]
- Ekou, A.; Kipenge, R.; Yao, H.; Ehouman, E.; Touré, C.; Vy, L.; N’Guetta, R. Thirty-day and one-year outcomes and predictors of mortality following acute myocardial infarction in Côte d’Ivoire: Data from the REACTIV survey. Arch. Cardiovasc. Dis. 2024, 117 (Suppl. S1), S21–S22. [Google Scholar] [CrossRef]

| 30-Day Follow-Up | 1-Year Follow-Up | ||||||
|---|---|---|---|---|---|---|---|
| Variables | Total N = 378 (%) | Alive N = 340 (89.9) | Dead N = 38 (10.1) | p-Value | Alive N = 313 (82.8) | Dead N = 65 (17.2) | p-Value |
| Demographics | |||||||
| Male sex | 293 (77.5) | 267 (78.5) | 26 (68.4) | 0.157 | 246 (78.6) | 47 (72.3) | 0.269 |
| Age, years ± SD | 56.2 ± 12.3 | 55.4 ± 12.3 | 63.4 ± 9.4 | <0.001 * | 54.9 ± 12.1 | 62.3 ± 11.4 | <0.001 * |
| Self-identified race | |||||||
| Caucasian | 163 (43.1) | 139 (40.9) | 24 (63.2) | 0.071 | 130 (41.5) | 33 (50.8) | 0.581 |
| Black | 119 (31.5) | 112 (32.9) | 7 (18.4) | 102 (32.6) | 17 (26.2) | ||
| Indian | 82 (21.7) | 76 (22.3) | 6 (15.8) | 69 (22.0) | 13 (20.0) | ||
| Mixed | 14 (3.7) | 13 (3.8) | 1 (2.63) | 12 (3.1) | 12 (3.8) | ||
| BMI, kg/m2 (IQR) | 27 (25.1–30.1) | 27 (25.1–30.2) | 26.5 (24.2–30.1) | 0.354 | 27.2 (25.2–30.4) | 26.3 (24.6–27.8) | 0.042 * |
| Abdominal circumference, cm (IQR) | 88 (79–105) | 88 (79–105) | 86 (79–108) | 0.862 | 88.5 (79.5–105) | 86 (78–97.5) | 0.207 |
| Risk factors | |||||||
| Hypertension | 231 (61.1) | 205 (60.3) | 26 (68.4) | 0.330 | 186 (59.4) | 45 (69.2) | 0.140 |
| Diabetes mellitus | 135 (35.7) | 120 (35.3)) | 15 (39.5) | 0.610 | 111 (35.5) | 24 (36.9) | 0.823 |
| Active cigarette smoking | 209 (55.3) | 189 (55.6) | 20 (52.6) | 0.728 | 175 (55.9) | 34 (52.3) | 0.595 |
| Cigarette smoking pack years (IQR) | 20 (13–30) | 20 (12.5–30) | 32.5 (17.5–41) | 0.016 * | 20 (12.5–30) | 25 (15–40) | 0.155 |
| Dyslipidaemia | 206 (54.5) | 187 (55.0) | 19 (50.0) | 0.557 | 177 (56.6) | 29 (44.6) | 0.079 |
| Obesity (BMI ≥ 30.0) | 97 (25.7) | 90 (26.5) | 7 (18.4) | 0.281 | 86 (27.5) | 11 (16.9) | 0.076 |
| CKD | 16 (4.2) | 12 (3.5) | 4 (10.5) | 0.042 * | 10 (3.2) | 6 (9.2) | 0.028 * |
| PVD | 10 (2.7) | 7 (2.1) | 3 (7.9) | 0.034 * | 7 (2.2) | 3 (4.6) | 0.277 |
| Family history of MI | 119 (31.5) | 110 (32.3) | 9 (23.7) | 0.275 | 104 (33.2) | 15 (23.1) | 0.109 |
| Menopause and post-menopause (if female sex) | 46 (12.2) | 36 (10.6) | 10 (26.3) | 0.005 * | 34 (10.9) | 12 (18.5) | 0.088 |
| Previous MI | 56 (14.8) | 48 (14.1) | 8 (21.0) | 0.254 | 43 (13.7) | 13 (20.0) | 0.196 |
| Previous stroke/TIA | 11 (2.9) | 10 (2.9) | 1 (2.6) | 0.914 | 7 (2.2) | 4 (6.2) | 0.087 |
| HIV infection | 33 (8.7) | 31 (9.1) | 2 (5.3) | 0.425 | 28 (8.9) | 5 (7.7) | 0.745 |
| Other comorbidities (e.g., COPD, gout, malignancy) | 77 (20.4) | 67 (19.7) | 10 (26.3) | 0.337 | 57 (18.2) | 20 (30.8) | 0.022 * |
| Prior PCI | 28 (7.4) | 26 (7.6) | 2 (5.3) | 0.595 | 23 (7.3) | 5 (7.7) | 0.923 |
| Prior CABG surgery | 8 (2.1) | 6 (1.8) | 2 (5.3) | 0.155 | 6 (1.9) | 2 (3.1) | 0.554 |
| 30-Days Follow-Up | 1-Year Follow-Up | ||||||
|---|---|---|---|---|---|---|---|
| Variable | Total N = 378 (%) | Alive N = 340 (89.9) | Dead N = 38 (10.1) | p-Value | Alive N = 313 (82.8) | Dead N = 65 (17.2) | p-Value |
| Clinical presentation | |||||||
| Crushing chest pain | 189 (50.0) | 164 (48.2) | 25 (65.8) | 0.040 * | 154 (49.2) | 35 (53.8) | 0.496 |
| Chronic angina CCS III-IV | 47 (12.4) | 40 (11.8) | 7 (18.4) | 0.238 | 32 (10.2) | 15 (23.1) | 0.004 * |
| Heart rate, bpm (IQR) | 85 (73–100) | 85 (73–98) | 93 (70–111) | 0.119 | 84 (72–98) | 93 (76–107) | 0.029 * |
| Systolic BP, mmHg (IQR) | 121.5 (106–137) | 122 (107–138.5) | 113.5 (95–135) | 0.036 * | 123 (109–140) | 110 (98–131) | 0.001 * |
| Cardiogenic shock | 29 (7.7) | 17 (5.0) | 12 (31.6) | <0.001 * | 13 (4.2) | 16 (24.6) | <0.001 * |
| Sudden cardiac arrest | 16 (4.2) | 10 (3.0) | 6 (15.8) | <0.001 * | 8 (2.6) | 8 (12.3) | <0.001 * |
| Killip class > II | 50 (13.2) | 32 (9.4) | 18 (47.4) | <0.001 * | 23 (7.4) | 27 (41.5) | <0.001 * |
| GRACE risk score intermediate to high risk | 190 (50.3) | 154 (45.3) | 36 (94.7) | <0.001 * | 133 (42.5) | 57 (87.7) | <0.001 * |
| GRACE 2.0 risk of in-hospital death, (%) (IQR) | 2.1 (1.1–4.2) | 1.8 (1.1–3.7) | 9.4 (3.5–23.1) | <0.001 * | 1.6 (1.0–3.3) | 6.9 (3.2–22) | <0.001 * |
| TIMI score > 4 | 144 (38.1) | 115 (33.8) | 29 (76.3) | <0.001 * | 94 (30.0) | 50 (76.9) | <0.001 * |
| Time from symptom onset to ECG diagnosis, hours (IQR) | 5.0 (2.6–15.8) | 5.2 (2.8–16.7) | 3.6 (1.9–8.4) | 0.068 | 5.0 (2.6–15.8) | 4.8 (2.4–20.2) | 0.761 |
| Key laboratory findings | |||||||
| Peak hs-cTnT, ng/L (IQR) | 2935 (1436–5861) | 2801 (1350.5–5645) | 5411 (1818–8453) | 0.004 * | 2729 (1336–5578) | 4942 (1818–8558) | <0.001 * |
| CRP, mg/L (IQR) | 14.4 (9–53) | 14 (9–44.5) | 43 (9–136) | 0.015 * | 14 (9–40) | 28 (10–85) | 0.006 * |
| Serum uric acid, mmol/L (IQR) | 0.38 (0.29–0.48) | 0.38 (0.29–0.47) | 0.48 (0.38–0.59) | <0.001 * | 0.37 (0.28–0.46) | 0.48 (0.38–0.63) | <0.001 * |
| Urea, mmol/L (IQR) | 5.7 (4.5–7.6) | 5.5 (4.4–7.3) | 9.4 (6.2–14) | <0.001 * | 5.5 (4.3–7) | 7.8 (6–13.2) | <0.001 * |
| Creatinine, μmol/L (IQR) | 89 (74–107) | 87 (73–101.5) | 112.5 (83–188) | <0.001 * | 86 (73–101) | 102 (82–141) | <0.001 * |
| GFR, mL/min/1.73 m2 (IQR) | 84.9 (65–109) | 87 (68.1–111) | 54 (33–79) | <0.001 * | 89 (69.4–112.2) | 64 (44–87) | <0.001 * |
| Haemoglobin, g/dL (IQR) | 14.7 (13.2–15.7) | 14.8 (13.4–15.7) | 13.6 (12.2–15) | 0.016 * | 14.8 (13.4–15.7) | 14 (12.3–15.3) | 0.019 * |
| Echocardiography | |||||||
| LVEF ≤ 40% | 189 (50.0) | 163 (47.9) | 26 (68.4) | 0.017 * | 146 (46.7) | 43 (66.2) | 0.004 * |
| LVRWMA | 352 (93.1) | 316 (92.9) | 36 (94.7) | 0.678 | 292 (93.3) | 60 (92.3) | 0.776 |
| LV thrombus | 17 (4.5) | 14 (4.1) | 3 (7.9) | 0.006 * | 12 (3.8) | 5 (7.7) | 0.034 * |
| 30 Days Follow-Up | 1-Year Follow-Up | ||||||
|---|---|---|---|---|---|---|---|
| Variables | Total N = 378 (%) | Alive N = 340 (89.9) | Dead N = 38 (10.1) | p-Value | Alive N = 313 (82.8) | Dead N = 65 (17.2) | p-Value |
| Angiographic findings | |||||||
| Total number of DCA procedures performed | 344 (91.0) | 318 (93.5) | 26 (68.4) | <0.001 * | 297 (94.9) | 47 (72.3) | <0.001 * |
| Coronary angiography vascular access site | |||||||
| RRA | 289 (76.5) | 269 (79.1) | 20 (52.6) | <0.001 * | 252 (80.5) | 37 (56.9) | <0.001 * |
| LRA | 1 (0.3) | 1 (0.3) | 0 (0.0) | 0.738 | 1 (0.3) | 0 (0.0) | 0.828 |
| RFA | 39 (10.3) | 34 (10.0) | 5 (13.2) | 0.544 | 32 (10.2) | 7 (10.8) | 0.895 |
| Failed RRA converted to RFA | 12 (3.2) | 11 (3.2) | 1 (2.6) | 0.840 | 9 (2.9) | 3 (4.6) | 0.467 |
| LFA | 1 (0.3) | 1 (0.3) | 0 (0.0) | 0.738 | 1 (0.3) | 0 (0.0) | 0.828 |
| Failed RRA converted to LFA | 1 (0.3) | 1 (0.3) | 0 (0.0) | 0.738 | 1 (0.3) | 0 (0.0) | 0.828 |
| Culprit occluded coronary artery | |||||||
| LAD | 176 (46.6) | 162 (47.7) | 14 (36.8) | 0.205 | 149 (47.6) | 27 (41.5) | 0.372 |
| RCA | 104 (27.5) | 92 (27.1) | 12 (31.6) | 0.554 | 87 (27.8) | 17 (26.2) | 0.787 |
| Left circumflex artery | 18 (4.8) | 18 (5.3) | 0 (0.0) | 0.146 | 18 (5.8) | 0 (0.0) | 0.048 * |
| Left main stem artery | 3 (0.8) | 3 (0.9) | 0 (0.0) | 0.561 | 3 (1.0) | 0 (0.0) | 0.428 |
| Number of coronary arteries with > 70% stenosis | |||||||
| Less than three vessels occluded | 249 (65.9) | 230 (67.6) | 19 (50.0) | 0.128 | 217 (69.3) | 32 (49.2) | 0.454 |
| TVD or more | 46 (12.2) | 40 (11.8) | 6 (15.8) | 37 (11.8) | 9 (13.8) | ||
| No coronary lesions | 49 (13.0) | 48 (14.1) | 1 (2.6) | 43 (13.7) | 6 (9.2) | ||
| PCI modality | |||||||
| PTCA and DES | 138 (36.5) | 125 (36.8) | 13 (34.2) | 0.756 | 116 (37.1) | 22 (33.9) | 0.624 |
| PTCA and DEB | 6 (1.6) | 5 (1.5) | 1 (2.6) | 0.587 | 3 (1.0) | 3 (4.6) | 0.032 * |
| PTCA only | 14 (3.7) | 10 (2.9) | 4 (10.5) | 0.019 * | 10 (3.2) | 4 (6.2) | 0.250 |
| Direct DES only | 40 (10.6) | 40 (11.8) | 0 (0.0) | 0.025 * | 39 (12.5) | 1 (1.5) | 0.009 * |
| Aspiration thrombectomy | 16 (4.2) | 15 (4.4) | 1 (2.6) | 0.605 | 14 (4.5) | 2 (3.1) | 0.611 |
| Time parameters, hours | |||||||
| Time from symptom onset to thrombolysis, hours (IQR) | 6.2 (3.8–10.8) | 6.5 (3.8–11.3) | 4.6 (3.4–7.9) | 0.136 | 6.5 (3.8–12) | 4.8 (3.4–7.9) | 0.108 |
| Time from symptom onset to PCI, hours (IQR) | 64 (32.2–110.4) | 64.7 (32.2–113.5) | 57.6 (27.6–97.9) | 0.559 | 66 (36–111.8) | 55 (25.4–106.1) | 0.183 |
| Time from ECG diagnosis to PCI, hours (IQR) | 50.0 (23.5–87.4) | 51.4 (23.5–89.3) | 34.6 (23.5–66) | 0.299 | 53.3 (24.5–90) | 29.0 (17.0–68.2) | 0.041 * |
| Time from symptom onset to thrombolysis | |||||||
| ≤12 h | 200 (52.9) | 178 (52.4) | 22 (57.9) | 0.516 | 161 (51.4) | 39 (60.0) | 0.208 |
| >12–24 h | 34 (9.0) | 32 (9.4) | 2 (5.3) | 0.397 | 31 (9.9) | 3 (4.6) | 0.175 |
| >24–72 h | 16 (4.2) | 14 (4.1) | 2 (5.3) | 0.739 | 13 (4.2) | 3 (4.6) | 0.866 |
| >72 h | 5 (1.3) | 5 (1.5) | 0 (0.0) | 0.452 | 5 (1.6) | 0 (0.0) | 0.387 |
| Time from symptom onset to PCI | |||||||
| ≤12 h | 13 (3.4) | 13 (3.8) | 0 (0.0) | 0.220 | 10 (3.2) | 3 (4.6) | 0.567 |
| >12–24 h | 18 (4.8) | 16 (4.7) | 2 (5.3) | 0.878 | 15 (4.8) | 3(4.6) | 0.951 |
| >24–72 h | 90 (23.8) | 80 (23.5) | 10 (26.3) | 0.702 | 76 (24.3) | 14 (21.5) | 0.637 |
| >72 h | 91 (24.1) | 85 (25.0) | 6 (15.8) | 0.208 | 80 (25.6) | 11 (16.9) | 0.138 |
| 30 Days Follow-Up | 1-Year Follow-Up | ||||||
|---|---|---|---|---|---|---|---|
| Variable | Total N = 378 (%) | Alive N = 340 (89.9%) | Dead N = 38 (10.1%) | p-Value | Alive N = 313 (82.8%) | Dead N = 65 (17.2%) | p-Value |
| Composite in-hospital CV endpoint a | 61 (16.1) | 38 (11.2) | 23 (60.5) | <0.001 * | 34 (10.9) | 27 (41.5) | <0.001 * |
| Impaired renal function | 58 (15.3) | 43 (12.7) | 15 (39.5) | <0.001 * | 37 (11.8) | 21 (32.3) | <0.001 * |
| Repeated coronary angiography (i.e., staged PCI/relook) | 29 (7.7) | 28 (8.2) | 1 (2.6) | 0.218 | 24 (7.7) | 5 (7.7) | 0.995 |
| Length of stay, days (IQR) | 4 (3–7) | 4 (3–7) | 4 (2–8) | 0.930 | 4 (3–6) | 5 (3–8) | 0.108 |
| LOS ≤ 3 days | 145 (38.4) | 130 (38.2) | 15 (39.5) | 0.882 | 124 (39.6) | 21 (32.3) | 0.270 |
| LOS > 3 days | 233 (61.6) | 210 (61.8) | 23 (60.5) | 189 (60.4) | 44 (67.7) | ||
| Referral for CABG surgery | 8 (2.1) | 8 (2.4) | 0 (0.0) | 0.597 | 8 (2.6) | 0 (0.0) | 0.039 * |
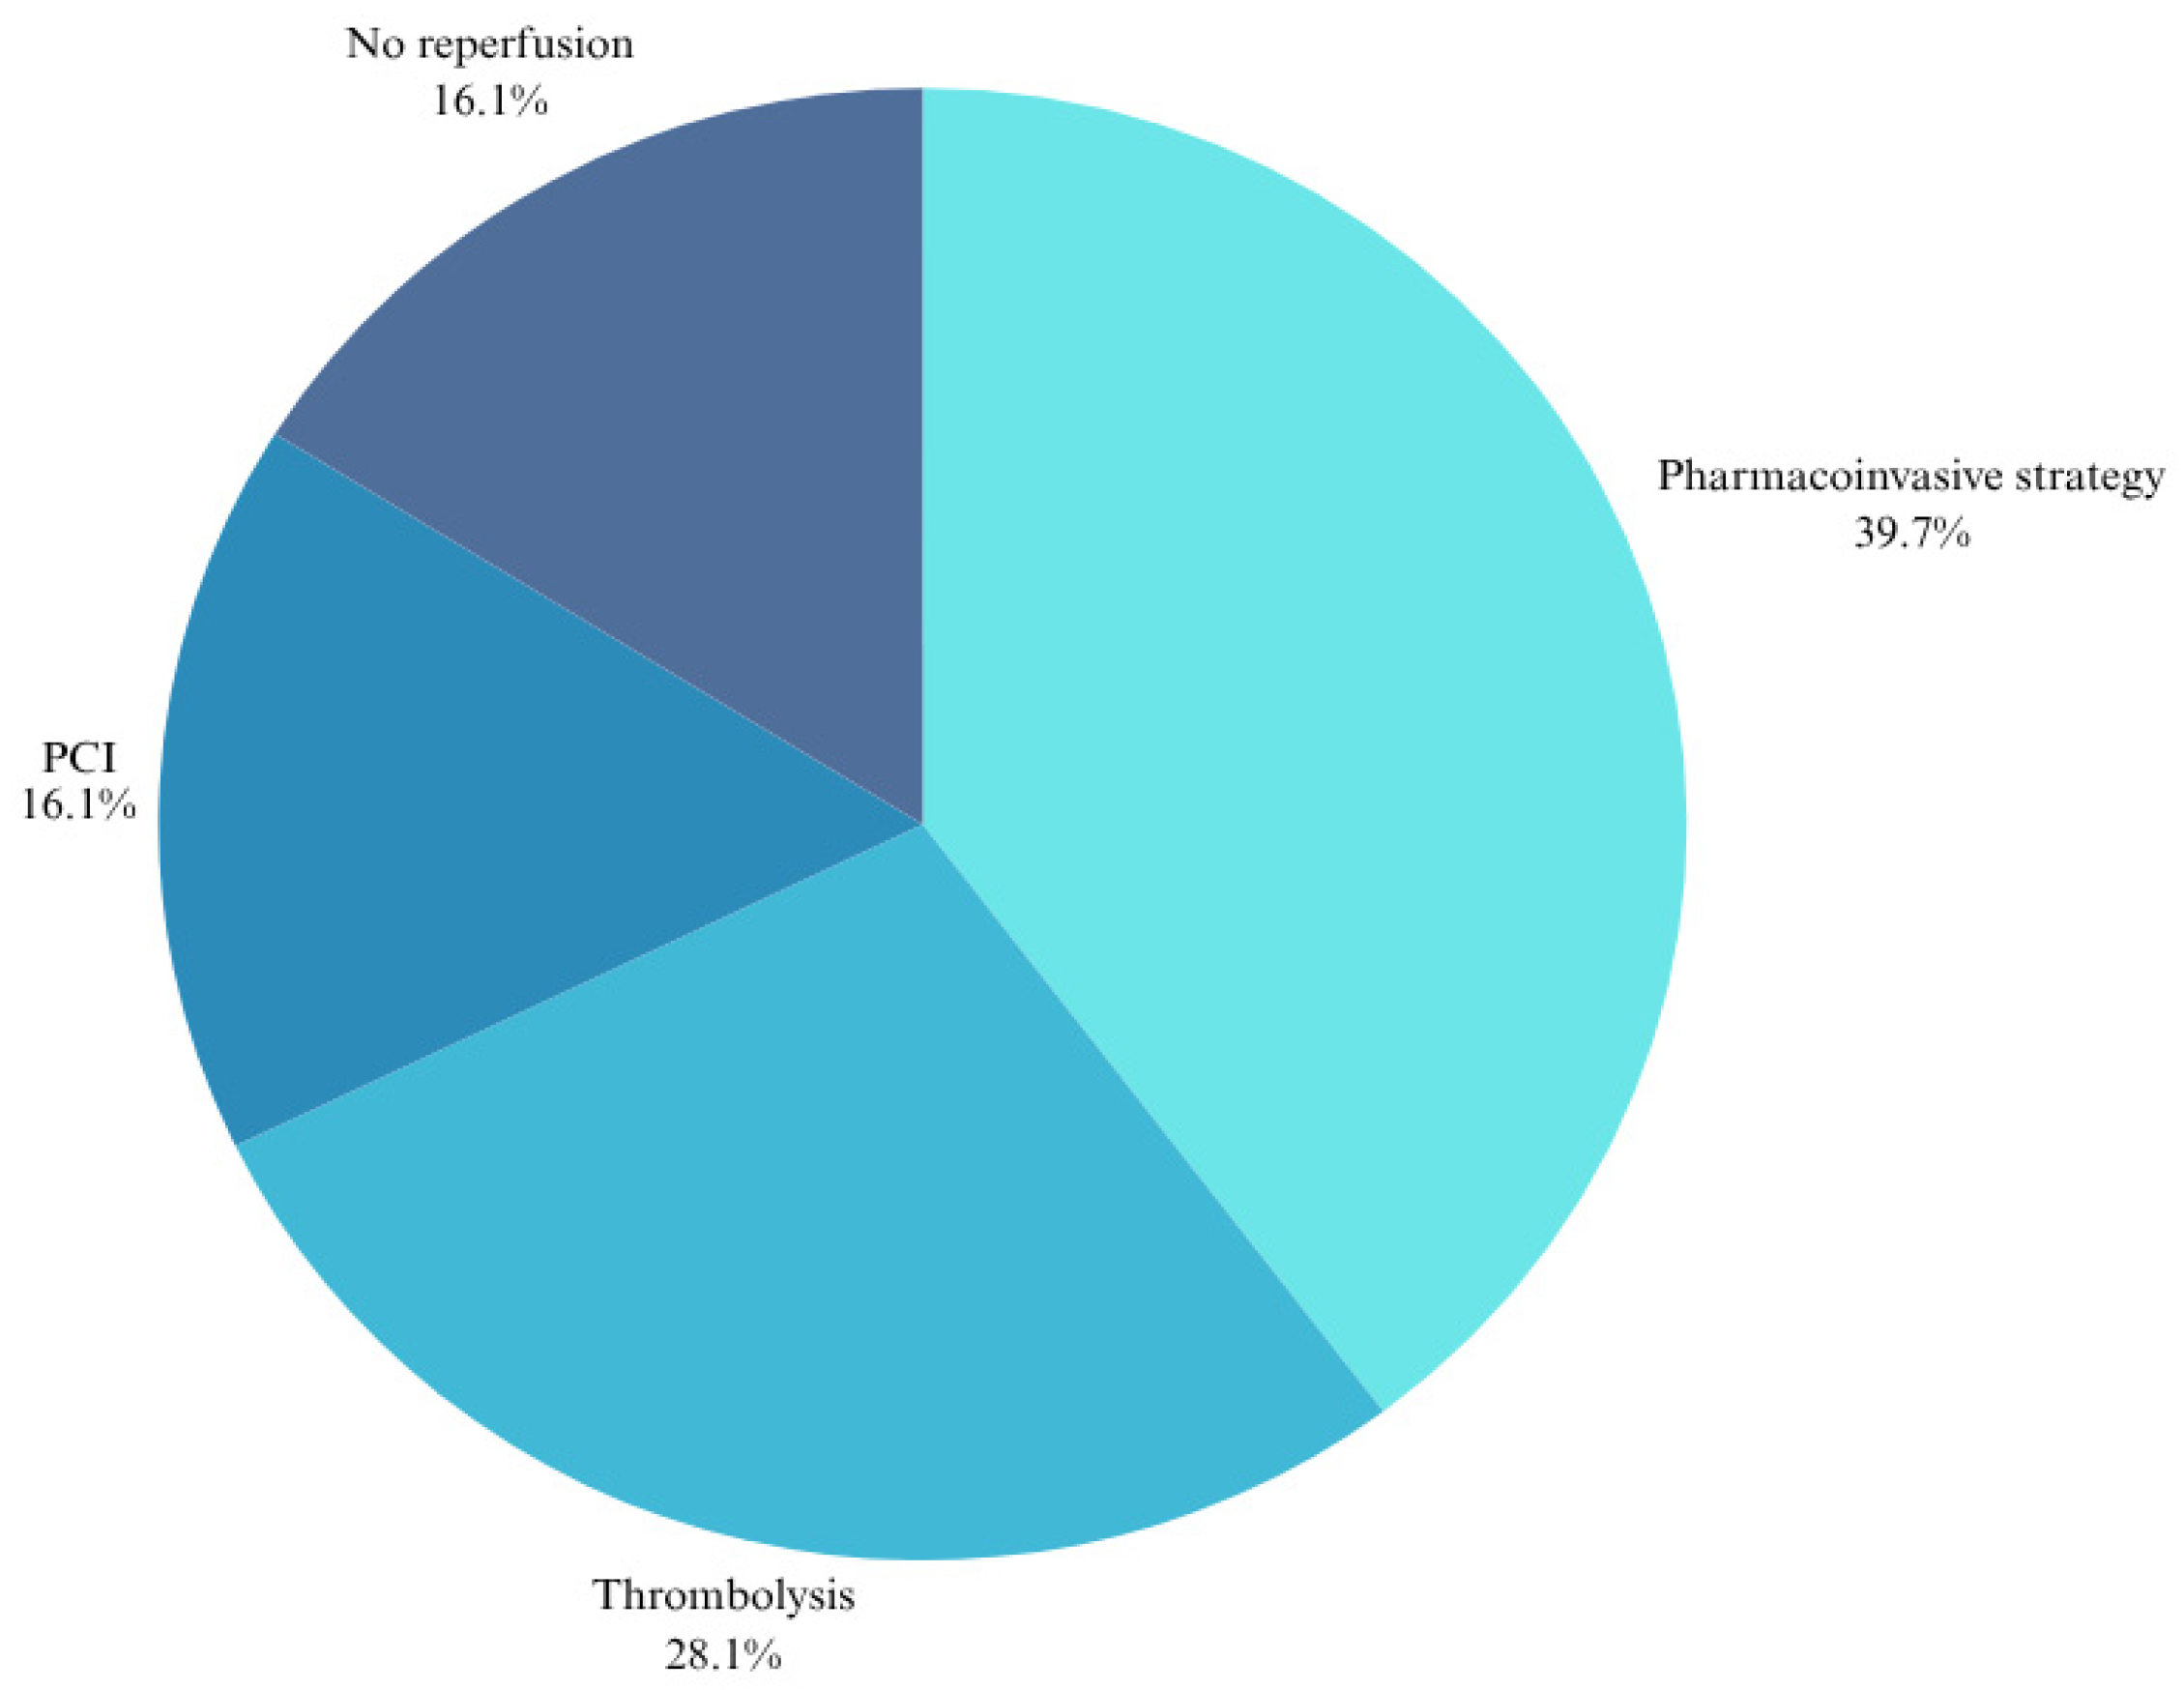
| Reperfusion Type | Thrombolysis (A) n = 105 (%) | PCI (B) n = 63 (%) | PIS (C) n = 150 (%) | No Reperfusion (D) n = 60 (%) | Total n = 378 | A vs. B p-Value | B vs. C p-Value | A vs. C p-Value | A vs. D p-Value | B vs. D p-Value | C vs. D p-Value |
|---|---|---|---|---|---|---|---|---|---|---|---|
| Total deaths | 24 (22.9) | 9 (14.3) | 22 (14.7) | 10 (16.7) | 65 (17.2) | N/A | N/A | N/A | N/A | N/A | N/A |
| Of which in-hospital | 12 (11.4) | 0 (0.0) | 9 (6.0) | 4 (6.7) | 25 (6.6) | 0.005 * | 0.047 * | 0.121 | 0.320 | 0.037 * | 0.856 |
| Of which within 30 days of discharge | 2 (1.9) | 5 (7.9) | 4 (2.7) | 2 (3.6) | 13 (3.4) | 0.087 | 0.101 | 0.745 | 0.603 | 0.312 | 0.787 |
| Of which after 30 days of discharge but within one year | 10 (9.5) | 4 (6.3) | 9 (6.0) | 4 (6.7) | 27 (7.1) | 0.861 | 0.427 | 0.502 | 0.818 | 0.713 | 0.749 |
| a Composite CV endpoint at 30 days | 28 (26.7) | 13 (20.6) | 33 (22.0) | 15 (25.0) | 89 (23.5) | 0.378 | 0.825 | 0.390 | 0.815 | 0.564 | 0.640 |
| a Composite CV endpoint at one year | 33 (31.4) | 15 (23.8) | 40 (26.7) | 16 (26.7) | 104 (27.5) | 0.290 | 0.664 | 0.408 | 0.520 | 0.715 | 1.000 |
| Clinical Predictors of 30-Day All-Cause Mortality | ||||
|---|---|---|---|---|
| Univariate Analysis | Multivariate Analysis | |||
| Variable | Unadjusted HR (95% CI) | p-Value | Adjusted HR (95% CI) | p-Value |
| Age, years | 1.05 (1.02–1.08) | <0.001 * | 1.05 (1.02–1.08) | 0.002 * |
| Female sex | 1.61 (0.81–3.19) | 0.174 | 1.55 (0.77–3.10) | 0.218 |
| Race | ||||
| Caucasian | 2.55 (1.10–5.92) | 0.029 * | 1.72 (0.72–4.10) | 0.224 |
| Indian | 1.24 (0.42–3.70) | 0.694 | 0.97 (0.32–2.93) | 0.963 |
| Mixed | 1.21 (0.15–9.83) | 0.859 | 0.70 (0.08–5.79) | 0.740 |
| SBP < 90 mmHg | 3.56 (1.57–8.09) | 0.002 * | 3.44 (1.52–7.83) | 0.003 * |
| Heart rate ≥ 100, bpm | 2.42 (1.28–4.59) | 0.007 * | 2.83 (1.47–5.44) | 0.002 * |
| Menopausal or post-menopausal female | 2.65 (1.29–5.45) | 0.008 * | 2.31 (1.10–4.86) | 0.028 * |
| Killip > II | 6.49 (3.43–12.30) | <0.001 * | 5.61 (2.83–11.12) | <0.001 * |
| TIMI risk score > 4 | 5.48 (2.60–11.59) | <0.001 * | 5.51 (2.57–11.79) | <0.001 * |
| GRACE 2.0 in-hospital mortality risk (%) | 1.06 (1.04–1.08) | <0.001 * | 1.05 (1.03–1.07) | <0.001 * |
| GRACE one year mortality risk (%) | 1.05 (1.04–1.07) | <0.001 * | ||
| LVEF ≤ 40% | 2.21 (1.12–4.38) | 0.023 * | 2.04 (1.02–4.05) | 0.043 * |
| Peak hs-cTnT, ng/L | 1.00 (0.99–1.00) | 0.074 | 1.00 (0.99–1.00) | 0.077 |
| Baseline Hb, g/dL | 0.87 (0.76–0.99) | 0.036 * | 0.88 (0.77–1.01) | 0.070 |
| CRP, mg/L | 1.00 (1.00–1.01) | 0.001 * | 1.01 (1.00–1.01) | 0.001 * |
| Serum uric acid, mmol/L | 1.65 (1.19–2.31) | 0.003 * | 1.56 (1.07–2.28) | 0.022 * |
| Creatinine, μmol/L | 1.00 (1.00–1.01) | <0.001 * | 1.00 (1.00–1.01) | <0.001 * |
| GFR, mL/min/1.73 m2 | 0.97 (0.96–0.98) | <0.001 * | 0.98 (0.96–0.99) | 0.046 * |
| LOS > 3 days | 0.95 (0.50–1.82) | 0.878 | 0.90 (0.47–1.72) | 0.743 |
| Time from symptom onset to thrombolysis, hours | 0.99 (0.95–1.03) | 0.475 | 0.98 (0.94–1.03) | 0.411 |
| Time from symptom onset to PCI, hours | 1.00 (0.99–1.01) | 0.476 | 1.00 (0.99–1.01) | 0.719 |
| RRA access site | 0.33 (0.17–0.62) | 0.001 * | 0.23 (0.06–0.82) | 0.024 * |
| Impaired renal function | 3.83 (2.00–7.34) | <0.001 * | 3.59 (1.81–7.12) | <0.001 * |
| Number of cigarette smoking pack years, years | 1.02 (1.01–1.04) | 0.010 * | 1.01 (1.00–1.03) | 0.188 |
| Clinical Predictors of One-Year All-Cause Mortality | ||||
|---|---|---|---|---|
| Univariate Analysis | Multivariate Analysis | |||
| Variable | Unadjusted HR (95% CI) | p-Value | Adjusted HR (95% CI) | p-Value |
| Age ≥ 80 years | 2.88 (1.19–6.98) | 0.019 * | 2.82 (1.16–6.86) | 0.023 * |
| Female sex | 1.06 (0.83–1.35) | 0.636 | 1.07 (0.84–1.36) | 0.594 |
| Race | ||||
| Caucasian | 1.07 (0.85–1.36) | 0.572 | 1.00 (0.78–1.28) | 0.997 |
| Indian | 1.02 (0.77–1.35) | 0.905 | 0.98 (0.74–1.30) | 0.894 |
| Mixed | 1.00 (0.58–1.74) | 0.993 | 0.91 (0.52–1.60) | 0.738 |
| Heart rate, bpm | 1.00 (1.00–1.01) | 0.416 | 1.00 (1.00–1.01) | 0.321 |
| Menopausal or post-menopausal females | 1.13 (0.83–1.53) | 0.448 | 1.12 (0.81–1.53) | 0.489 |
| Killip class > II | 1.78 (1.32–2.40) | <0.001 * | 1.72 (1.26–2.34) | 0.001 * |
| TIMI score > 4 | 1.38 (1.12–1.70) | 0.002 * | 1.38 (1.12–1.72) | 0.003 * |
| LVEF ≤ 40% | 1.13 (0.92–1.38) | 0.239 | 1.13 (0.92–1.38) | 0.252 |
| GRACE risk of in-hospital mortality | 1.03 (1.02–1.04) | <0.001 * | 1.02 (1.01–1.04) | <0.001 * |
| GRACE risk of one-year mortality, % | 1.02 (1.01–1.03) | <0.001 * | 1.03 (1.01–1.04) | <0.001 * |
| Baseline creatinine, mmol/L | 1.00 (1.00–1.01) | <0.001 * | 1.00 (1.00–1.01) | <0.001 * |
| GFR, mL/min/1.73 m2 | 1.00 (0.99–1.00) | 0.023 * | 1.00 (0.99–1.00) | 0.024 * |
| CRP, mg/L | 1.00 (0.99–1.00) | 0.145 | 1.00 (0.99–1.00) | 0.163 |
| Serum uric acid, mmol/L | 1.19 (0.96–1.47) | 0.112 | 1.20 (0.96–1.50) | 0.118 |
| Peak hs-cTnT, ng/L | 1.00 (0.99–1.00) | 0.361 | 1.00 (0.99–1.00) | 0.325 |
| RRA access | 0.81 (0.63–1.02) | 0.074 | 0.87 (0.56–1.35) | 0.532 |
| Time from symptom onset to thrombolysis, hours | 1.00 (0.99–1.00) | 0.686 | 1.00 (0.99–1.00) | 0.612 |
| Time from symptom onset to PCI, hours | 1.00 (0.99–1.00) | 0.810 | 1.00 (0.99–1.00) | 0.857 |
| LOS > 3 days | 1.05 (0.85–1.29) | 0.668 | 1.03 (0.83–1.27) | 0.785 |
Disclaimer/Publisher’s Note: The statements, opinions and data contained in all publications are solely those of the individual author(s) and contributor(s) and not of MDPI and/or the editor(s). MDPI and/or the editor(s) disclaim responsibility for any injury to people or property resulting from any ideas, methods, instructions or products referred to in the content. |
© 2025 by the authors. Licensee MDPI, Basel, Switzerland. This article is an open access article distributed under the terms and conditions of the Creative Commons Attribution (CC BY) license (https://creativecommons.org/licenses/by/4.0/).
Share and Cite
Badianyama, M.; Mutyaba, A.; Tsabedze, N. Thirty-Day and One-Year All-Cause Mortality of ST-Segment Elevation Myocardial Infarction in Johannesburg, South Africa: Insights from the STEMI HOC-1 Prospective Study. J. Cardiovasc. Dev. Dis. 2025, 12, 282. https://doi.org/10.3390/jcdd12080282
Badianyama M, Mutyaba A, Tsabedze N. Thirty-Day and One-Year All-Cause Mortality of ST-Segment Elevation Myocardial Infarction in Johannesburg, South Africa: Insights from the STEMI HOC-1 Prospective Study. Journal of Cardiovascular Development and Disease. 2025; 12(8):282. https://doi.org/10.3390/jcdd12080282
Chicago/Turabian StyleBadianyama, Marheb, Arthur Mutyaba, and Nqoba Tsabedze. 2025. "Thirty-Day and One-Year All-Cause Mortality of ST-Segment Elevation Myocardial Infarction in Johannesburg, South Africa: Insights from the STEMI HOC-1 Prospective Study" Journal of Cardiovascular Development and Disease 12, no. 8: 282. https://doi.org/10.3390/jcdd12080282
APA StyleBadianyama, M., Mutyaba, A., & Tsabedze, N. (2025). Thirty-Day and One-Year All-Cause Mortality of ST-Segment Elevation Myocardial Infarction in Johannesburg, South Africa: Insights from the STEMI HOC-1 Prospective Study. Journal of Cardiovascular Development and Disease, 12(8), 282. https://doi.org/10.3390/jcdd12080282