
Subclinical Cardiac Involvement in Asymptomatic ATTR Mutation Carriers: Insights from Cardiac MRI, Myocardial Strain, and Mapping Techniques

 , , ,
, , , 
 , , , ,
Abstract
1. Introduction
2. Materials and Methods
2.1. Study Population
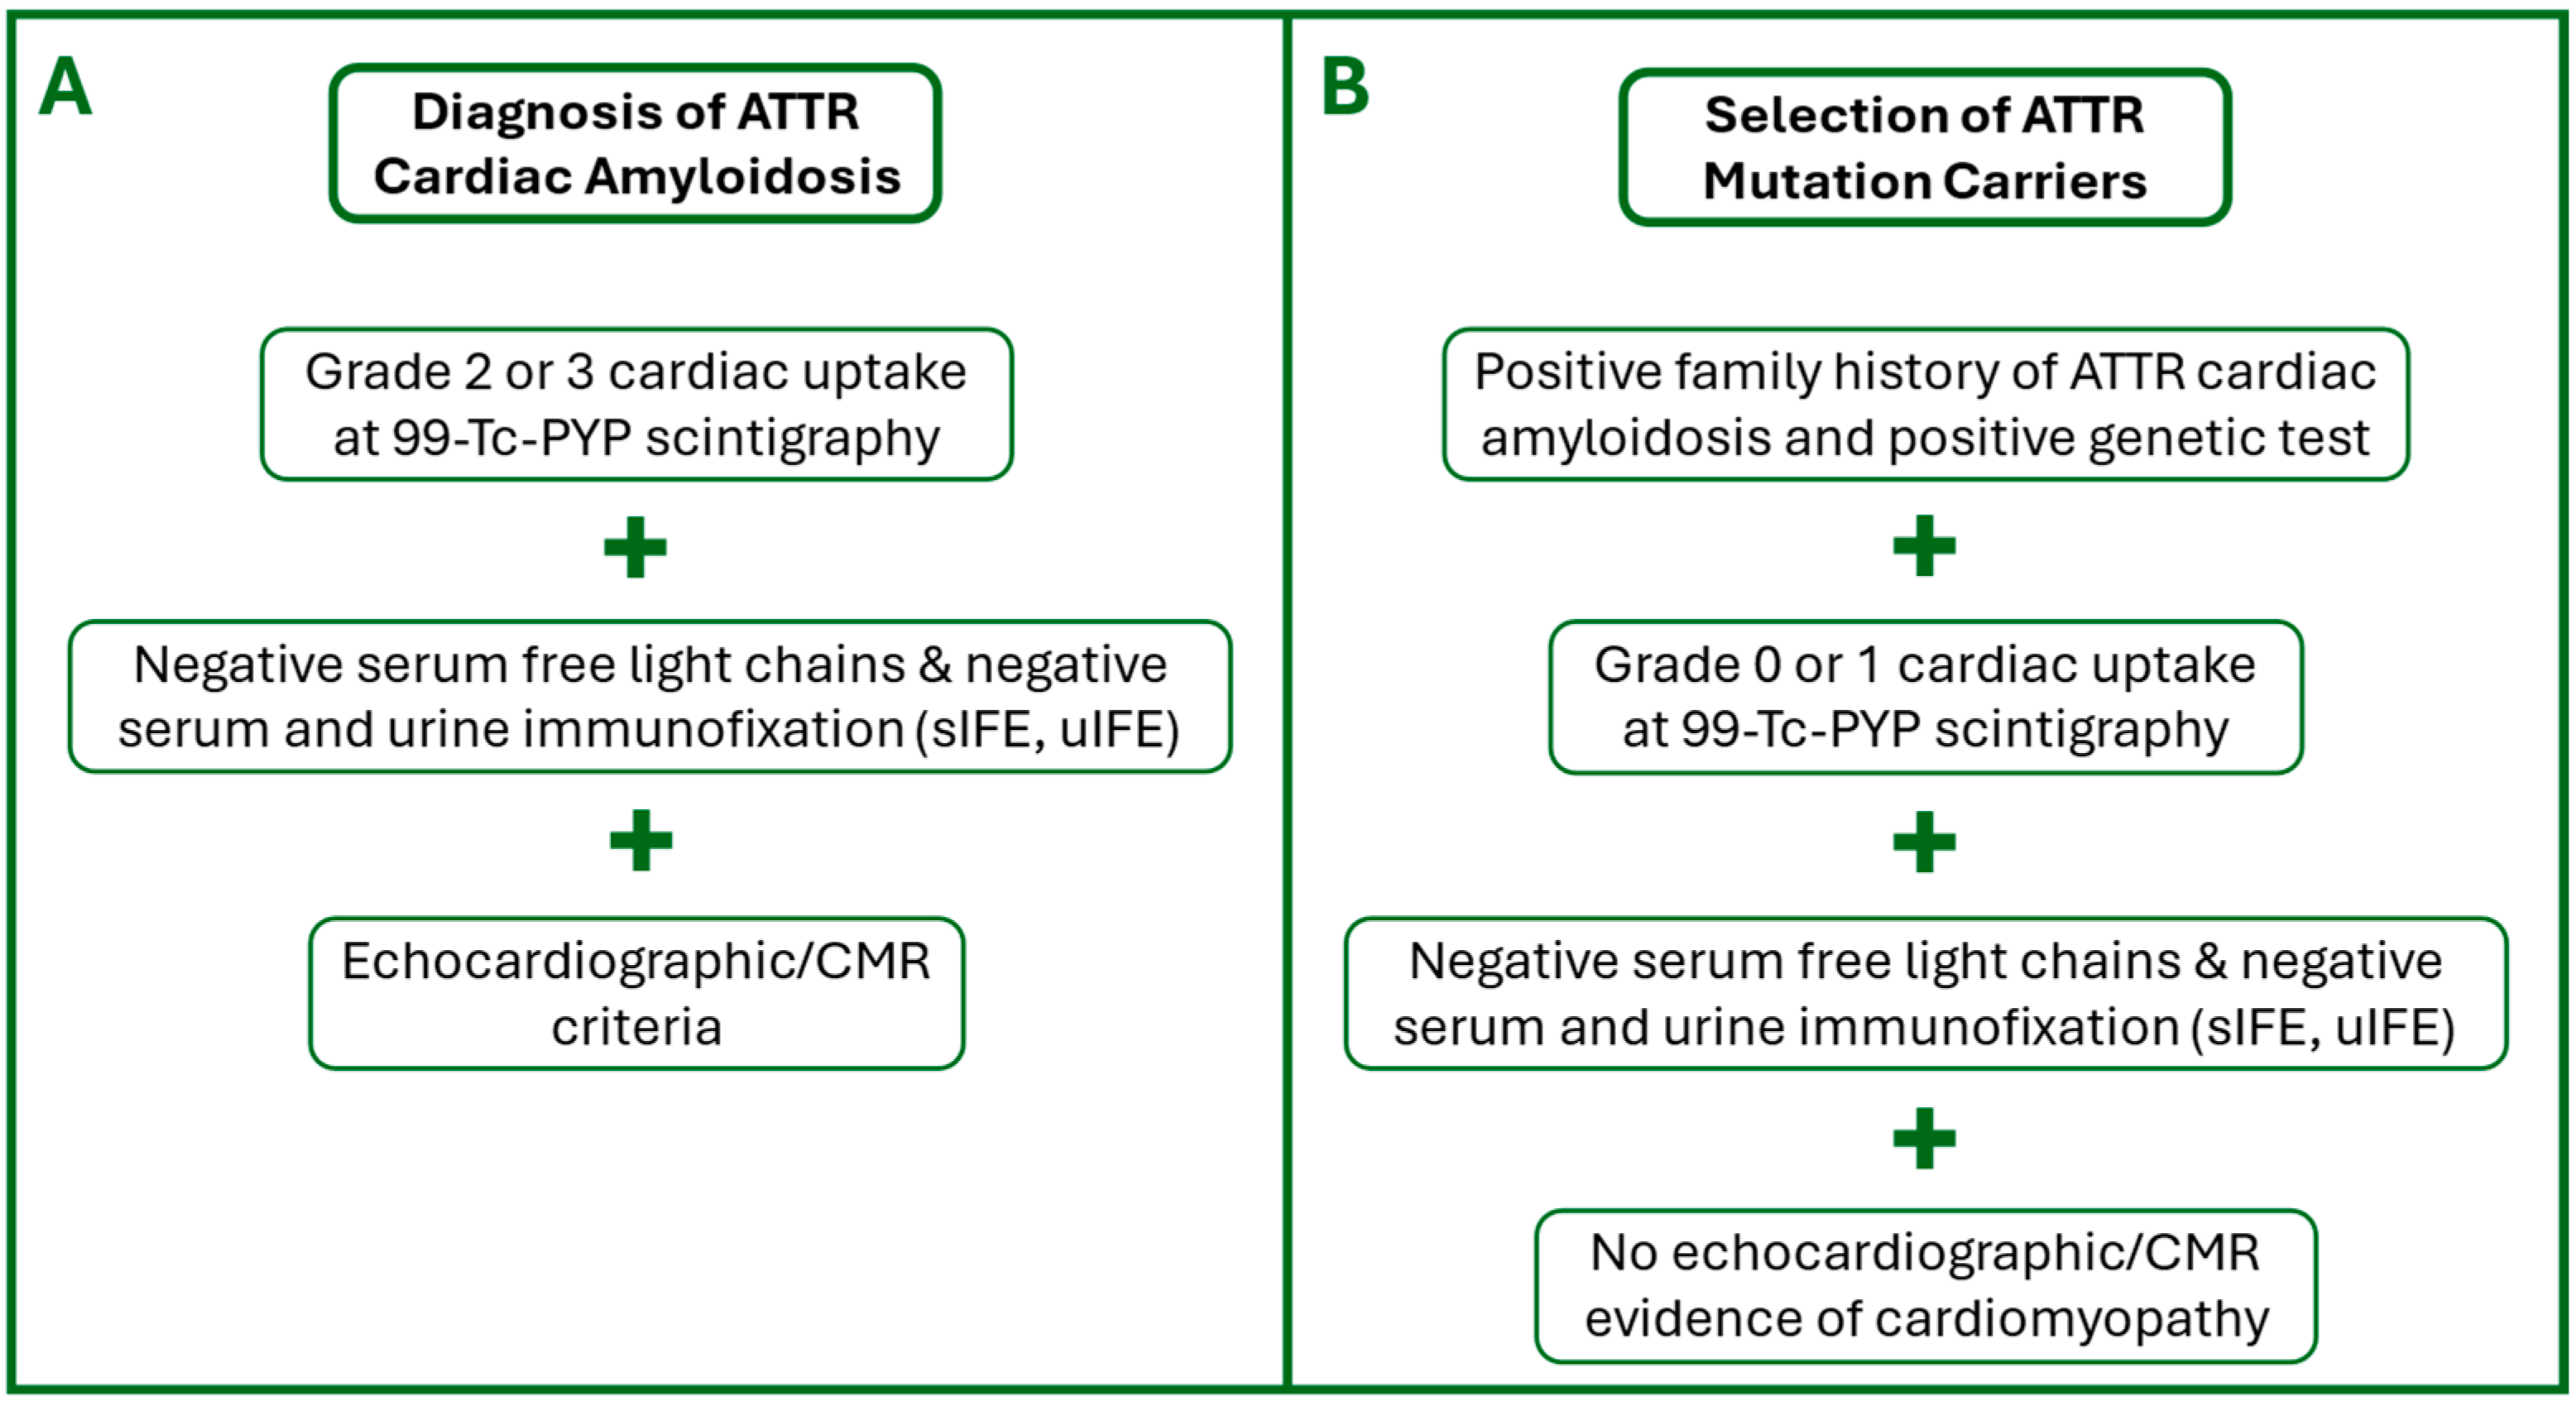
2.2. Inclusion Criteria
2.3. Exclusion Criteria
2.4. CMR Protocol
- T2-weighted Short Tau Inversion Recovery (T2-STIR) sequence acquired on the short axis (from base to apex, 10 slices at least) and on 2- and 4-chamber views (TR: 800; TE: 44 ms; TI: 220 ms; FA: 180°; Slice thickness: 6 mm; FoV: 360 mm; FoV Phase: 81.3%; Voxel size: 1.4 × 1.4 × 6 mm; Matrix: 135 × 256);
- Cine-Steady State Free Precession sequences for cineMR imaging, acquired on the short axis (from the base to the cardiac apex, 10 slices at least) and on 2-, 3-, and 4-chamber views (TR: 40.8 ms; TE: 1.49 ms; FA: 80°; Slice thickness: 6 mm; FoV: 360 mm; FoV Phase: 81.3%; Voxel size: 1.4 × 1.4 × 6.0 mm; Matrix: 191 × 256);
- Modified Look–Locker Inversion Recovery (MOLLI) sequence for nT1 mapping, acquired on three short-axis slices at basal, mid-ventricular, and apical views and one four-chamber view before (TR: 280.6 ms; TE: 1.12 ms; FA: 35°; Slice thickness: 8 mm; FoV: 360 mm; FoV Phase: 85.2%; Voxel size: 1.4 × 1.4 × 8 mm; Matrix 144 × 256) and 15 min after the administration of contrast media (TR: 360.6 ms; TE: 1.12 ms; FA: 35°; Slice thickness: 8 mm; FoV: 360 mm; FoV Phase: 85.2%; Voxel size: 1.4 × 1.4 × 8 mm; Matrix 144 × 256);
- Contrast-enhanced Inversion Recovery T1-weighted images were acquired from 10 to 15 min after contrast media administration, during breath-hold at end-diastole in the short axis (from the base to the cardiac apex, 10 slices at least), and on 2-, 3-, and 4-chamber views (TR: 750 ms; TE: 2.01 ms; TI: 300–350 ms; FA: 20°; Slice thickness: 6 mm; FoV: 360 mm; FoV Phase: 85.2%; Voxel size: 1.4 × 1.4 × 8 mm; Matrix 154 × 256) for LGE imaging.
2.5. Image Analysis
2.6. Statistical Analysis
3. Results
3.1. Demographic and Clinical Characteristics
3.2. CMR Features
3.3. CMR Tissue Characterization
3.4. CMR LV and LA Strain Analysis
4. Discussion
4.1. Tissue Characterization
4.2. Ventricular Strain
4.3. Atrial Strain
4.4. Study Limitations
5. Conclusions
Supplementary Materials
Author Contributions
Funding
Institutional Review Board Statement
Informed Consent Statement
Data Availability Statement
Conflicts of Interest
Abbreviations
| AUC | Area Under the Curve; |
| ATTR | Amyloid TransThyretin Related; |
| BPS | Booster Pump Strain; |
| C | Controls; |
| CA | Cardiac Amyloidosis; |
| CMR | Cardiac Magnetic Resonance; |
| CS | Conduit Strain; |
| ECG | Electrocardiogram; |
| ECV | Extracellular Volume; |
| EF | Ejection Fraction; |
| eGFR | Estimated Glomerular Filtration Rate; |
| GCS | Global Circumferential Strain; |
| GLS | Global Longitudinal Strain; |
| h-ATTR | Hereditary ATTR; |
| ICC | Intraclass Correlation Coefficient; |
| IFE | Immunofixation Electrophoresis; |
| LA | Left Atrium; |
| LGE | Late Gadolinium Enhancement; |
| LV | Left Ventricle; |
| LVH | Left Ventricular Hypertrophy; |
| MC | Mutation Carriers; |
| MMi | Myocardial Mass Index; |
| MOLLI | Modified Look–Locker Inversion Recovery; |
| MWT | Maximal Wall Thickness; |
| PYP | Pyrophosphate; |
| ROC | Receiver Operator Characteristics; |
| RS | Reservoir Strain; |
| TTR | Transthyretin; |
| Wt-ATTR | Wild-Type ATTR. |
References
- Fontana, M.; Ćorović, A.; Scully, P.; Moon, J.C. Myocardial Amyloidosis: The Exemplar Interstitial Disease. JACC Cardiovasc. Imaging 2019, 12, 2345–2356. [Google Scholar] [CrossRef] [PubMed]
- Rapezzi, C.; Merlini, G.; Quarta, C.C.; Riva, L.; Longhi, S.; Leone, O.; Salvi, F.; Ciliberti, P.; Pastorelli, F.; Biagini, E.; et al. Systemic cardiac amyloidoses: Disease profiles and clinical courses of the 3 main types. Circulation 2009, 120, 1203–1212. [Google Scholar] [CrossRef]
- Porcari, A.; Fontana, M.; Gillmore, J.D. Transthyretin cardiac amyloidosis. Cardiovasc. Res. 2023, 118, 3517–3535. [Google Scholar] [CrossRef] [PubMed] [PubMed Central]
- Carrabba, N.; Amico, M.A.; Guaricci, A.I.; Carella, M.C.; Maestrini, V.; Monosilio, S.; Pedrotti, P.; Ricci, F.; Monti, L.; Figliozzi, S.; et al. CMR Mapping: The 4th-Era Revolution in Cardiac Imaging. J. Clin. Med. 2024, 13, 337. [Google Scholar] [CrossRef] [PubMed] [PubMed Central]
- Garcia-Pavia, P.; Rapezzi, C.; Adler, Y.; Arad, M.; Basso, C.; Brucato, A.; Burazor, I.; Caforio, A.L.P.; Damy, T.; Eriksson, U.; et al. Diagnosis and treatment of cardiac amyloidosis: A position statement of the ESC Working Group on Myocardial and Pericardial Diseases. Eur. Heart J. 2021, 42, 1554–1568. [Google Scholar] [CrossRef] [PubMed]
- Muller, S.A.; Peiró-Aventin, B.; Biagioni, G.; Tini, G.; Saturi, G.; Kronberger, C.; Achten, A.; Dobner, S.; Rijdt, W.P.T.; Gasperetti, A.; et al. Evaluation of the 2021 ESC recommendations for family screening in hereditary transthyretin cardiac amyloidosis. Eur. J. Heart Fail. 2024, 26, 2025–2034. [Google Scholar] [CrossRef]
- Smiseth, O.A.; Rider, O.; Cvijic, M.; Valkovič, L.; Remme, E.W.; Voigt, J.U. Myocardial Strain Imaging: Theory, Current Practice, and the Future. JACC Cardiovasc. Imaging 2025, 18, 340–381. [Google Scholar] [CrossRef] [PubMed]
- Sperry, B.W.; Hanna, M.; Maurer, M.S.; Nativi-Nicolau, J.; Floden, L.; Stewart, M.; Wyrwich, K.W.; Barsdorf, A.I.; Kapadia, H.; Spertus, J.A. Association of Tafamidis with Health Status in Patients with ATTR Cardiac Amyloidosis: A Post Hoc Analysis of the ATTR-ACT Randomized Clinical Trial. JAMA Cardiol. 2023, 8, 275–280. [Google Scholar] [CrossRef] [PubMed] [PubMed Central]
- Gillmore, J.D.; Maurer, M.S.; Falk, R.H.; Merlini, G.; Damy, T.; Dispenzieri, A.; Wechalekar, A.D.; Berk, J.L.; Quarta, C.C.; Grogan, M.; et al. Nonbiopsy Diagnosis of Cardiac Transthyretin Amyloidosis. Circulation 2016, 133, 2404–2412. [Google Scholar] [CrossRef]
- Messroghli, D.R.; Moon, J.C.; Ferreira, V.M.; Grosse-Wortmann, L.; He, T.; Kellman, P.; Mascherbauer, J.; Nezafat, R.; Salerno, M.; Schelbert, E.B.; et al. Clinical recommendations for cardiovascular magnetic resonance mapping of T1, T2, T2* and extracellular volume: A consensus statement by the Society for Cardiovascular Magnetic Resonance (SCMR) endorsed by the European Association for Cardiovascular Imaging (EACVI). J. Cardiovasc. Magn. Reson. 2017, 19, 75. [Google Scholar] [CrossRef]
- Galea, N.; Polizzi, G.; Gatti, M.; Cundari, G.; Figuera, M.; Faletti, R. Cardiovascular magnetic resonance (CMR) in restrictive cardiomyopathies. Radiol. Med. 2020, 125, 1072–1086. [Google Scholar] [CrossRef] [PubMed]
- Robinson, A.A.; Chow, K.; Salerno, M. Myocardial T1 and ECV Measurement: Underlying Concepts and Technical Considerations. JACC Cardiovasc. Imaging 2019, 12, 2332–2344. [Google Scholar] [CrossRef]
- Karamitsos, T.D.; Piechnik, S.K.; Banypersad, S.M.; Fontana, M.; Ntusi, N.B.; Ferreira, V.M.; Whelan, C.J.; Myerson, S.G.; Robson, M.D.; Hawkins, P.N.; et al. Noncontrast T1 Mapping for the Diagnosis of Cardiac Amyloidosis. JACC Cardiovasc. Imaging 2013, 6, 488–497. [Google Scholar] [CrossRef] [PubMed]
- Wong, T.C.; Piehler, K.; Meier, C.G.; Testa, S.M.; Klock, A.M.; Aneizi, A.A.; Shakesprere, J.; Kellman, P.; Shroff, S.G.; Schwartzman, D.S.; et al. Association Between Extracellular Matrix Expansion Quantified by Cardiovascular Magnetic Resonance and Short-Term Mortality. Circulation 2012, 126, 1206–1216. [Google Scholar] [CrossRef] [PubMed]
- Pan, J.A.; Kerwin, M.J.; Salerno, M. Native T1 Mapping, Extracellular Volume Mapping, and Late Gadolinium Enhancement in Cardiac Amyloidosis: A Meta-Analysis. JACC Cardiovasc. Imaging 2020, 13, 1299–1310. [Google Scholar] [CrossRef]
- Martinez-Naharro, A.; Kotecha, T.; Norrington, K.; Boldrini, M.; Rezk, T.; Quarta, C.; Treibel, T.A.; Whelan, C.J.; Knight, D.S.; Kellman, P.; et al. Native T1 and Extracellular Volume in Transthyretin Amyloidosis. JACC Cardiovasc. Imaging 2019, 12, 810–819. [Google Scholar] [CrossRef]
- Fontana, M.; Banypersad, S.M.; Treibel, T.A.; Maestrini, V.; Sado, D.M.; White, S.K.; Pica, S.; Castelletti, S.; Piechnik, S.K.; Robson, M.D.; et al. Native T1 mapping in transthyretin amyloidosis. JACC Cardiovasc. Imaging 2014, 7, 157–165. [Google Scholar] [CrossRef]
- Urbano-Moral, J.A.; Rowin, E.J.; Maron, M.S.; Crean, A.; Pandian, N.G. Investigation of global and regional myocardial mechanics with 3-dimensional speckle tracking echocardiography and relations to hypertrophy and fibrosis in hypertrophic cardiomyopathy. Circ. Cardiovasc. Imaging 2014, 7, 11–19. [Google Scholar] [CrossRef]
- Ruberg, F.L.; Berk, J.L. Transthyretin (TTR) cardiac amyloidosis. Circulation 2012, 126, 1286–1300. [Google Scholar] [CrossRef] [PubMed] [PubMed Central]
- Claus, P.; Omar, A.M.S.; Pedrizzetti, G.; Sengupta, P.P.; Nagel, E. Tissue Tracking Technology for Assessing Cardiac Mechanics: Principles, Normal Values, and Clinical Applications. JACC Cardiovasc. Imaging 2015, 8, 1444–1460. [Google Scholar] [CrossRef] [PubMed]
- Sengupta, P.P.; Narula, J. Reclassifying heart failure: Predominantly subendocardial, subepicardial, and transmural. Heart Fail. Clin. 2008, 4, 379–382. [Google Scholar] [CrossRef]
- Protonotarios, A.; Savvatis, K. Myocardial strain analysis in family screening for genetic dilated cardiomyopathy: Testing the boundaries of normality? Int. J. Cardiol. 2021, 323, 201–202. [Google Scholar] [CrossRef] [PubMed]
- Meucci, M.C.; Lillo, R.; Lombardo, A.; Lanza, G.A.; Bootsma, M.; Butcher, S.C.; Massetti, M.; Manna, R.; Bax, J.J.; Crea, F.; et al. Comparative analysis of right ventricular strain in Fabry cardiomyopathy and sarcomeric hypertrophic cardiomyopathy. Eur. Heart J. Cardiovasc. Imaging 2023, 24, 542–551. [Google Scholar] [CrossRef] [PubMed] [PubMed Central]
- Pofi, R.; Giannetta, E.; Galea, N.; Francone, M.; Campolo, F.; Barbagallo, F.; Gianfrilli, D.; Venneri, M.A.; Filardi, T.; Cristini, C.; et al. Diabetic Cardiomiopathy Progression is Triggered by miR122-5p and Involves Extracellular Matrix: A 5-Year Prospective Study. JACC Cardiovasc. Imaging 2021, 14, 1130–1142. [Google Scholar] [CrossRef] [PubMed]
- Knight, D.S.; Zumbo, G.; Barcella, W.; Steeden, J.A.; Muthurangu, V.; Martinez-Naharro, A.; Treibel, T.A.; Abdel-Gadir, A.; Bulluck, H.; Kotecha, T.; et al. Cardiac Structural and Functional Consequences of Amyloid Deposition by Cardiac Magnetic Resonance and Echocardiography and Their Prognostic Roles. JACC Cardiovasc. Imaging 2019, 12, 823–833. [Google Scholar] [CrossRef] [PubMed]
- Vijapurapu, R.; Nordin, S.; Baig, S.; Liu, B.; Rosmini, S.; Augusto, J.; Tchan, M.; Hughes, D.A.; Geberhiwot, T.; Moon, J.C.; et al. Global longitudinal strain, myocardial storage and hypertrophy in Fabry disease. Heart 2019, 105, 470–476. [Google Scholar] [CrossRef] [PubMed]
- Phelan, D.; Collier, P.; Thavendiranathan, P.; Popović, Z.B.; Hanna, M.; Plana, J.C.; Marwick, T.H.; Thomas, J.D. Relative Apical Sparing of longitudinal Strain Using Two-Dimensional Speckle-Tracking Echocardiography is Both Sensitive and Specific for the Diagnosis of Cardiac Amyloidosis. Heart 2012, 98, 1442–1448. [Google Scholar] [CrossRef]
- Monte, I.P.; Faro, D.C.; Trimarchi, G.; de Gaetano, F.; Campisi, M.; Losi, V.; Teresi, L.; Di Bella, G.; Tamburino, C.; de Gregorio, C. Left Atrial Strain Imaging by Speckle Tracking Echocardiography: The Supportive Diagnostic Value in Cardiac Amyloidosis and Hypertrophic Cardiomyopathy. J. Cardiovasc. Dev. Dis. 2023, 10, 261. [Google Scholar] [CrossRef]
- Pambianchi, G.; Marchitelli, L.; Cundari, G.; Ruoli, L.; Conia, L.; Catalano, C.; Galea, N. Takotsubo syndrome: Left atrial and ventricular myocardial strain impairment in the subacute and convalescent phases assessed by CMR. Eur. Radiol. Exp. 2024, 8, 34. [Google Scholar] [CrossRef] [PubMed] [PubMed Central]
- Rausch, K.; Scalia, G.M.; Sato, K.; Edwards, N.; Lam, A.K.Y.; Platts, D.G.; Chan, J. Left atrial strain imaging differentiates cardiac amyloidosis and hypertensive heart disease. Int. J. Cardiovasc. Imag. 2021, 37, 81–90. [Google Scholar] [CrossRef]
- Griffin, J.M.; Rosenblum, H.; Maurer, M.S. Pathophysiology and Therapeutic Approaches to Cardiac Amyloidosis. Circ. Res. 2021, 128, 1554–1575. [Google Scholar] [CrossRef] [PubMed] [PubMed Central]
- Meucci, M.C.; Lillo, R.; Mango, F.; Marsilia, M.; Iannaccone, G.; Tusa, F.; Luigetti, M.; Biagini, E.; Massetti, M.; Lanza, G.A.; et al. Left atrial structural and functional remodelling in Fabry disease and cardiac amyloidosis: A comparative analysis. Int. J. Cardiol. 2024, 402, 131891. [Google Scholar] [CrossRef] [PubMed]
- Halfmann, M.C.; Altmann, S.; Schoepf, U.J.; Reichardt, C.; Hennermann, J.B.; Kreitner, K.F.; Kloeckner, R.; Hahn, F.; Dueber, C.; Varga-Szemes, A.; et al. Left atrial strain correlates with severity of cardiac involvement in Anderson-Fabry disease. Eur. Radiol. 2023, 33, 2039–2051. [Google Scholar] [CrossRef] [PubMed]


| Group 1 ATTR-CA | Group 2 ATTR-MC | Group 3 Controls | CA vs. MC p-Value | CA vs. C p-Value | MC vs. C p-Value | |
|---|---|---|---|---|---|---|
| Age, y | 77.2 ± 8.8 | 52.7 ± 10.3 | 47.0 ± 12.2 | <0.001 ** | <0.001 ** | 0.274 |
| Male, n (%) | 11 (55%) | 8 (40%) | 6 (30%) | 0.527 | 0.200 | 0.741 |
| BSA, m2 | 1.79 ± 0.19 | 1.82 ± 0.19 | 1.70 ± 0.17 | 1.000 | 0.334 | 0.107 |
| HR, bpm | 76.2 ± 11.0 | 76.4 ± 10.3 | 80.0 ± 10.7 | 1.000 | 0.521 | 0.573 |
| sBP, mmHg | 120.9 ± 12.0 | 120.9 ± 10.5 | 120.0 ± 11.2 | 1.000 | 1.000 | 1.000 |
| dBP, mmHg | 73.3 ± 6.3 | 73.3 ± 6.5 | 80.0 ± 6.4 | 1.000 | 1.000 | 1.000 |
| eGFR, mL/min | 61.6 ± 16.8 | 88.9 ± 16.6 | 100.0 ± 16.7 | <0.001 ** | <0.001 ** | 0.036 * |
| Positivity to [99mTc] PYP scintigraphy, n (%) | 20 (100%) | 0 (0%) | N/A | <0.001 ** | N/A | N/A |
| Scintigraphy visual score, n | 2.74 ± 0.44 | 0.0 ± 0 | N/A | <0.001 ** | N/A | N/A |
| Positivity to Urine/Serum IFE, n (%) | 0 (0%) | 0 (0%) | N/A | 1.000 | N/A | N/A |
| Group 1 ATTR-CA | Group 2 ATTR-MC | Group 3 HC | CA vs. MC p-Value | CA vs. HC p-Value | MC vs. HC p-Value | |
|---|---|---|---|---|---|---|
| LV EDVi, mL/m2 | 85.9 ± 26.0 | 74.7± 12.8 | 74.0 ± 11.5 | 0.165 | 0.124 | 1 |
| LV ESVi, mL/m2 | 50.4 ± 22.4 | 30.7 ± 7.6 | 28.8 ± 5.8 | <0.001 ** | <0.001 ** | 1 |
| LV EF, % | 43.4 ± 12.1 | 59.2 ± 5.9 | 61.3 ± 3.8 | <0.001 ** | <0.001 ** | 0.703 |
| LV MWT, mm | 19.7 ± 3.9 | 9.9 ± 1.62 | 9.5 ± 1.6 | <0.001 ** | <0.001 ** | 1 |
| LV MMi, g/m2 | 86.9 ± 28.3 | 46.5 ± 9.4 | 43.2 ± 8.5 | <0.001 ** | <0.001 ** | 1 |
| LA EDVi, mL/m2 | 51.1 ± 19.6 | 14.3 ± 6.5 | 11.7 ± 3.4 | <0.001 ** | <0.001 ** | 1 |
| LA ESVi, mL/m2 | 65.6 ± 25.5 | 32.0 ± 12.0 | 32.1 ± 9.6 | <0.001 ** | <0.001 ** | 1 |
| Group 1 ATTR-CA | Group 2 ATTR-MC | Group 3 HC | CA vs. MC p-Value | CA vs. HC p-Value | MC vs. HC p-Value | |
|---|---|---|---|---|---|---|
| LV Edema, n (%) | 0/20 (0%) | 0/20 (0%) | 0/20 (0%) | N/A | N/A | N/A |
| LV LGE, n (%) | 20/20 (100%) | 0/20 (0%) | 0/20 (0%) | N/A | N/A | N/A |
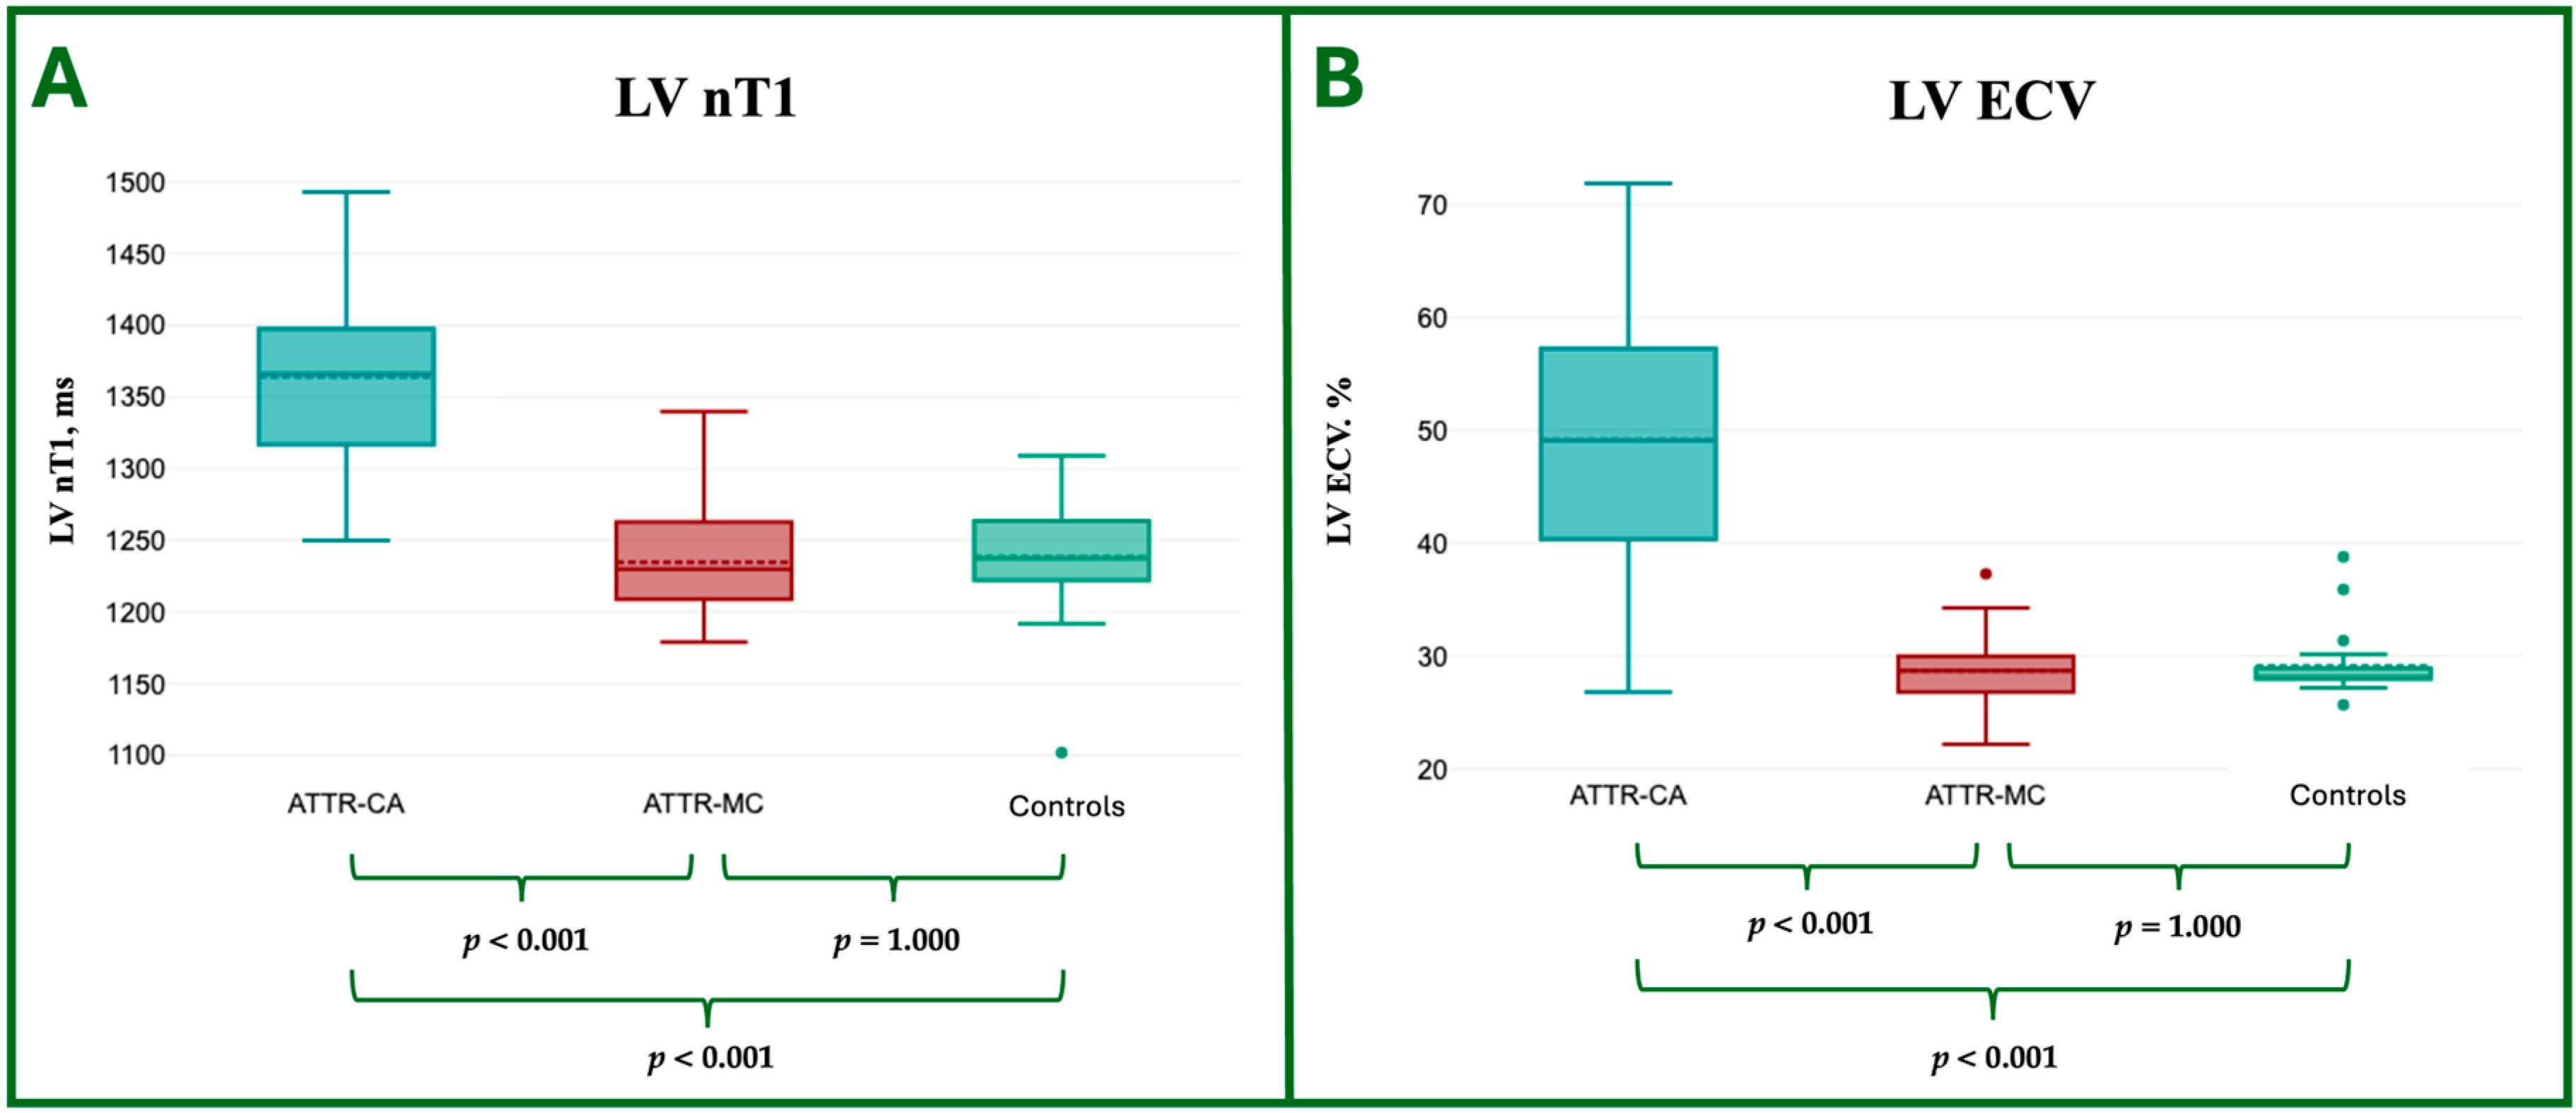
| LV nT1, ms | 1364.3 ± 66.5 | 1234.8 ± 38.1 | 1238.3 ± 45.3 | <0.001 ** | <0.001 ** | 1 |
| LV T2, ms | 43.5 ± 2.8 | 42.7 ± 5.1 | 41.1 ± 3.5 | 1 | 0.193 | 0.608 |
| LV ECV, % | 49.2 ± 12.6 | 28.7 ± 3.9 | 29.1 ± 3.1 | <0.001 ** | <0.001 ** | 1 |
| Group 1 ATTR-CA | Group 2 ATTR-MC | Group 3 Controls | CA vs. MC p-Value | CA vs. HC p-Value | MC vs. HC p-Value | |
|---|---|---|---|---|---|---|
| LV GLS, % | −8.8 ± 3.9 | −15.6 ± 2.1 | −18.4 ± 1.0 | <0.001 ** | <0.001 ** | 0.004 ** |
| LV BAS-LS, % | −9.0 ± 5.8 | −16.1 ± 4.3 | −20.7 ± 1.7 | <0.001 ** | <0.001 ** | 0.003 ** |
| LV MID-LS, % | −7.5 ± 5.5 | −14.3 ± 3.9 | −17.5 ± 2.0 | <0.001 ** | <0.001 ** | 0.046 * |
| LV API-LS, % | −11.9 ± 5.8 | −17.4 ± 4.0 | −19.5 ± 2.9 | <0.001 ** | <0.001 ** | 0.39 |
| LV GCS, % | −11.2 ± 4.1 | −17.1 ± 2.6 | −18.6 ± 2.2 | <0.001 ** | <0.001 ** | 0.345 |
| LV BAS-CS, % | −11.2 ± 3.1 | −18.9 ± 2.7 | −19.7 ± 3.1 | <0.001 ** | <0.001 ** | 1 |
| LV MID-CS, % | −11.2 ± 4.6 | −16.9 ± 2.7 | −17.4 ± 2.3 | <0.001 ** | <0.001 ** | 1 |
| LV API-CS, % | −13.8 ± 5.6 | −19.1 ± 3.6 | −21.7 ± 3.2 | <0.001 ** | <0.001 ** | 0.189 |
| LA RS, % | −12.0 ± 2.2 | −19.8 ± 2.8 | −22.8 ± 3.5 | <0.001 ** | <0.001 ** | 0.007 ** |
| LA CS, % | −6.8 ± 1.8 | −9.4 ± 1.9 | −14.8 ± 3.2 | 0.003 ** | <0.001 ** | <0.001 ** |
| LA BPS, % | 5.2 ± 1.7 | 10.5 ± 2.2 | −8.0 ± 3.0 | <0.001 ** | 0.002 ** | 0.005 ** |
Disclaimer/Publisher’s Note: The statements, opinions and data contained in all publications are solely those of the individual author(s) and contributor(s) and not of MDPI and/or the editor(s). MDPI and/or the editor(s) disclaim responsibility for any injury to people or property resulting from any ideas, methods, instructions or products referred to in the content. |
© 2025 by the authors. Licensee MDPI, Basel, Switzerland. This article is an open access article distributed under the terms and conditions of the Creative Commons Attribution (CC BY) license (https://creativecommons.org/licenses/by/4.0/).
Share and Cite
Conia, L.; Filatova, D.; Pambianchi, G.; Marchitelli, L.; Cundari, G.; Stancanelli, G.; Alfarano, M.; Marchionni, G.; Chimenti, C.; Catalano, C.; et al. Subclinical Cardiac Involvement in Asymptomatic ATTR Mutation Carriers: Insights from Cardiac MRI, Myocardial Strain, and Mapping Techniques. J. Cardiovasc. Dev. Dis. 2025, 12, 172. https://doi.org/10.3390/jcdd12050172
Conia L, Filatova D, Pambianchi G, Marchitelli L, Cundari G, Stancanelli G, Alfarano M, Marchionni G, Chimenti C, Catalano C, et al. Subclinical Cardiac Involvement in Asymptomatic ATTR Mutation Carriers: Insights from Cardiac MRI, Myocardial Strain, and Mapping Techniques. Journal of Cardiovascular Development and Disease. 2025; 12(5):172. https://doi.org/10.3390/jcdd12050172
Chicago/Turabian StyleConia, Luca, Daria Filatova, Giacomo Pambianchi, Livia Marchitelli, Giulia Cundari, Giuseppe Stancanelli, Maria Alfarano, Giulia Marchionni, Cristina Chimenti, Carlo Catalano, and et al. 2025. "Subclinical Cardiac Involvement in Asymptomatic ATTR Mutation Carriers: Insights from Cardiac MRI, Myocardial Strain, and Mapping Techniques" Journal of Cardiovascular Development and Disease 12, no. 5: 172. https://doi.org/10.3390/jcdd12050172
APA StyleConia, L., Filatova, D., Pambianchi, G., Marchitelli, L., Cundari, G., Stancanelli, G., Alfarano, M., Marchionni, G., Chimenti, C., Catalano, C., & Galea, N. (2025). Subclinical Cardiac Involvement in Asymptomatic ATTR Mutation Carriers: Insights from Cardiac MRI, Myocardial Strain, and Mapping Techniques. Journal of Cardiovascular Development and Disease, 12(5), 172. https://doi.org/10.3390/jcdd12050172