Article

The Synergistic Risk of Insulin Resistance and Renal Dysfunction in Acute Coronary Syndrome Patients After Percutaneous Coronary Intervention

1
Department of Cardiology, The Third People’s Hospital of Chengdu, Chengdu 610014, China
2
Department of Integrated Traditional Chinese and Western Internal Medicine, The General Hospital of Central Theater Command, Wuhan 430000, China
3
Institute of Clinical Medical Sciences, China-Japan Friendship Hospital, Chinese Academy of Medical Sciences, Peking Union Medical College, Beijing 100029, China
*
Authors to whom correspondence should be addressed.
These authors contributed equally to this work.
J. Cardiovasc. Dev. Dis. 2025, 12(11), 427; https://doi.org/10.3390/jcdd12110427
Submission received: 9 September 2025 / Revised: 14 October 2025 / Accepted: 17 October 2025 / Published: 28 October 2025

Abstract

Background: Despite percutaneous coronary intervention (PCI) for revascularization, patients with acute coronary syndrome (ACS) still face residual risks of adverse outcomes. Insulin resistance (IR) and renal impairment are independent predictors of poor prognosis in these patients, yet their interaction and underlying mechanisms linked to post-PCI outcomes remain incompletely elucidated. Methods: A retrospective cohort study was conducted involving patients with ACS who underwent PCI at the Third People’s Hospital of Chengdu from July 2018 to December 2020. Insulin resistance (IR) was quantified using the triglyceride–glucose (TyG) index, and renal function was evaluated via the estimated glomerular filtration rate (eGFR). The primary endpoint was major adverse cardiovascular events (MACEs), a composite of all-cause death, non-fatal myocardial infarction, non-fatal stroke, and unplanned revascularization. Multivariable Cox proportional hazards regression and mediation analyses were applied to explore the associations of TyG index and eGFR with patient prognosis, and to quantify the mediating effect of eGFR on the relationship between TyG index and prognosis. Results: A total of 1340 patients with ACS were included in the final analysis. Over a median follow-up duration of 31.02 (interquartile range [IQR]: 27.34–35.03) months, 124 patients (9.25%) experienced MACEs. After adjusting for potential confounders, both the TyG index and eGFR were identified as significant independent predictors of MACEs in the overall population and across predefined subgroups. Specifically, each one-unit increase in the TyG index was associated with a 73.8% higher risk of MACEs (HR 1.738; 95% CI 1.273–2.372), whereas each ten-unit decrease in eGFR was linked to a 12.7% increased MACEs risk (HR 1.127; 95% CI 1.032–1.232). Importantly, after further adjustment for confounders, eGFR significantly mediated 9.63% of the total effect of the TyG index on MACEs risk. Conclusions: Renal impairment partially mediates the association between IR and adverse cardiovascular outcomes in ACS patients undergoing PCI. This finding underscores the clinical importance of the metabolic–cardiorenal axis in this population, suggesting that a comprehensive assessment targeting both IR and renal function-related pathways may enhance risk-stratification accuracy and optimize therapeutic strategies for ACS patients.

1. Background

Patients with acute coronary syndrome (ACS) still face high long-term risk of major adverse cardiovascular events (MACEs) despite percutaneous coronary intervention (PCI) [1,2]. Thus, early risk stratification is clinically valuable for enhancing their long-term prognosis. Insulin resistance (IR) is a key driver of type 2 diabetes, atherosclerosis, and metabolic disorders and is strongly linked to cardiovascular disease progression and adverse outcomes [3,4,5]. The triglyceride–glucose index (TyG index), which evaluates the body’s insulin sensitivity by fasting blood glucose and triglyceride, has been validated as a simple and reliable alternative indicator of IR [6,7] and is now widely used in clinical research [8]. Recent studies have shown that an elevated TyG index is independently associated with the incidence and progression of various cardiovascular diseases, including myocardial infarction [9], coronary artery calcification [10,11], peripheral artery disease [12], and stroke [13].
Renal impairment is also recognized as a well-established risk factor for cardiovascular disease, including coronary artery disease (CAD), heart failure (HF), arrhythmias, and sudden cardiac death [14,15]. Renal impairment exacerbates cardiovascular risk through mechanisms such as uremic toxin accumulation, chronic inflammation, and fluid overload [16]. Recent research has confirmed that the risk for cardiovascular events increases with declining estimated glomerular filtration rate (eGFR) [17], and reduced eGFR was independently associated with medium-term mortality in ACS patients [18].
Critically, IR and renal impairment are pathophysiologically bidirectionally linked: IR promotes renal damage via glomerular hyperfiltration and fibrosis, while renal impairment exacerbates IR through altered insulin metabolism [19,20]. A national cohort study from China demonstrated that renal impairment mediates the association between IR and the incidence of cardiovascular disease in a general healthy population [21]. However, the study focused on a healthy Chinese population aged over 45 years, and its findings may not be fully generalizable to broader or diseased populations. Thus, it remains unclear whether the “insulin resistance–renal impairment-cardiovascular events” pathway is still significant in ACS patients following PCI.
Therefore, this study aimed to investigate the relationship between IR (assessed by the TyG index) and renal impairment (evaluated by eGFR) with long-term adverse outcomes in ACS patients following PCI, and to verify the potential mediating role of renal impairment in this association.

2. Methods

2.1. Study Population

The study consecutively enrolled patients hospitalized at the Third People’s Hospital of Chengdu (Chengdu, Sichuan, China) from July 2018 to December 2020. The inclusion criteria were as follows: (1) age ≥ 18 years; and (2) confirmed diagnosis of ACS according to standard clinical criteria and undergoing PCI. The exclusion criteria included the following: (1) loss to follow-up; (2) presence of severe underlying diseases; (3) diagnosis of stable angina pectoris; (4) incomplete critical medical data exceeding 10%; and (5) in-hospital death. A total of 1340 patients were included in the final analysis. This study was approved by the institutional review board and adhered to the Declaration of Helsinki. Informed consent was obtained from all participants.

2.2. Data Collection and Definitions

Sociodemographic and clinical data were extracted from electronic medical records. Variables collected included age, sex, height, weight, smoking status, medical history, systolic blood pressure (SBP), heart rate, laboratory results, left-ventricular ejection fraction (LVEF), diagnostic details, and medication use. ACS encompassed conditions such as unstable angina (UA), ST-segment elevation myocardial infarction (STEMI), and non-ST-segment elevation myocardial infarction (NSTEMI), diagnosed according to contemporary guidelines [22]. Medical history included prior PCI, chronic obstructive pulmonary disease (COPD), hypertension, diabetes mellitus, and stroke. Hypertension was defined as SBP ≥ 140 mmHg, diastolic blood pressure (DBP) ≥ 90 mmHg, or current use of anti-hypertensive medication [23]. Diabetes mellitus was diagnosed based on any of the following criteria: fasting glucose ≥ 7 mmol/L, random venous glucose ≥ 11.1 mmol/L, glycated hemoglobin (HbA1c) ≥ 6.5%, 2 h oral glucose tolerance test (OGTT) ≥ 11.1 mmol/L, or current use of anti-diabetic medication [24]. Body mass index (BMI) was calculated as body weight (kg)/height2 (m2).

2.3. Assessment of TyG Index and SYNTAX Score

The TyG index was calculated using the following formula: ln [TG (mg/dL) × FBG (mg/dL)/2]. The baseline SYNTAX score (bSS) was determined using an online calculator (http://syntaxscore.com/, accessed on 1 April 2023), with two independent evaluators analyzing the preprocedural angiograms without knowledge of initial clinical features and outcomes. Discrepancies were resolved by a third evaluator. All data were entered into a dedicated database and assessed for quality.

2.4. Outcome Definition

All patients were followed up at 1, 6, and 12 months after discharge, and annually thereafter. The primary endpoint was major adverse cardiovascular events (MACEs), a composite of all-cause death, non-fatal myocardial infarction, non-fatal stroke, and unplanned revascularization. The secondary endpoint included all-cause death, cardiac death, non-fatal myocardial infarction, non-fatal stroke, and unplanned revascularization. All endpoints were adjudicated by experienced clinicians and verified against medical records when available.

2.5. Statistical Analyses

Continuous variables are presented as mean ± standard deviation (SD) or median with interquartile range (IQR), based on distribution normality. Group comparisons were made using Student’s t-test or the Mann–Whitney U test, as appropriate. Categorical variables are summarized as frequencies and percentages, and comparisons between groups were performed using the chi-square test or Fisher’s exact test. Correlations among variables were evaluated using Pearson’s correlation coefficients and visualized via a heatmap. The cumulative incidence of adverse cardiovascular outcomes in different groups was estimated using the Kaplan–Meier method, stratified by TyG index and eGFR groups, with between-group differences assessed by log-rank tests.
The dose–response relationships of eGFR and the TyG index with MACEs risk were illustrated using restricted cubic splines (RCS) curves. Cox proportional hazards models were employed to assess associations between the TyG index, eGFR, and adverse cardiovascular outcomes. Hazard ratios (HRs) with 95% confidence interval (CI) were calculated within a time-to-event framework. Subgroup analyses were conducted to evaluate the consistency of the predictive utility of the TyG index and eGFR across different demographic and clinical characteristics. Mediation analysis was performed using VanderWeele’s two-stage regression method for survival data [5] to assess the extent to which eGFR mediates the association between the TyG index (exposure) and MACEs (outcome).
In mediation, subgroup, and Cox regression analyses, multiple adjusted models were used to ensure robustness: Model I was adjusted for age, sex, BMI, hypertension, diabetes mellitus, smoking, and previous PCI; Model II was adjusted for age, BMI, diabetes mellitus, AMI, heart rate, fibrinogen (Fib), bSS, LVEF, diuretics, and insulin; and Model III was adjusted for age, sex, BMI, hypertension, diabetes mellitus, smoking, previous PCI, AMI, heart rate, Fib, baseline SYNTAX score (bSS), LVEF, diuretics, and insulin.
All statistical analyses were performed with SPSS 24.0 (IBM, Armonk, New York, NY, USA), R Programming Language 4.0.2, Stata/MP 16.0 software, and MedCalc19.1 (MedCalc software, Ostend, Belgium). All tests were two-sided, and a p-value < 0.05 was considered statistically significant.

3. Results

3.1. Baseline Characteristics

Ultimately, a total of 1340 eligible ACS patients were included. The average age of participants was 67.02 ± 11.21 years, with 956 (71.34%) males. Based on the occurrence of the primary endpoint, patients were divided into the MACEs group (n = 124) and non-MACEs group (n = 1216). The demographic characteristics and clinical baseline characteristics of patients in the two groups are shown in Table 1, and patients who experienced MACEs were significantly older, and had higher rates of COPD, diabetes mellitus, and myocardial infarction. They also exhibited significantly higher levels of cardiac troponin T (cTnT), B-type natriuretic peptide (BNP), uric acid, serum creatinine, cystatin C, homocysteine (Hcy), Fib, baseline SYNTAX score (bSS), and TyG index values (all p < 0.05). Conversely, eGFR and LVEF were significantly lower in the MACEs group (all p < 0.05). Furthermore, a heatmap demonstrated a significant negative relationship between the TyG index and eGFR (p < 0.001; Figure 1).

3.2. Association Between TyG Index, eGFR, and the Incidence of MACEs

Over a median follow-up of 31.02 (27.34, 35.03) months, 124 (9.25%) patients experienced MACEs. Among the patients, 88 patients experienced all-cause death, 55 patients experienced cardiac death, 47 patients experienced stroke, 40 patients experienced myocardial infarction, and 120 patients experienced unplanned revascularization. Compared with patients with a lower TyG index (<9.05), those with a higher TyG index (≥9.05) had a significantly higher incidence of MACEs, all-cause death, and cardiac death. In contrast, lower eGFR (<60 mL/min/1.73 m2) was significantly associated with a higher incidence of MACEs, all-cause death, and cardiac death (all p < 0.05, Table S1).
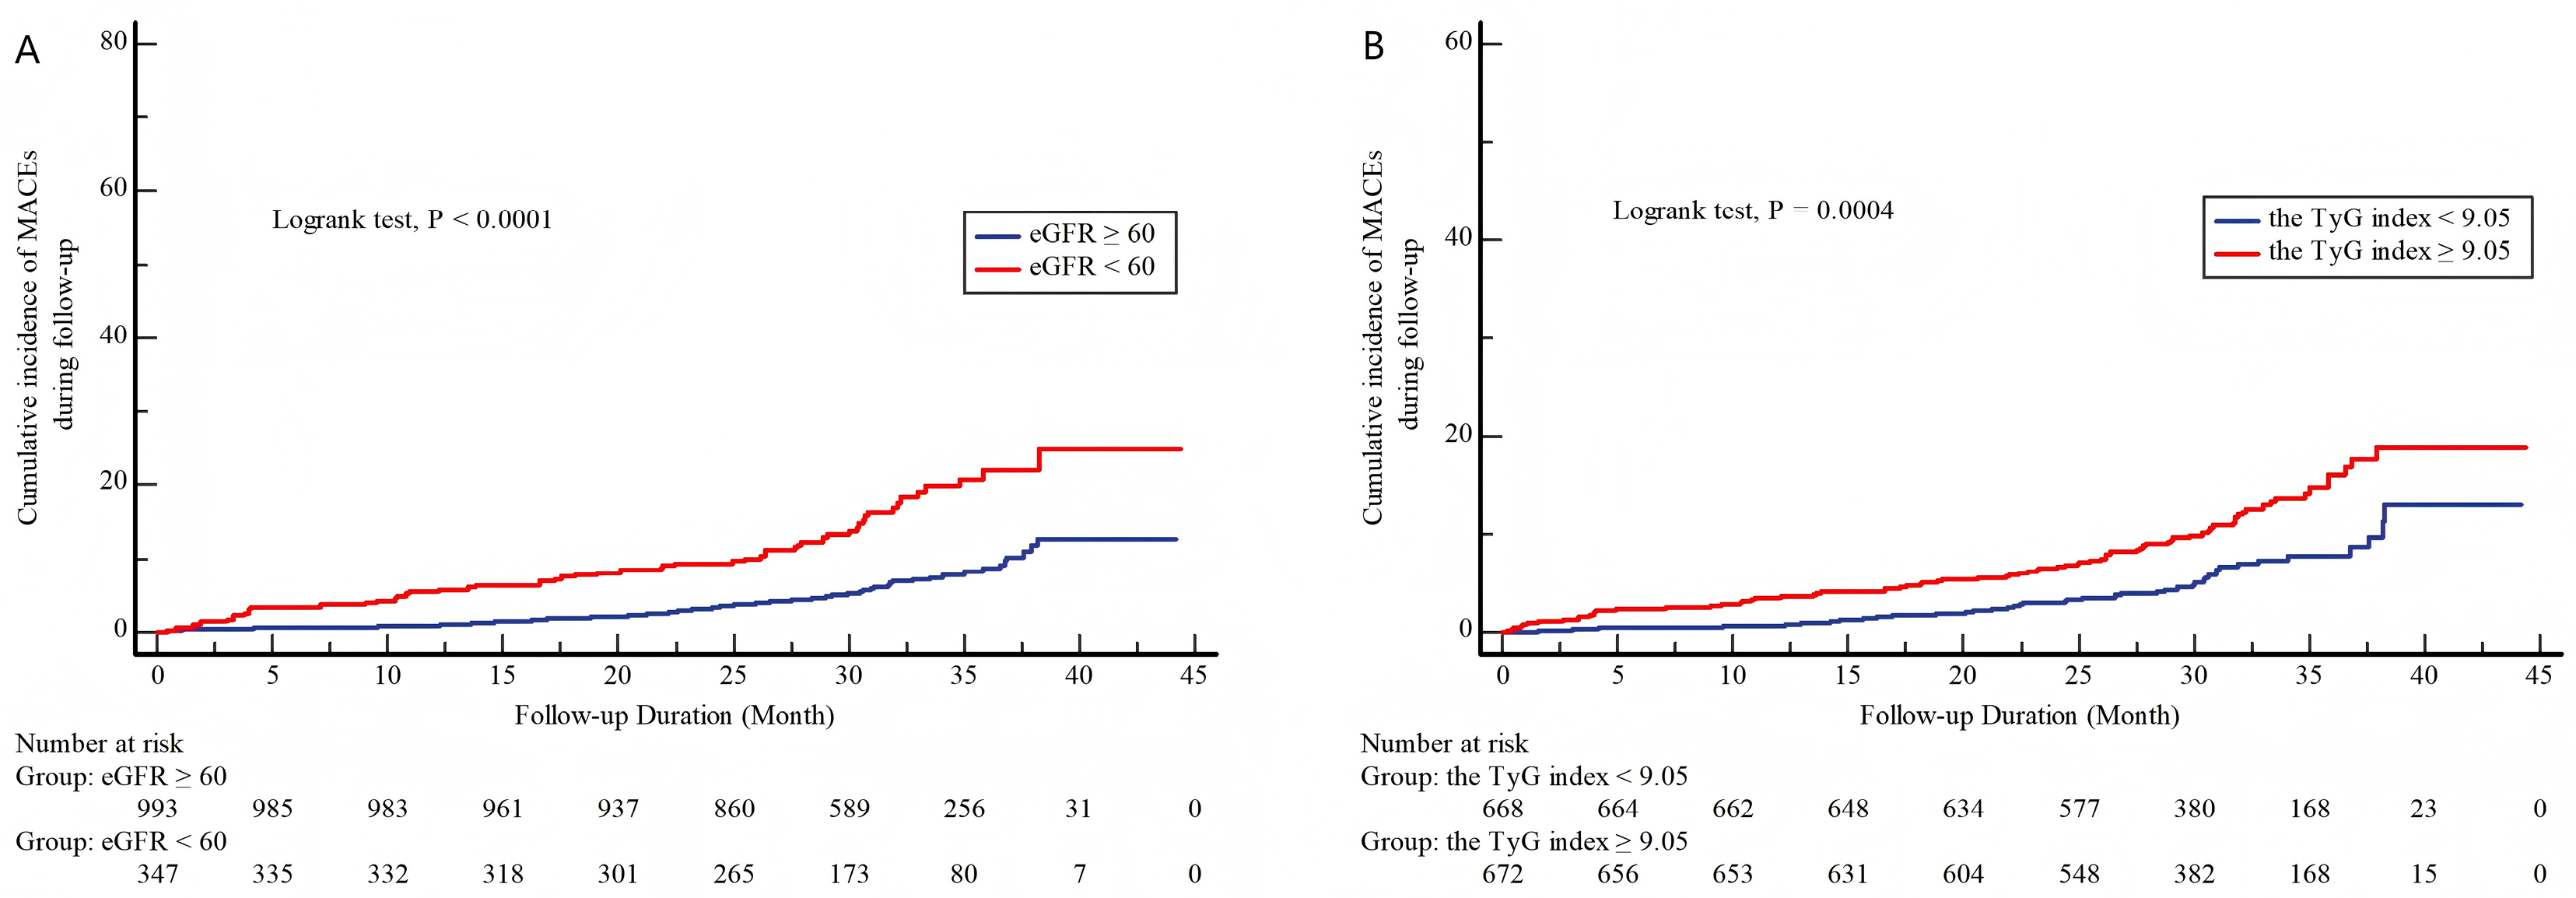
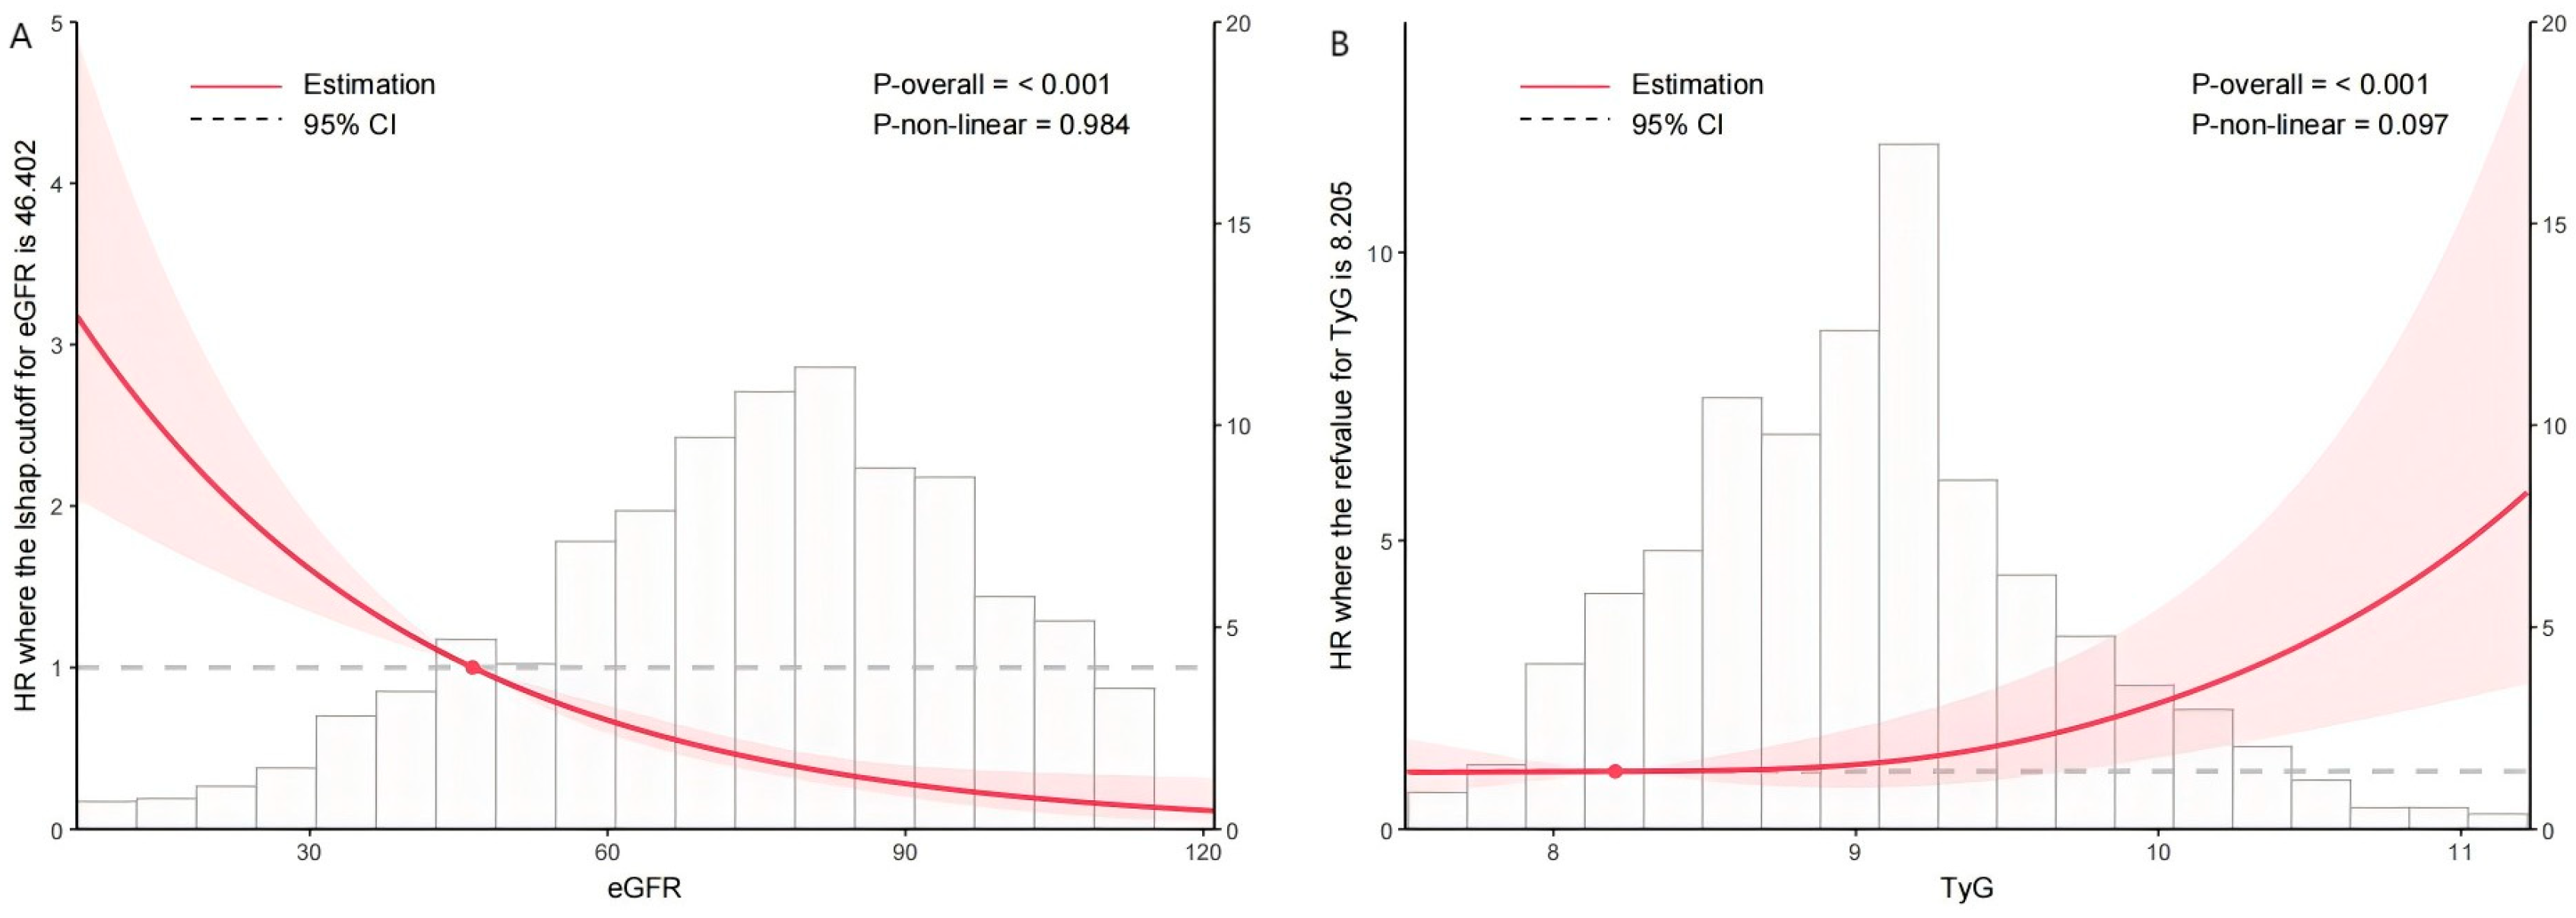
Kaplan–Meier analysis confirmed that lower eGFR and higher TyG index were significantly associated with a higher cumulative incidence of MACEs in ACS patients (all p < 0.05, Figure 2). Restricted cubic spline (RCS) analysis revealed a linear inverse relationship between eGFR and MACEs risk and a positive dose–response relationship between TyG index and MACEs risk (Figure 3).

3.3. Univariable and Multivariable Cox Regression Analyses

Univariate Cox regression indicated that age, AMI, diabetes mellitus, heart rate, serum creatinine, cystatin C, eGFR, fibrinogen, bSS, TyG index, LVEF, and the use of diuretics and insulin were significantly associated with the risk of MACEs (all p < 0.05, Table S2).
In multivariate analysis, both an elevated TyG index (unadjusted model: HR 1.620, 95% CI 1.301–2.016, p < 0.001; Model I: HR 1.731, 95% CI 1.282–2.337, p < 0.001; Model II: HR 1.728, 95% CI 1.278–2.336, p < 0.001; and Model III: HR 1.738, 95% CI 1.273–2.372, p < 0.001) and a declining eGFR (unadjusted model: HR 1.338, 95% CI 1.125–1.432, p < 0.001; Model I: HR 1.205, 95% CI 1.110–1.309, p < 0.001; Model II: HR 1.128, 95% CI 1.035–1.230, p = 0.006; and Model III: HR 1.127, 95% CI 1.032–1.232, p = 0.008) were independently associated with an increased risk of MACEs. Similar associations were observed for all-cause death (p < 0.05, Table 2).

3.4. The Predictive Value of the TyG Index and eGFR for MACEs in Various Subgroups

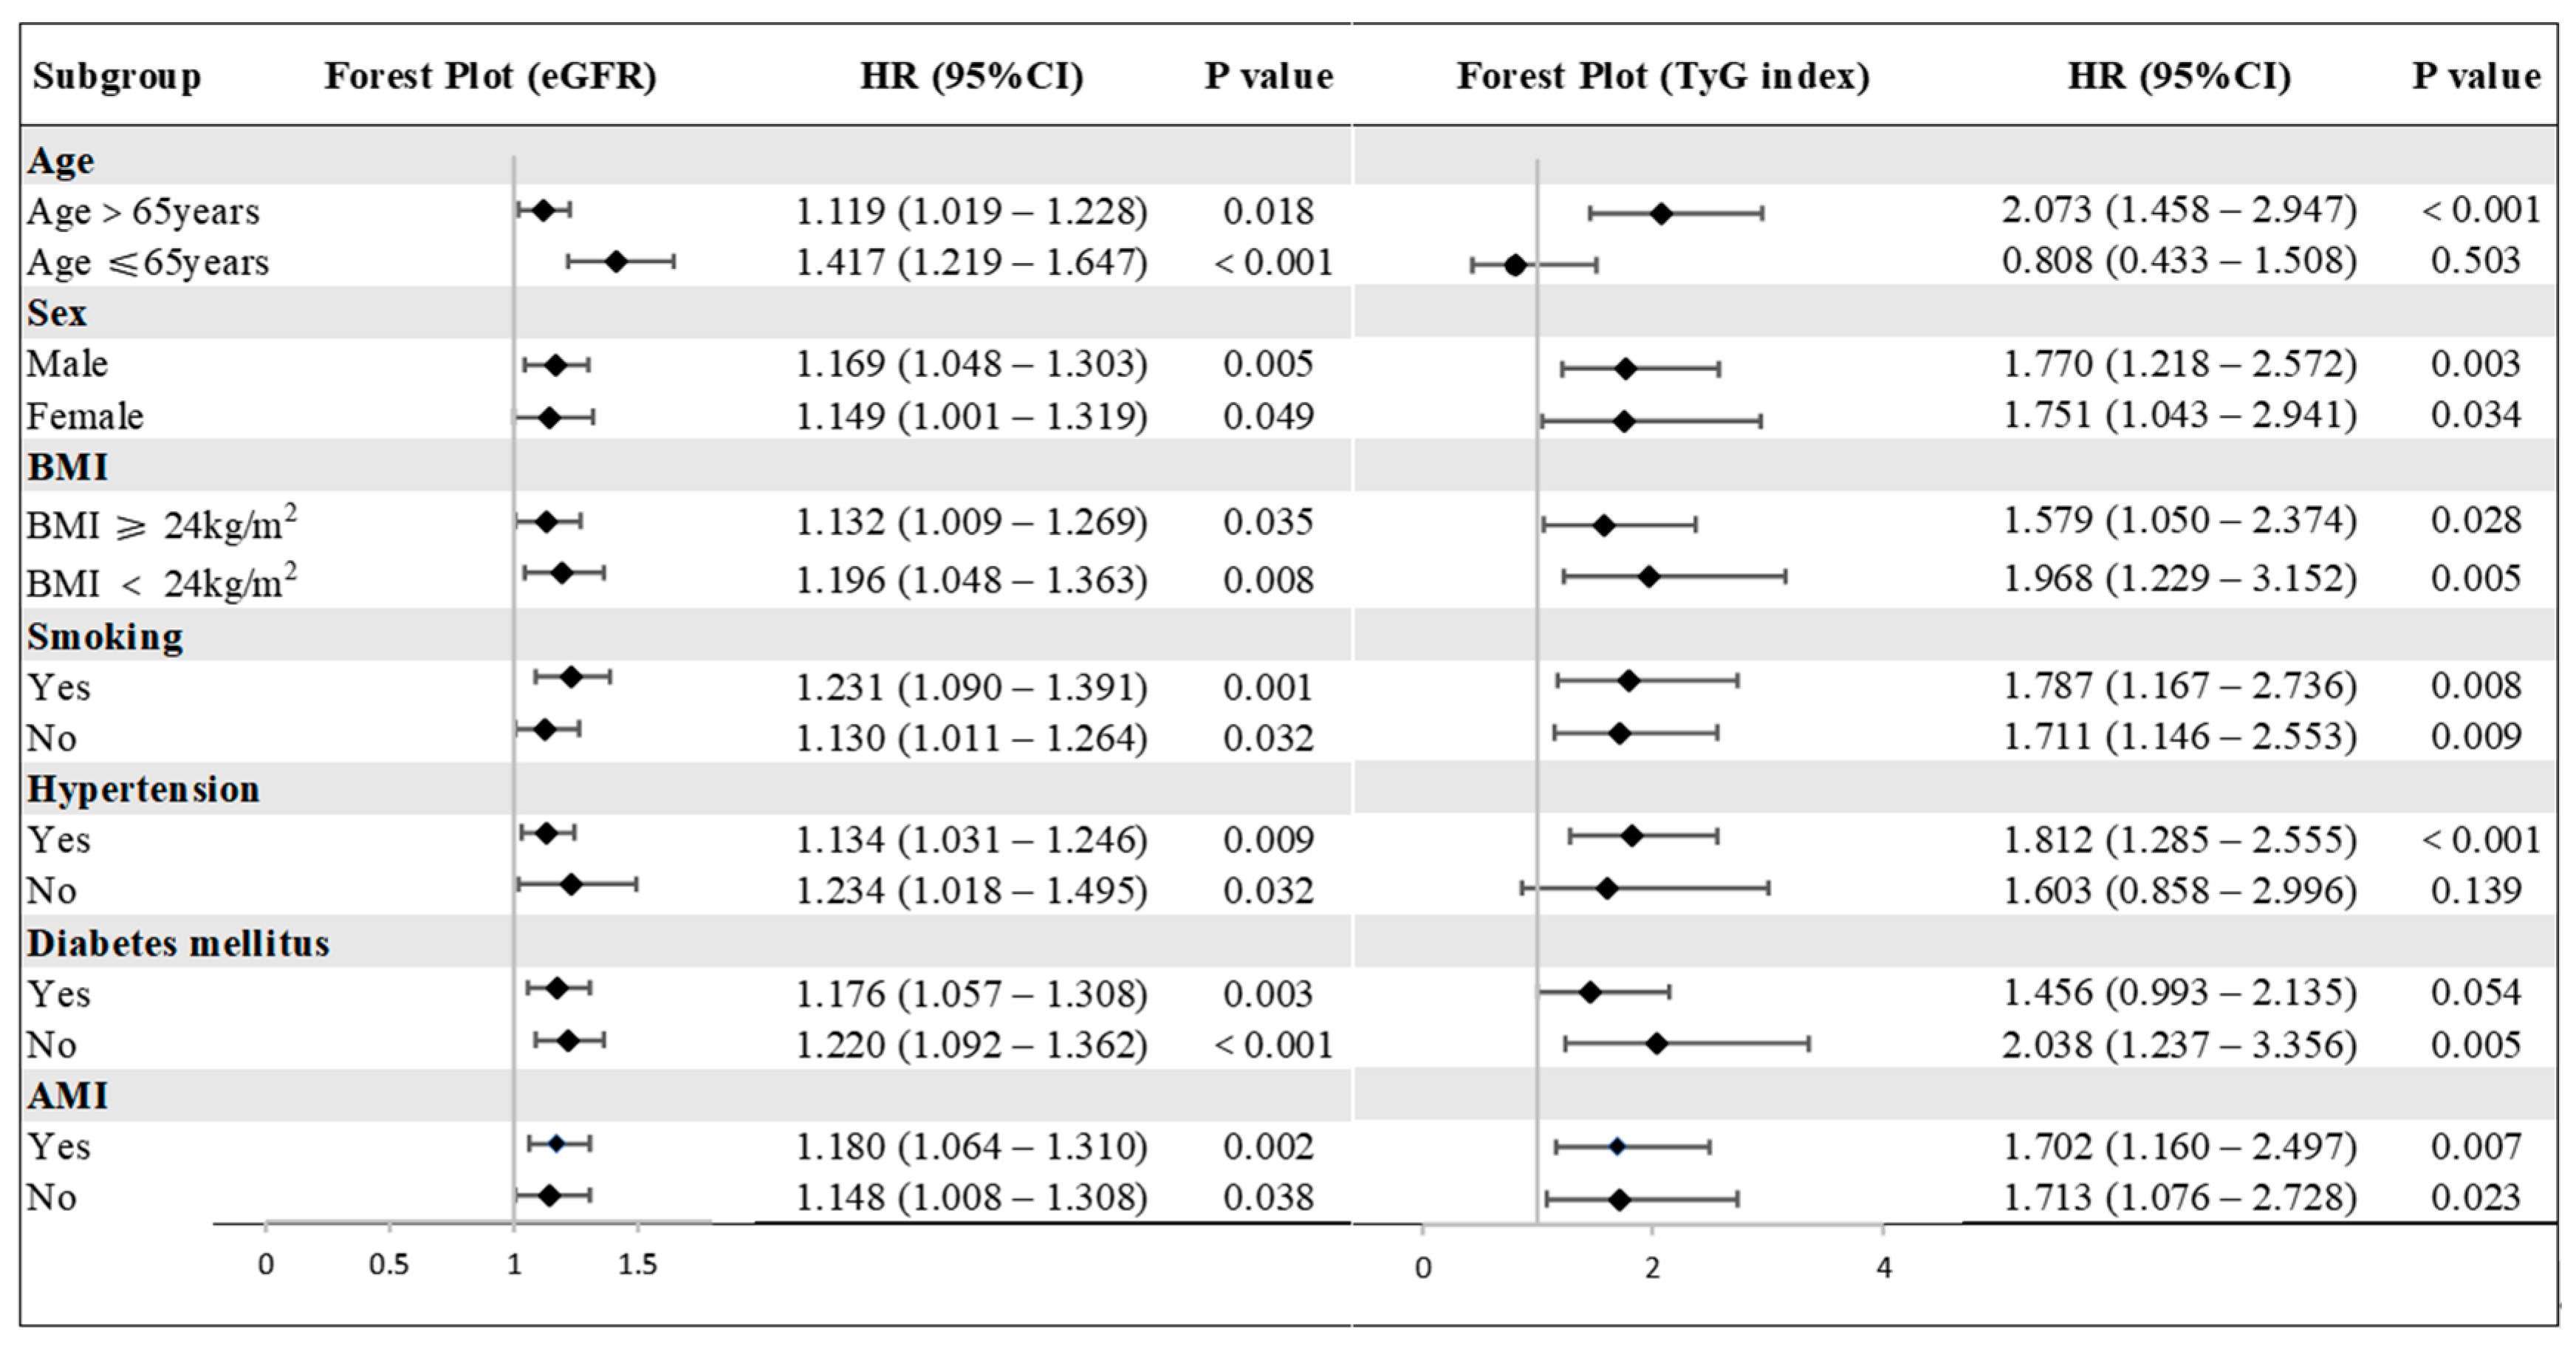
Subgroup analyses assessed the consistency of the predictive value of the TyG index and eGFR across various patient characteristics stratified by age, sex, BMI, smoking status, diabetes, hypertension, and AMI (Figure 4). After multivariable adjustment, eGFR remained a significant predictor of MACEs across all subgroups (all p < 0.05). The TyG index was significantly associated with MACEs risk in patients regardless of sex, BMI, smoking status, or AMI diagnosis (all p < 0.05). In other subgroups, the TyG index was significantly associated with MACEs risk only in patients aged over 65 years, those with hypertension, or those without diabetes (all p < 0.05).

3.5. Mediation Analysis

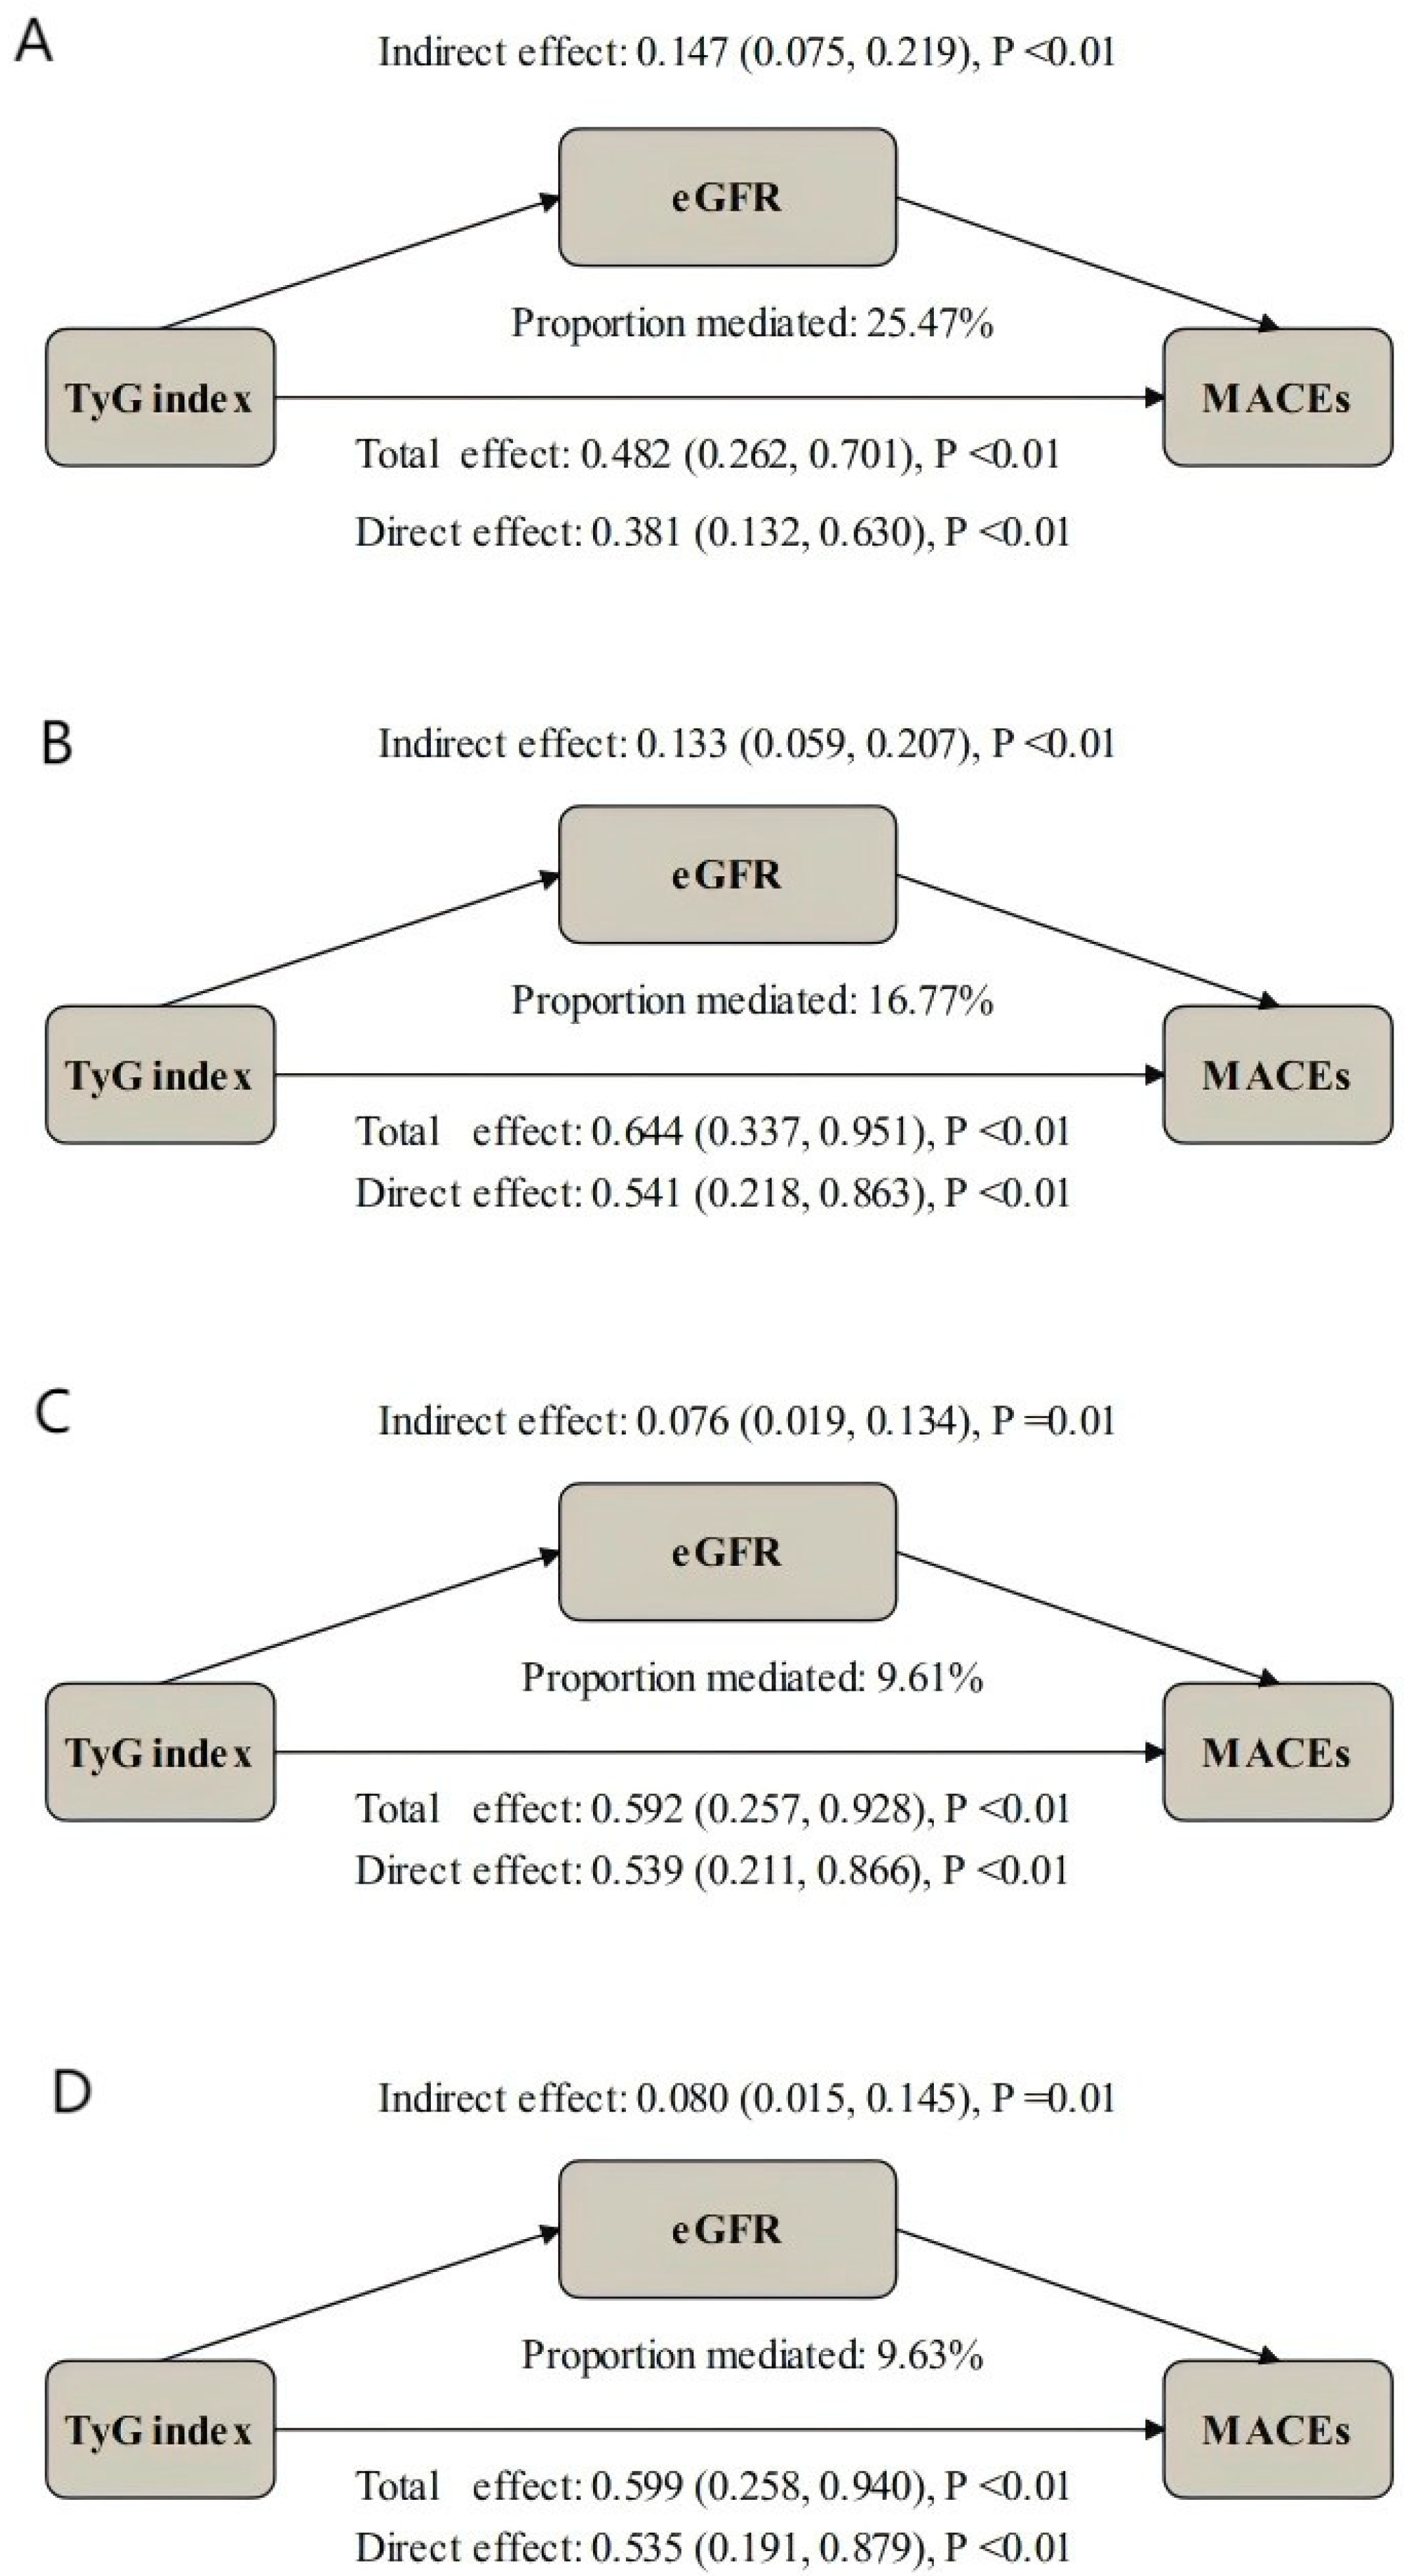
Given the independent associations of both TyG and eGFR with MACEs and their significant correlation with each other, we further investigated whether renal function mediates this relationship. Mediation analysis demonstrated that eGFR significantly partially mediated the relationship between the TyG index and MACEs incidence across all adjusted models (Table 3; Figure 5). The mediation proportions of eGFR were 25.47% (95%CI: 13.52, 53.90%, p < 0.01), 16.77% (CI: 7.75, 33.64%, p < 0.01), 9.61% (CI: 1.17, 23.79%, p = 0.02), and 9.63% (CI: 1.77, 23.40%, p = 0.01) in the unadjusted, adjusted Model I, adjusted Model II, and adjusted Model III analyses, respectively.

4. Discussion

This retrospective cohort study demonstrates that both an elevated baseline TyG index and a reduced level of eGFR are significantly associated with a higher incidence of MACEs in patients with ACS after PCI—even after adjusting for potential confounders. Importantly, reduced eGFR partially mediated the relationship between the TyG index and the hazard of MACEs. These findings suggest that IR exacerbates adverse cardiovascular outcomes in ACS patients, at least in part, through the deterioration of renal function.
IR, as a core feature of systemic metabolic disorder, is directly involved in the progression of coronary atherosclerosis [3]. It drives the formation and progression of atherosclerotic plaques through impaired endothelial function [25], activated inflammatory responses [26], and dyslipidemia [27,28]. The TyG index, a simple and economical surrogate marker of IR [6], is closely related to cardiovascular and cerebrovascular diseases [29]. The China Cardiovascular Disease Medical Quality Improvement Project-Acute Coronary Syndrome (CCC-ACS) multicenter cohort study revealed that in ACS patients, the TyG index was significantly positively correlated with the risk of in-hospital adverse cardiovascular outcomes after PCI [30]. Similarly, studies based on the US National Health and Nutrition Examination Survey (NHANES) and the Iranian Isfahan cohort demonstrated a dose–response relationship between the TyG index and all-cause mortality in general coronary heart disease populations [31,32], supporting its utility as a cross-population risk marker. Our results align with these studies, showing a strong positive association between the TyG index and MACEs across multiple models and subgroups. Each one-unit increase in the TyG index was associated with a 73.8% increase in MACEs risk in the fully adjusted model. Furthermore, the predictive performance of the TyG index varied across subgroups. It was significantly associated with MACEs in patients older than 65 years but not in younger individuals, possibly due to age-related declines in metabolic reserve and amplified cardiovascular damage from IR [33,34]. Additionally, the TyG index has a significantly strong risk prediction for non-diabetic populations, but not for diabetic populations, likely due to the ubiquitous presence of IR in diabetic populations which may diminish the discriminative power of the TyG index [35].
Epidemiological evidence consistently demonstrates that renal impairment correlates with the severity of coronary artery disease, increased risks of in-hospital cardiac death, and long-term all-cause mortality in ACS patients [17,18]. Consistent with previous studies, our study revealed that eGFR was significantly negatively associated with the hazard of MACEs in ACS patients, with each ten-unit decrease in eGFR corresponding to a 12.7% increase in risk of MACEs. The relationship involves multiple pathways. First of all, renal impairment promotes cardiovascular damage through the accumulation of uremic toxins (such as urea, systemic inflammatory factors, p-cresyl sulfate and indoxyl sulfate) which induce oxidative stress, inflammation, and endothelial dysfunction, thereby accelerating atherosclerosis and plaque destabilization [36,37,38,39,40,41]. Secondly, renal insufficiency leads to lipid metabolism disorder, characterized by increased triglycerides, LDL and VLDL levels, decreased HDL-C, or carbamoylation of HDL, which induces cholesterol accumulation in macrophages and accelerates atherosclerotic lesion progression [42,43]. Furthermore, renal failure can accelerate CAD by the renin–angiotensin–aldosterone system (RAAS) [44,45], pre-calcification pathway [38], advanced glycation end-products (sRAGE) [46], and intestinal microbiome [47] and IR, promoting the progression of coronary atherosclerosis or acute cardiovascular events [38].
Additionally, we found a significant negative correlation between the TyG index and eGFR. IR contributes to peripheral microvascular dysfunction [16], and the kidney is a major target of microvascular damage in metabolic diseases. Under IR conditions, increased glucose load in renal tubules activates the tubuloglomerular feedback mechanism [20], promoting abnormal glomerular hemodynamics [48,49]. Concurrently, lipotoxicity induces podocyte apoptosis and renal tubular interstitial fibrosis through oxidative stress, endoplasmic reticulum stress, mitochondrial dysfunction, and inflammation [50], collectively leading to progressive and irreversible nephron damage and reduced eGFR.
Most importantly, mediation analysis confirmed that renal impairment significantly mediates part of the relationship between IR and MACEs risk, consistent with findings from another national cohort study [21]. The mediation analysis revealed that renal impairment accounted for 9.63% of the total TyG–MACEs association, even after adjusting for confounders. This indicates that insulin resistance contributes to cardiovascular risk not only directly through metabolic effects on the heart but also indirectly by promoting renal impairment. This finding further validates the concept of “cardio-kidney metabolic syndrome”, where metabolic disturbances, renal impairment, and cardiovascular damage form a vicious cycle which leads to multiorgan dysfunction [51], significantly amplifying the adverse outcomes risk in ACS patients. Practically and clinically, serial monitoring of the TyG index and eGFR may enhance risk stratification in ACS patients post-PCI. For high-risk populations, combined therapeutic strategies targeting IR and renal protection such as using GLP-1 agonists and sodium–glucose cotransporter-2 inhibitors [52] may have greater clinical benefits.

Strength and Limitations

This study employs rigorous statistical methods to quantify the mediating role of renal impairment in the association between insulin resistance and long-term MACEs in ACS patients. This study’s finding provides a pathophysiological perspective on how metabolic disorders contribute to cardiovascular risks in high-risk populations, transcending the limitations of traditional correlation analyses. Furthermore, the study is based on a sizable cohort (n = 1340) with a relatively long and complete follow-up (median 31.02 months), and all endpoints were rigorously adjudicated against medical records, enhancing the reliability of the results.
However, several limitations should be acknowledged. First, as this study employed a retrospective design, despite adjustment for extensive clinical and laboratory confounders, it may still be subject to residual confounding due to dietary habits, genetic predisposition, or medication adherence. Second, our assessment of renal function relied on eGFR, without incorporating more sensitive and specific biomarkers of early renal damage (such as neutrophil gelatinase-associated lipocalin [53] and kidney injury molecule-1 [54]). This might have led to an underestimation of the true mediating effect of renal impairment in the pathway between TyG index and MACEs. Third, the study population was recruited from a single center in China, which may limit the generalizability of our findings to other ethnic or healthcare settings. Therefore, it is necessary to carry out prospective, multicenter studies that include novel renal biomarkers, and dynamic measurements of both TyG index and eGFR are warranted to validate and extend our conclusions. Additionally, further research should explore other potential mediators in the pathway between IR and cardiovascular outcomes to provide a more comprehensive understanding of their underlying mechanisms.

5. Conclusions

Our study demonstrates that renal impairment is a significant partial mediator in the association between IR and adverse cardiovascular outcomes in ACS patients. This finding underscores the importance of the metabolic–cardiorenal axis in ACS patients. A comprehensive assessment and management strategy addressing both IR and renal function may improve risk stratification and therapeutic outcomes for this high-risk population.

Supplementary Materials

The following supporting information can be downloaded at https://www.mdpi.com/article/10.3390/jcdd12110427/s1. Table S1. Comparison of Long-Term Adverse Prognosis Stratified by eGFR and TyG index Categories. Table S2. Univariate Cox regression analysis for MACEs.

Author Contributions

G.Y. prepared an initial draft of the manuscript. G.Y., M.J. and L.L. were major contributors to the collection, interpretation, and analysis of information. D.J., J.F. (Jie Feng)., Y.L., T.Y., L.X., H.L., Z.Z. and J.F. (Jinjuan Fu). were responsible for the acquisition of patient data and played an important role in the management of follow-up. Q.C. and L.C. provided constructive comments and suggestions, and revised the manuscript for important intellectual content. S.X. was the architect of the study and gave final approval for the manuscript submitted. All authors contributed to editorial changes in the manuscript. All authors have participated sufficiently in the work and agreed to be accountable for all aspects of the work. All authors have read and agreed to the published version of the manuscript.

Funding

This work was supported by a grant from the Natural Science Foundation of Sichuan Province (2024NSFSC1709) and The Scientific Research Project of The Third People’s Hospital of Chengdu (CSY-YN-01-2023-041, CSY-YN-03-2024-018).

Institutional Review Board Statement

The study was approved by the medical ethics committee of the Third People’s Hospital of Chengdu and strictly adhered to the Declaration of Helsinki. (protocol code 2023-S-36, approval date: 20 March 2023).

Informed Consent Statement

Informed consent was obtained from all subjects involved in the study.

Data Availability Statement

The datasets used and/or analyzed during the study are available from the corresponding author upon reasonable request.

Conflicts of Interest

The authors report no conflicts of interest in this work.

References

  1. Mensah, G.A.; Fuster, V.; Murray, C.J.L.; Roth, G.A. Global Burden of Cardiovascular Diseases and Risks, 1990–2022. J. Am. Coll. Cardiol. 2023, 82, 2350–2473. [Google Scholar] [CrossRef]
  2. Gogineni, V.S.; Shah, K.B. High-Risk Percutaneous Coronary Intervention: Challenges and Considerations. CVIA 2024, 9, 949. [Google Scholar] [CrossRef]
  3. Lee, S.H.; Park, S.Y.; Choi, C.S. Insulin Resistance: From Mechanisms to Therapeutic Strategies. Diabetes Metab. J. 2022, 46, 15–37. [Google Scholar] [CrossRef] [PubMed]
  4. Iglesies-Grau, J.; Garcia-Alvarez, A.; Oliva, B.; Mendieta, G.; García-Lunar, I.; Fuster, J.J.; Devesa, A.; Pérez-Herreras, C.; Fernández-Ortiz, A.; Brugada, R.; et al. Early insulin resistance in normoglycemic low-risk individuals is associated with subclinical atherosclerosis. Cardiovasc. Diabetol. 2023, 22, 350. [Google Scholar] [CrossRef]
  5. Chen, Q.; Xiong, S.; Ye, T.; Gao, Y.; Wang, J.; Li, X.; Li, Y.; Cui, C.; Liu, H.; Zhang, Z.; et al. Insulin resistance, coronary artery lesion complexity and adverse cardiovascular outcomes in patients with acute coronary syndrome. Cardiovasc. Diabetol. 2024, 23, 172. [Google Scholar] [CrossRef] [PubMed]
  6. Guerrero-Romero, F.; Simental-Mendía, L.E.; González-Ortiz, M.; Martínez-Abundis, E.; Ramos-Zavala, M.G.; Hernández-González, S.O.; Jacques-Camarena, O.; Rodríguez-Morán, M. The product of triglycerides and glucose, a simple measure of insulin sensitivity. Comparison with the euglycemic-hyperinsulinemic clamp. J. Clin. Endocrinol. Metab. 2010, 95, 3347–3351. [Google Scholar] [CrossRef] [PubMed]
  7. Son, D.H.; Lee, H.S.; Lee, Y.J.; Lee, J.H.; Han, J.H. Comparison of triglyceride-glucose index and HOMA-IR for predicting prevalence and incidence of metabolic syndrome. Nutr. Metab. Cardiovasc. Dis. 2022, 32, 596–604. [Google Scholar] [CrossRef]
  8. Huang, D.; Ma, R.; Zhong, X.; Jiang, Y.; Lu, J.; Li, Y.; Shi, Y. Positive association between different triglyceride glucose index-related indicators and psoriasis: Evidence from NHANES. Front. Immunol. 2023, 14, 1325557. [Google Scholar] [CrossRef] [PubMed]
  9. Liu, X.; Tan, Z.; Huang, Y.; Zhao, H.; Liu, M.; Yu, P.; Ma, J.; Zhao, Y.; Zhu, W.; Wang, J. Relationship between the triglyceride-glucose index and risk of cardiovascular diseases and mortality in the general population: A systematic review and meta-analysis. Cardiovasc. Diabetol. 2022, 21, 124. [Google Scholar] [CrossRef] [PubMed]
  10. Won, K.B.; Park, E.J.; Han, D.; Lee, J.H.; Choi, S.Y.; Chun, E.J.; Park, S.H.; Han, H.W.; Sung, J.; Jung, H.O.; et al. Triglyceride glucose index is an independent predictor for the progression of coronary artery calcification in the absence of heavy coronary artery calcification at baseline. Cardiovasc. Diabetol. 2020, 19, 34. [Google Scholar] [CrossRef]
  11. Park, K.; Ahn, C.W.; Lee, S.B.; Kang, S.; Nam, J.S.; Lee, B.K.; Kim, J.H.; Park, J.S. Elevated TyG Index Predicts Progression of Coronary Artery Calcification. Diabetes Care 2019, 42, 1569–1573. [Google Scholar] [CrossRef]
  12. Gao, J.W.; Hao, Q.Y.; Gao, M.; Zhang, K.; Li, X.Z.; Wang, J.F.; Vuitton, D.A.; Zhang, S.L.; Liu, P.M. Triglyceride-glucose index in the development of peripheral artery disease: Findings from the Atherosclerosis Risk in Communities (ARIC) Study. Cardiovasc. Diabetol. 2021, 20, 126. [Google Scholar] [CrossRef]
  13. Yang, Y.; Huang, X.; Wang, Y.; Leng, L.; Xu, J.; Feng, L.; Jiang, S.; Wang, J.; Yang, Y.; Pan, G.; et al. The impact of triglyceride-glucose index on ischemic stroke: A systematic review and meta-analysis. Cardiovasc. Diabetol. 2023, 22, 2. [Google Scholar] [CrossRef]
  14. Sarnak, M.J.; Levey, A.S.; Schoolwerth, A.C.; Coresh, J.; Culleton, B.; Hamm, L.L.; McCullough, P.A.; Kasiske, B.L.; Kelepouris, E.; Klag, M.J.; et al. Kidney disease as a risk factor for development of cardiovascular disease: A statement from the American Heart Association Councils on Kidney in Cardiovascular Disease, High Blood Pressure Research, Clinical Cardiology, and Epidemiology and Prevention. Hypertension 2003, 42, 1050–1065. [Google Scholar] [CrossRef] [PubMed]
  15. Jankowski, J.; Floege, J.; Fliser, D.; Böhm, M.; Marx, N. Cardiovascular Disease in Chronic Kidney Disease: Pathophysiological Insights and Therapeutic Options. Circulation 2021, 143, 1157–1172. [Google Scholar] [CrossRef]
  16. Marassi, M.; Fadini, G.P. The cardio-renal-metabolic connection: A review of the evidence. Cardiovasc. Diabetol. 2023, 22, 195. [Google Scholar] [CrossRef] [PubMed]
  17. Go, A.S.; Chertow, G.M.; Fan, D.; McCulloch, C.E.; Hsu, C.Y. Chronic kidney disease and the risks of death, cardiovascular events, and hospitalization. N. Engl. J. Med. 2004, 351, 1296–1305. [Google Scholar] [CrossRef] [PubMed]
  18. Toso, A.; Leoncini, M.; Maioli, M.; Villani, S.; Bellandi, F. Biomarkers of residual risk and all-cause mortality after acute coronary syndrome. Am. J. Prev. Cardiol. 2025, 21, 100934. [Google Scholar] [CrossRef]
  19. Li, Y.; Liu, Y.; Liu, S.; Gao, M.; Wang, W.; Chen, K.; Huang, L.; Liu, Y. Diabetic vascular diseases: Molecular mechanisms and therapeutic strategies. Signal Transduct. Target. Ther. 2023, 8, 152. [Google Scholar] [CrossRef]
  20. Forbes, J.M.; Cooper, M.E. Mechanisms of diabetic complications. Physiol. Rev. 2013, 93, 137–188. [Google Scholar] [CrossRef]
  21. Cui, C.; Liu, L.; Zhang, T.; Fang, L.; Mo, Z.; Qi, Y.; Zheng, J.; Wang, Z.; Xu, H.; Yan, H.; et al. Triglyceride-glucose index, renal function and cardiovascular disease: A national cohort study. Cardiovasc. Diabetol. 2023, 22, 325. [Google Scholar] [CrossRef]
  22. Rao, S.V.; O’Donoghue, M.L.; Ruel, M.; Rab, T.; Tamis-Holland, J.E.; Alexander, J.H.; Baber, U.; Baker, H.; Cohen, M.G.; Cruz-Ruiz, M.; et al. 2025 ACC/AHA/ACEP/NAEMSP/SCAI Guideline for the Management of Patients With Acute Coronary Syndromes: A Report of the American College of Cardiology/American Heart Association Joint Committee on Clinical Practice Guidelines. Circulation 2025, 151, e771–e862. [Google Scholar] [CrossRef]
  23. McEvoy, J.W.; McCarthy, C.P.; Bruno, R.M.; Brouwers, S.; Canavan, M.D.; Ceconi, C.; Christodorescu, R.M.; Daskalopoulou, S.S.; Ferro, C.J.; Gerdts, E.; et al. 2024 ESC Guidelines for the management of elevated blood pressure and hypertension. Eur. Heart J. 2024, 45, 3912–4018. [Google Scholar] [CrossRef]
  24. ElSayed, N.A.; Aleppo, G.; Aroda, V.R.; Bannuru, R.R.; Brown, F.M.; Bruemmer, D.; Collins, B.S.; Hilliard, M.E.; Isaacs, D.; Johnson, E.L.; et al. 2. Classification and Diagnosis of Diabetes: Standards of Care in Diabetes-2023. Diabetes Care 2023, 46, S19–S40. [Google Scholar] [CrossRef]
  25. Steinberg, H.O.; Chaker, H.; Leaming, R.; Johnson, A.; Brechtel, G.; Baron, A.D. Obesity/insulin resistance is associated with endothelial dysfunction. Implications for the syndrome of insulin resistance. J. Clin. Investig. 1996, 97, 2601–2610. [Google Scholar] [CrossRef] [PubMed]
  26. Wu, W.; Sui, W.; Chen, S.; Guo, Z.; Jing, X.; Wang, X.; Wang, Q.; Yu, X.; Xiong, W.; Ji, J.; et al. Sweetener aspartame aggravates atherosclerosis through insulin-triggered inflammation. Cell Metab. 2025, 37, 1075–1088. [Google Scholar] [CrossRef] [PubMed]
  27. Ormazabal, V.; Nair, S.; Elfeky, O.; Aguayo, C.; Salomon, C.; Zuñiga, F.A. Association between insulin resistance and the development of cardiovascular disease. Cardiovasc. Diabetol. 2018, 17, 122. [Google Scholar] [CrossRef] [PubMed]
  28. Hill, M.A.; Yang, Y.; Zhang, L.; Sun, Z.; Jia, G.; Parrish, A.R.; Sowers, J.R. Insulin resistance, cardiovascular stiffening and cardiovascular disease. Metabolism 2021, 119, 154766. [Google Scholar] [CrossRef]
  29. Zhang, Y.; Ding, X.; Hua, B.; Liu, Q.; Gao, H.; Chen, H.; Zhao, X.Q.; Li, W.; Li, H. High triglyceride-glucose index is associated with adverse cardiovascular outcomes in patients with acute myocardial infarction. Nutr. Metab. Cardiovasc. Dis. 2020, 30, 2351–2362. [Google Scholar] [CrossRef]
  30. Wang, W.; Yang, J.; Wang, K.; Niu, J.; Liu, Y.; Ge, H. Association between the triglyceride-glucose index and in-hospital major adverse cardiovascular events in patients with acute coronary syndrome: Results from the Improving Care for Cardiovascular Disease in China (CCC)-Acute Coronary Syndrome project. Cardiovasc. Diabetol. 2024, 23, 170. [Google Scholar] [CrossRef]
  31. Dang, K.; Wang, X.; Hu, J.; Zhang, Y.; Cheng, L.; Qi, X.; Liu, L.; Ming, Z.; Tao, X.; Li, Y. The association between triglyceride-glucose index and its combination with obesity indicators and cardiovascular disease: NHANES 2003-2018. Cardiovasc. Diabetol. 2024, 23, 8. [Google Scholar] [CrossRef]
  32. Alavi Tabatabaei, G.; Mohammadifard, N.; Rafiee, H.; Nouri, F.; Maghami Mehr, A.; Najafian, J.; Sadeghi, M.; Boshtam, M.; Roohafza, H.; Haghighatdoost, F.; et al. Association of the triglyceride glucose index with all-cause and cardiovascular mortality in a general population of Iranian adults. Cardiovasc. Diabetol. 2024, 23, 66. [Google Scholar] [CrossRef]
  33. Wang, L.; Cong, H.L.; Zhang, J.X.; Hu, Y.C.; Wei, A.; Zhang, Y.Y.; Yang, H.; Ren, L.B.; Qi, W.; Li, W.Y.; et al. Triglyceride-glucose index predicts adverse cardiovascular events in patients with diabetes and acute coronary syndrome. Cardiovasc. Diabetol. 2020, 19, 80. [Google Scholar] [CrossRef]
  34. da Silva, A.; Caldas, A.P.S.; Hermsdorff, H.H.M.; Bersch-Ferreira, Â.C.; Torreglosa, C.R.; Weber, B.; Bressan, J. Triglyceride-glucose index is associated with symptomatic coronary artery disease in patients in secondary care. Cardiovasc. Diabetol. 2019, 18, 89. [Google Scholar] [CrossRef]
  35. Zhang, Z.; Zhao, L.; Lu, Y.; Xiao, Y.; Zhou, X. Insulin resistance assessed by estimated glucose disposal rate and risk of incident cardiovascular diseases among individuals without diabetes: Findings from a nationwide, population based, prospective cohort study. Cardiovasc. Diabetol. 2024, 23, 194. [Google Scholar] [CrossRef]
  36. D’Apolito, M.; Du, X.; Pisanelli, D.; Pettoello-Mantovani, M.; Campanozzi, A.; Giacco, F.; Maffione, A.B.; Colia, A.L.; Brownlee, M.; Giardino, I. Urea-induced ROS cause endothelial dysfunction in chronic renal failure. Atherosclerosis 2015, 239, 393–400. [Google Scholar] [CrossRef]
  37. Yu, W.; Cheng, J.D. Uric Acid and Cardiovascular Disease: An Update From Molecular Mechanism to Clinical Perspective. Front. Pharmacol. 2020, 11, 582680. [Google Scholar] [CrossRef] [PubMed]
  38. Curaj, A.; Vanholder, R.; Loscalzo, J.; Quach, K.; Wu, Z.; Jankowski, V.; Jankowski, J. Cardiovascular Consequences of Uremic Metabolites: An Overview of the Involved Signaling Pathways. Circ. Res. 2024, 134, 592–613. [Google Scholar] [CrossRef] [PubMed]
  39. Schepers, E.; Meert, N.; Glorieux, G.; Goeman, J.; Van der Eycken, J.; Vanholder, R. P-cresylsulphate, the main in vivo metabolite of p-cresol, activates leucocyte free radical production. Nephrol. Dial. Transplant. 2007, 22, 592–596. [Google Scholar] [CrossRef] [PubMed]
  40. Carrero, J.J.; Stenvinkel, P. Persistent inflammation as a catalyst for other risk factors in chronic kidney disease: A hypothesis proposal. Clin. J. Am. Soc. Nephrol. 2009, 4 (Suppl. S1), S49–S55. [Google Scholar] [CrossRef]
  41. Kaesler, N.; Babler, A.; Floege, J.; Kramann, R. Cardiac Remodeling in Chronic Kidney Disease. Toxins 2020, 12, 161. [Google Scholar] [CrossRef]
  42. London, G.M.; Drueke, T.B. Atherosclerosis and arteriosclerosis in chronic renal failure. Kidney Int. 1997, 51, 1678–1695. [Google Scholar] [CrossRef]
  43. Vaziri, N.D. HDL abnormalities in nephrotic syndrome and chronic kidney disease. Nat. Rev. Nephrol. 2016, 12, 37–47. [Google Scholar] [CrossRef]
  44. Pop, D.; Dădârlat-Pop, A.; Tomoaia, R.; Zdrenghea, D.; Caloian, B. Updates on the Renin-Angiotensin-Aldosterone System and the Cardiovascular Continuum. Biomedicines 2024, 12, 1582. [Google Scholar] [CrossRef] [PubMed]
  45. Ronco, C.; Haapio, M.; House, A.A.; Anavekar, N.; Bellomo, R. Cardiorenal syndrome. J. Am. Coll. Cardiol. 2008, 52, 1527–1539. [Google Scholar] [CrossRef]
  46. Dozio, E.; Ambrogi, F.; de Cal, M.; Vianello, E.; Ronco, C.; Corsi Romanelli, M.M. Role of the Soluble Receptor for Advanced Glycation End Products (sRAGE) as a Prognostic Factor for Mortality in Hemodialysis and Peritoneal Dialysis Patients. Mediat. Inflamm. 2018, 2018, 1347432. [Google Scholar] [CrossRef]
  47. Jovanovich, A.; Isakova, T.; Stubbs, J. Microbiome and Cardiovascular Disease in CKD. Clin. J. Am. Soc. Nephrol. 2018, 13, 1598–1604. [Google Scholar] [CrossRef]
  48. Gupta, S.; Dominguez, M.; Golestaneh, L. Diabetic Kidney Disease: An Update. Med. Clin. N. Am. 2023, 107, 689–705. [Google Scholar] [CrossRef] [PubMed]
  49. Premaratne, E.; Verma, S.; Ekinci, E.I.; Theverkalam, G.; Jerums, G.; MacIsaac, R.J. The impact of hyperfiltration on the diabetic kidney. Diabetes Metab. 2015, 41, 5–17. [Google Scholar] [CrossRef] [PubMed]
  50. Ren, L.; Cui, H.; Wang, Y.; Ju, F.; Cai, Y.; Gang, X.; Wang, G. The role of lipotoxicity in kidney disease: From molecular mechanisms to therapeutic prospects. Biomed. Pharmacother. 2023, 161, 114465. [Google Scholar] [CrossRef]
  51. Ndumele, C.E.; Rangaswami, J.; Chow, S.L.; Neeland, I.J.; Tuttle, K.R.; Khan, S.S.; Coresh, J.; Mathew, R.O.; Baker-Smith, C.M.; Carnethon, M.R.; et al. Cardiovascular-Kidney-Metabolic Health: A Presidential Advisory From the American Heart Association. Circulation 2023, 148, 1606–1635. [Google Scholar] [CrossRef]
  52. Rangaswami, J.; Bhalla, V.; Blair, J.E.A.; Chang, T.I.; Costa, S.; Lentine, K.L.; Lerma, E.V.; Mezue, K.; Molitch, M.; Mullens, W.; et al. Cardiorenal Syndrome: Classification, Pathophysiology, Diagnosis, and Treatment Strategies: A Scientific Statement From the American Heart Association. Circulation 2019, 139, e840–e878. [Google Scholar] [CrossRef] [PubMed]
  53. Haase, M.; Devarajan, P.; Haase-Fielitz, A.; Bellomo, R.; Cruz, D.N.; Wagener, G.; Krawczeski, C.D.; Koyner, J.L.; Murray, P.; Zappitelli, M.; et al. The outcome of neutrophil gelatinase-associated lipocalin-positive subclinical acute kidney injury: A multicenter pooled analysis of prospective studies. J. Am. Coll. Cardiol. 2011, 57, 1752–1761. [Google Scholar] [CrossRef] [PubMed]
  54. Wen, Y.; Parikh, C.R. Current concepts and advances in biomarkers of acute kidney injury. Crit. Rev. Clin. Lab. Sci. 2021, 58, 354–368. [Google Scholar] [CrossRef] [PubMed]
Figure 1. A heatmap illustrating the correlation between different variables. BMI, body mass index; UA, uric acid; FBG, fasting blood glucose; TG, triglyceride; TC, total cholesterol; HDL, high-density lipoprotein cholesterol; LDL, low-density lipoprotein cholesterol; Fib, fibrinogen; Hcy, homocysteine; EF, left-ventricular ejection fraction; Scr, serum creatinine; Cys, cystatin C; Fib, fibrinogen; eGFR, estimated glomerular filtration rate; TyG index, the triglyceride–glucose index; and bSS, baseline SYNTAX score. The intensity of color reflects the strength of the correlation. * p < 0.05, ** p < 0.01, and *** p < 0.001.
Jcdd 12 00427 g001
Figure 2. Cumulative incidence of MACEs during follow-up stratified by eGFR and the TyG index. (A) Cumulative incidence of MACEs during follow-up stratified by eGFR. (B) Cumulative incidence of MACEs during follow-up stratified by TyG index. MACEs, major adverse cardiovascular events; TyG index, the triglyceride–glucose index; and eGFR, estimated glomerular filtration rate.
Jcdd 12 00427 g002
Figure 3. Dose–response relationship of the eGFR and TyG index with the risk of MACEs in ACS-undergoing PCI. (A) Dose–response relationship of the eGFR with the risk of MACEs in ACS-undergoing PCI. (B) Dose–response relationship of the TyG index with the risk of MACEs in ACS-undergoing PCI. The restricted cubic spline (RCS) curves are derived from a Cox regression adjustment model, which includes factors such as age, BMI, diabetes mellitus, eGFR, Fib, heart rate, bSS, diuretics, Isu, AMI, and LVEF. eGFR, estimated glomerular filtration rate; TyG index, the triglyceride–glucose index; HR, hazard ratio; and CI, confidence interval.
Jcdd 12 00427 g003
Figure 4. The association of the eGFR and the TyG index with the risk of MACEs in ACS-undergoing PCI stratified by different subgroups. eGFR, estimated glomerular filtration rate; TyG index, the triglyceride–glucose index; BMI, body mass index; AMI, acute myocardial infarction; and CI, confidence interval. Hazard ratio (HR) indicates an increased risk for each 10-unit decrease in eGFR. All models were adjusted for age, BMI, diabetes mellitus, AMI, heart rate, Fib, bSS, LVEF, diuretics, and insulin.
Jcdd 12 00427 g004
Figure 5. The role of eGFR in mediating the association between the TyG index and MACEs. Model I was adjusted for age, sex, BMI, hypertension, diabetes mellitus, smoking, previous PCI; Model II was adjusted for age, BMI, diabetes mellitus, AMI, heart rate, Fib, bSS, LVEF, diuretics, insulin; and Model III was adjusted for age, sex, BMI, hypertension, diabetes mellitus, smoking, previous PCI, AMI, heart rate, Fib, bSS, LVEF, diuretics, insulin. Hazard ratio (HR) indicates an increased risk for each 10-unit decrease in eGFR. CI, confidence interval; eGFR, estimated glomerular filtration rate; MACEs, major adverse cardiovascular events; MI, myocardial infarction, and TyG index, the triglyceride–glucose index.
Jcdd 12 00427 g005
Table 1. Baseline characteristics stratified by the incidence of MACEs.
VariableTotal PopulationNon-MACEs
(n = 1216)
MACEs
(n = 124)
p-Value
Age, years67.02 ± 11.2166.34 ± 11.1173.62 ± 10.05<0.001
Female, n (%)384 (28.66)340 (27.96)44 (35.48)0.078
BMI, kg/m224.40 ± 2.9724.45 ± 2.9623.91 ± 2.950.050
Smoking, n (%)715 (53.36)658 (54.11)57 (45.97)0.083
Previous PCI, n (%)115 (8.58)101 (8.31)14 (11.29)0.258
COPD, n (%)41 (3.06)31 (2.55)10 (8.06)0.001
Hypertension, n (%)911 (67.99)818 (67.27)93 (75.00)0.079
Diabetes mellitus, n (%)533 (39.78)470 (38.65)63 (50.81)0.008
Stroke, n (%)63 (4.70)57 (4.69)6 (4.84)0.944
SBP, mmHg132.98 ± 21.02132.95 ± 20.81133.22 ± 23.030.893
Heart rate, bpm77.04 ± 14.2976.73 ± 13.8880.11 ± 17.650.012
cTnT, pg/mL58.15 (12.33, 1211.90)50.80 (11.60, 1211.90)229.90 (25.75, 1919.25)<0.001
BNP, pg/mL124.75 (44.25, 328.49)118.15 (41.85, 328.49)328.49 (96.13, 988.13)<0.001
Uric acid, µmol/L367.05 (306.23, 434.00)365.75 (306.10, 430.58)384.30 (308.25, 498.10)0.028
Serum creatinine, mg/dL0.87 (0.74, 1.04)0.87 (0.74, 1.02)0.97 (0.78, 1.36)<0.001
Cystatin C, mg/dL1.14 (0.97, 1.41)1.12 (0.96, 1.37)1.37 (1.11, 2.00)<0.001
eGFR, mL/min/1.73 m275.93 (59.35, 91.33)77.87 (61.38, 92.38)62.52 (36.52, 77.08)<0.001
eGFR < 60 mL/min/1.73 m2347 (25.9)291 (23.93)56 (45.16)<0.001
FBG, mmol/L6.95 ± 3.216.93 ± 3.237.21 ± 3.010.356
TG, mmol/L1.85 ± 1.371.87 ± 1.411.63 ± 0.930.063
TC, mmol/L4.47 ± 1.274.48 ± 1.274.45 ± 1.260.847
HDL-C, mmol/L1.16 ± 0.301.16 ± 0.301.16 ± 0.310.973
LDL-C, mmol/L2.73 ± 0.932.74 ± 0.932.73 ± 0.930.903
Hcy, µmol/L13.85 (11.00, 17.40)13.60 (10.90, 17.00)16.65 (12.53, 20.78)<0.001
Fib, g/L3.80 ± 1.313.75 ± 1.274.24 ± 1.58<0.001
LVEF55.06 ± 8.6855.47 ± 8.3051.03 ± 11.03<0.001
AMI, n (%)667 (49.78)591 (48.60)76 (61.29)0.007
Diagnosis, n (%) 0.016
UA673 (50.22)625 (51.40)48 (38.71)
NSTEMI283 (21.12)247 (20.31)36 (29.03)
STEMI384 (28.66)344 (28.29)40 (32.26)
Aspirin, n (%)1321 (98.58)1202 (98.85)119 (95.97)0.010
P2Y12-receptor inhibitor, n (%)1319 (98.43)1199 (98.60)120 (96.77)0.119
Statins, n (%)1312 (97.91)1191 (97.94)121 (97.58)0.788
β-blockers, n (%)935 (69.78)850 (69.90)85 (68.55)0.755
ACEI/ARB, n (%)607 (45.30)545 (44.82)62 (50.00)0.270
Diuretics, n (%)230 (17.16)185 (15.21)45 (36.30)<0.001
Insulin, n (%)144 (10.75)121 (9.95)23 (18.55)0.003
TyG index9.05 ± 0.699.03 ± 0.689.31 ± 0.74<0.001
bSS13.00 (8.00, 20.000)13.00 (8.00, 19.50)19.00 (13.00, 27.85)<0.001
Data are presented as mean ± SD, median (IQR), or n (%). Abbreviations: BMI, body mass index; PCI, percutaneous coronary intervention; COPD, chronic obstructive pulmonary disease; SBP, systolic blood pressure; cTnT, cardiac troponin T; BNP, brain natriuretic peptide; eGFR, estimating glomerular filtration rate; FBG, fasting blood glucose; TG, triglyceride; TC, total cholesterol; HDL-C, high-density lipoprotein cholesterol; LDL-C, low-density lipoprotein cholesterol; Hcy, homocysteine; Fib, fibrinogen; LVEF, left-ventricular ejection fraction; AMI, acute myocardial infarction; UA, unstable angina; STEMI, ST-segment elevation myocardial infarction; NSTEMI, non-ST-segment elevation myocardial infarction; ACEI/ARB, angiotensin-converting enzyme inhibitor/angiotensin-receptor blocker; TyG index, the triglyceride–glucose index; bSS, baseline SYNTAX score; and MACEs, major adverse cardiovascular events.
Table 2. Associations between the eGFR and the TyG index with the risk of MACEs and death.
eGFRTyG Index
HR (95% CI)pHR (95% CI)p
MACEsUnadjusted Model1.338 (1.125–1.432)<0.0011.620 (1.301–2.016)<0.001
Adjusted Model I1.205 (1.110–1.309)<0.0011.731 (1.282–2.337)<0.001
Adjusted Model II1.128 (1.035–1.230)0.0061.728 (1.278–2.336)<0.001
Adjusted Model III1.127 (1.032–1.232)0.0081.738 (1.273–2.372)<0.001
DeathUnadjusted Model1.366 (1.261–1.479)<0.0011.635 (1.257–2.126)<0.001
Adjusted Model I1.220 (1.107–1.344)<0.0011.695 (1.184–2.426)0.004
Adjusted Model II1.140 (1.028–1.264)0.0131.788 (1.241–2.574)0.002
Adjusted Model III1.139 (1.026–1.265)0.0151.751 (1.203–2.546)0.003
Model I was adjusted for age, sex, BMI, hypertension, diabetes mellitus, smoking, previous PCI; Model II was adjusted for age, BMI, diabetes mellitus, AMI, heart rate, Fib, bSS, LVEF, diuretics, insulin; and Model III was adjusted for age, sex, BMI, hypertension, diabetes mellitus, smoking, previous PCI, AMI, heart rate, Fib, bSS, LVEF, diuretics, insulin. Hazard ratio (HR) indicates an increased risk for each 10-unit decrease in eGFR. CI, confidence interval; eGFR, estimated glomerular filtration rate; MACEs, major adverse cardiovascular events; TyG index, the triglyceride–glucose index. Other abbreviations can be seen in Table 1.
Table 3. The role of eGFR in mediating the association between the TyG index and MACEs.
ExposuresAssociation
Total EffectIndirect EffectDirect Effect
HR (95% CI)pHR (95% CI)pHR (95% CI)pPM (95% CI)p
Unadjusted Model1.608 (1.267, 1.950)<0.011.162 (1.079, 1.245)<0.011.456 (1.094, 1.819)<0.0125.47 (13.52, 53.90)<0.01
Model I1.895 (1.309, 2.481)<0.011.146 (1.058, 1.234)<0.011.714 (1.159, 2.269)<0.0116.77 (7.75, 33.64)<0.01
Model II1.803 (1.207, 2.400)<0.011.081 (1.013, 1.149)<0.011.703 (1.118, 2.288)<0.019.61 (1.17, 23.79)0.02
Model III1.823 (1.201, 2.444)<0.011.082 (1.012, 1.153)<0.011.721 (1.104, 2.337)<0.019.63 (1.77, 23.40)0.01
Model I was adjusted for age, sex, BMI, hypertension, diabetes mellitus, smoking, previous PCI; Model II was adjusted for age, BMI, diabetes mellitus, AMI, heart rate, Fib, bSS, LVEF, diuretics, insulin; and Model III was adjusted for age, sex, BMI, hypertension, diabetes mellitus, smoking, previous PCI, AMI, heart rate, Fib, bSS, LVEF, diuretics, insulin. HR, hazard ratio; CI, confidence interval; and PM, proportion mediated. Other abbreviations can be seen in Table 1.
Disclaimer/Publisher’s Note: The statements, opinions and data contained in all publications are solely those of the individual author(s) and contributor(s) and not of MDPI and/or the editor(s). MDPI and/or the editor(s) disclaim responsibility for any injury to people or property resulting from any ideas, methods, instructions or products referred to in the content.