
Diagnostic Challenges in Aortic Stenosis
 , , ,
, , ,
Abstract
1. Introduction
2. Optimal Assessment of Aortic Stenosis by Multimodality Cardiac Imaging
2.1. Transthoracic Echocardiography
2.1.1. General Principles of Transthoracic Echocardiography Exam
2.1.2. Transthoracic Echocardiography Parameters Used in Aortic Stenosis Quantification
- Interposition of air or valvular calcium may preclude US penetration, so the identification of the envelope of the Doppler spectral curve may be difficult in some cases.
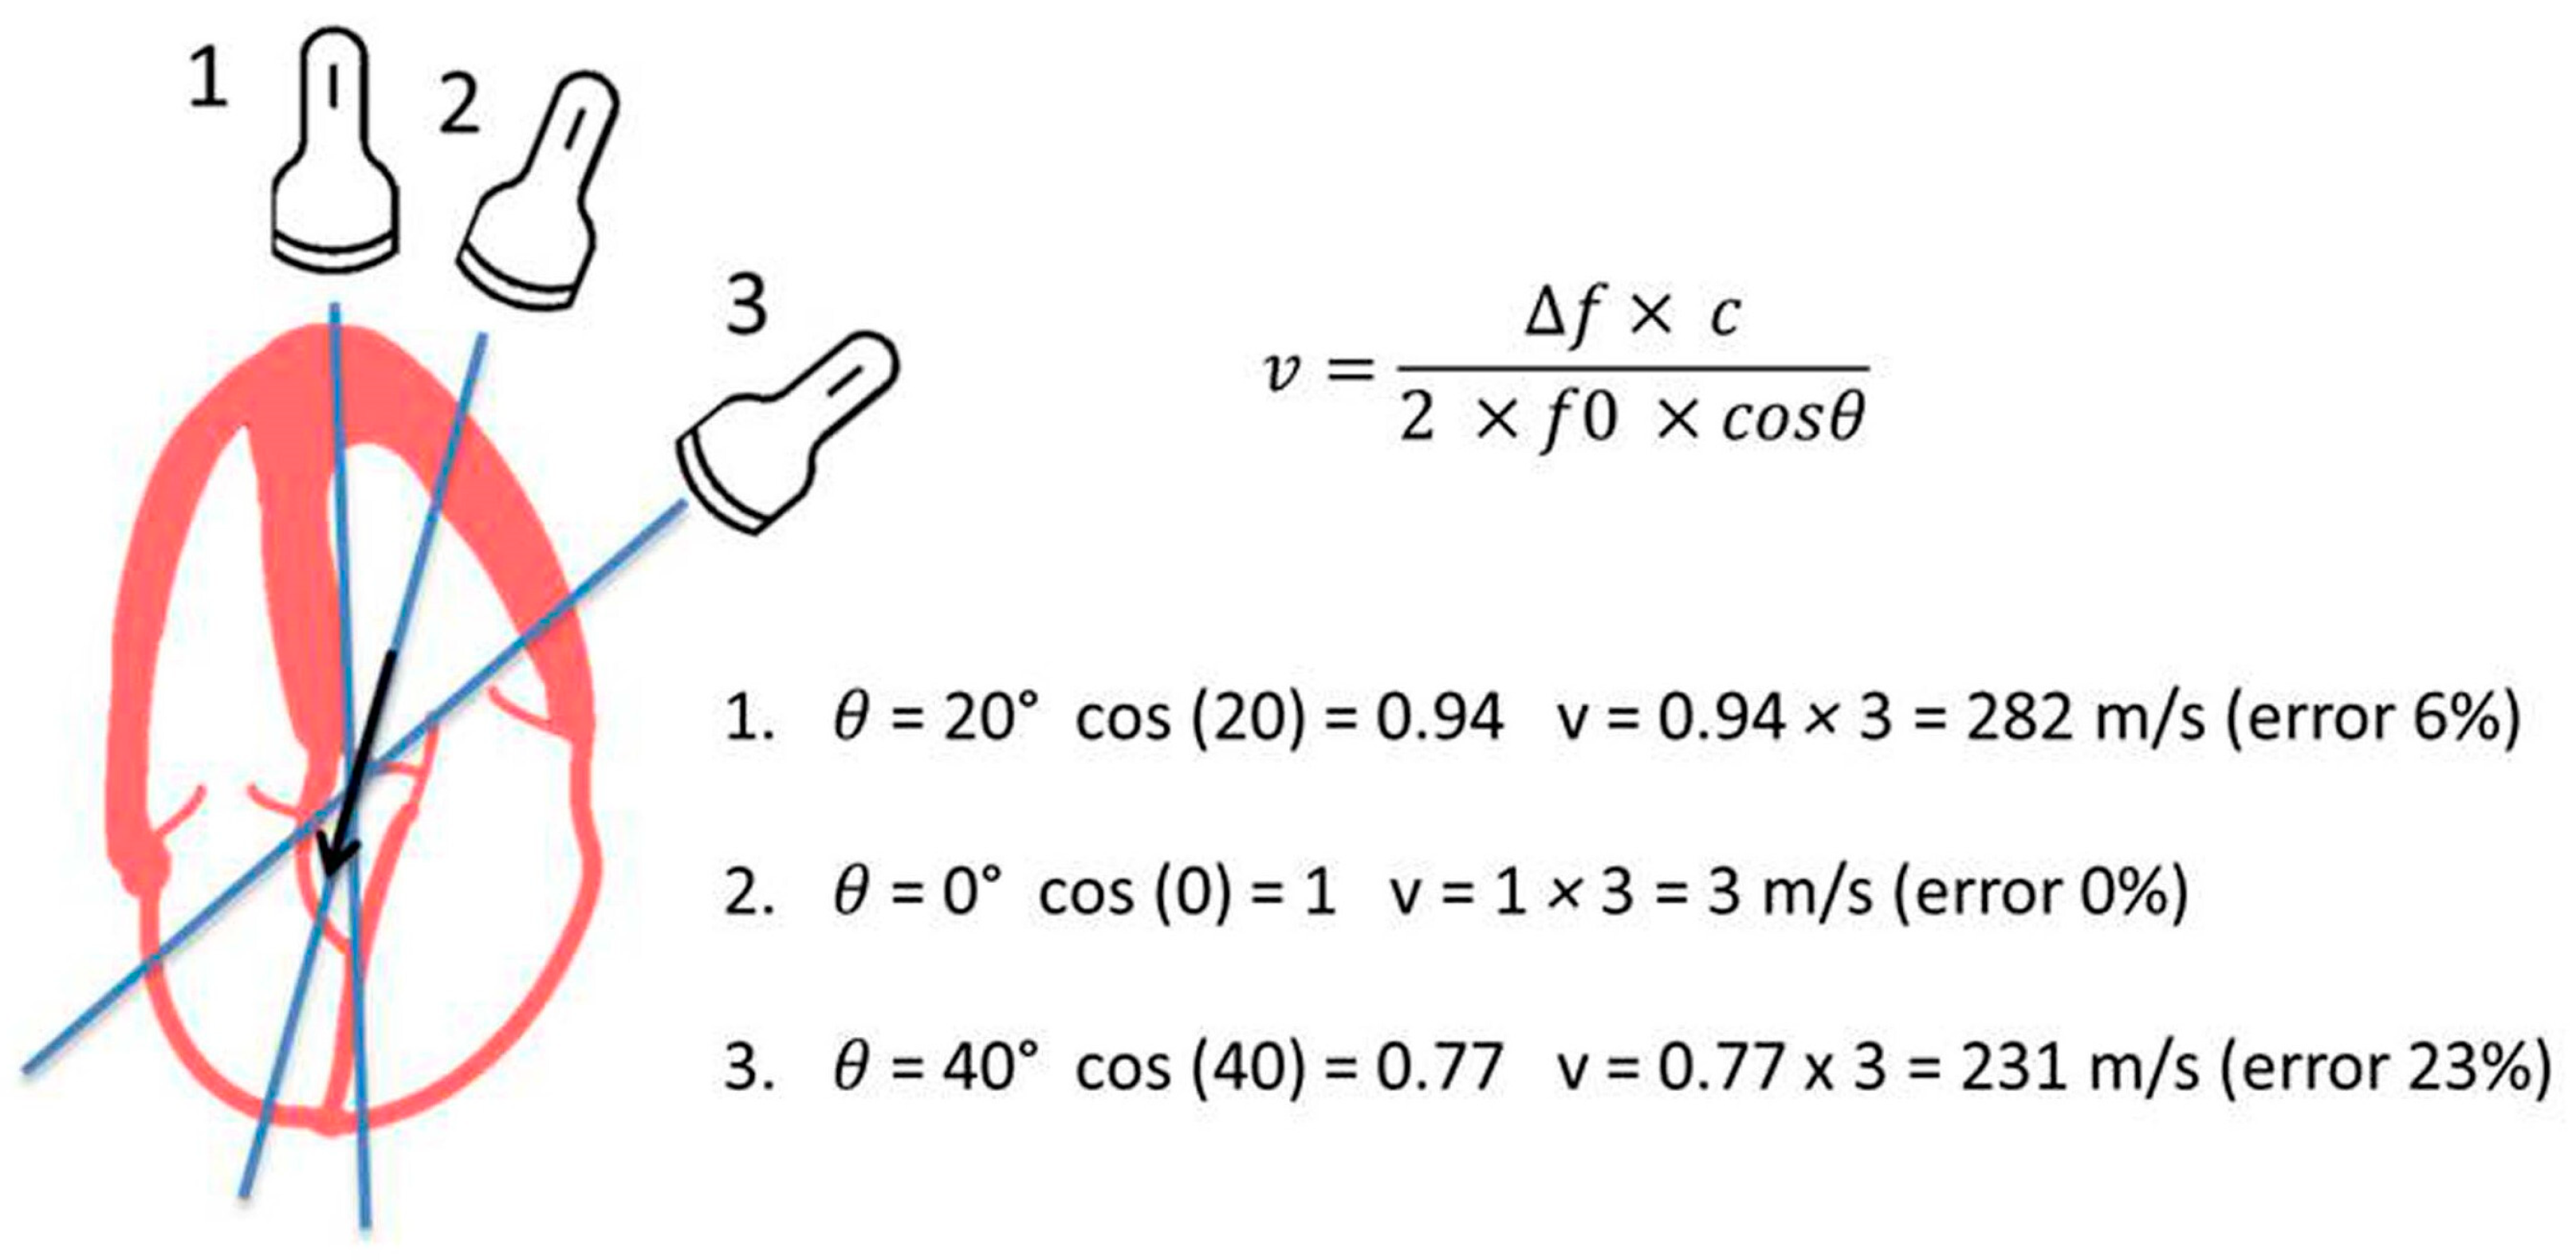
- Assessment of transvalvular flow velocity by Doppler technique is angle-dependent (see Figure 3).
- The simplified Bernoulli equation can be unsuitable in cases where high LVOT velocities are present (i.e., subaortic membrane or obstructive hypertrophic cardiomyopathy).
- VMax and MG are flow-dependent parameters: high-flow states (i.e., fever, anemia, significant aortic or mitral regurgitation) or low-flow states (i.e., left ventricular systolic dysfunction or significant mitral stenosis) may, therefore, cause inaccuracy in AS grading.
- Pressure recovery. The conversion of potential energy into kinetic energy due to the passage of blood through the VA leads to an increase in flow rate and a drop in pressure. Although some of the kinetic energy is dissipated as heat, due to turbulence and viscous losses, distal to the stenosis at the level of the aortic root, another part is transformed back into potential energy which causes a deceleration of flow and an increase or recovery of pressure (pressure recovery phenomenon; PRF). When the blood flow penetrates the AV, the anatomic orifice pressure keeps falling and velocity increases over a short distance, leading to the formation of what we call vena contracta (VC) which represents the effective orifice of the AV (EOAV). EOAV is slightly smaller than the anatomic orifice area and the major determinant of survival for the patients with AS [5]. VMax and the derived maximal gradient estimated by CWD reflect the flow velocity and pressure drop at the VC, hence PRF is not taken into consideration by Doppler techniques. In most adults with AS, the magnitude of PRF is small when the diameter of the ascending aorta is >30 mm. However, in patients with a smaller aortic caliber, PRF may be significant and, therefore, VMax and gradients may overestimate AS [13,14].
- Changes in transvalvular flow rate are potential modifiers of AVA. This effect is marginal in the context of preserved left ventricular ejection fraction (LVEF). However, it may be important when LV systolic disfunction is present, as a significant reduction of the AV orifice, in the absence of severe AS, may occur if the LV is unable to generate the required energy to adequately open the AV [20].
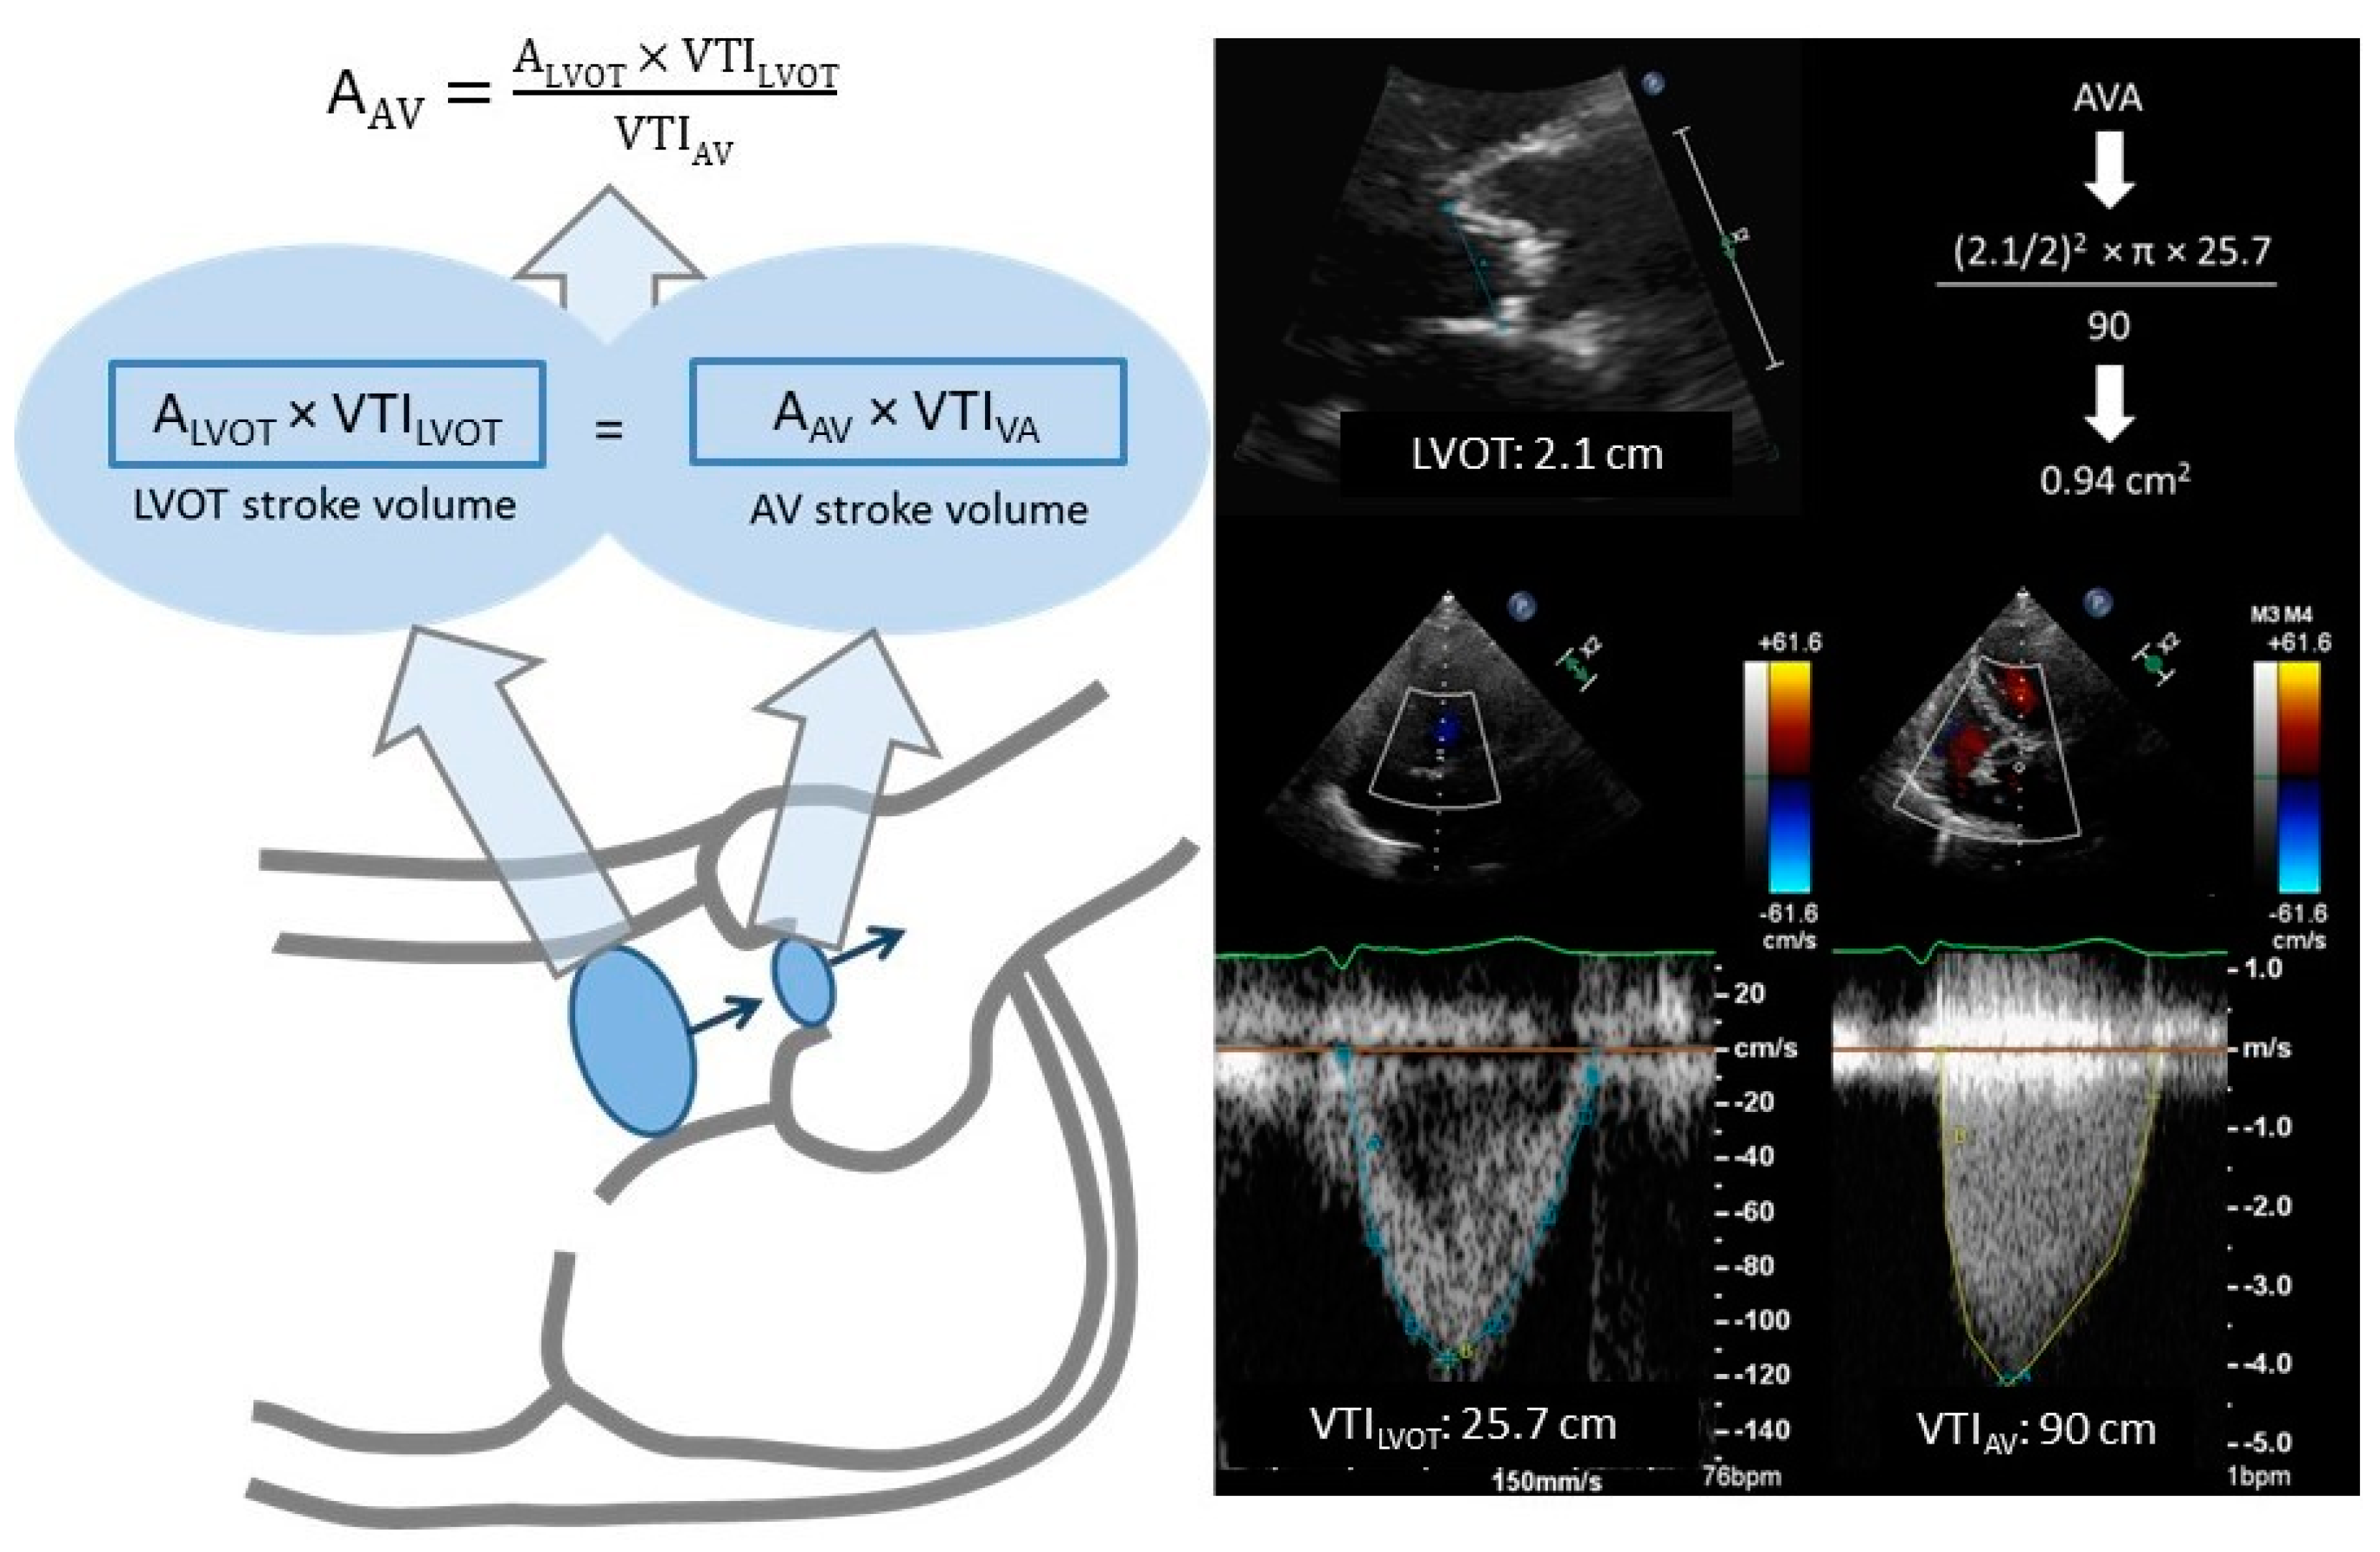
- Inter- and intraobserver reproducibility for LVOT diameter measurements is the main source of inaccuracy relative to the CEq. Although variability in such measurements is only ≈5 ± 4% and ≈3 ± 2%, respectively [21], it may be meaningful because this parameter is squared in CEq.
- LVOT-VTI measurement is based on the acceptance that flow is laminar with a flat spatial distribution at that site. When the LVOT-VTI assessment is performed distal to the AV annulus, flow convergence may generate higher velocities in the region adjacent to the interventricular septum and lower velocities in the proximity of the mitral valve. In this case, a non-centered PWD sample volume location can lead to over or underestimation of the systolic SV at the LVOT, resulting in AVA calculation inaccuracies.
2.1.3. Other Useful TTE Measurements (See Table 1)
- AVAi: it is defined as the ratio of AVA to body surface area (BSA). It should be used with caution in overweight patients because it significantly increases the prevalence of severe AS criteria without improving the predictive accuracy for AV-related events [24]. In contrast, AVAi can reclassify AS to a lower degree in a significant proportion of subjects with a small body habitus (body surface area < 1.7 m2).
- Dimensionless index (DI): it is calculated from the ratio of LVOT velocity to trans-AV velocity. Despite the potential advantage of avoiding LVOT diameter, investigations have demonstrated that it is less accurate than AVA [16,17]. A cut-off of <0.25 reaches a sensitivity and specificity with respect to AVA <0.75 cm2 of 92% and 78%, respectively [25].
- Systemic arterial compliance: it is a novel parameter that has been proposed to evaluate AS severity. Validation is still needed to recommend its use for AS grading [26].
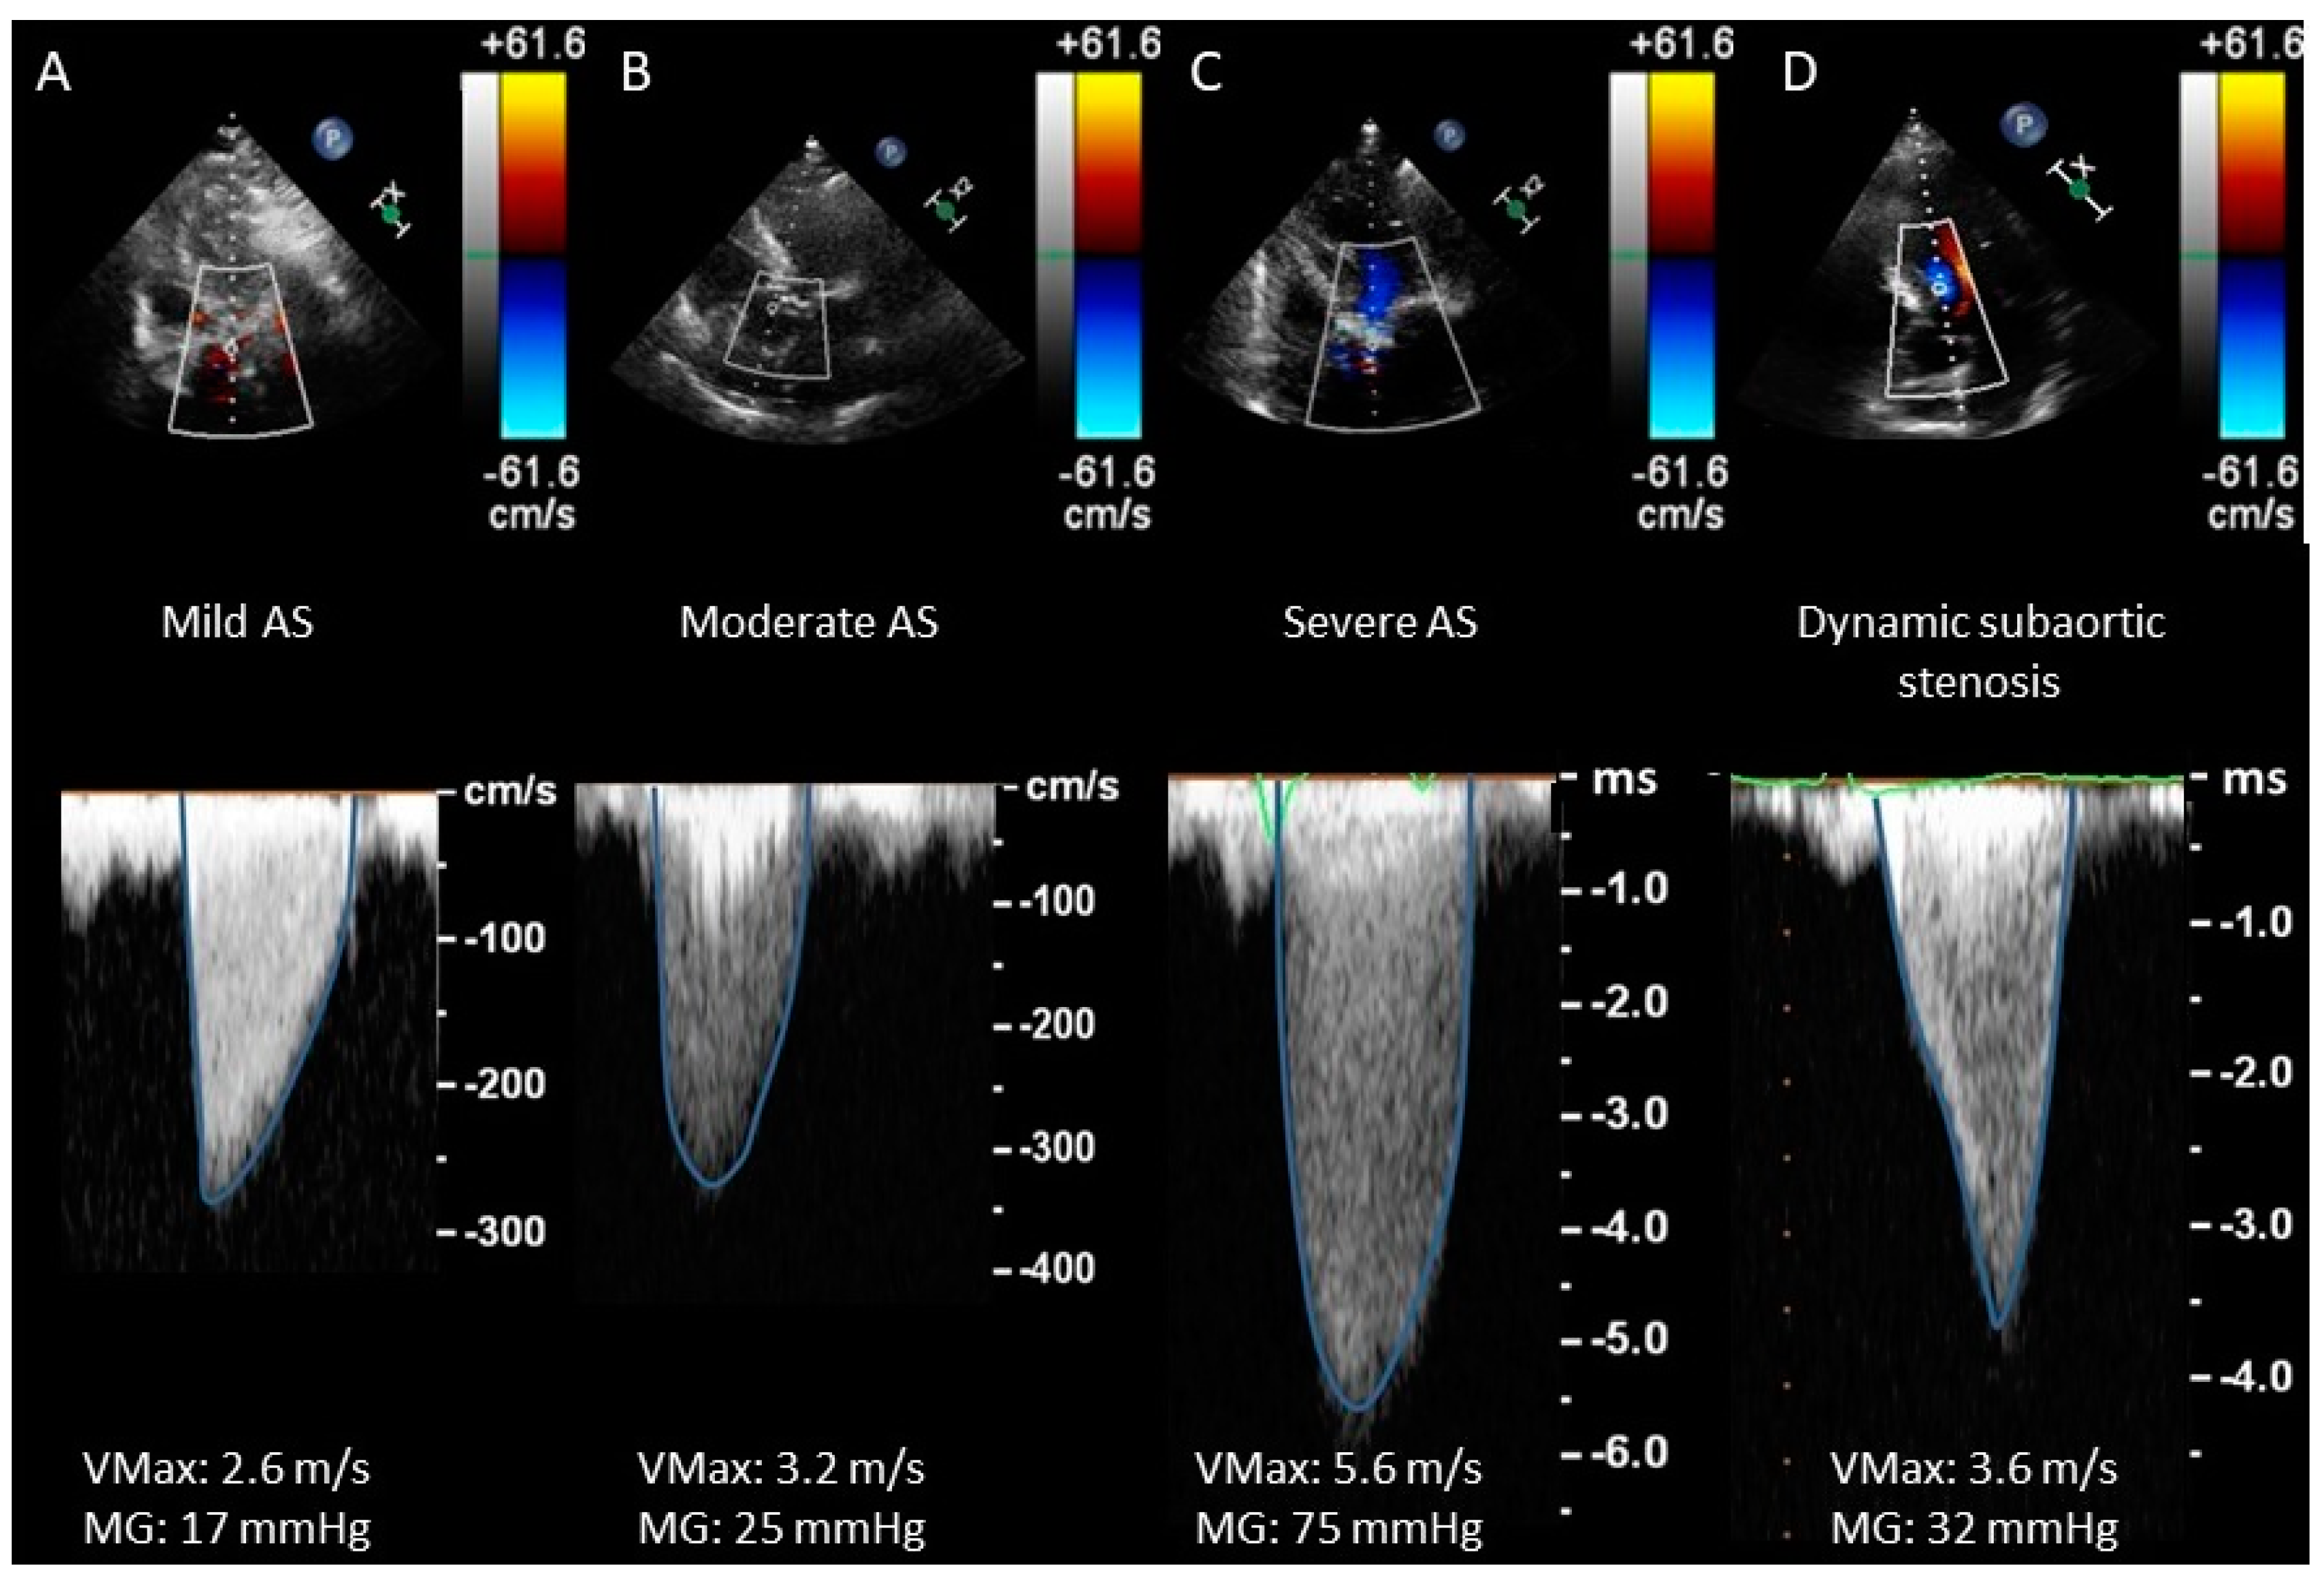
- CWD waveform (see Figure 4) is a semiquantitative parameter to evaluate the severity of AS. The finding of a CW waveform with a rapid acceleration and an early peak makes severe AS very unlikely. On the other hand, a slower acceleration with a late peak is more specific to severe AS. A dagger-shaped pattern may correspond to a dynamic subvalvular aortic stenosis (a common feature of obstructive hypertrophic cardiomyopathy) [27].

| No AS | Mild AS | Moderate AS | Severe AS | |
|---|---|---|---|---|
| VMax (m/s) | <2.5 | 2.5–3 | 3–4 | ≥4 |
| MG (mmHg) | - | <20 | 20–40 | ≥40 |
| AVA (cm2) | >2 | 1.5–2 | 1–1.5 | <1 |
| AVA index (cm2/m2) | - | >0.85 | 0.6–0.85 | <0.6 |
| DI | - | >0.50 | 0.25–0.50 | <0.25 |
- Three-dimensional (3D) TTE acquisition: a 3D echo dataset allows direct LVOT measurement by multiplanar reformat, in a similar way MDCT does, avoiding geometrical assumptions. LVOT assessment by 3D TTE is more reproducible than 2D TTE and can be employed in the CEq (“ellipsis formula”) [23,28]. Three-dimensional probes are not available in many centers and, despite recent technological advances, the spatial and temporal resolution of 3D TTE is low, so its role may still be limited.
- Chamber’s size, left ventricle wall thickness, systolic and diastolic function, and pulmonary pressure are easily obtained by TTE. All these parameters, as well as the presence of another concomitant valve dysfunction that can be diagnosed within the same exam, are useful for decision making with respect to patients with AS.
2.2. Transesophageal Echocardiography
2.3. Multidetector Computed Tomography
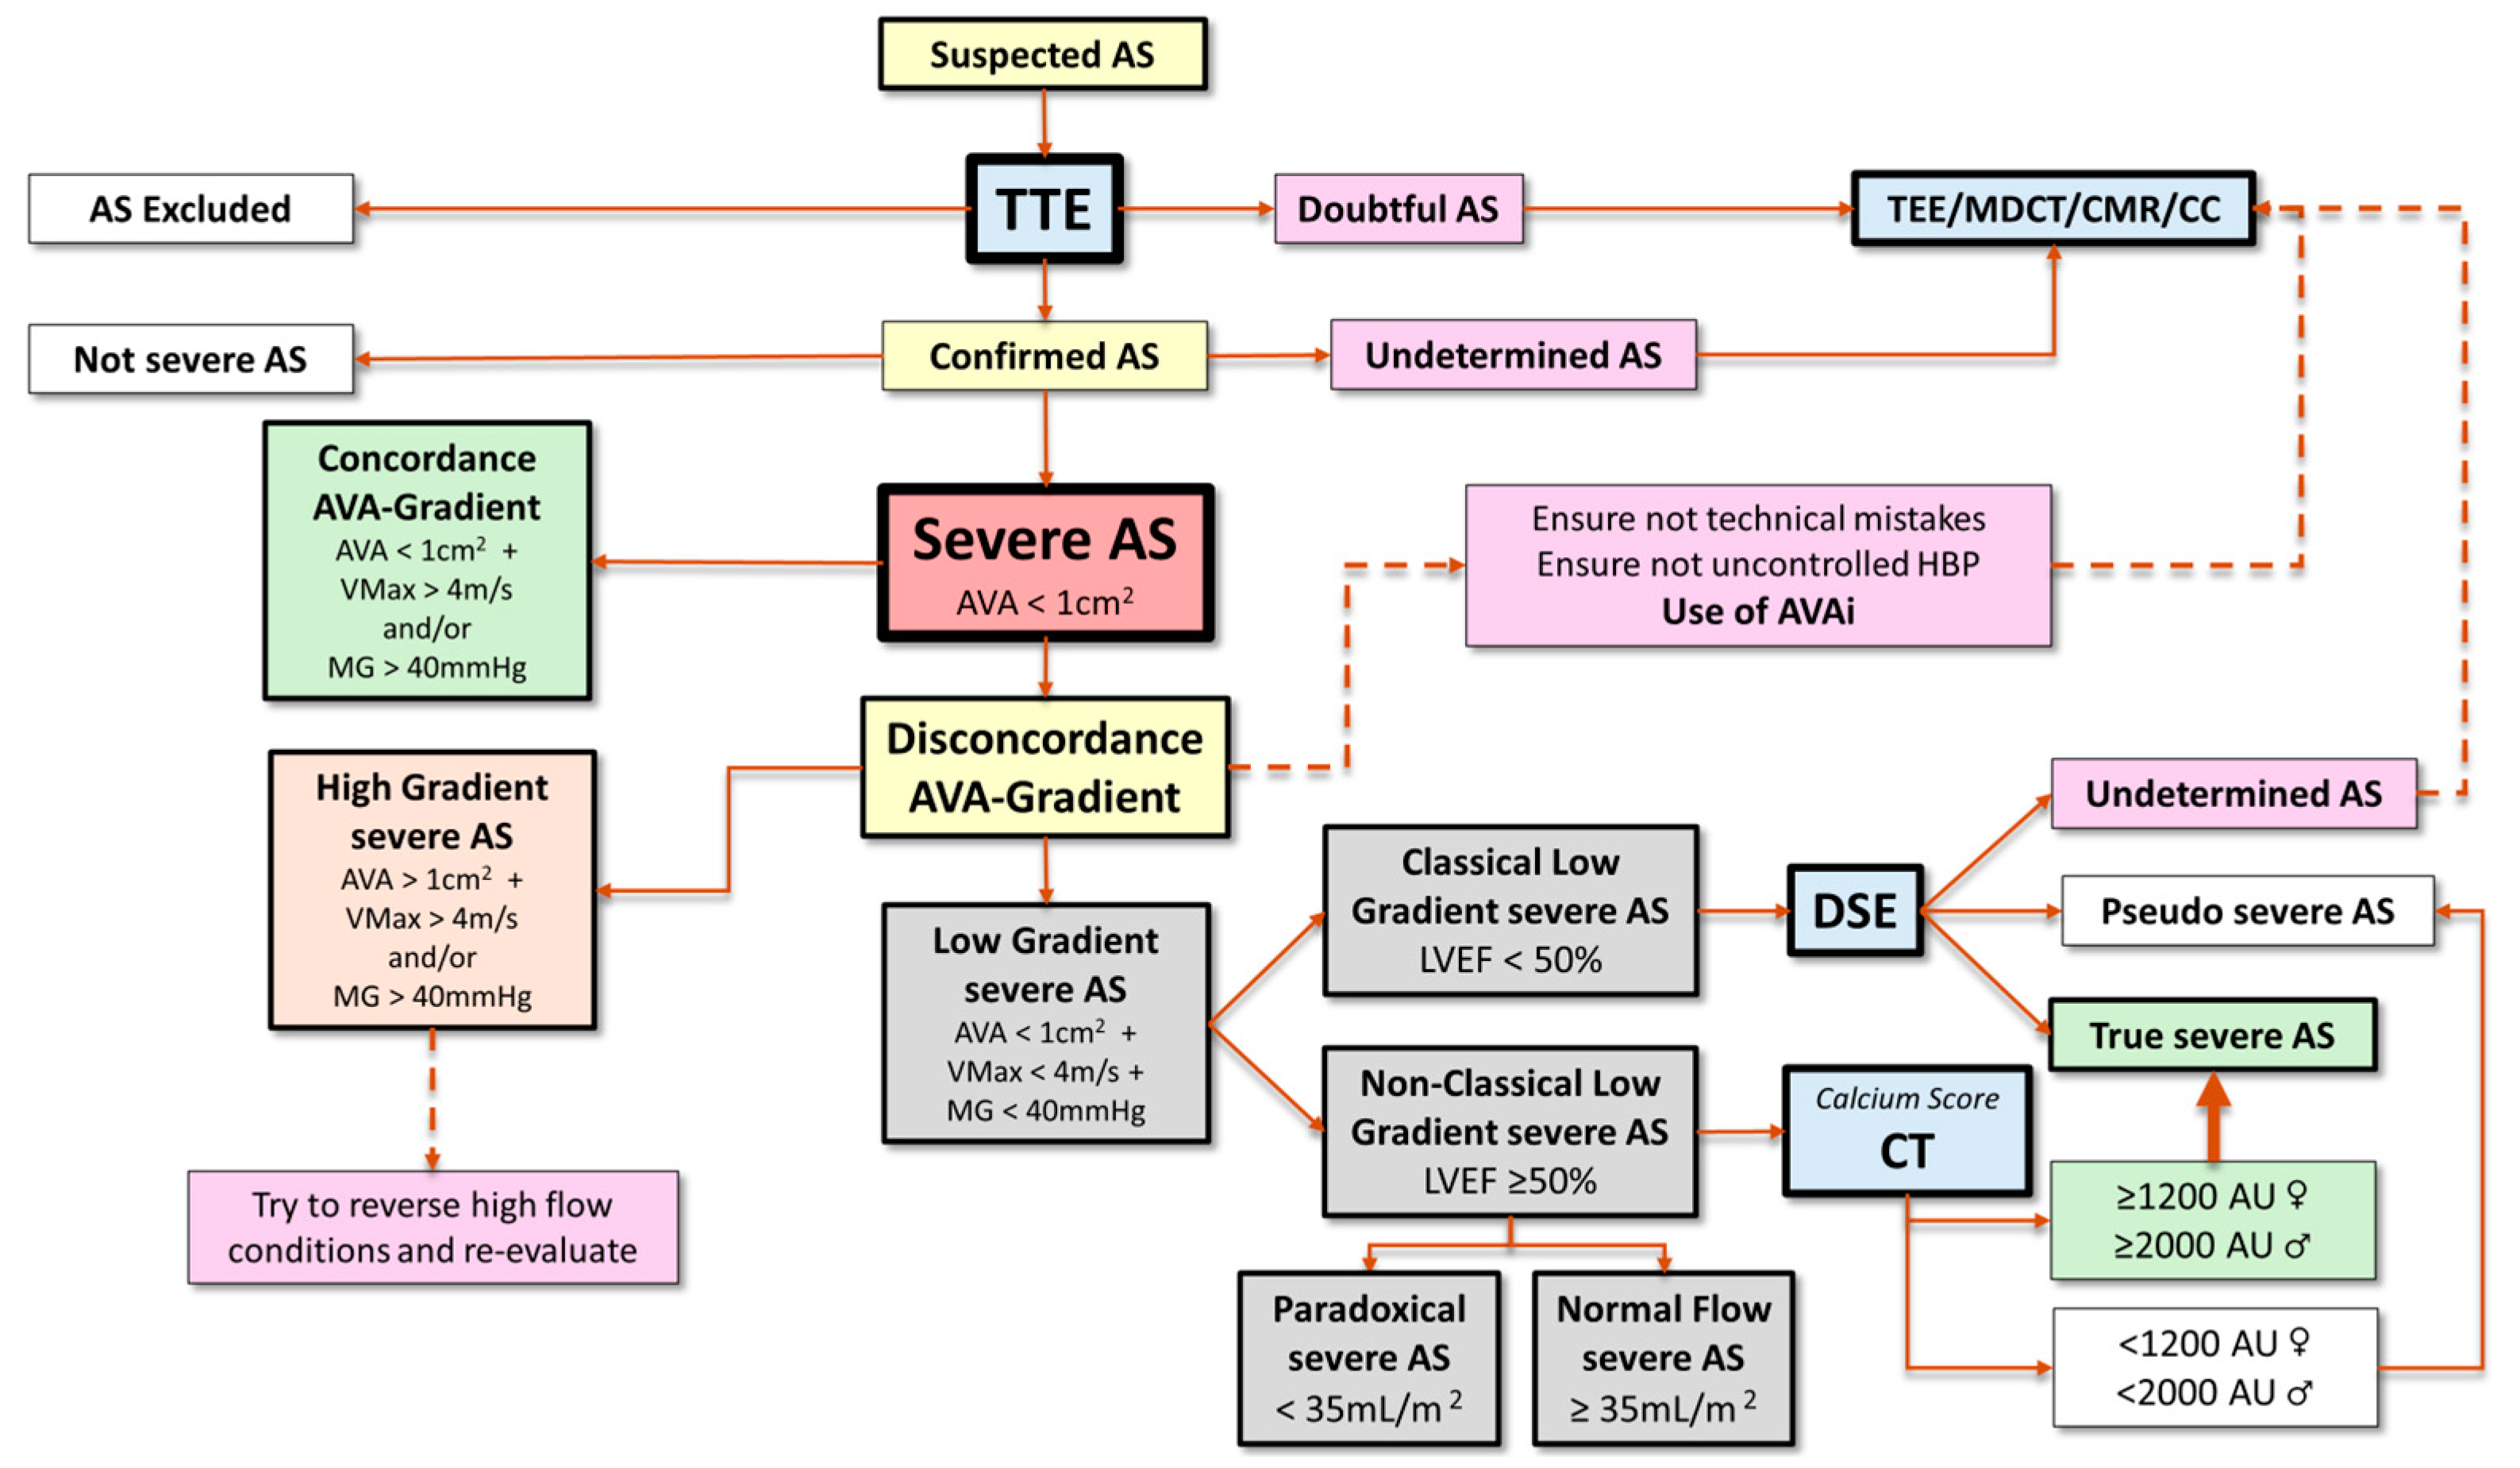
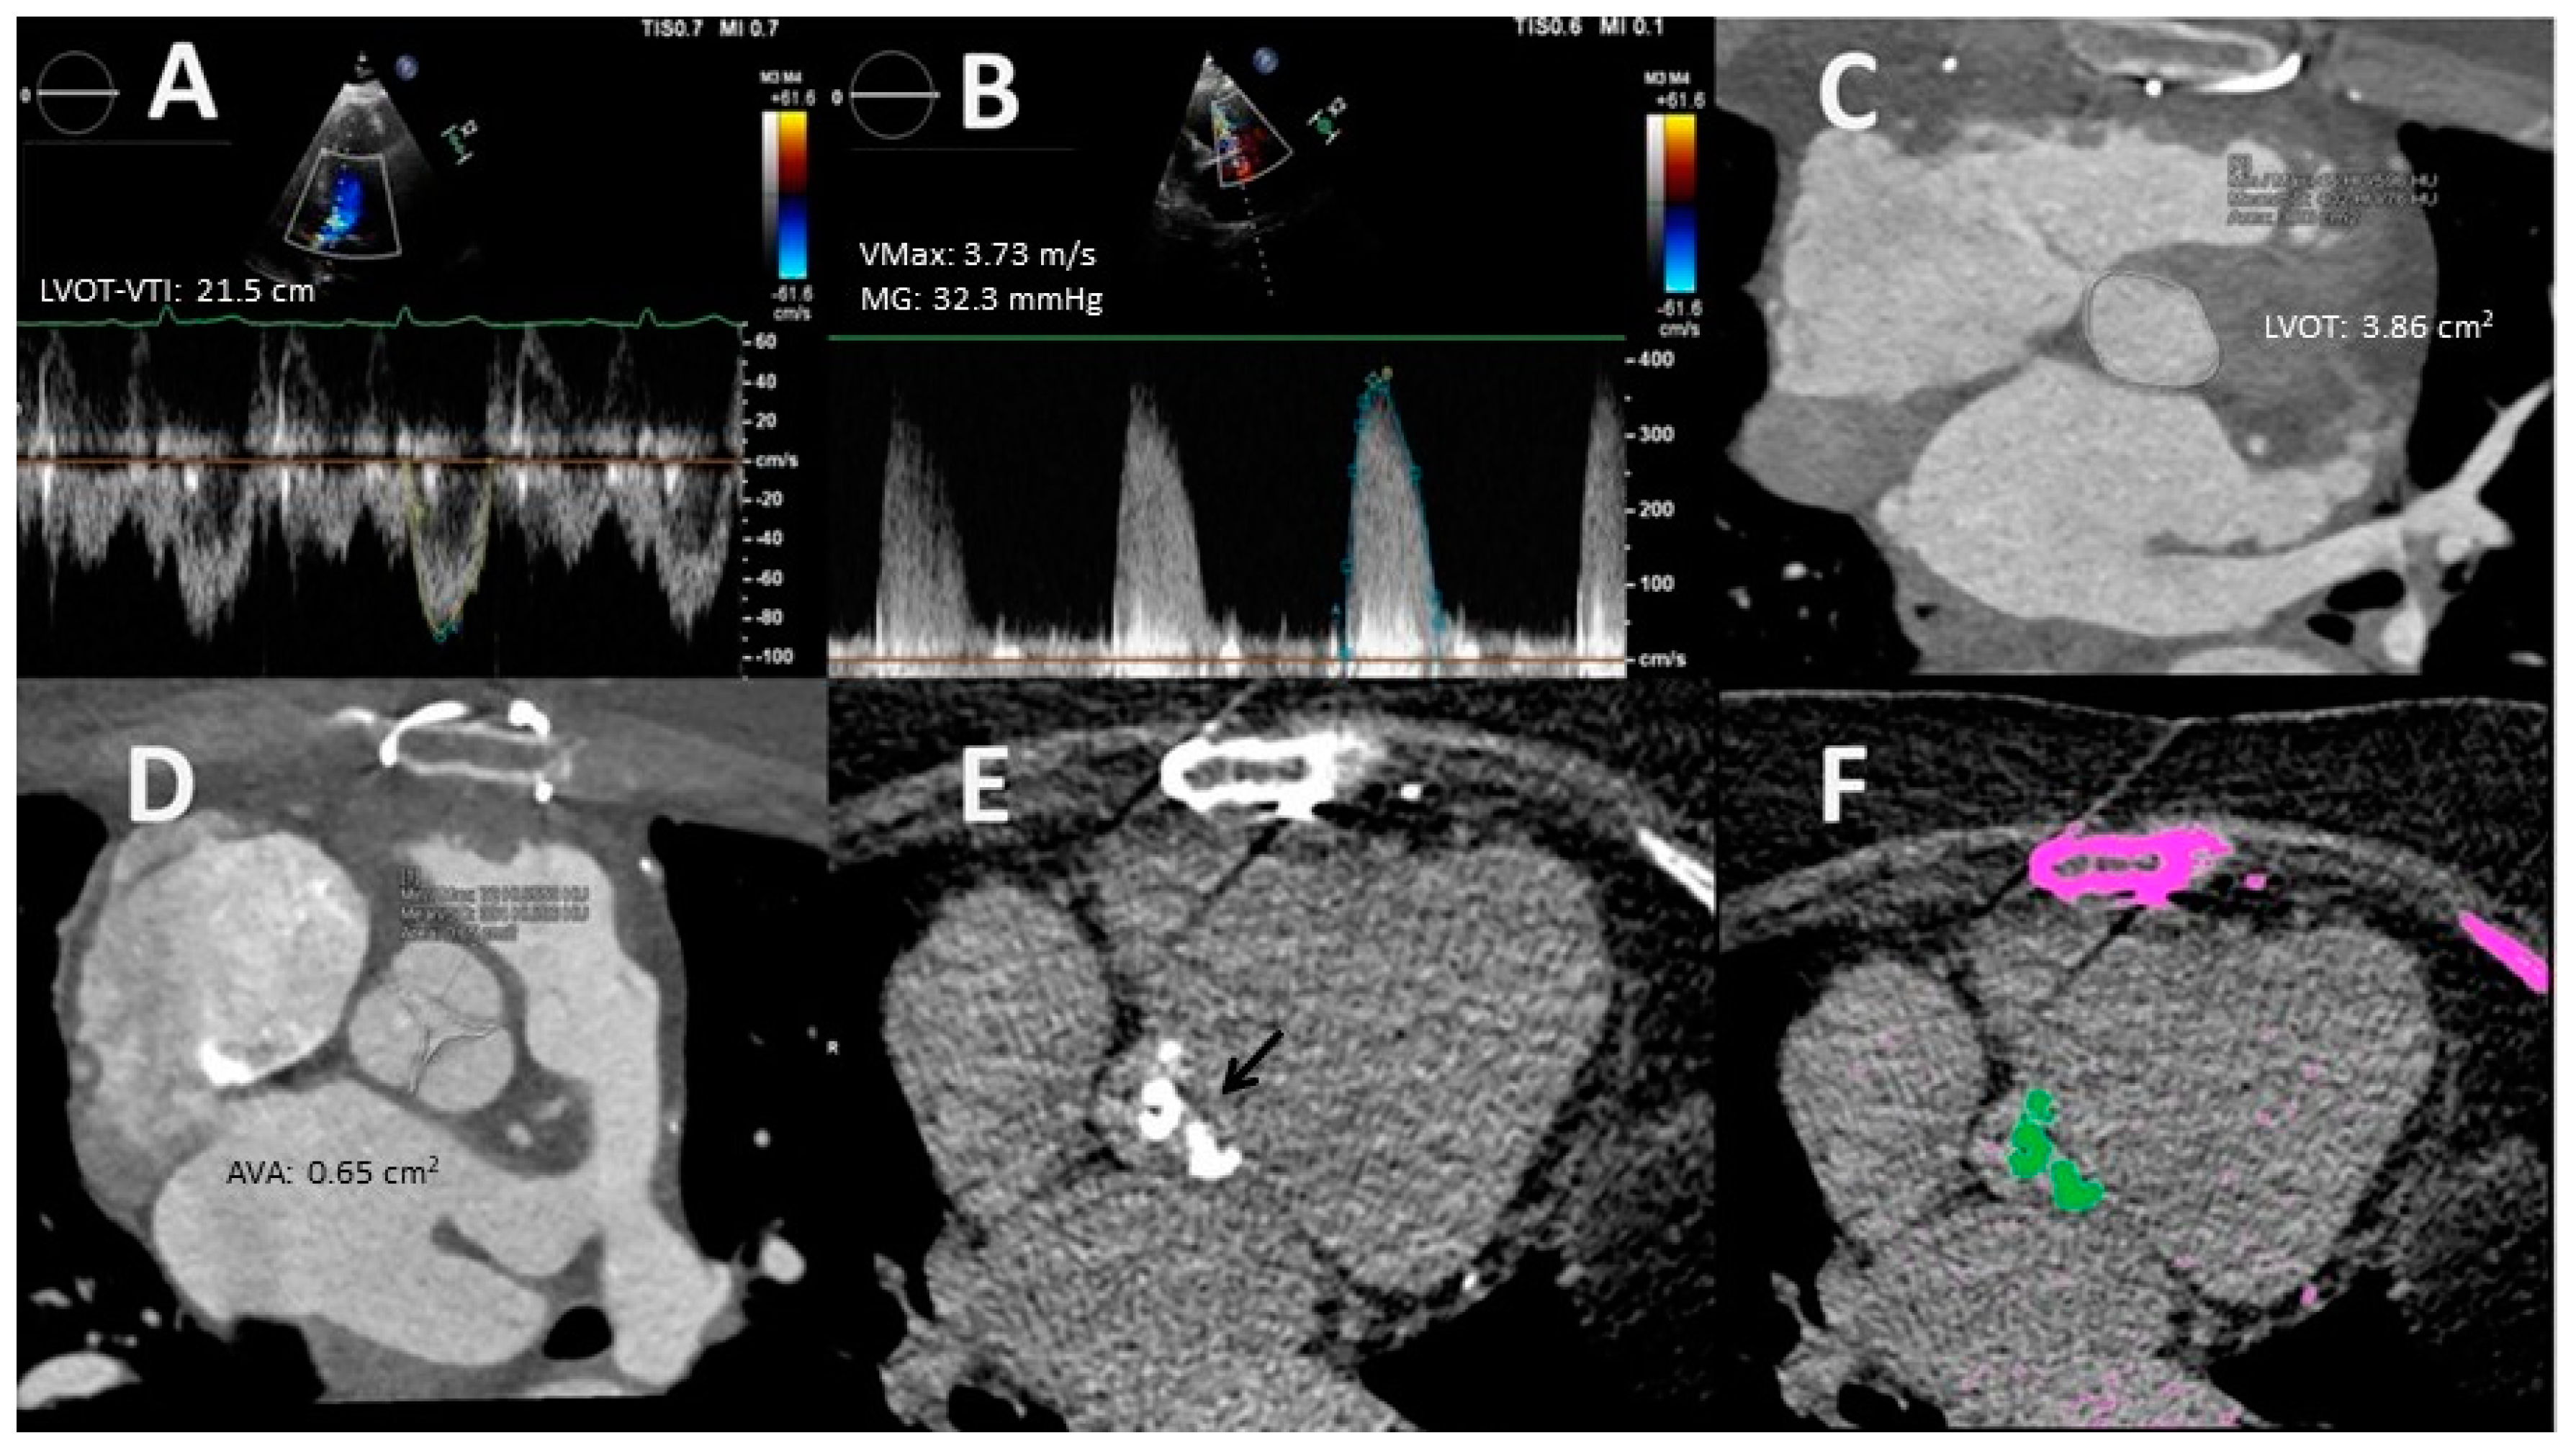
- Measurement valve calcification. The presence and extent of valvular calcification, quantified by the calcium score using the Agatston method, has been shown to be a predictor of severe AS, as well as of disease progression and development of adverse events [36]. The main application of the AV calcium score is the differentiation between true severe AS and pseudosevere AS, especially in the presence of preserved LVEF, LF, and significant diastolic dysfunction, i.e., patients with a restrictive diastolic pattern whose tolerance to dobutamine stress echocardiography (DSE) is limited. Cut-off values for severe AS vary according to gender (≥1200 Agatston Units (AU) in women and ≥2000 AU in men; valvular calcium density (AU/aortic annulus area) ≥300 AU/cm2 in women and ≥500 AU/cm2 in men [4,14,36,37,38]). In patients with concordant echocardiographic measurements of disease severity, the CT calcium score has a sensitivity and specificity of 87% and 84%, respectively, in females and of 80% and 82%, respectively, in males for identifying severe AS [39]. In contrast, in individuals with discordant TTE parameters, heterogeneity in CT calcium scores has been observed [39]. Severe valve calcification is present in ≈50–60% of the patients with LF AS, whereas, among discordant normal flow (NF) AS, it has been detected in 74% of the subjects with a VMax > 4.0 m/s, but only in 34% of the individuals with a VMax < 4.0 m/s [39]. It should be noted that CT does not assess AV fibrosis, which may contribute significantly to AS in some cases, such as in young individuals with bicuspid AV, although the proportion of such patients in LF scenarios is very low.
- Planimetry. MDCT allows 3D acquisition throughout the entire cardiac cycle using retrospective protocols. Through multislice reconstructions, planimetry of the AV orifice is feasible. Such a measure has shown good agreement with AVA estimated through the CEq [40]. Concerning LVOT size, MDCT assessment is considered to be the gold standard test [23]. Clavel et al. [41] observed that AVA calculated with a hybrid TTE–MDCT method in which the LVOT area used in the Ceq was obtained with MDCT predicted long-term survival with an optimal cut-off value of 1.2 cm2 instead of 1 cm2 [41].
- Pre-interventional study. Coverage of MDCT at acquisition can be extended to the ascending aorta to measure its diameter and determine the presence of calcifications. This information is helpful in cases where surgical valve replacement is considered. Regarding transcatheter aortic valve replacement (TAVR), CT is the reference technique for procedural planning. MDCT allows a precise estimation of the valve annulus size, its distance to the coronary ostia, and the caliber of the peripheral arterial vascular accesses. All of these parameters are essential to determine the candidacy for TAVR and to select the type and size of the prosthesis. Moreover, the incorporation of coronary assessment into CT protocols does not require an increase in contrast or radiation doses and has been shown to reduce the need for invasive coronary angiography in a noteworthy percentage of cases [42]. The use of the novel CT-derived fractional flow reserve technique is still not recommended because it may increase the number of false positive tests [43].
2.4. Cardiac Magnetic Resonance
- Planimetry. Cine sequences, selecting a perpendicular plane to the AV orifice, can be used to obtain a direct planimetry of the AVA. Such a measurement has been shown to be reproducible and correlates well with the AVA obtained by planimetry with 2D TEE [46] and with AVA estimated by catheterization [47]. Like MDCT, CMR planimetry slightly overestimates AVA compared to TTE [48]. Using Hakki’s formula, which is a simplification of Gorlin formula [49], AVA is mildly underestimated [48,50] compared to catheterization. Despite intra- and interobserver reproducibility of AV planimetry by CMR is excellent [48,50], its application is limited in certain scenarios such as the presence of a non-planar orifice, a highly calcified AV or arrhythmias (i.e., AF) [45].
- Functional AV assessment. In contrast to MDCT, functional assessment with CMR is feasible. Valenti et al. [51] suggested that the transaortic gradient can be indirectly calculated by using the simplified Gorlin equation (cardiac output/AVA). Such an estimation, in which the components of the formula are obtained using CMR cine imaging, is reproducible and has a good correlation with LV mass [51]. Phase contrast (PC) sequences are, nowadays, the most frequently employed for AV functional evaluation; VMax and, by using the simplified Bernoulli equation, maximum gradient are easily obtained with PC. These estimates have shown a high correlation with those obtained using Doppler technique and with invasive measurements [52,53]. Eccentric blood flow represents a challenge for PC-CMR, as a non-perpendicular plane alignment may underestimate AV velocity and, therefore, downgrade the stenosis [45]. Troger et al. [54] studied 55 patients with moderate or severe AS defined by cardiac catheterization (CC). All patients underwent CMR, TTE, and catheterization. AVA via PC-CMR was calculated as (flow − volume/VMax) during systole, and image planes parallel to the aortic leaflet attachment plane (LAP) were evaluated via PC-CMR between 22 mm below and 24 mm above LAP. AVA assessed in image planes 0–10 mm above LAP differed significantly from invasive measurements. Conversely, AVA values obtained 10–20 mm above LAP showed good agreement with invasive measurements; a plane 15 mm above LAP resulted in the lowest bias [54].

- Left ventricular tissue characterization. Applying gadolinium contrast and T1 mapping sequences, CMR can quantify areas of focal replacement fibrosis (they usually have a nonischemic pattern with a midwall location) and diffuse interstitial fibrosis, both resulting from myocyte apoptosis in the advanced stages of the disease. These types of fibrosis are correlated with the development of heart failure and unfavorable prognosis in patients with AS [55,56,57,58,59,60]. The ongoing EVOLVED trial will determine whether early aortic valve replacement in asymptomatic patients with severe aortic stenosis and midwall late gadolinium enhancement improves outcomes [61]. CMR is a great tool for the screening of amyloidosis in AS which occurs in one of eight patients evaluated for TAVR and carries an adverse prognosis [62].
3. Use of Multimodality Cardiac Imaging in Challenging Cases
3.1. Inadequate Doppler Alignment and Lack of Acoustic Window
3.2. Discordant High Gradient Severe Aortic Stenosis (AVA ≥ 1 cm2 with VMax ≥ 4 m/s and/or MG ≥ 40 mmHg)
3.3. Discordant Low Gradient Severe aortic Stenosis (AVA < 1 cm2 with VMax < 4 m/s and MG < 40 mmHg)
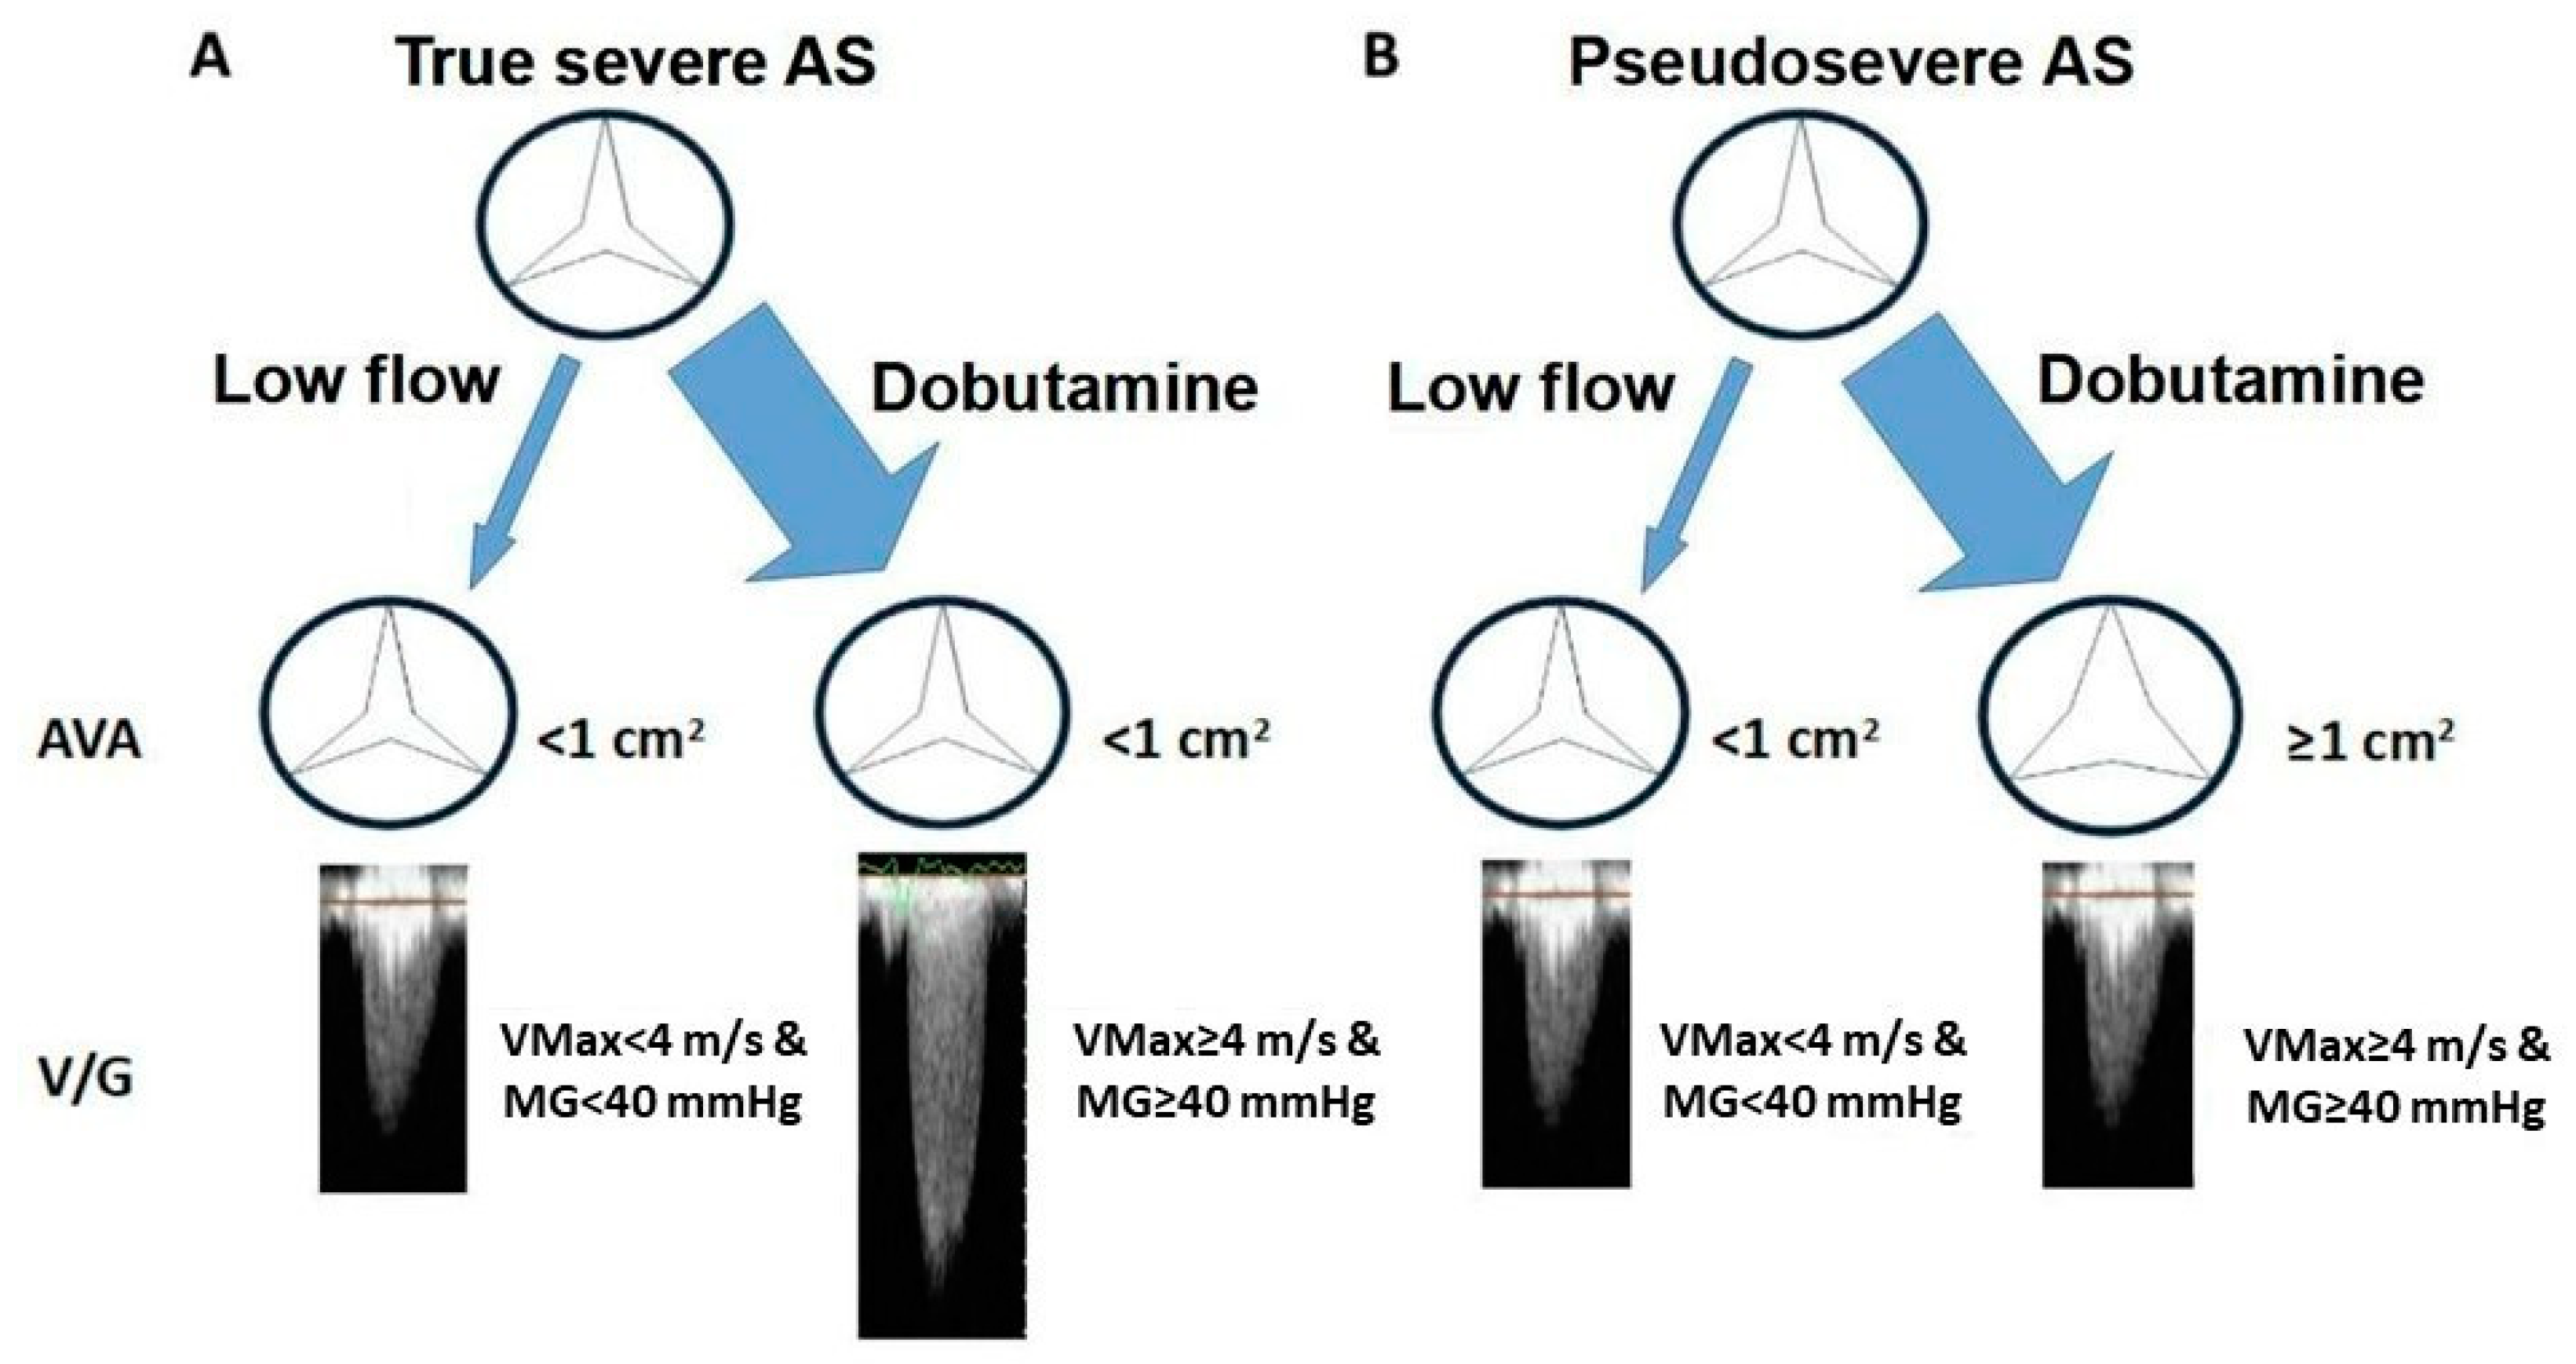
3.3.1. Classical Low-Flow Low-Gradient Severe Aortic Stenosis
3.3.2. Non-Classical Low-Gradient Aortic Stenosis: Paradoxical and Normal Flow
| Clinical findings | Crescendo–decrescendo systolic murmur auscultated at the right upper sternal border (may radiate to the carotid arteries) with reduced intensity of the second heart sound [77] Typical symptoms (dyspnea, angina, or syncope) without other explanations Elderly patients (>70 years) |
| Qualitative imaging data | LVH (additional history of hypertension to be considered) Reduced LV longitudinal function (global longitudinal strain) without other explanations |
| Semiquantitative imaging data | CW waveform: slow acceleration with a late peak Extensive calcification Increased cusps thickness with restrictive motion |
| Quantitative imaging data | MG > 35 mmHg AVA < 0.8 cm2 High calcium score by MDCT |
3.4. Cardiac Rhythm Abnormalities
3.5. Combined Heart Valve Disease
3.5.1. Aortic Regurgitation
3.5.2. Mitral Regurgitation
3.5.3. Mitral Stenosis
4. Current Gaps and Future Directions
- Non-classical low-gradient severe AS: information about its prognosis and treatment benefits is limited and controversial. MCI could play a key role in unmasking true severe AS cases.
- Low-flow low-gradient AS without contractile reserve: evidence on management is very scarce. More studies aimed at better understanding this entity are required.
- Combined heart valve disease: this clinical scenario has not been extensively analyzed. Further investigations are needed to increase our knowledge about these pathologies and clarify the best therapeutical options.
5. Conclusions
Author Contributions
Funding
Institutional Review Board Statement
Informed Consent Statement
Data Availability Statement
Conflicts of Interest
References
- Nkomo, V.T.; Gardin, J.M.; Skelton, T.N.; Gottdiener, J.S.; Scott, C.G.; Enriquez-Sarano, M. Burden of valvular heart diseases: A population-based study. Lancet 2006, 368, 1005–1011. [Google Scholar] [CrossRef] [PubMed]
- Iung, B.; Delgado, V.; Rosenhek, R.; Price, S.; Prendergast, B.; Wendler, O.; De Bonis, M.; Tribouilloy, C.; Evangelista, A.; Bogachev-Prokophiev, A.; et al. Contemporary Presentation and Management of Valvular Heart Disease: The EURObservational Research Programme Valvular Heart Disease II Survey. Circulation 2019, 140, 1156–1169. [Google Scholar] [CrossRef]
- Ramos Jiménez, J.; Hernández Jiménez, S.; Viéitez Flórez, J.M.; Sequeiros, M.A.; Alonso Salinas, G.L.; Zamorano Gómez, J.L. Cribado poblacional de estenosis aórtica: Prevalencia y perfil de riesgo. REC CardioClinics 2021, 56, 77–84. [Google Scholar] [CrossRef]
- Baumgartner, H.; Hung, J.; Bermejo, J.; Chambers, J.B.; Edvardsen, T.; Goldstein, S.; Lancellotti, P.; LeFevre, M.; Miller, F., Jr.; Otto, M.C.; et al. Recommendations on the echocardiographic assessment of aortic valve stenosis: A focused update from the European Association of Cardiovascular Imaging and the American Society of Echocardiography. Eur. Heart J. Cardiovasc. Imaging 2017, 18, 254–275. [Google Scholar] [CrossRef] [PubMed]
- Kumar, G.; Saikrishnan, N.; Sawaya, F.J.; Lerakis, S.; Yoganathan, A.P. Accurate assessment of aortic stenosis: A review of diagnostic modalities and hemodynamics. Circulation 2014, 130, e135. [Google Scholar] [CrossRef] [PubMed]
- Kebed, K.; Sun, D.; Addetia, K.; Mor-Avi, V.; Markuzon, N.; Lang, R.M. Measurement errors in serial echocardiographic assessments of aortic valve stenosis severity. Int. J. Cardiovasc. Imaging 2020, 36, 471–479. [Google Scholar] [CrossRef] [PubMed]
- Canciello, G.; Pate, S.; Sannino, A.; Borrelli, F.; Todde, G.; Grayburn, P.; Losi, M.-A.; Esposito, G. Pitfalls and Tips in the Assessment of Aortic Stenosis by Transthoracic Echocardiography. Diagnostics 2023, 13, 2414. [Google Scholar] [CrossRef] [PubMed]
- Lima de Souza Beck, A.; Madruga Ribeiro, L.C. My Approach to Aortic Stenosis Assessment with Discrepant Quantification. ABC Imagem Cardiovasc. 2022, 35, ecom21. [Google Scholar] [CrossRef]
- Otto, C.M.; Burwash, I.G.; Legget, M.E.; Munt, B.I.; Fujioka, M.; Healy, N.L.; Kraft, C.D.; Miyake-Hull, C.Y.; Schwaegler, R.G. Prospective study of asymptomatic valvular aortic stenosis. Clinical, echocardiographic, and exercise predictors of outcome. Circulation 1997, 95, 2262–2270. [Google Scholar] [CrossRef]
- Rosenhek, R.; Binder, T.; Porenta, G.; Lang, I.; Christ, G.; Schemper, M.; Maurer, G.; Baumgartner, H. Predictors of outcome in severe, asymptomatic aortic stenosis. N. Engl. J. Med. 2000, 343, 611–617. [Google Scholar] [CrossRef]
- Pellikka, P.A.; Sarano, M.E.; Nishimura, R.A.; Malouf, J.F.; Bailey, K.R.; Scott, C.G.; Barnes, M.E.; Tajik, A.J. Outcome of 622 adults with asymptomatic, hemodynamically significant aortic stenosis during prolonged follow-up. Circulation 2005, 111, 3290–3295. [Google Scholar] [CrossRef] [PubMed]
- Oh, J.K.; Taliercio, C.P.; Holmes, D.R.; Reeder, G.S.; Bailey, K.R.; Seward, J.B.; Tajik, A. Prediction of the severity of aortic stenosis by Doppler aortic valve area determination: Prospective Doppler-catheterization correlation in 100 patients. J. Am. Coll. Cardiol. 1988, 11, 1227–1234. [Google Scholar] [CrossRef] [PubMed]
- Niederberger, J.; Schima, H.; Maurer, G.; Baumgartner, H. Importance of Pressure Recovery for the Assessment of Aortic Stenosis by Doppler Ultrasound. Circulation 1996, 94, 1934–1940. [Google Scholar] [CrossRef] [PubMed]
- Ring, L.; Shah, B.N.; Bhattacharyya, S.; Harkness, A.; Belham, M.; Oxborough, D.; Pearce, K.; Rana, B.S.; Augustine, D.X.; Robinson, S.; et al. Echocardiographic assessment of aortic stenosis: A practical guideline from the British Society of Echocardiography. Echo Res. Pract. 2021, 8, G19–G59. [Google Scholar] [CrossRef] [PubMed]
- Poh, K.K.; Levine, R.A.; Solis, J.; Shen, L.; Flaherty, M.; Kang, Y.-J.; Guerrero, J.L.; Hung, J. Assessing aortic valve area in aortic stenosis by continuity equation: A novel approach using real-time three-dimensional echocardiography. Eur. Heart J. 2008, 29, 2526–2535. [Google Scholar] [CrossRef] [PubMed]
- Zoghbi, W.A.; Farmer, K.L.; Soto, J.G.; Nelson, J.G.; A Quinones, M. Accurate noninvasive quantification of stenotic aortic valve area by Doppler echocardiography. Circulation 1986, 73, 452–459. [Google Scholar] [CrossRef] [PubMed]
- Otto, C.M.; Pearlman, A.S.; Comess, K.A.; Reamer, R.P.; Janko, C.L.; Huntsman, L.L. Determination of the stenotic aortic valve area in adults using Doppler echocardiography. J. Am. Coll. Cardiol. 1986, 7, 509–517. [Google Scholar] [CrossRef] [PubMed]
- Pai, R.G.; Kapoor, N.; Bansal, R.C.; Varadarajan, P. Malignant natural history of asymptomatic severe aortic stenosis: Benefit of aortic valve replacement. Ann. Thorac. Surg. 2006, 82, 2116–2122. [Google Scholar] [CrossRef] [PubMed]
- Malouf, J.; Le Tourneau, T.; Pellikka, P.; Sundt, T.M.; Scott, C.; Schaff, H.V.; Enriquez-Sarano, M. Aortic valve stenosis in community medical practice: Determinants of outcome and implications for aortic valve replacement. J. Thorac. Cardiovasc. Surg. 2012, 144, 1421–1427. [Google Scholar] [CrossRef]
- Nishimura, R.; Grantham, J.; Connolly, H.; Schaff, H.; Higano, S.; Holmes, D. Low-output, low-gradient aortic stenosis in patients with depressed left ventricular systolic function: The clinical utility of the dobutamine challenge in the catheterization laboratory. Circulation 2003, 12, 37. [Google Scholar] [CrossRef]
- Shiran, A.; Adawi, S.; Ganaeem, M.; Asmer, E. Accuracy and reproducibility of left ventricular outflow tract diameter measurement using transthoracic when compared with transesophageal echocardiography in systole and diastole. Eur. J. Echocardiogr. 2009, 10, 319–324. [Google Scholar] [CrossRef] [PubMed]
- Gaspar, T.; Adawi, S.; Sachner, R.; Asmer, I.; Ganaeem, M.; Rubinshtein, R.; Shiran, A. Three-dimensional imaging of the left ventricular outflow tract: Impact on aortic valve area estimation by the continuity equation. J. Am. Soc. Echocardiogr. 2012, 25, 749–757. [Google Scholar] [CrossRef] [PubMed]
- Ruf, T.F.; Cannard, B.E.; Strasser, R.H.; Linke, A.; Sveric, K.M. Calculation of Aortic VAlve and LVOT Areas by a Modified Continuity Equation Using Different Echocardiography Methods: The CAVALIER Study. Diagnostics 2022, 12, 1656. [Google Scholar] [CrossRef] [PubMed]
- Jander, N.; Gohlke-Bärwolf, C.; Bahlmann, E.; Gerdts, E.; Boman, K.; Chambers, J.B.; Egstrup, K.; Nienaber, C.A.; Pedersen, T.R.; Ray, S.; et al. Indexing aortic valve area by body surface area increases the prevalence of severe aortic stenosis. Heart 2014, 100, 28–33. [Google Scholar] [CrossRef]
- Rusinaru, D.; Malaquin, D.; Maréchaux, S.; Debry, N.; Tribouilloy, C. Relation of Dimensionless Index to Long-Term Outcome in Aortic Stenosis with Preserved LVEF. JACC Cardiovasc. Imaging 2015, 8, 766–775. [Google Scholar] [CrossRef] [PubMed]
- Briand, M.; Dumesnil, J.G.; Kadem, L.; Tongue, A.G.; Rieu, R.; Garcia, D.; Pibarot, P. Reduced systemic arterial compliance impacts significantly on left ventricular afterload and function in aortic stenosis: Implications for diagnosis and treatment. J. Am. Coll. Cardiol. 2005, 46, 291–298. [Google Scholar] [CrossRef] [PubMed]
- Putra, B.E.; Sukmawan, R.; Ariani, R.; Soesanto, A.M.; Kuncoro, A.S. Two Barricades in a Row Mixed Lesion of Dynamic Left Ventricular Outflow Tract Obstruction and Aortic Stenosis: Finding the Culprit for Decision Making. J. Cardiovasc. Echogr. 2020, 30, 104–109. [Google Scholar] [CrossRef] [PubMed]
- de Isla, L.P.; Zamorano, J.; de la Yglesia, R.P.; Cioccarelli, S.; Almería, C.; Rodrigo, J.L.; Aubele, A.L.; Herrera, D.; Mataix, L.; Serra, V.; et al. Quantification of aortic valve area using three-dimensional echocardiography. Rev. Esp. Cardiol. 2008, 61, 494–500. [Google Scholar] [CrossRef]
- Morelli, S.; De Castro, S.; Cartoni, D.; Perrone, C.; Beni, S.; Bernardo, M.L.; Ferrante, L.; Giordano, M. Planar determination of the aortic valve area with transesophageal echocardiography with multiplanar probe in patients with aortic stenosis and insufficiency. Comparison with transthoracic Doppler echocardiography. G. Ital. Cardiol. 1995, 25, 851–857. [Google Scholar]
- Tribouilloy, C.; Shen, W.F.; Peltier, M.; Mirode, A.; Rey, J.-L.; Lesbre, J.-P. Quantitation of aortic valve area in aortic stenosis with multiplane transesophageal echocardiography: Comparison with monoplane transesophageal approach. Am. Heart J. 1994, 128, 526–532. [Google Scholar] [CrossRef]
- Hoffmann, R.; Flachskampf, F.A.; Hanrath, P. Planimetry of orifice area in aortic stenosis using multiplane transesophageal echocardiography. J. Am. Coll. Cardiol. 1993, 22, 529–534. [Google Scholar] [CrossRef] [PubMed]
- Goland, S.; Trento, A.; Iida, K.; Czer, L.S.C.; De Robertis, M.; Naqvi, T.Z.; Tolstrup, K.; Akima, T.; Luo, H.; Siegel, R.J. Assessment of aortic stenosis by three-dimensional echocardiography: An accurate and novel approach. Heart 2007, 93, 801–807. [Google Scholar] [CrossRef]
- Saura, D.; de la Morena, G.; Flores-Blanco, P.J.; Oliva, M.J.; Caballero, L.; González-Carrillo, J.; Espinosa, M.D.; López-Ruiz, R.N.M.; García-Navarro, M.D.M.; Valdés, M. Aortic valve stenosis planimetry by means of three-dimensional transesophageal echocardiography in the real clinical setting: Feasibility, reliability and systematic deviations. Echocardiography 2015, 32, 508–515. [Google Scholar] [CrossRef]
- Jainandunsing, J.S.; Mahmood, F.; Matyal, R.; Shakil, O.; Hess, P.E.; Lee, J.; Panzica, P.J.; Khabbaz, K.R. Impact of three-dimensional echocardiography on classification of the severity of aortic stenosis. Ann. Thorac. Surg. 2013, 96, 1343–1348. [Google Scholar] [CrossRef]
- Beneduce, A.; Capogrosso, C.; Moroni, F.; Ancona, F.; Falasconi, G.; Pannone, L.; Stella, S.; Ingallina, G.; Melillo, F.; Ancona, M.B.; et al. Aortic valve area calculation using 3D transesophageal echocardiography: Implications for aortic stenosis severity grading. Echocardiography 2020, 37, 2071–2081. [Google Scholar] [CrossRef]
- Clavel, M.A.; Pibarot, P.; Messika-Zeitoun, D.; Capoulade, R.; Malouf, J.; Aggarval, S.; Araoz, P.; Michelena, M.; Cueff, C.; Larose, E.; et al. Impact of aortic valve calcification, as measured by MDCT, on survival in patients with aortic stenosis: Results of an international registry study. J. Am. Coll. Cardiol. 2014, 64, 1202–1213. [Google Scholar] [CrossRef] [PubMed]
- Cueff, C.; Serfaty, J.-M.; Cimadevilla, C.; Laissy, J.-P.; Himbert, D.; Tubach, F.; Duval, X.; Iung, B.; Enriquez-Sarano, M.; Vahanian, A.; et al. Measurement of aortic valve calcification using multislice computed tomography: Correlation with haemodynamic severity of aortic stenosis and clinical implication for patients with low ejection fraction. Heart 2011, 97, 721–726. [Google Scholar] [CrossRef]
- Clavel, M.A.; Messika-Zeitoun, D.; Pibarot, P.; Aggarwal, S.R.; Malouf, J.; Araoz, P.A.; Michelena, H.I.; Cueff, C.; Larose, E.; Capoulade, R.; et al. The complex nature of discordant severe calcified aortic valve disease grading: New insights from combined Doppler echocardiographic and computed tomographic study. J. Am. Coll. Cardiol. 2013, 62, 2329–2338. [Google Scholar] [CrossRef] [PubMed]
- Pawade, T.; Clavel, M.-A.; Tribouilloy, C.; Dreyfus, J.; Mathieu, T.; Tastet, L.; Renard, C.; Gun, M.; Jenkins, W.S.A.; Macron, L.; et al. Computed Tomography Aortic Valve Calcium Scoring in Patients With Aortic Stenosis. Circ. Cardiovasc. Imaging 2018, 11, e007146. [Google Scholar] [CrossRef]
- Feuchtner, G.M.; Müller, S.; Bonatti, J.O.; Schachner, T.; Velik-Salchner, C.; Pachinger, O.; Dichtl, W. Sixty-four slice CT evaluation of aortic stenosis using planimetry of the aortic valve area. AJR Am. J. Roentgenol. 2007, 189, 197–203. [Google Scholar] [CrossRef]
- Clavel, M.-A.; Malouf, J.; Messika-Zeitoun, D.; Araoz, P.A.; Michelena, H.I.; Enriquez-Sarano, M. Aortic valve area calculation in aortic stenosis by CT and Doppler echocardiography. JACC Cardiovasc. Imaging 2015, 8, 248–257. [Google Scholar] [CrossRef] [PubMed]
- Gohmann, R.F.; Lauten, P.; Seitz, P.; Krieghoff, C.; Lücke, C.; Gottschling, S.; Mende, M.; Weiß, S.; Wilde, J.; Kiefer, P.; et al. Combined Coronary CT-Angiography and TAVI-Planning: A Contrast-Neutral Routine Approach for Ruling-Out Significant Coronary Artery Disease. J. Clin. Med. 2020, 9, 1623. [Google Scholar] [CrossRef] [PubMed]
- Gohmann, R.F.; Seitz, P.; Pawelka, K.; Majunke, N.; Schug, A.; Heiser, L.; Renatus, K.; Desch, S.; Lauten, P.; Holzhey, D.; et al. Combined Coronary CT-Angiography and TAVI Planning: Utility of CT-FFR in Patients with Morphologically Ruled-Out Obstructive Coronary Artery Disease. J. Clin. Med. 2022, 11, 1331. [Google Scholar] [CrossRef] [PubMed]
- Chun, E.J.; Choi, S.I.; Lim, C.; Park, K.-H.; Chang, H.-J.; Choi, D.-J.; Kim, D.H.; Lee, W.; Park, J.H. Aortic Stenosis: Evaluation with Multidetector CT Angiography and MR Imaging. Korean J. Radiol. 2008, 9, 439–448. [Google Scholar] [CrossRef]
- Bohbot, Y.; Renard, C.; Manrique, A.; Levy, F.; Maréchaux, S.; Gerber, B.L.; Tribouilloy, C. Usefulness of Cardiac Magnetic Resonance Imaging in Aortic Stenosis. Circ. Cardiovasc. Imaging 2020, 13, e010356. [Google Scholar] [CrossRef] [PubMed]
- Woldendorp, K.; Bannon, P.G.; Grieve, S.M. Evaluation of aortic stenosis using cardiovascular magnetic resonance: A systematic review & meta-analysis. J. Cardiovasc. Magn. Reson. 2020, 22, 45–49. [Google Scholar] [CrossRef] [PubMed]
- Reant, P.; Lederlin, M.; Lafitte, S.; Serri, K.; Montaudon, M.; Corneloup, O.; Roudaut, R.; Laurent, F. Absolute assessment of aortic valve stenosis by planimetry using cardiovascular magnetic resonance imaging: Comparison with transesophageal echocardiography, transthoracic echocardiography, and cardiac catheterisation. Eur. J. Radiol. 2006, 59, 276–283. [Google Scholar] [CrossRef] [PubMed]
- Levy, F.; Iacuzio, L.; Civaia, F.; Rusek, S.; Dommerc, C.; Hugues, N.; Alexandrescu, C.; Dor, V.; Tribouilloy, C.; Dreyfus, G. Usefulness of 3-Tesla cardiac magnetic resonance imaging in the assessment of aortic stenosis severity in routine clinical practice. Arch. Cardiovasc. Dis. 2016, 109, 618–625. [Google Scholar] [CrossRef] [PubMed]
- Puymirat, E.; Chassaing, S.; Trinquart, L.; Barbey, C.; Chaudeurge, A.; Bar, O.; Blanchard, D. Hakki’s Formula for Measurement of Aortic Valve Area by Magnetic Resonance Imaging. Am. J. Cardiol. 2010, 106, 249–254. [Google Scholar] [CrossRef]
- Defrance, C.; Bollache, E.; Kachenoura, N.; Perdrix, L.; Hrynchyshyn, N.; Bruguière, E.; Redheuil, A.; Diebold, B.; Mousseaux, E. Evaluation of aortic valve stenosis using cardiovascular magnetic resonance: Comparison of an original semiautomated analysis of phase-contrast cardiovascular magnetic resonance with Doppler echocardiography. Circ. Cardiovasc. Imaging 2012, 5, 604–612. [Google Scholar] [CrossRef]
- Valenti, V.; Sciarretta, S.; Levin, M.; Shubayev, L.; Edelstein, S.; Zia, M.I.; Rubattu, S.; Volpe, M.; Uretsky, S.; Wolff, S.D. An easy and reproducible parameter for the assessment of the pressure gradient in patients with aortic stenosis disease: A magnetic resonance study. J. Cardiol. 2015, 65, 369–376. [Google Scholar] [CrossRef] [PubMed]
- Eichenberger, A.C.; Jenni, R.; von Schulthess, G.K. Aortic valve pressure gradients in patients with aortic valve stenosis: Quantification with velocity-encoded cine MR imaging. AJR Am. J. Roentgenol. 1993, 160, 971–977. [Google Scholar] [CrossRef] [PubMed]
- Caruthers, S.D.; Lin, S.J.; Brown, P.; Watkins, M.P.; Williams, T.A.; Lehr, K.A.; Wickline, S.A. Practical value of cardiac magnetic resonance imaging for clinical quantification of aortic valve stenosis: Comparison with echocardiography. Circulation 2003, 108, 2236–2243. [Google Scholar] [CrossRef]
- Troger, F.; Tiller, C.; Reindl, M.; Lechner, I.; Holzknecht, M.; Pamminger, M.; Poskaite, P.; Kremser, C.; Ulmer, H.; Gizewski, E.R.; et al. Slice positioning in phase-contrast MRI impacts aortic stenosis assessment. Eur. J. Radiol. 2023, 161, 110722. [Google Scholar] [CrossRef] [PubMed]
- Singh, A.; Horsfield, M.A.; Bekele, S.; Khan, J.N.; Greiser, A.; McCann, G.P. Myocardial T1 and extracellular volume fraction measurement in asymptomatic patients with aortic stenosis: Reproducibility and comparison with age-matched controls. Eur. Heart J.-Cardiovasc. Imaging 2015, 16, 763–770. [Google Scholar] [CrossRef] [PubMed]
- Lee, H.; Park, J.-B.; Yoon, Y.E.; Park, E.-A.; Kim, H.-K.; Lee, W.; Kim, Y.-J.; Cho, G.-Y.; Sohn, D.-W.; Greiser, A.; et al. Noncontrast Myocardial T1 Mapping by Cardiac Magnetic Resonance Predicts Outcome in Patients with Aortic Stenosis. JACC Cardiovasc. Imaging 2018, 11, 974–983. [Google Scholar] [CrossRef] [PubMed]
- Chin, C.W.; Everett, R.J.; Kwiecinski, J.; Vesey, A.T.; Yeung, E.; Esson, G.; Jenkins, W.; Koo, M.; Mirsadraee, S.; White, A.C.; et al. Myocardial Fibrosis and Cardiac Decompensation in Aortic Stenosis. JACC Cardiovasc. Imaging 2016, 10, 1320–1333. [Google Scholar] [CrossRef]
- Musa, T.A.; Treibel, T.A.; Vassiliou, V.S.; Captur, G.; Singh, A.; Chin, C.; Dobson, L.E.; Pica, S.; Loudon, M.; Malley, T.; et al. Myocardial Scar and Mortality in Severe Aortic Stenosis. Circulation 2018, 138, 1935–1947. [Google Scholar] [CrossRef] [PubMed]
- Chen, H.; Zeng, J.; Liu, D.; Yang, Q. Prognostic value of late gadolinium enhancement on CMR in patients with severe aortic valve disease: A systematic review and meta-analysis. Clin. Radiol. 2018, 73, 983.e7–983.e14. [Google Scholar] [CrossRef]
- Dweck, M.R.; Joshi, S.; Murigu, T.; Alpendurada, F.; Jabbour, A.; Melina, G.; Banya, M.; Gulati, A.; Roussin, I.; Raza, S.; et al. Midwall fibrosis is an independent predictor of mortality in patients with aortic stenosis. J. Am. Coll. Cardiol. 2011, 58, 1271–1279. [Google Scholar] [CrossRef]
- Bing, R.; Everett, R.J.; Tuck, C.; Semple, S.; Lewis, S.; Harkess, R.; Mills, N.L.; Treibel, T.A.; Prasad, S.; Greenwood, J.P.; et al. Rationale and design of the randomized, controlled Early Valve Replacement Guided by Biomarkers of Left Ventricular Decompensation in Asymptomatic Patients with Severe Aortic Stenosis (EVOLVED) trial. Am. Heart J. 2019, 212, 91–100. [Google Scholar] [CrossRef]
- Nitsche, C.; Scully, P.R.; Patel, K.P.; Kammerlander, A.A.; Koschutnik, M.; Dona, C.; Wollenweber, T.; Ahmed, N.; Thornton, G.D.; Kelion, A.D.; et al. Prevalence and Outcomes of Concomitant Aortic Stenosis and Cardiac Amyloidosis. J. Am. Coll. Cardiol. 2021, 77, 128–139. [Google Scholar] [CrossRef]
- Pazos-López, P.; Paredes-Galán, E.; Peteiro-Vázquez, J.; López-Rodríguez, E.; García-Rodríguez, C.; Bilbao-Quesada, R.; Blanco-González, A.; González-Ríos, C.; Calvo-Iglesias, F.; Íñiguez-Romo, A. Value of non-apical echocardiographic views in the up-grading of patients with aortic stenosis. Scand. Cardiovasc. J. 2021, 55, 279–286. [Google Scholar] [CrossRef]
- Minners, J.; Allgeier, M.; Gohlke-Baerwolf, C.; Kienzle, R.-P.; Neumann, F.-J.; Jander, N. Inconsistencies of echocardiographic criteria for the grading of aortic valve stenosis. Eur. Heart J. 2007, 29, 1043–1048. [Google Scholar] [CrossRef] [PubMed]
- Tavli, T.; Ammar, A.; Wong, M. Doppler-derived aortic valve gradients: Imaging versus non-imaging techniques. J. Heart Valve Dis. 1993, 2, 253–256. [Google Scholar]
- Unger, P.; Powers, A.; Le Nezet, E.; Lacasse-Rioux, E.; Galloo, X.; Clavel, M.-A. Prevalence and Outcomes of Patients with Discordant High-Gradient Aortic Stenosis. J. Am. Coll. Cardiol. 2024, 83, 1109–1119. [Google Scholar] [CrossRef] [PubMed]
- Blais, C.; Burwash, I.G.; Mundigler, G.; Dumesnil, J.G.; Loho, N.; Rader, F.; Baumgartner, H.; Beanlands, R.S.; Chayer, B.; Kadem, L.; et al. Projected valve area at normal flow rate improves the assessment of stenosis severity in patients with low-flow, low-gradient aortic stenosis: The multicenter TOPAS (Truly or Pseudo-Severe Aortic Stenosis) study. Circulation 2006, 113, 711–721. [Google Scholar] [CrossRef]
- Clavel, M.A.; Fuchs, C.; Burwash, I.G.; Mundigler, G.; Dumesnil, J.G.; Baumgartner, H.; Bergler-Klein, J.; Beanlands, R.S.; Mathieu, P.; Magne, J.; et al. Predictors of outcomes in low-flow, low-gradient aortic stenosis: Results of the multicenter TOPAS Study. Circulation 2008, 118 (Suppl. S14), S234–S242. [Google Scholar] [CrossRef] [PubMed]
- Annabi, M.-S.; Touboul, E.; Dahou, A.; Burwash, I.G.; Bergler-Klein, J.; Enriquez-Sarano, M.; Orwat, S.; Baumgartner, H.; Mascherbauer, J.; Mundigler, G.; et al. Dobutamine Stress Echocardiography for Management of Low-Flow, Low-Gradient Aortic Stenosis. J. Am. Coll. Cardiol. 2018, 71, 475–485. [Google Scholar] [CrossRef]
- Monin, J.L.; Quéré, J.P.; Monchi, M.; Petit, H.; Baleynaud, S.; Chauvel, C.; Pop, C.; Ohlmann, P.; Lelguen, C.; Dehant, P.; et al. Low-gradient aortic stenosis: Operative risk stratification and predictors for long-term outcome: A multicenter study using dobutamine stress hemodynamics. Circulation 2003, 108, 319–324. [Google Scholar] [CrossRef]
- Vahanian, A.; Beyersdorf, F.; Praz, F.; Milojevic, M.; Baldus, S.; Bauersachs, J.; Capodanno, D.; Conradi, L.; De Bonis, M.; De Paulis, R.; et al. ESC/EACTS Guidelines for the management of valvular heart disease. Eur. Heart J. 2021, 1–72. [Google Scholar] [CrossRef] [PubMed]
- Clavel, M.-A.; Guzzetti, E.; Annabi, M.-S.; Salaun, E.; Ong, G.; Pibarot, P. Normal-Flow Low-Gradient Severe Aortic Stenosis: Myth or Reality? Struct. Heart 2018, 2, 180–187. [Google Scholar] [CrossRef]
- Mehrotra, P.; Jansen, K.; Flynn, A.W.; Tan, T.C.; Elmariah, S.; Picard, M.H.; Hung, J. Differential left ventricular remodelling and longitudinal function distinguishes low flow from normal-flow preserved ejection fraction low-gradient severe aortic stenosis. Eur. Heart J. 2013, 34, 1906–1914. [Google Scholar] [CrossRef] [PubMed]
- Saeed, S.; Vamvakidou, A.; Seifert, R.; Khattar, R.; Li, W.; Senior, R. The impact of aortic valve replacement on survival in patients with normal flow low gradient severe aortic stenosis: A propensity-matched comparison. Eur. Heart J.-Cardiovasc. Imaging 2019, 20, 1094–1101. [Google Scholar] [CrossRef] [PubMed]
- Galian-Gay, L.; Teixidó-Turà, G.; Casas, G.; Ferrer-Sistach, E.; Mitroi, C.; Mingo, S.; Monivas, V.; Saura, D.; Vidal, B.; Moral, S.; et al. Changes in echocardiographic parameters over time in paradoxical low-flow low-gradient aortic stenosis. Eur. Heart J. Cardiovasc. Imaging 2023, 24, 1120–1128. [Google Scholar] [CrossRef] [PubMed]
- Dayan, V.; Vignolo, G.; Magne, J.; Clavel, M.-A.; Mohty, D.; Pibarot, P. Outcome and Impact of Aortic Valve Replacement in Patients With Preserved LVEF and Low-Gradient Aortic Stenosis. J. Am. Coll. Cardiol. 2015, 66, 2594–2603. [Google Scholar] [CrossRef] [PubMed]
- Thomas, S.L.; Heaton, J.; Makaryus, A.N. Physiology, Cardiovascular Murmurs; StatPearls Publishing: Treasure Island, FL, USA, 2024. [Google Scholar]
- Esquitin, K.A.; Khalique, O.K.; Liu, Q.; Kodali, S.K.; Marcoff, L.; Nazif, T.M.; George, I.; Vahl, T.P.; Leon, M.B.; Hahn, R.T. Accuracy of the Single Cycle Length Method for Calculation of Aortic Effective Orifice Area in Irregular Heart Rhythms. J. Am. Soc. Echocardiogr. 2019, 32, 344–350. [Google Scholar] [CrossRef] [PubMed]
- Zilberszac, R.; Gabriel, H.; Schemper, M.; Zahler, D.; Czerny, M.; Maurer, G.; Rosenhek, R. Outcome of combined stenotic and regurgitant aortic valve disease. J. Am. Coll. Cardiol. 2013, 61, 1489–1495. [Google Scholar] [CrossRef]
- Iung, B.; Vahanian, A. Epidemiology of valvular heart disease in the adult. Nat. Rev. Cardiol. 2011, 8, 162–172. [Google Scholar] [CrossRef]
- Zilberszac, R.; Gleiss, A.; Binder, T.; Laufer, G.; Grimm, M.; Gabriel, H.; Maurer, G.; Rosenhek, R. Prognostic relevance of mitral and tricuspid regurgitation in patients with severe aortic stenosis. Eur. Heart J.-Cardiovasc. Imaging 2018, 19, 985–992. [Google Scholar] [CrossRef]
- Nombela-Franco, L.; Eltchaninoff, H.; Zahn, R.; Testa, L.; Leon, M.B.; Trillo-Nouche, R.; D’Onofrio, A.; Smith, C.R.; Webb, J.; Bleiziffer, S.; et al. Clinical impact and evolution of mitral regurgitation following transcatheter aortic valve replacement: A meta-analysis. Heart 2015, 101, 1395–1405. [Google Scholar] [CrossRef] [PubMed]
- Ramsay, J.; Tang, Y.; Kim, J.K.; Frangieh, A.H. Transcatheter Treatment of Mitral Valve Regurgitation in the Setting of Concomitant Coronary or Multivalvular Heart Disease: A Focused Review. Interv. Cardiol. Clin. 2024, 13, 279–289. [Google Scholar] [CrossRef] [PubMed]
- Baumgartner, H.; Hung, J.; Bermejo, J.; Chambers, J.B.; Evangelista, A.; Griffin, B.P.; Iung, B.; Otto, C.M.; Pellikka, A.; Quiñones, M. Echocardiographic Assessment of Valve Stenosis: EAE/ASE Recommendations for Clinical Practice. J. Am. Soc. Echocardiogr. 2009, 22, 1–23. [Google Scholar] [CrossRef] [PubMed]
- Kato, N.; Padang, R.; Pislaru, C.; Miranda, W.R.; Hoshina, M.; Shibayama, K.; Watanabe, H.; Scott, C.G.; Greason, K.L.; Pislaru, S.V.; et al. Hemodynamics and Prognostic Impact of Concomitant Mitral Stenosis in Patients Undergoing Surgical or Transcatheter Aortic Valve Replacement for Aortic Stenosis. Circulation 2019, 140, 1251–1260. [Google Scholar] [CrossRef] [PubMed]
- Yamashita, Y.; Sicouri, S.; Dokollari, A.; Senzai, M.; Rodriguez, R.; Gnall, E.; Coady, P.; Jarrett, H.; Abramson, S.; Hawthorne, K.; et al. Impact of mitral stenosis on early and late outcomes of transcatheter aortic valve replacement for aortic stenosis: A single-center analysis. J. Invasive Cardiol. 2024, 36. [Google Scholar] [CrossRef]

| LG AS: AVA < 1 cm2, VMax < 4 m/s and MG < 40 mmHg | ||
|---|---|---|
| Type | SVi | LVEF |
| Classical LF–LG | <35 mL/m2 | Reduced (<50%) |
| Paradoxical LF-LG | <35 mL/m2 | Preserved (≥50%) |
| NF–LG | >35 mL/m2 | Preserved (≥50%) |
Disclaimer/Publisher’s Note: The statements, opinions and data contained in all publications are solely those of the individual author(s) and contributor(s) and not of MDPI and/or the editor(s). MDPI and/or the editor(s) disclaim responsibility for any injury to people or property resulting from any ideas, methods, instructions or products referred to in the content. |
© 2024 by the authors. Licensee MDPI, Basel, Switzerland. This article is an open access article distributed under the terms and conditions of the Creative Commons Attribution (CC BY) license (https://creativecommons.org/licenses/by/4.0/).
Share and Cite
González-García, A.; Pazos-López, P.; Calvo-Iglesias, F.E.; Matajira-Chía, T.M.; Bilbao-Quesada, R.; Blanco-González, E.; González-Ríos, C.; Castiñeira-Busto, M.; Barreiro-Pérez, M.; Íñiguez-Romo, A. Diagnostic Challenges in Aortic Stenosis. J. Cardiovasc. Dev. Dis. 2024, 11, 162. https://doi.org/10.3390/jcdd11060162
González-García A, Pazos-López P, Calvo-Iglesias FE, Matajira-Chía TM, Bilbao-Quesada R, Blanco-González E, González-Ríos C, Castiñeira-Busto M, Barreiro-Pérez M, Íñiguez-Romo A. Diagnostic Challenges in Aortic Stenosis. Journal of Cardiovascular Development and Disease. 2024; 11(6):162. https://doi.org/10.3390/jcdd11060162
Chicago/Turabian StyleGonzález-García, André, Pablo Pazos-López, Francisco Eugenio Calvo-Iglesias, Tatiana Mallely Matajira-Chía, Raquel Bilbao-Quesada, Elisa Blanco-González, Carina González-Ríos, María Castiñeira-Busto, Manuel Barreiro-Pérez, and Andrés Íñiguez-Romo. 2024. "Diagnostic Challenges in Aortic Stenosis" Journal of Cardiovascular Development and Disease 11, no. 6: 162. https://doi.org/10.3390/jcdd11060162
APA StyleGonzález-García, A., Pazos-López, P., Calvo-Iglesias, F. E., Matajira-Chía, T. M., Bilbao-Quesada, R., Blanco-González, E., González-Ríos, C., Castiñeira-Busto, M., Barreiro-Pérez, M., & Íñiguez-Romo, A. (2024). Diagnostic Challenges in Aortic Stenosis. Journal of Cardiovascular Development and Disease, 11(6), 162. https://doi.org/10.3390/jcdd11060162