
Longitudinal Changes in the Myocardial T1 Relaxation Time, Extracellular Volume Fraction, and Left Ventricular Function in Asymptomatic Men


Abstract
1. Introduction
2. Materials and Methods
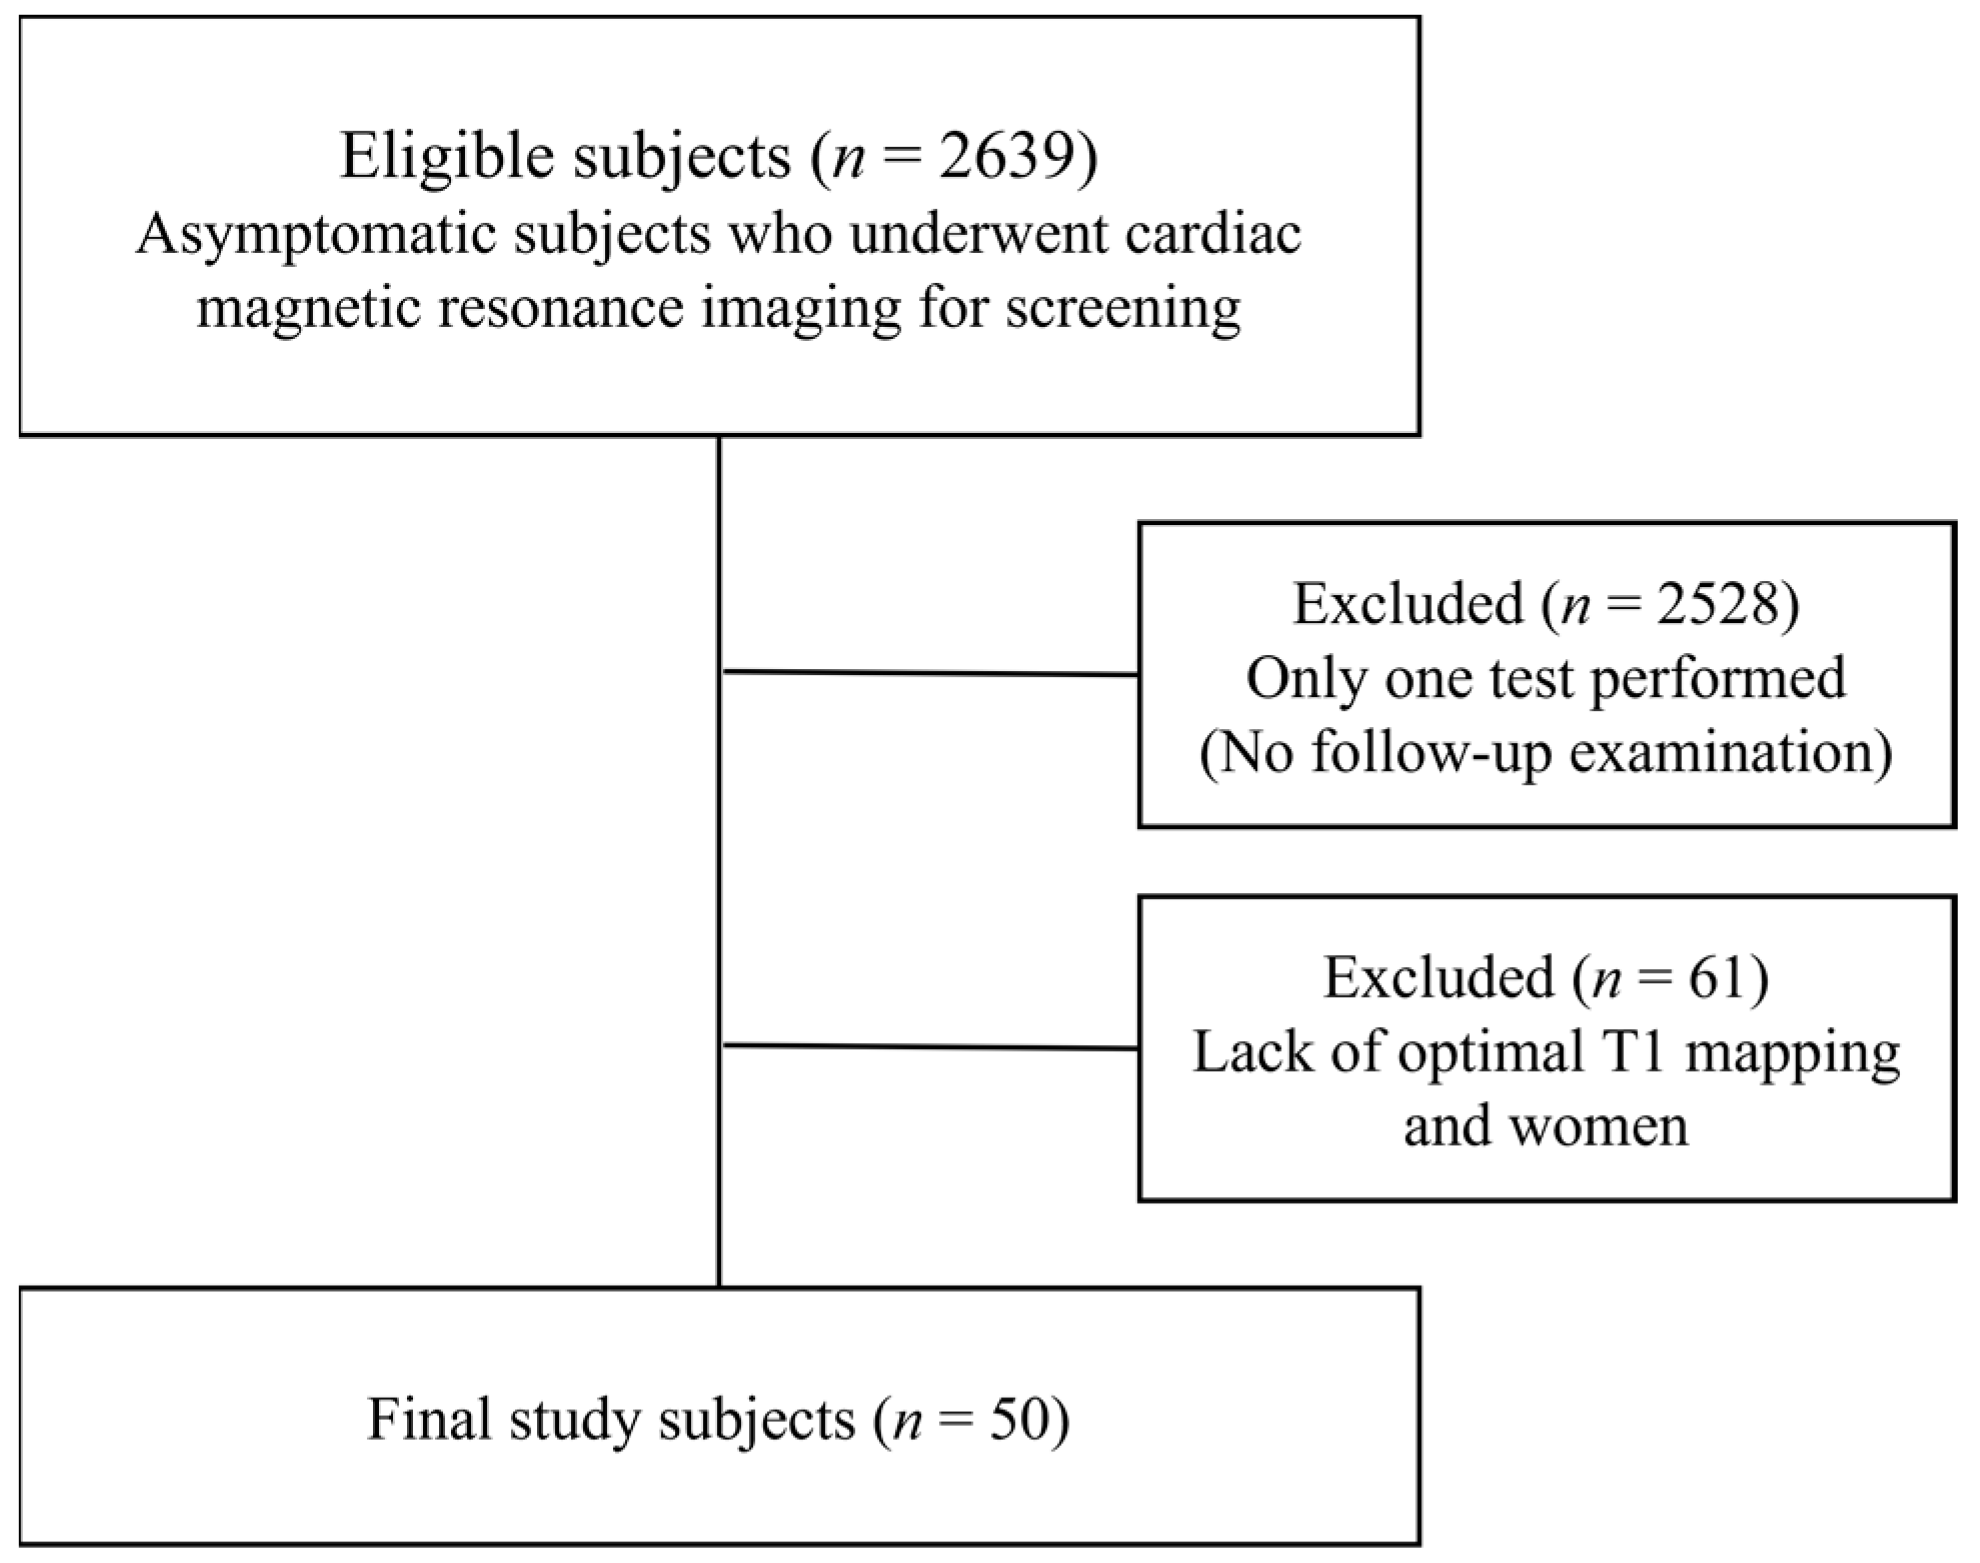
2.1. Patient Selection
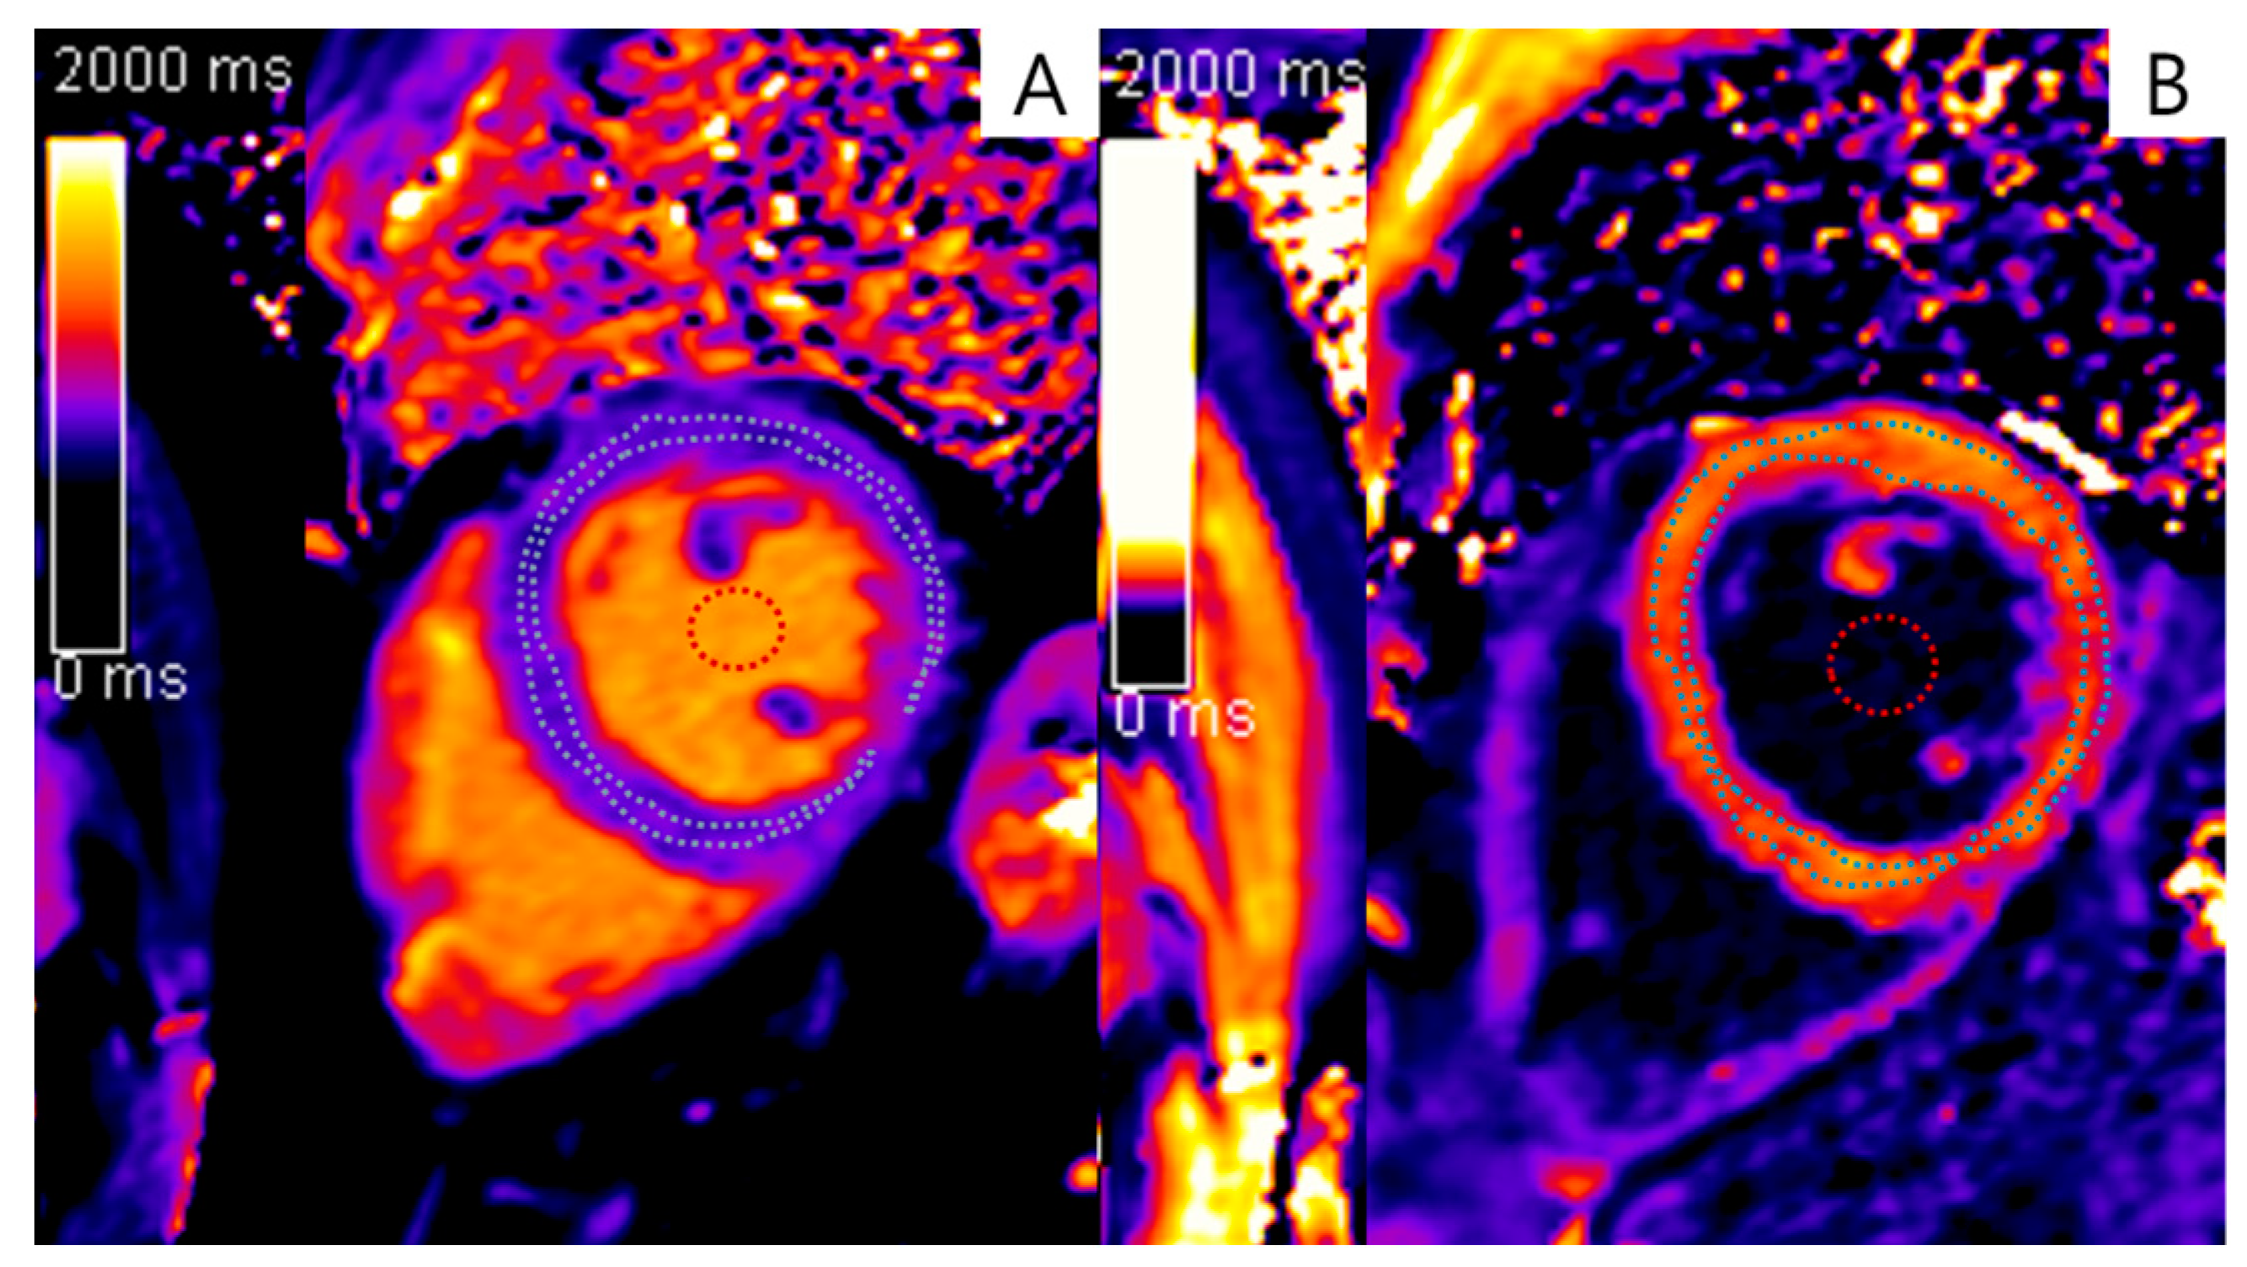
2.2. CMR Protocol and Image Analysis
2.3. ECVF Calculation
2.4. Clinical Information
2.5. Statistical Analysis
3. Results
4. Discussion
5. Conclusions
Author Contributions
Funding
Institutional Review Board Statement
Informed Consent Statement
Data Availability Statement
Acknowledgments
Conflicts of Interest
References
- Mason, T.; Coelho-Filho, O.R.; Verma, S.; Chowdhury, B.; Zuo, F.; Quan, A.; Thorpe, K.E.; Bonneau, C.; Teoh, H.; Gilbert, R.E.; et al. Empagliflozin Reduces Myocardial Extracellular Volume in Patients With Type 2 Diabetes and Coronary Artery Disease. JACC Cardiovasc. Imaging 2021, 14, 1164–1173. [Google Scholar] [CrossRef]
- Lee, S.P.; Lee, W.; Lee, J.M.; Park, E.A.; Kim, H.K.; Kim, Y.J.; Sohn, D.W. Assessment of diffuse myocardial fibrosis by using MR imaging in asymptomatic patients with aortic stenosis. Radiology 2015, 274, 359–369. [Google Scholar] [CrossRef]
- Diao, K.Y.; Yang, Z.G.; Xu, H.Y.; Liu, X.; Zhang, Q.; Shi, K.; Jiang, L.; Xie, L.J.; Wen, L.Y.; Guo, Y.K. Histologic validation of myocardial fibrosis measured by T1 mapping: A systematic review and meta-analysis. J. Cardiovasc. Magn. Reson. 2016, 18, 92. [Google Scholar] [CrossRef]
- Iles, L.M.; Ellims, A.H.; Llewellyn, H.; Hare, J.L.; Kaye, D.M.; McLean, C.A.; Taylor, A.J. Histological validation of cardiac magnetic resonance analysis of regional and diffuse interstitial myocardial fibrosis. Eur. Heart J. Cardiovasc. Imaging 2015, 16, 14–22. [Google Scholar] [CrossRef] [PubMed]
- Kockova, R.; Kacer, P.; Pirk, J.; Maly, J.; Sukupova, L.; Sikula, V.; Kotrc, M.; Barciakova, L.; Honsova, E.; Maly, M.; et al. Native T1 Relaxation Time and Extracellular Volume Fraction as Accurate Markers of Diffuse Myocardial Fibrosis in Heart Valve Disease-Comparison With Targeted Left Ventricular Myocardial Biopsy. Circ. J. 2016, 80, 1202–1209. [Google Scholar] [CrossRef]
- Duca, F.; Kammerlander, A.A.; Panzenböck, A.; Binder, C.; Aschauer, S.; Loewe, C.; Agis, H.; Kain, R.; Hengstenberg, C.; Bonderman, D.; et al. Cardiac Magnetic Resonance T(1) Mapping in Cardiac Amyloidosis. JACC Cardiovasc. Imaging 2018, 11, 1924–1926. [Google Scholar] [CrossRef]
- van den Boomen, M.; Slart, R.; Hulleman, E.V.; Dierckx, R.; Velthuis, B.K.; van der Harst, P.; Sosnovik, D.E.; Borra, R.J.H.; Prakken, N.H.J. Native T(1) reference values for nonischemic cardiomyopathies and populations with increased cardiovascular risk: A systematic review and meta-analysis. J. Magn. Reson. Imaging 2018, 47, 891–912. [Google Scholar] [CrossRef]
- Reinstadler, S.J.; Stiermaier, T.; Liebetrau, J.; Fuernau, G.; Eitel, C.; de Waha, S.; Desch, S.; Reil, J.C.; Pöss, J.; Metzler, B.; et al. Prognostic Significance of Remote Myocardium Alterations Assessed by Quantitative Noncontrast T1 Mapping in ST-Segment Elevation Myocardial Infarction. JACC Cardiovasc. Imaging 2018, 11, 411–419. [Google Scholar] [CrossRef] [PubMed]
- Lurz, J.A.; Luecke, C.; Lang, D.; Besler, C.; Rommel, K.P.; Klingel, K.; Kandolf, R.; Adams, V.; Schöne, K.; Hindricks, G.; et al. CMR-Derived Extracellular Volume Fraction as a Marker for Myocardial Fibrosis: The Importance of Coexisting Myocardial Inflammation. JACC Cardiovasc. Imaging 2018, 11, 38–45. [Google Scholar] [CrossRef] [PubMed]
- Everett, R.J.; Treibel, T.A.; Fukui, M.; Lee, H.; Rigolli, M.; Singh, A.; Bijsterveld, P.; Tastet, L.; Musa, T.A.; Dobson, L.; et al. Extracellular Myocardial Volume in Patients With Aortic Stenosis. J. Am. Coll. Cardiol. 2020, 75, 304–316. [Google Scholar] [CrossRef]
- Rosmini, S.; Bulluck, H.; Captur, G.; Treibel, T.A.; Abdel-Gadir, A.; Bhuva, A.N.; Culotta, V.; Merghani, A.; Fontana, M.; Maestrini, V.; et al. Myocardial native T1 and extracellular volume with healthy ageing and gender. Eur. Heart J. Cardiovasc. Imaging 2018, 19, 615–621. [Google Scholar] [CrossRef]
- Messroghli, D.R.; Moon, J.C.; Ferreira, V.M.; Grosse-Wortmann, L.; He, T.; Kellman, P.; Mascherbauer, J.; Nezafat, R.; Salerno, M.; Schelbert, E.B.; et al. Clinical recommendations for cardiovascular magnetic resonance mapping of T1, T2, T2* and extracellular volume: A consensus statement by the Society for Cardiovascular Magnetic Resonance (SCMR) endorsed by the European Association for Cardiovascular Imaging (EACVI). J. Cardiovasc. Magn. Reson. 2017, 19, 75. [Google Scholar] [CrossRef] [PubMed]
- Goff, D.C.; Lloyd-Jones, D.M.; Bennett, G.; Coady, S.; D’Agostino, R.B.; Gibbons, R.; Greenland, P.; Lackland, D.T.; Levy, D.; O’Donnell, C.J.; et al. 2013 ACC/AHA Guideline on the Assessment of Cardiovascular Risk. Circulation 2014, 129, S49–S73. [Google Scholar] [CrossRef] [PubMed]
- Piechnik, S.K.; Ferreira, V.M.; Lewandowski, A.J.; Ntusi, N.A.; Banerjee, R.; Holloway, C.; Hofman, M.B.; Sado, D.M.; Maestrini, V.; White, S.K.; et al. Normal variation of magnetic resonance T1 relaxation times in the human population at 1.5 T using ShMOLLI. J. Cardiovasc. Magn. Reson. 2013, 15, 13. [Google Scholar] [CrossRef]
- Liu, C.Y.; Liu, Y.C.; Wu, C.; Armstrong, A.; Volpe, G.J.; van der Geest, R.J.; Liu, Y.; Hundley, W.G.; Gomes, A.S.; Liu, S.; et al. Evaluation of age-related interstitial myocardial fibrosis with cardiac magnetic resonance contrast-enhanced T1 mapping: MESA (Multi-Ethnic Study of Atherosclerosis). J. Am. Coll. Cardiol. 2013, 62, 1280–1287. [Google Scholar] [CrossRef] [PubMed]
- Bull, S.; White, S.K.; Piechnik, S.K.; Flett, A.S.; Ferreira, V.M.; Loudon, M.; Francis, J.M.; Karamitsos, T.D.; Prendergast, B.D.; Robson, M.D.; et al. Human non-contrast T1 values and correlation with histology in diffuse fibrosis. Heart 2013, 99, 932–937. [Google Scholar] [CrossRef] [PubMed]
- Sibley, C.T.; Noureldin, R.A.; Gai, N.; Nacif, M.S.; Liu, S.; Turkbey, E.B.; Mudd, J.O.; van der Geest, R.J.; Lima, J.A.; Halushka, M.K.; et al. T1 Mapping in cardiomyopathy at cardiac MR: Comparison with endomyocardial biopsy. Radiology 2012, 265, 724–732. [Google Scholar] [CrossRef] [PubMed]
- Kim, M.Y.; Cho, S.J.; Kim, H.J.; Kim, S.M.; Lee, S.-C.; Paek, M.; Choe, Y.H. T1 values and extracellular volume fraction in asymptomatic subjects: Variations in left ventricular segments and correlation with cardiovascular risk factors. Sci. Rep. 2022, 12, 12544. [Google Scholar] [CrossRef]
- Rauhalammi, S.M.; Mangion, K.; Barrientos, P.H.; Carrick, D.J.; Clerfond, G.; McClure, J.; McComb, C.; Radjenovic, A.; Berry, C. Native myocardial longitudinal (T1 ) relaxation time: Regional, age, and sex associations in the healthy adult heart. J. Magn. Reson. Imaging 2016, 44, 541–548. [Google Scholar] [CrossRef] [PubMed]
- Dabir, D.; Child, N.; Kalra, A.; Rogers, T.; Gebker, R.; Jabbour, A.; Plein, S.; Yu, C.Y.; Otton, J.; Kidambi, A.; et al. Reference values for healthy human myocardium using a T1 mapping methodology: Results from the International T1 Multicenter cardiovascular magnetic resonance study. J. Cardiovasc. Magn. Reson. 2014, 16, 69. [Google Scholar] [CrossRef]
- Liu, C.Y.; Bluemke, D.A.; Gerstenblith, G.; Zimmerman, S.L.; Li, J.; Zhu, H.; Lai, S.; Lai, H. Reference values of myocardial structure, function, and tissue composition by cardiac magnetic resonance in healthy African-Americans at 3T and their relations to serologic and cardiovascular risk factors. Am. J. Cardiol. 2014, 114, 789–795. [Google Scholar] [CrossRef] [PubMed]
- Raisi-Estabragh, Z.; Kenawy, A.A.M.; Aung, N.; Cooper, J.; Munroe, P.B.; Harvey, N.C.; Petersen, S.E.; Khanji, M.Y. Variation in left ventricular cardiac magnetic resonance normal reference ranges: Systematic review and meta-analysis. Eur. Heart J. Cardiovasc. Imaging 2021, 22, 494–504. [Google Scholar] [CrossRef] [PubMed]
- Brandfonbrener, M.; Landowne, M.; Shock, N.W. Changes in Cardiac Output with Age. Circulation 1955, 12, 557–566. [Google Scholar] [CrossRef] [PubMed]
- Dai, X.; Hummel, S.L.; Salazar, J.B.; Taffet, G.E.; Zieman, S.; Schwartz, J.B. Cardiovascular physiology in the older adults. J. Geriatr. Cardiol. 2015, 12, 196–201. [Google Scholar] [CrossRef]


| Characteristics | Initial Assessments | Follow-Up Assessments |
|---|---|---|
| Age (years) | 52.0 ± 5.3 | 56.4 ± 5.6 |
| Hematocrit (%) | 43.4 ± 3.2 | 44.1 ± 2.8 |
| Heart rate (beats/min) | 66.4 ± 10.9 | 67.2 ± 11.2 |
| Total cholesterol (mg/dL) | 184.8 ± 34.5 | 181.2 ± 38.7 |
| HDL cholesterol (mg/dL) | 55.8 ± 14.1 | 56.8 ± 14.1 |
| Triglyceride (mg/dL) | 136.2 ± 102.6 | 128.6 ± 87.4 |
| Creatinine (mg/dL) | 0.96 ± 0.13 | 0.91 ± 0.14 |
| Body weight (kg) | 71.9 ± 10.8 | 72.4 ± 11.2 |
| BMI (kg/m2) | 24.2 ± 2.4 | 24.3 ± 2.7 |
| Systolic blood pressure (mmHg) | 121.5 ± 31.9 | 120.3 ± 17.0 |
| Diastolic blood pressure (mmHg) | 76.1 ± 12.4 | 77.4 ± 11.9 |
| Treated for high blood pressure | 13 (26 %) | 18 (36 %) |
| Diabetes | 2 (4 %) | 3 (6 %) |
| Treated for diabetes | 1 (2%) | 3 (6%) |
| Smoking | 8 (16 %) | 8 (16 %) |
| 10-year ASCVD risk (%) | 4.71 ± 0.19 | 5.16 ± 0.24 |
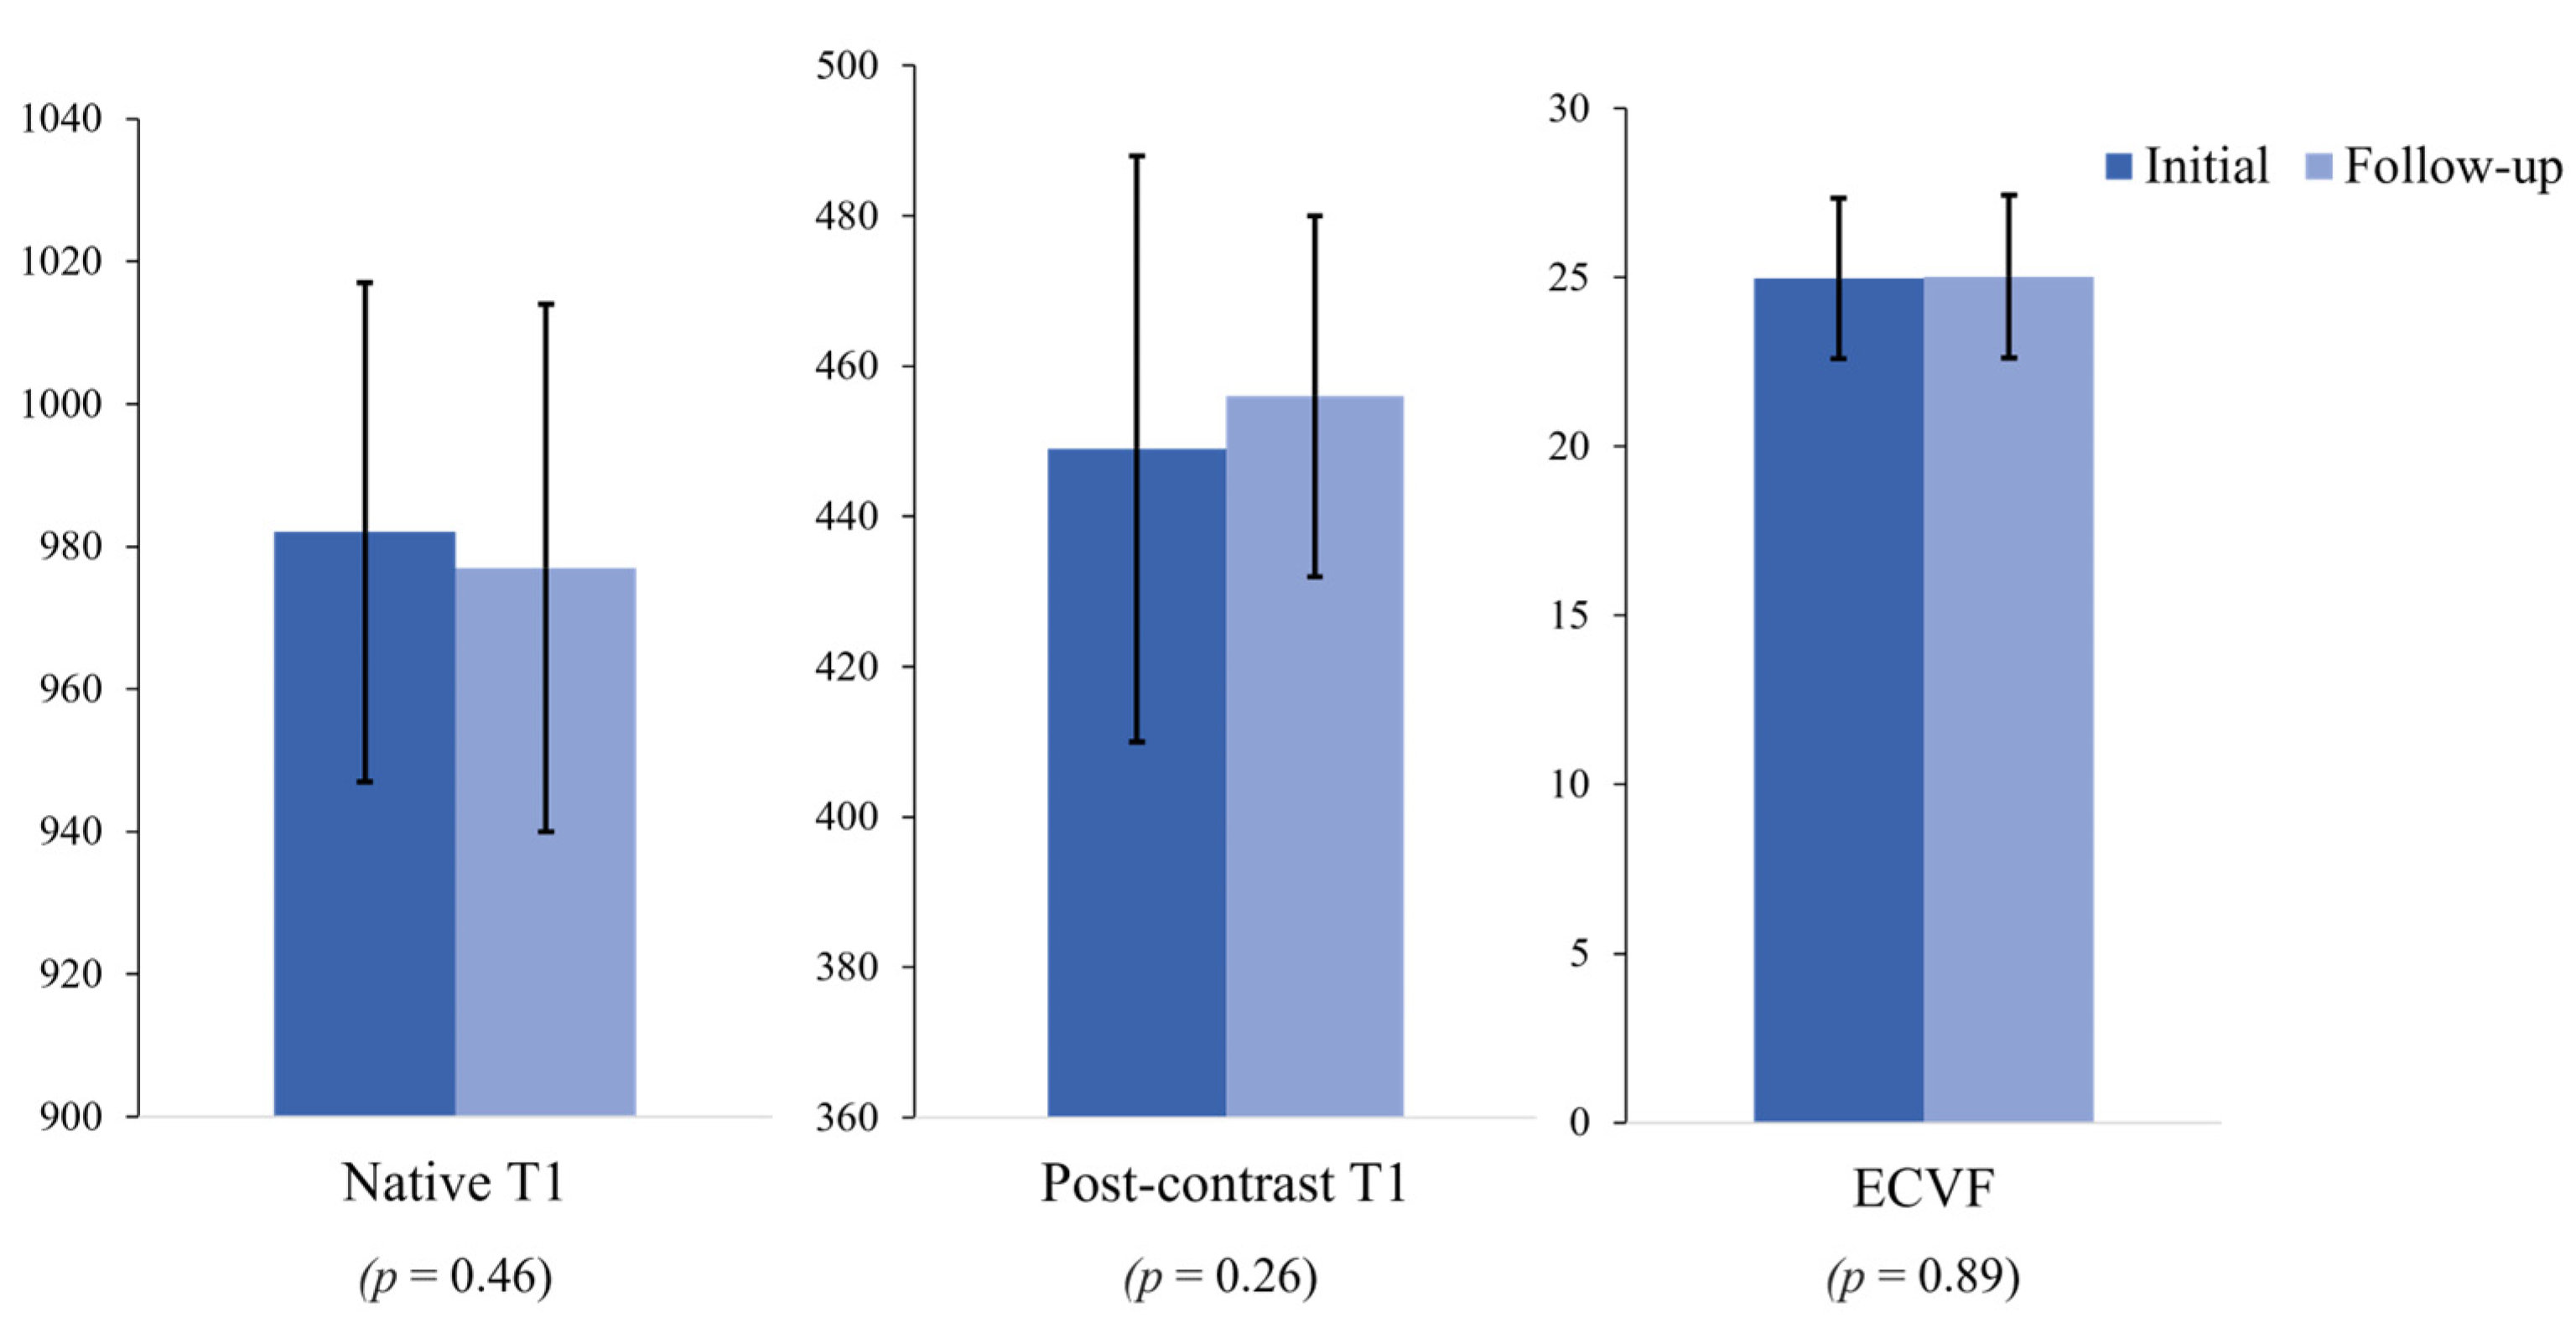
| Left Ventricular Measurements | Initial Assessments | Follow-Up Assessments | p-Value |
|---|---|---|---|
| LV ejection fraction (%) | 65.0 ± 6.7 | 63.6 ± 6.3 | 0.12 |
| LV mass/end-diastolic volume ratio | 0.82 ± 0.12 | 0.80 ± 0.14 | 0.16 |
| LV end-systolic volume (mL) | 46.3 ± 10.4 | 47.1 ± 10.4 | 0.60 |
| Systolic volume index (mL/m2) | 24.7 ± 4.7 | 25.3 ± 4.9 | 0.16 |
| LV end-diastolic volume (mL) | 133.7 ± 18.2 | 135.6 ± 42.3 | 0.76 |
| Diastolic volume index (mL/m2) | 72.2 ± 8.1 | 73.7 ± 24.4 | 0.33 |
| Stroke volume (mL) | 87.2 ± 13.7 | 82.6 ± 15.3 | 0.01 |
| Stroke volume index (mL/m2) | 47.4 ± 6.8 | 44.6 ± 6.5 | 0.01 |
| Cardiac output (L/min) | 5.7 ± 1.1 | 5.5 ± 1.0 | 0.01 |
| Cardiac index (L/min/m2) | 3.1 ± 0.5 | 2.9 ± 0.4 | 0.01 |
| LV mass index (g/m2) | 110.2 ± 22.4 | 104.3 ± 18.3 | 0.01 |
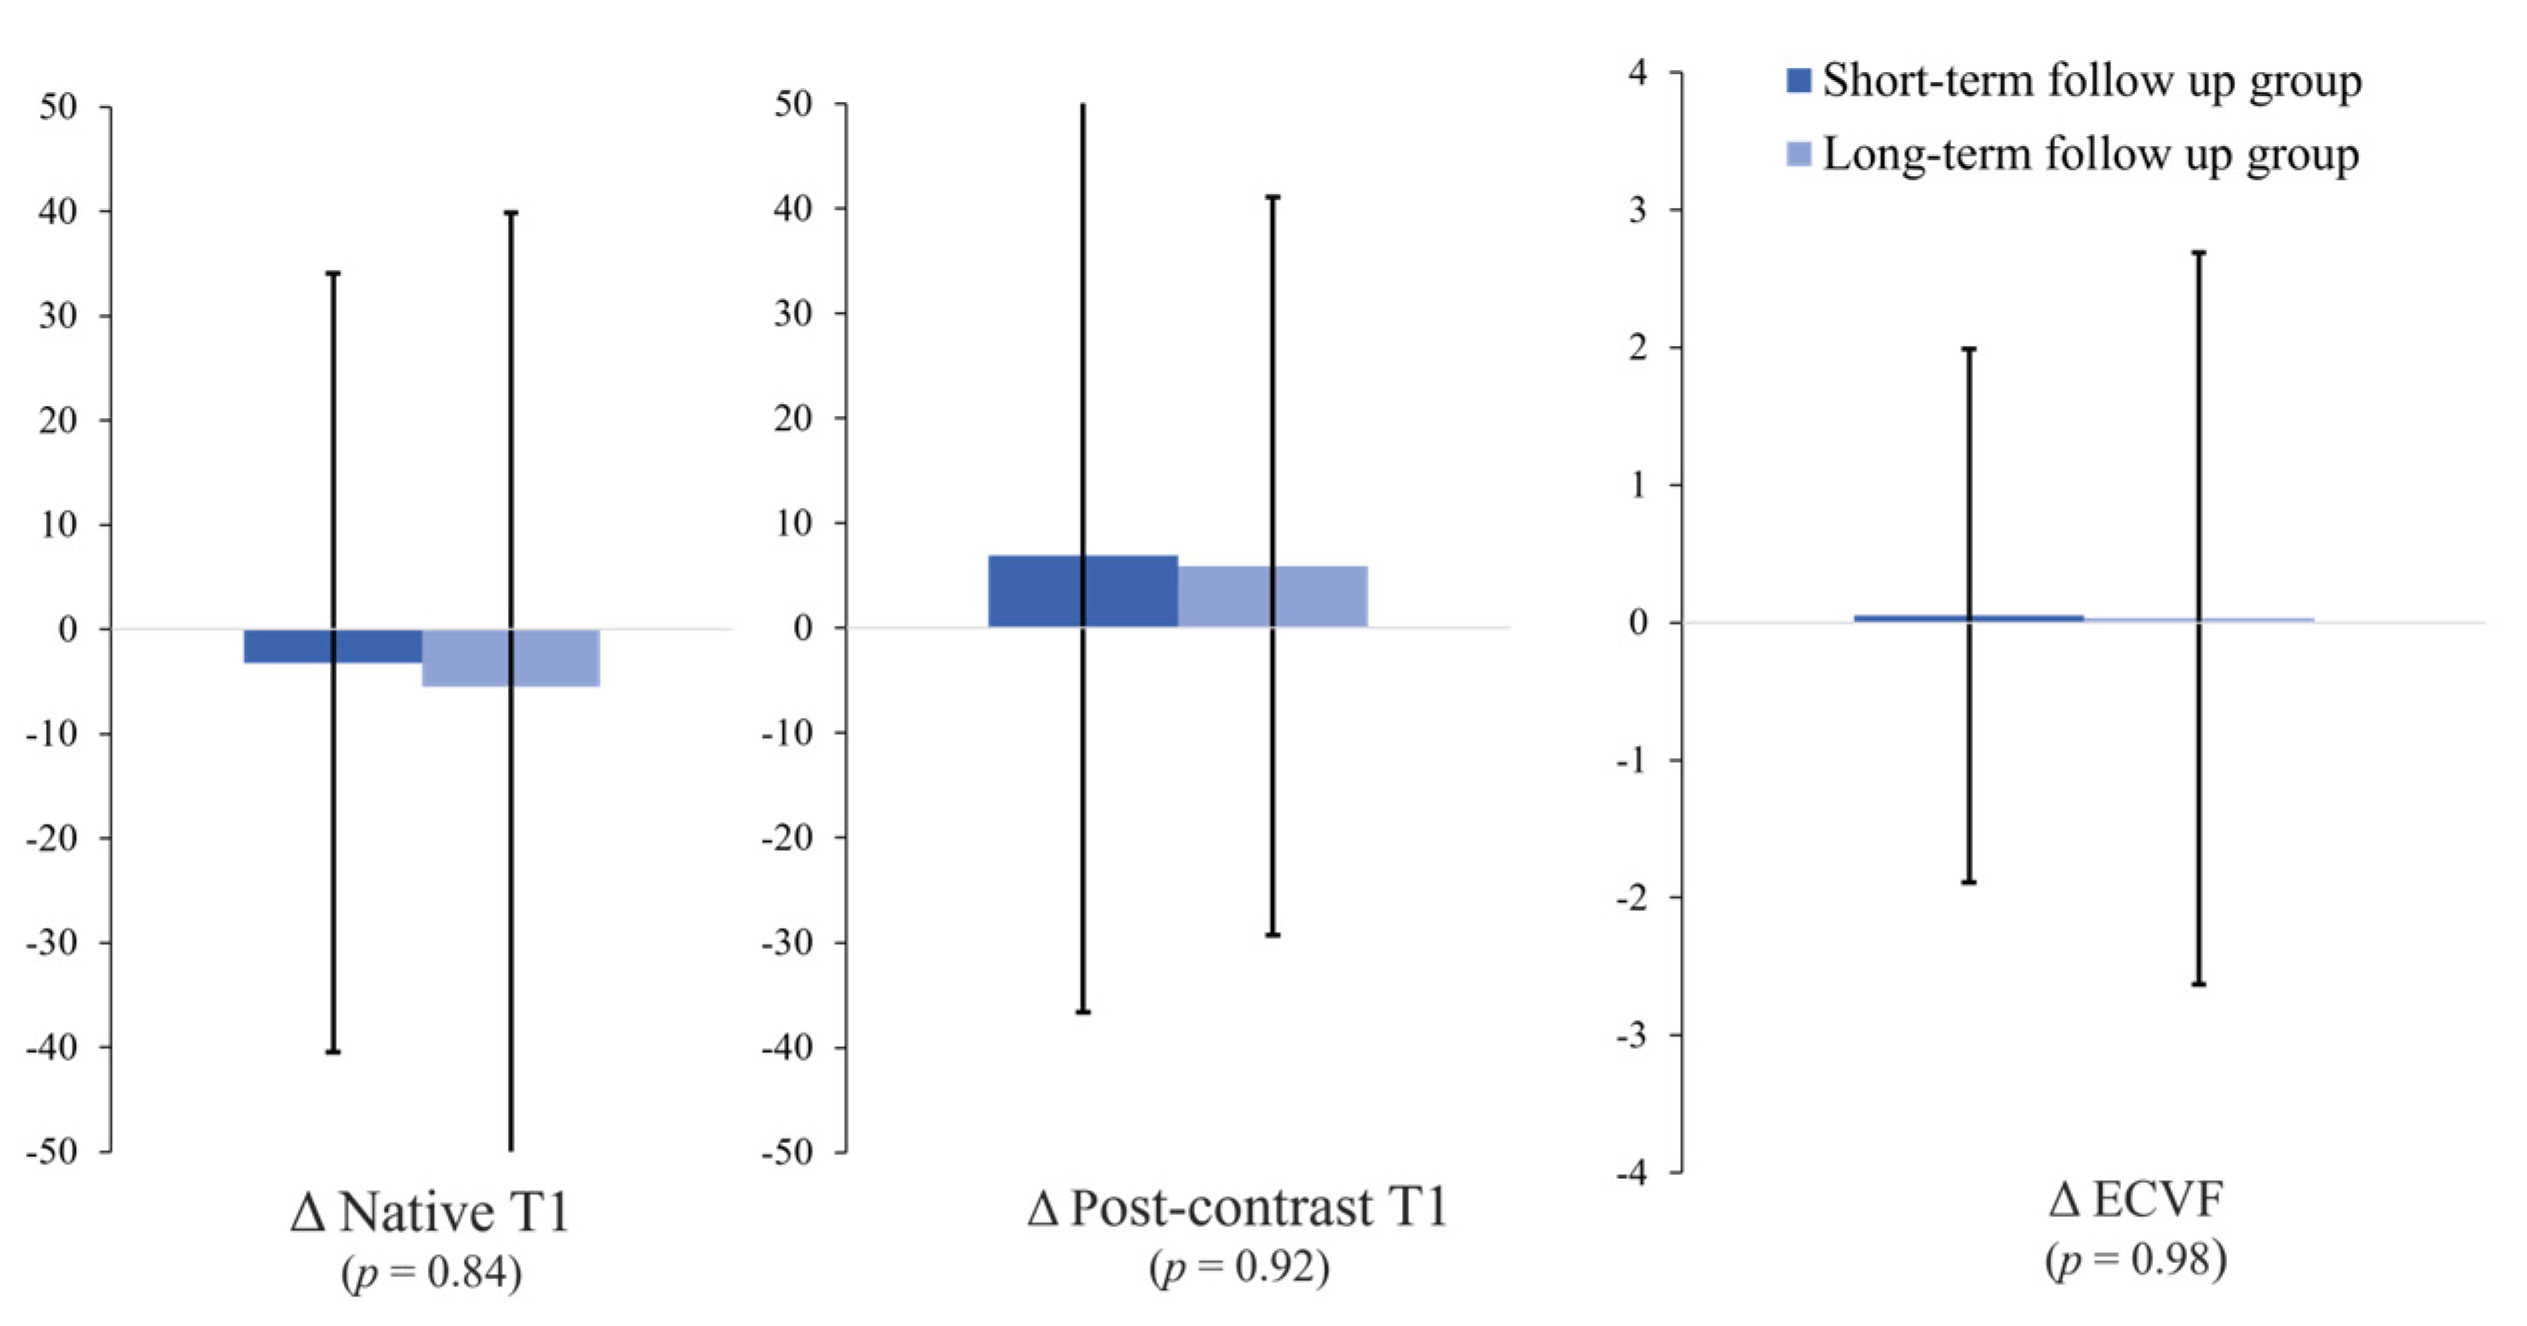
| Short-Term Follow-Up Group (<54 Months, n = 27) | Long-Term Follow-Up Group (≥54 Months, n = 23) | p-Value | |
|---|---|---|---|
| Δnative T1 value (ms) | −3.2 ± 37.3 | −5.5 ± 45.4 | 0.84 |
| Δpost-contrast T1 value (ms) | 6.9 ± 43.5 | 5.9 ± 35.2 | 0.92 |
| ΔECV fraction (%) | 0.05 ± 1.94 | 0.03 ± 2.66 | 0.98 |
| Analysis of the Correlation between the Myocardial T1 Values at the Initial Assessment and the Risk Factors and LV Function Parameters | Correlation Coefficient (r) | p-Value |
| Age | −0.14 | 0.60 |
| ASCVD risk score | −0.10 | >0.95 |
| LVEF | −0.13 | 0.70 |
| LV mass | −0.18 | 0.38 |
| EDV | −0.17 | 0.42 |
| ESV | 0.08 | >0.95 |
| LV mass/end-diastolic volume ratio | −0.08 | >0.95 |
| Analysis of the Correlation between the ECVF at the Initial Assessment and the Risk Factors and LV Function Parameters | Correlation Coefficient (r) | p-Value |
| Age | −0.41 | 0.006 |
| ASCVD risk score | −0.30 | 0.074 |
| LVEF | −0.12 | 0.74 |
| LV mass | 0.01 | >0.95 |
| EDV | −0.54 | <0.001 |
| ESV | 0.07 | >0.95 |
| LV mass/end-diastolic volume ratio | 0.24 | 0.14 |
| Analysis of the Correlation between Changes in the Myocardial T1 Values and the Risk Factors and LV Function Parameters | Correlation Coefficient (r) | p-Value |
| Study interval | 0.28 | 0.08 |
| ΔASCVD risk score | −0.21 | 0.26 |
| ΔLVEF | 0.04 | >0.95 |
| ΔLV mass | 0.02 | >0.95 |
| ΔEDV | −0.47 | <0.001 |
| ΔESV | 0.07 | >0.95 |
| ΔLV mass/EDV ratio | 0.26 | 0.12 |
| Analysis of the Correlation between Changes in the ECVF and the Risk Factors and LV Function Parameters | Correlation Coefficient (r) | p-Value |
| Study interval | 0.05 | >0.95 |
| ΔASCVD risk score | 0.08 | >0.95 |
| ΔLVEF | −0.17 | 0.44 |
| ΔLV mass | 0.14 | 0.62 |
| ΔEDV | −0.17 | 0.40 |
| ΔESV | 0.18 | 0.36 |
| ΔLV mass/EDV ratio | 0.27 | 0.1 |
Disclaimer/Publisher’s Note: The statements, opinions and data contained in all publications are solely those of the individual author(s) and contributor(s) and not of MDPI and/or the editor(s). MDPI and/or the editor(s) disclaim responsibility for any injury to people or property resulting from any ideas, methods, instructions or products referred to in the content. |
© 2023 by the authors. Licensee MDPI, Basel, Switzerland. This article is an open access article distributed under the terms and conditions of the Creative Commons Attribution (CC BY) license (https://creativecommons.org/licenses/by/4.0/).
Share and Cite
Shin, S.H.; Kim, S.M.; Cho, S.-J.; Choe, Y.H. Longitudinal Changes in the Myocardial T1 Relaxation Time, Extracellular Volume Fraction, and Left Ventricular Function in Asymptomatic Men. J. Cardiovasc. Dev. Dis. 2023, 10, 252. https://doi.org/10.3390/jcdd10060252
Shin SH, Kim SM, Cho S-J, Choe YH. Longitudinal Changes in the Myocardial T1 Relaxation Time, Extracellular Volume Fraction, and Left Ventricular Function in Asymptomatic Men. Journal of Cardiovascular Development and Disease. 2023; 10(6):252. https://doi.org/10.3390/jcdd10060252
Chicago/Turabian StyleShin, Sang Hwa, Sung Mok Kim, Soo-Jin Cho, and Yeon Hyeon Choe. 2023. "Longitudinal Changes in the Myocardial T1 Relaxation Time, Extracellular Volume Fraction, and Left Ventricular Function in Asymptomatic Men" Journal of Cardiovascular Development and Disease 10, no. 6: 252. https://doi.org/10.3390/jcdd10060252
APA StyleShin, S. H., Kim, S. M., Cho, S.-J., & Choe, Y. H. (2023). Longitudinal Changes in the Myocardial T1 Relaxation Time, Extracellular Volume Fraction, and Left Ventricular Function in Asymptomatic Men. Journal of Cardiovascular Development and Disease, 10(6), 252. https://doi.org/10.3390/jcdd10060252