
Potential Clinical Usefulness of Post-Valvular Contrast Densities to Determine the Severity of Aortic Valve Stenosis Using Computed Tomography

 , , , , and
Abstract
:1. Background
2. Methods
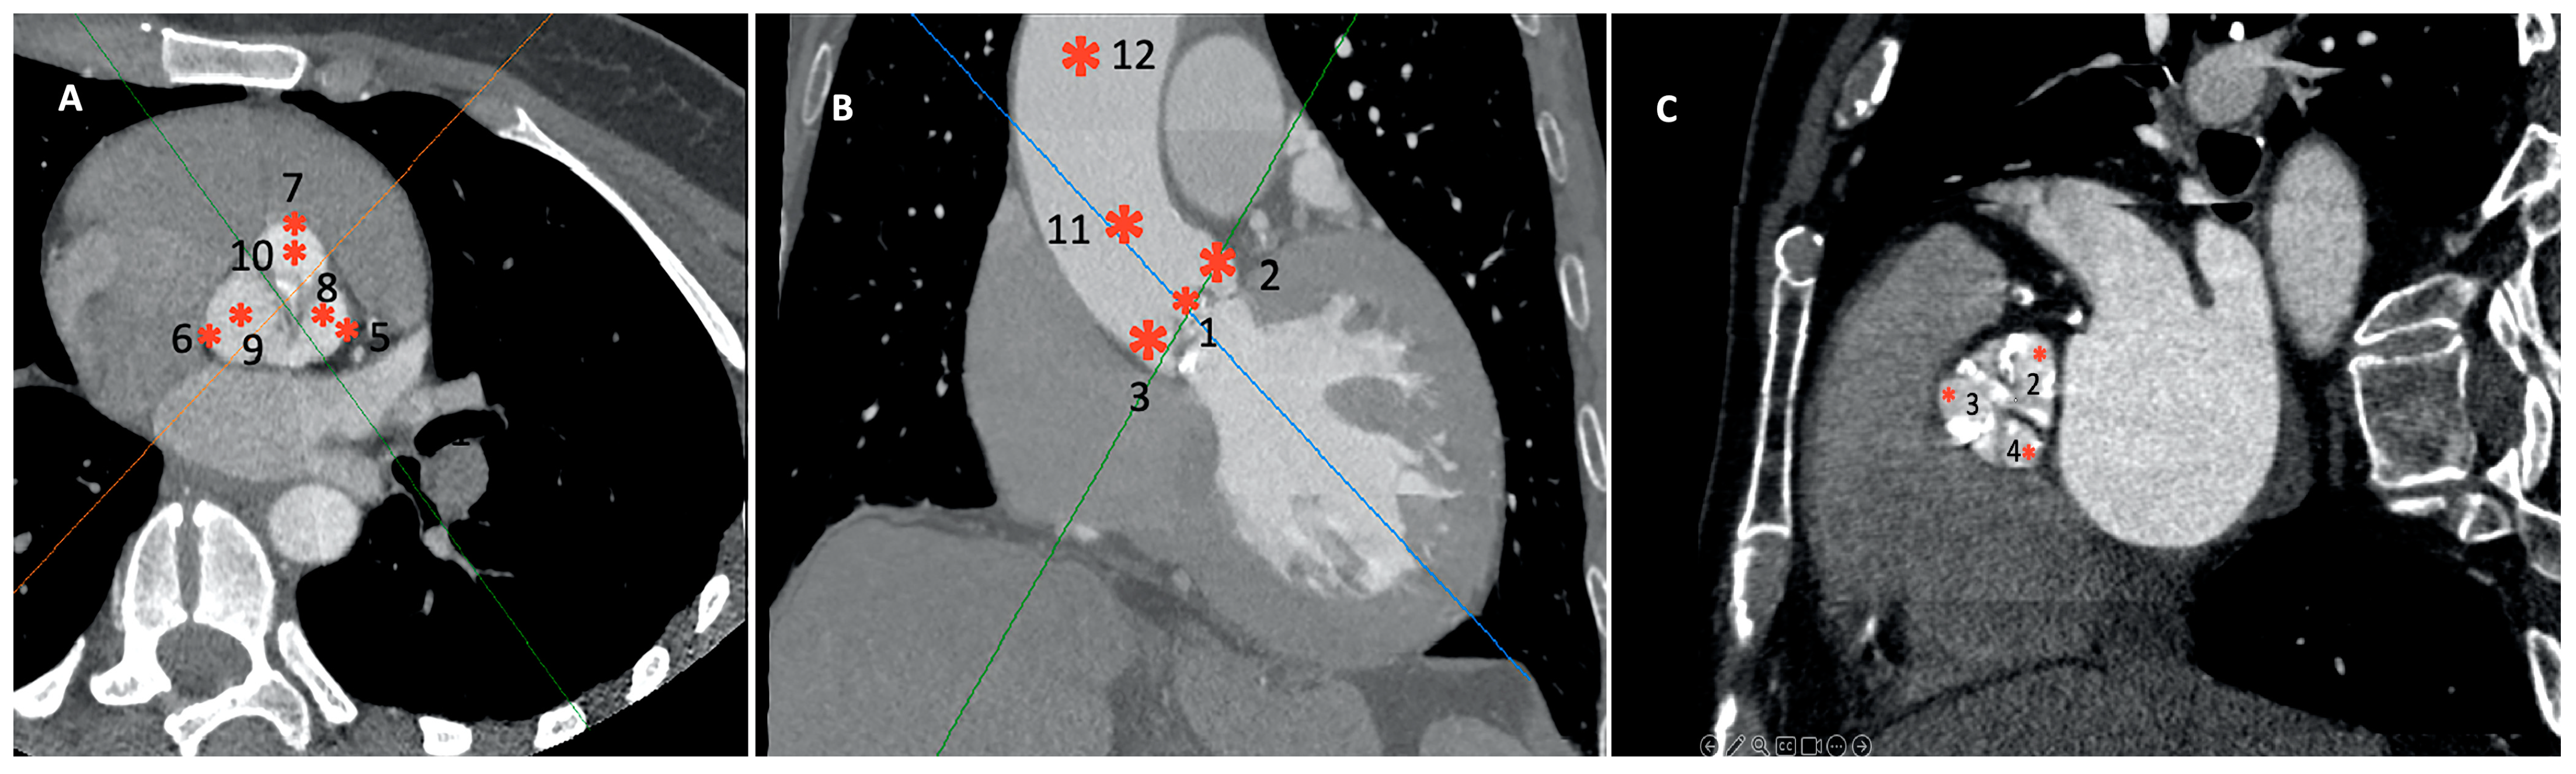
- Twelve distinct regions in 3D reconstruction mode: 4–5 mm above the opening of the aortic valve (OAV); at the junction of the leaflets and the fibrotic annulus (left, AL; right, AR; and non-coronary, AN); the mid-level of the sinus of Valsalva at the most lateral (Valsalva lateral left, VLL; Valsalva lateral right, VLR; and Valsalva lateral non-coronary, VLN) and at the mid-point (Valsalva center left, VCL; Valsalva center right, VCR; and Valsalva center non-coronary, VCN); and in the midline of the sinotubular junction (STJ) and 4 cm from the SJT (Figure 2). The region of interest was 3–5 mm2. Patients with a high grade of the beam-hardening effect due to severe calcification limiting the evaluation were excluded.
- Right and left ventricular outflow tract (RVOT/LVOT): 2–4 mm below the pulmonary and aortic valve in the centerline of the outflow tracts, respectively.
- Density differences of the perivalvular regions in both group 1 and 2, independently.
- Density differences between the two groups for each region.
- Possible correlation between the ECHO and the CCTA density parameters in SAS patients.
- Possible effects of demographic data on CCTA densities.
Statistical Considerations
3. Results
4. Discussion
Limitations
5. Conclusions
Author Contributions
Funding
Institutional Review Board Statement
Informed Consent Statement
Data Availability Statement
Conflicts of Interest
Abbreviations
| 4STJ | 4 cm from the sinotubular junction at the midline |
| AAV | 4–5 mm above the aortic valve |
| AL | junction of the left leaflet and the fibrotic annulus |
| AN | junction of the non-coronary leaflet and the fibrotic annulus |
| AR | junction of the right leaflet and the fibrotic annulus |
| AoVVTI | aortic valve velocity time integral |
| AVA | aortic valve area |
| CCTA | cardiac computed tomography angiography |
| ECHO | echocardiography |
| LVEF | left ventricular ejection fraction |
| LVOT | left ventricular outflow tract |
| MG | mean transvalvular gradient |
| LVOT VTI | left ventricular outflow tract velocity time integral |
| LVOTd | left ventricular outflow tract diameter |
| OAV | opening of the aortic valve |
| PG | peak transvalvular gradient |
| RVOT | right ventricular outflow tract |
| SAS | severe aortic stenosis |
| SAVR | surgical aortic valve replacement |
| STJ | midline of the sinotubular junction |
| TAVR | transcatheter aortic valve replacement |
| VLL | mid-level of the left sinus of Valsalva at the most lateral point |
| VLN | mid-level of the non-coronary sinus of Valsalva at the most lateral point |
| VLR | mid-level of the right sinus of Valsalva at the most lateral point |
| Vmax | maximum velocity above the opening of the aortic valve |
| VCL | mid-level of the left sinus of Valsalva in the center |
| VCN | mid-level of the noncoronary sinus of Valsalva in the center |
| VCR | mid-level of the right sinus of Valsalva in the center |
References
- Eveborn, G.W.; Schirmer, H.; Heggelund, G.; Lunde, P.; Rasmussen, K. The evolving epidemiology of valvular aortic stenosis. the Tromsø study. Heart 2013, 99, 396–400. [Google Scholar] [CrossRef]
- Baumgartner, H.; Hung, J.; Bermejo, J.; Chambers, J.B.; Edvardsen, T.; Goldstein, S.; Lancellotti, P.; LeFevre, M.; Miller, F.; Otto, C.M. Recommendations on the echocardiographic assessment of aortic valve stenosis: A focused update from the European Association of Cardiovascular Imaging and the American Society of Echocardiography. Eur. Heart J. Cardiovasc. Imaging 2017, 18, 254–275. [Google Scholar] [CrossRef]
- Eleid, M.F.; Sorajja, P.; Michelena, H.I.; Malouf, J.F.; Scott, C.G.; Pellikka, P.A. Flow-gradient patterns in severe aortic stenosis with preserved ejection fraction: Clinical characteristics and predictors of survival. Circulation 2013, 128, 1781–1789. [Google Scholar] [CrossRef] [PubMed]
- Angelillis, M.; Costa, G.; de Backer, O.; Mochi, V.; Christou, A.; Giannini, C.; Spontoni, P.; De Carlo, M.; Søndergaard, L.; Miccoli, M.; et al. Threshold for calcium volume evaluation in patients with aortic valve stenosis: Correlation with Agatston score. J. Cardiovasc. Med. 2021, 22, 496–502. [Google Scholar] [CrossRef]
- Cartlidge, T.R.; Bing, R.; Kwiecinski, J.; Guzzetti, E.; Pawade, T.A.; Doris, M.K.; Adamson, P.D.; Massera, D.; Lembo, M.; Peeters, F.E.C.M.; et al. Contrast-enhanced computed tomography assessment of aortic stenosis. Heart 2021, 107, 1905–1911. [Google Scholar] [CrossRef]
- Baumgartner, H.; Falk, V.; Bax, J.J.; De Bonis, M.; Hamm, C.; Holm, P.J.; Iung, B.; Lancellotti, P.; Lansac, E.; Rodriguez Muñoz, D.; et al. 2017 ESC/EACTS Guidelines for the management of valvular heart disease. Eur. Heart J. 2017, 38, 2739–2791. [Google Scholar] [CrossRef] [PubMed]
- Liu, X.; Sun, A.; Fan, Y.; Deng, X. Physiological significance of helical flow in the arterial system and its potential clinical applications. Ann. Biomed. Eng. 2015, 43, 3–15. [Google Scholar] [CrossRef] [PubMed]
- Kilner, P.J.; Yang, G.Z.; Mohiaddin, R.H.; Firmin, D.N.; Longmore, D.B. Helical and retrograde secondary flow patterns in the aortic arch studied by three-directional magnetic resonance velocity mapping. Circulation 1993, 88, 2235–2247. [Google Scholar] [CrossRef] [PubMed]
- Morbiducci, U.; Ponzini, R.; Rizzo, G.; Cadioli, M.; Esposito, A.; de Cobelli, F.; Del Maschio, A.; Montevecchi, F.M.; Redaelli, A. In vivo quantification of helical blood flow in human aorta by time-resolved three-dimensional cine phase contrast magnetic resonance imaging. Ann. Biomed. Eng. 2009, 37, 516–531. [Google Scholar] [CrossRef]
- Youssefi, P.; Gomez, A.; He, T.; Anderson, L.; Bunce, N.; Sharma, R.; Figueroa, C.A.; Jahangiri, M. Patient-specific computational fluid dynamics-assessment of aortic hemodynamics in a spectrum of aortic valve pathologies. J. Thorac. Cardiovasc. Surg. 2017, 153, 8–20.e3. [Google Scholar] [CrossRef]
- Hedayat, M.; Asgharzadeh, H.; Borazjani, I. Platelet activation of mechanical versus bioprosthetic heart valves during systole. J. Biomech. 2017, 56, 111–116. [Google Scholar] [CrossRef]
- Markl, M.; Draney, M.T.; Miller, D.C.; Levin, J.M.; Williamson, E.E.; Pelc, N.J.; Liang, D.H.; Herfkens, R.J. Time-resolved three-dimensional magnetic resonance velocity mapping of aortic flow in healthy volunteers and patients after valve-sparing aortic root replacement. J. Thorac. Cardiovasc. Surg. 2005, 130, 456–463. [Google Scholar] [CrossRef]
- Shreenivas, S.; Kaneko, T.; Tang, G.H.L. Predicting the future of TAVR: An obituary to open aortic valve replacement? Curr. Opin. Cardiol. 2019, 34, 112–123. [Google Scholar] [CrossRef] [PubMed]
- Francone, M.; Budde, R.P.J.; Bremerich, J.; Dacher, J.N.; Loewe, C.; Wolf, F.; Natale, L.; Pontone, G.; Redheuil, A.; Vliegenthart, R.; et al. CT and MR imaging prior to transcatheter aortic valve implantation: Standardisation of scanning protocols, measurements and reporting-a consensus document by the European Society of Cardiovascular Radiology (ESCR). Eur. Radiol. 2020, 30, 2627–2650. [Google Scholar] [CrossRef] [PubMed]
- Ring, L.; Shah, B.N.; Bhattacharyya, S.; Harkness, A.; Belham, M.; Oxborough, D.; Pearce, K.; Rana, B.S.; Augustine, D.X.; Robinson, S.; et al. Echocardiographic assessment of aortic stenosis: A practical guideline from the British Society of Echocardiography. Echo Res. Pract. 2021, 8, G19–G59. [Google Scholar] [CrossRef] [PubMed]
- Weese, J.; Lungu, A.; Peters, J.; Weber, F.M.; Waechter-Stehle, I.; Hose, D.R. CFD- and Bernoulli-based pressure drop estimates: A comparison using patient anatomies from heart and aortic valve segmentation of CT images. Med. Phys. 2017, 44, 2281–2292. [Google Scholar] [CrossRef] [PubMed]
- Traeger, B.; Srivatsa, S.S.; Beussman, K.M.; Wang, Y.; Suzen, Y.B.; Rybicki, F.J.; Mazur, W.; Miszalski-Jamka, T. Methodological inaccuracies in clinical aortic valve severity assessment: Insights from computational fluid dynamic modeling of CT-derived aortic valve anatomy. Theor. Comput. Fluid Dyn. 2016, 30, 107–128. [Google Scholar] [CrossRef]
- Hoeijmakers, M.J.M.M.; Silva Soto, D.A.; Waechter-Stehle, I.; Kasztelnik, M.; Weese, J.; Hose, D.R.; de van Vosse, F.N. Estimation of valvular resistance of segmented aortic valves using computational fluid dynamics. J. Biomech. 2019, 94, 49–58. [Google Scholar] [CrossRef]
- Lell, M.M.; Jost, G.; Korporaal, J.G.; Mahnken, A.H.; Flohr, T.G.; Uder, M.; Pietsch, H. Optimizing contrast media injection protocols in state-of-the art computed tomographic angiography. Investig. Radiol. 2015, 50, 161–167. [Google Scholar] [CrossRef]
- Ouchi, K.; Sakuma, T.; Nojiri, A.; Kano, R.; Higuchi, T.; Yakabe, H.; Hasumi, J.; Suzuki, T.; Fujioka, H.; Ogihara, A.; et al. Optimal threshold score of aortic valve calcification for identification of significant aortic stenosis on non-electrocardiographic-gated computed tomography. Eur Radiol. 2023, 33, 1243–1253. [Google Scholar] [CrossRef]
- Messika-Zeitoun, D.; Aubry, M.; Detaint, D.; Bielak, L.F.; Peyser, P.A.; Sheedy, P.F.; Turner, S.T.; Breen, J.F.; Scott, C.; Tajik, A.J.; et al. Evaluation and clinical implications of aortic valve calcification measured by electron-beam computed tomography. Circulation 2004, 110, 356–362. [Google Scholar] [CrossRef] [PubMed]
- Katagiri, Y.; Yamasak, K.; Hatanaka, N.; Bota, H.; Tani, T.; Koga, T.; Setogawa, Y.; Misawa, M.; Ueda, T.; Yamazaki, S. Revisiting the Aortic Valve Calcium Score in Evaluating the Severity of Aortic Stenosis in Japanese Patients—A Single-Center Study. Circ. Rep. 2022, 4, 274–284. [Google Scholar] [CrossRef] [PubMed]
- Pawade, T.; Clavel, M.; Tribouilloy, C.; Dreyfus, J.; Mathieu, T.; Tastet, T.; Renard, C.; Gun, M.; Jenkins, W.S.A.; Macron, L.; et al. Computed Tomography Aortic Valve Calcium Scoring in Patients With Aortic Stenosis. Circ. Cardiovasc. Imaging 2018, 11, e007146. [Google Scholar] [CrossRef] [PubMed]
- Clavel, M.; Messika-Zeitoun, D.; Pibarot, P.; Aggarwal, S.R.; Malouf, J.; Araoz, P.A.; Michelena, H.I.; Cueff, C.; Larose, E.; Capoulade, R.; et al. The complex nature of discordant severe calcified aortic valve disease grading: New insights from combined Doppler echocardiographic and computed tomographic study. J. Am. Coll. Cardiol. 2013, 62, 2329–2338. [Google Scholar] [CrossRef] [PubMed]
- Garcia, J.; Kadem, L.; Larose, E.; Clavel, M.-A.; Pibarot, P. Comparison between cardiovascular magnetic resonance and transthoracic Doppler echocardiography for the estimation of effective orifice area in aortic stenosis. J. Cardiovasc. Magn. Reson. 2011, 13, 25. [Google Scholar] [CrossRef]
- Chun, E.J.; Choi, S.I.; Lim, C.; Park, K.-H.; Chang, H.-J.; Choi, D.-J.; Kim, D.H.; Lee, W.; Park, J.H. Aortic stenosis: Evaluation with multidetector CT angiography and MR imaging. Korean J. Radiol. 2008, 9, 439–448. [Google Scholar] [CrossRef]
- Vahanian, A.; Beyersdorf, F.; Praz, F.; Milojevic, M.; Baldus, S.; Bauersachs, J.; Capodanno, D.; Conradi, L.; De Bonis, M.; De Paulis, R.; et al. 2021 ESC/EACTS Guidelines for the management of valvular heart disease: Developed by the Task force for the Management of valvular heart disease of the European Society of Cardiology (ESC) and the European Association for the Cardio-Thoracic Surgery (EACTS). ESC/EACTS Scientific Document Group. Rev. Esp. Cardiol. 2022, 75, 524. [Google Scholar] [CrossRef]


| Group 1 | Group 2 | p | |
|---|---|---|---|
| Age (years) | 79.33 ± 6.32 | 57.00 ± 10.47 | <0.001 |
| Gender (male/female) | 24/16 (60/40%) | 3/12 (20/80%) | 0.014 |
| Hypertension | 34 (85%) | 9 (60%) | 0.068 |
| Diabetes mellitus | 14 (35%) | 3 (20%) | 0.344 |
| Dyslipidemia | 12 (30%) | 5 (33%) | 1.000 |
| Pacemaker implantation | 6 (15%) | 1 | 0.660 |
| Coronary intervention or bypass operation | 14 (35%) | 2 | 0.184 |
| Atrial fibrillation | 12 (30%) | 1 (6%) | 0.086 |
| Ejection fraction (%) | 50.25 ± 8.90 | 54.53 ± 7.05 | 0.093 |
| Aortic regurgitation | 0.875 ± 1.018 | 0.077 ± 0.277 | 0.006 |
| Grade 0 | 20 | 14 | |
| Grade 1 | 8 | 1 | |
| Grade 2 | 9 | 0 | |
| Grade 3 | 3 | 0 |
| Group 1 | Group 2 | p | |
|---|---|---|---|
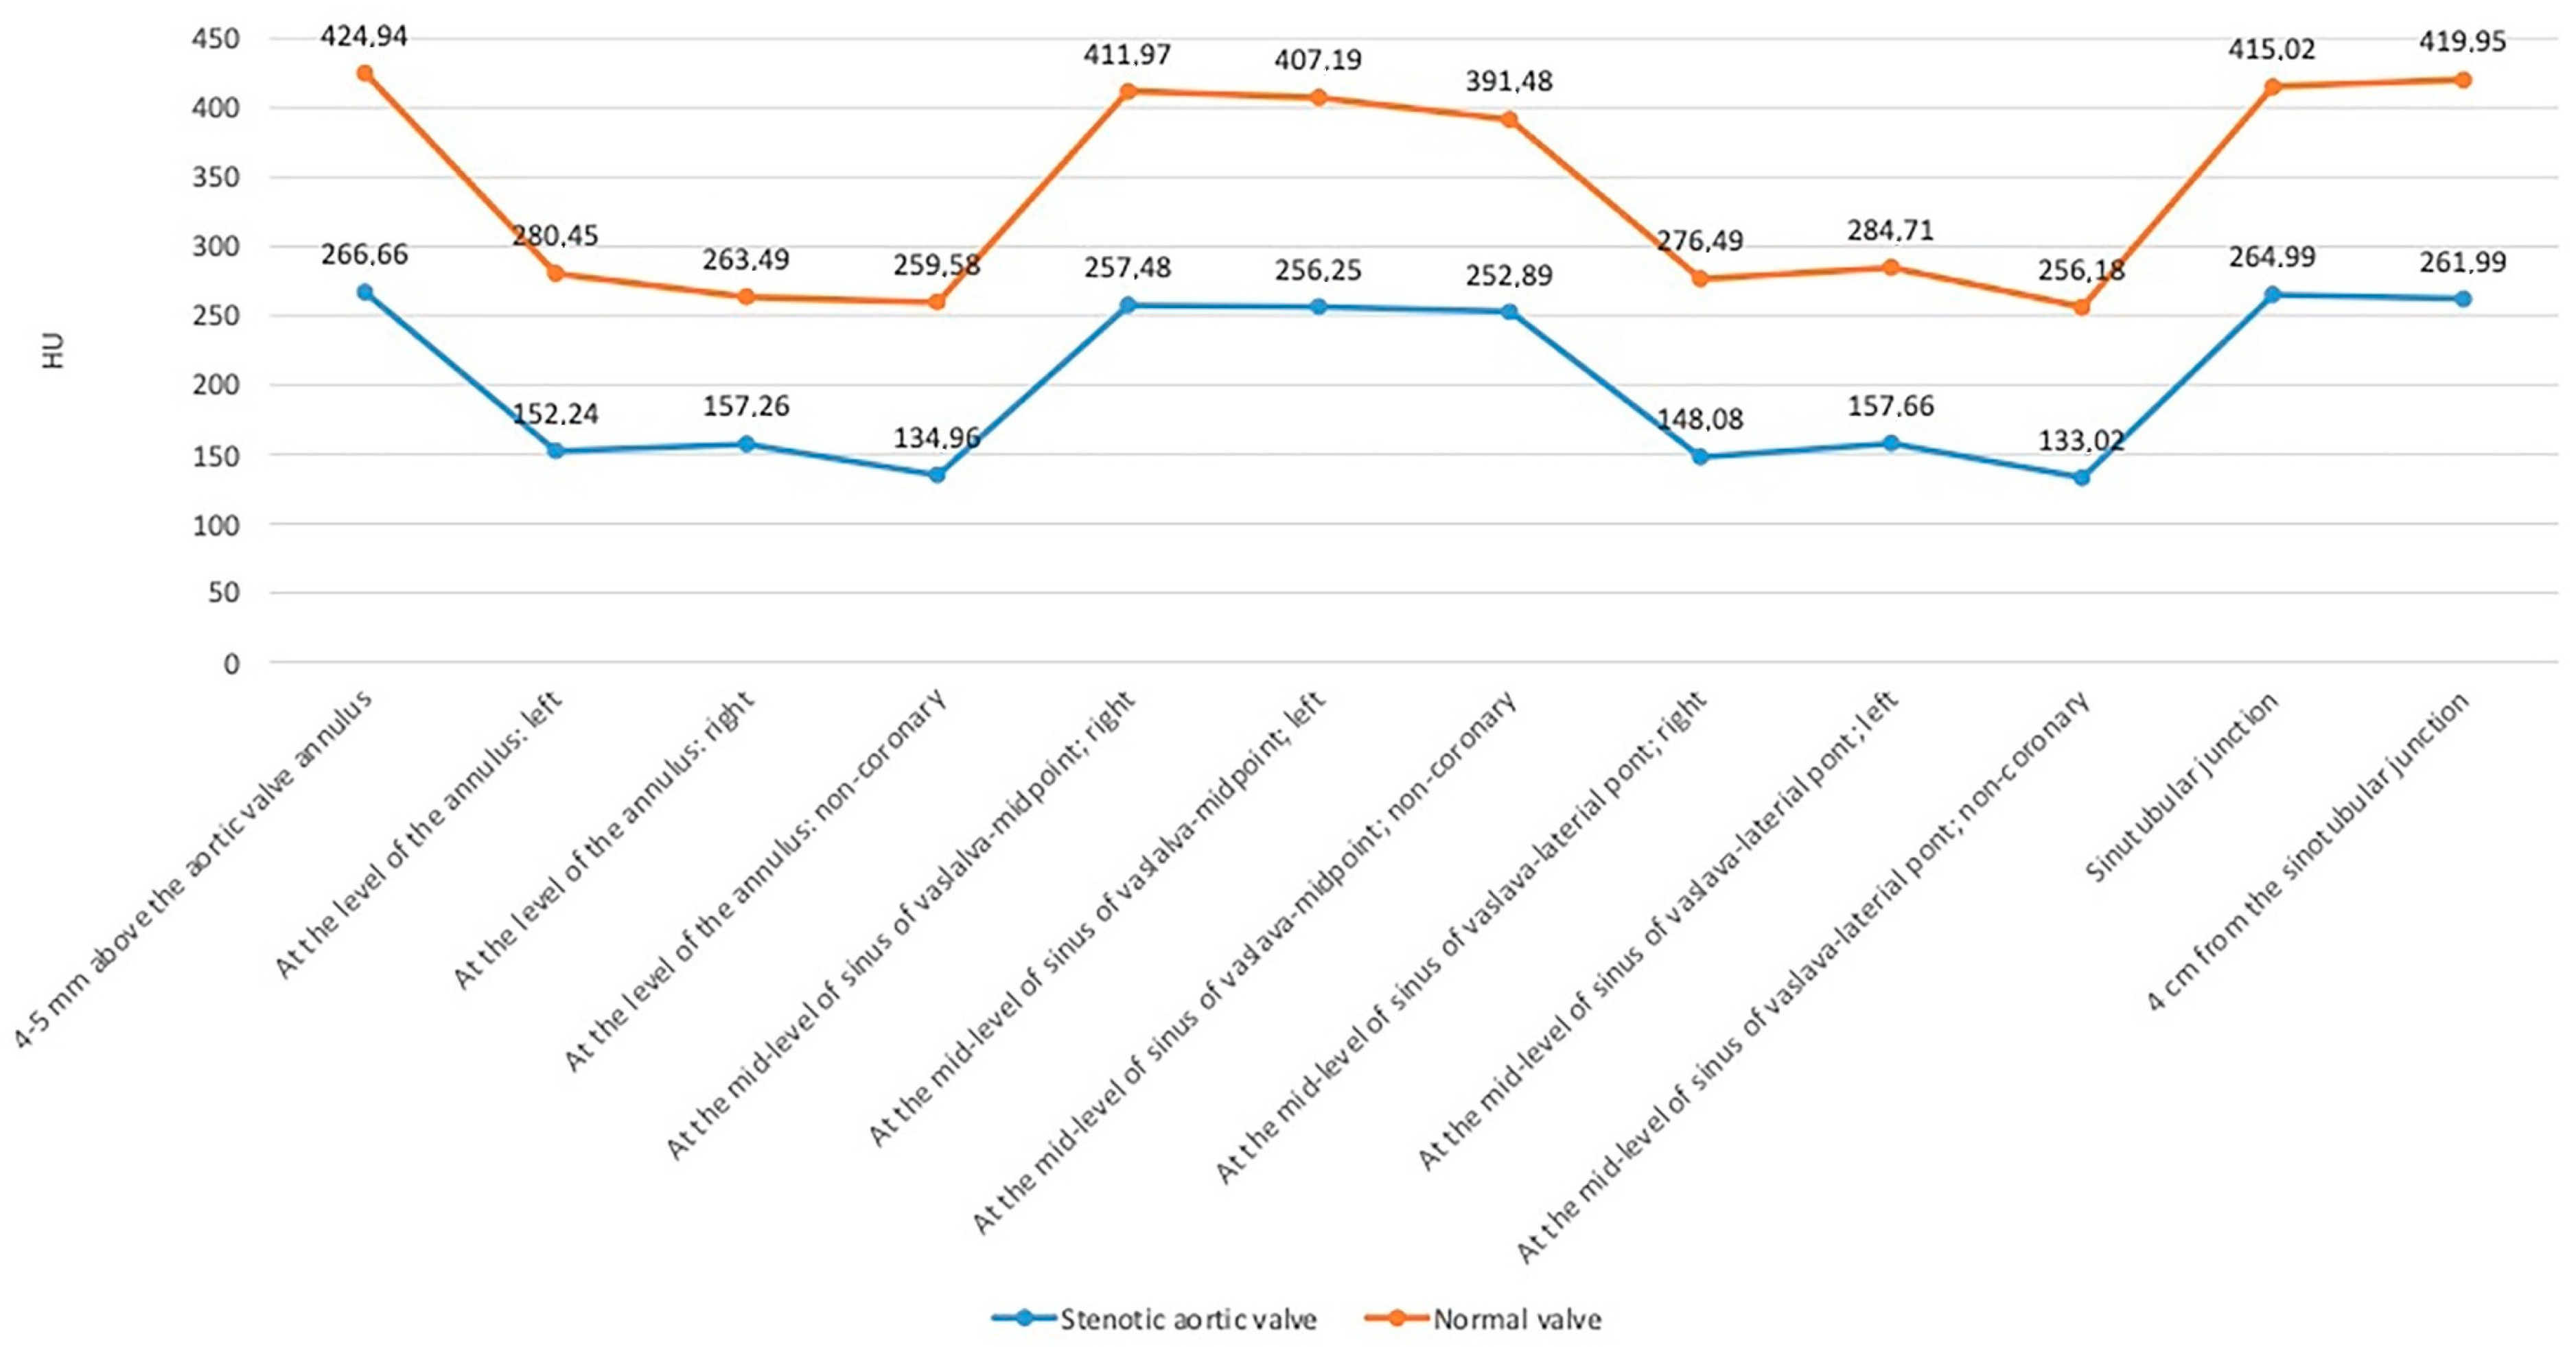
| 4–5 mm above the valve opening | 266 ± 58 | 424 ± 91 | <0.001 |
At the level of the annulus
| 152 ± 48 | 280 ± 65 | <0.001 |
| 157 ± 50 | 263 ± 72 | <0.001 |
| 134 ± 49 | 259 ± 63 | <0.001 |
At the mid-level of the sinus of Valsalva—midpoint
| 257 ± 60 | 411 ± 88 | <0.001 |
| 256 ± 60 | 407 ± 94 | <0.001 |
| 252 ± 62 | 391 ± 89 | <0.001 |
At the mid-level of the sinus of Valsalva—lateral point
| 148 ± 47 | 276 ± 78 | <0.001 |
| 157 ± 52 | 284 ± 83 | <0.001 |
| 133 ± 42 | 256 ± 87 | <0.001 |
| Sinotubular junction | 264 ± 54 | 415 ± 87 | <0.001 |
| 4 cm from the sinotubular junction | 261 ± 55 | 419 ± 94 | <0.001 |
| ICC | p | Bias | SD of Bias | 95% Limits of Agreement | ||
|---|---|---|---|---|---|---|
| from | to | |||||
| 4–5 mm above the valve opening | 0.878 | <0.001 | 5.38 | 42.19 | −77.31 | 88.07 |
At the level of the annulus
| 0.455 | <0.001 | 94.03 | 56.89 | −17.46 | 205.50 |
| 0.623 | <0.001 | 75.31 | 42.05 | −7.11 | 157.70 |
| 0.411 | <0.001 | 108.40 | 47.48 | 15.31 | 201.40 |
At the mid-level of the sinus of Valsalva—midpoint
| 0.930 | <0.001 | −0.60 | 30.63 | −60.62 | 59.43 |
| 0.947 | <0.001 | 6.12 | 25.67 | −44.20 | 56.45 |
| 0.874 | <0.001 | 15.09 | 42.14 | −67.50 | 97.68 |
At the mid-level of the sinus of Valsalva—lateral point
| 0.421 | <0.001 | 96.96 | 43.78 | 11.16 | 182.80 |
| 0.382 | <0.001 | 89.46 | 46.62 | −2.308 | 181.2 |
| 0.371 | <0.001 | 102.6 | 44.89 | 14.61 | 190.60 |
| Sinotubular junction | 0.978 | <0.001 | 1.95 | 17.22 | −31.80 | 35.70 |
| 4 cm from the sinotubular junction | 0.981 | <0.001 | −6.40 | 13.69 | −33.24 | 20.43 |
| MG (mmHg) | PG (mmHg) | Vmax (m/s) | AVA (cm2) | LVEF (%) | Aortic Regurgitation | |
|---|---|---|---|---|---|---|
| 4–5 mm above the valve opening | R = 0.073 | R = 0.034 | R = 0.035 | R = −0.302 | R = 0.136 | R = 0.167 |
| p = 0.652 | p = 0.837 | p = 0.829 | p = 0.058 | p = 0.404 | p = 0.303 | |
| At the level of the annulus | R = 0.164 | R = 0.149 | R = 0.239 | R = −0.366 | R = −0.168 | R = 0.251 |
| p = 0.311 | p = 0.359 | p = 0.137 | p = 0.020 | p = 0.301 | p = 0.118 |
| R = 0.050 | R = −0.015 | R = −0.048 | R = −0.320 | R = −0.119 | R = 0.372 |
| p = 0.760 | p = 0.927 | p = 0.768 | p = 0.044 | p = 0.463 | p = 0.018 | |
| R = 0.349 | R = 0.332 | R = 0.341 | R = −0.300 | R = 0.023 | R = 0.263 |
| p = 0.027 | p = 0.037 | p = 0.031 | p = 0.060 | p = 0.890 | p = 0.101 | |
| At the mid-level of the sinus of Valsalva—center | R = 0.127 | R = 0.123 | R = 0.197 | R = −0.430 | R = 0.207 | R = 0.093 |
| p = 0.434 | p = 0.449 | p = 0.227 | p = 0.006 | p = 0.201 | p = 0.567 |
| R = 0.058 | R = 0.057 | R = 0.075 | R = −0.216 | R = 0.192 | R = 0.190 |
| p = 0.724 | p = 0.728 | p = 0.647 | p = 0.180 | p = 0.236 | p = 0.240 | |
| R = 0.240 | R = 0.210 | R = 0.247 | R = −0.523 | R = 0.255 | R = −0.013 |
| p = 0.135 | p = 0.193 | p = 0.124 | p = 0.001 | p = 0.113 | p = 0.937 | |
| At the mid-level of the sinus of Valsalva—lateral point | R = 0.448 | R = 0.355 | R = 0.412 | R = −0.407 | R = −0.076 | R = 0.273 |
| p = 0.004 | p = 0.024 | p = 0.008 | p = 0.009 | p = 0.642 | p = 0.088 |
| R = 0.072 | R = 0.053 | R = −0.026 | R = −0.224 | R = 0.131 | R = 0.220 |
| p = 0.661 | p = 0.744 | p = 0.873 | p = 0.165 | p = 0.421 | p = 0.173 | |
| R = 0.269 | R = 0.253 | R = 0.243 | R = −0.535 | R = −0.030 | R = 0.136 |
| p = 0.093 | p = 0.116 | p = 0.131 | p < 0.001 | p = 0.854 | p = 0.404 | |
| Sinotubular junction | R = 0.072 | R = 0.083 | R = 0.130 | R = −0.399 | R = 0.219 | R = 0.092 |
| p = 0.657 | p = 0.611 | p = 0.425 | p = 0.011 | p = 0.176 | p = 0.574 | |
| 4 cm from the sinotubular junction | R = 0.166 | R = 0.139 | R = 0.181 | R = −0.442 | R = 0.324 | R = 0.165 |
| p = 0.305 | p = 0.393 | p = 0.265 | p = 0.004 | p = 0.042 | p = 0.307 |
| AUC | p | Sensitivity (%) | Specificity (%) | Youden Index | Cut-Off (HU) | |
|---|---|---|---|---|---|---|
| 4–5 mm above the valve opening | 0.897 | <0.001 | 97.5 | 80 | 0.7750 | 377 |
At the level of the annulus
| 0.930 | <0.001 | 95.0 | 86.67 | 0.8167 | 236.3 |
| 0.877 | <0.001 | 92.5 | 80.0 | 0.7250 | 221.9 |
| 0.915 | <0.001 | 90.0 | 86.67 | 0.7667 | 206.8 |
At the mid-level of the sinus of Valsalva- center point
| 0.892 | <0.001 | 95.0 | 80.0 | 0.7500 | 357.5 |
| 0.884 | <0.001 | 85.0 | 86.67 | 0.7167 | 319.4 |
| 0.857 | <0.001 | 90.0 | 80.0 | 0.7000 | 339.1 |
At the mid-level of the sinus of Valsalva- lateral point
| 0.887 | <0.001 | 92.5 | 80.0 | 0.7250 | 211.6 |
| 0.895 | <0.001 | 95.0 | 73.33 | 0.6833 | 231.8 |
| 0.902 | <0.001 | 90.0 | 80.0 | 0.7000 | 180.2 |
| Sinotubular junction | 0.887 | <0.001 | 92.5 | 80.0 | 0.7250 | 346.3 |
| 4cm from the sinotubular junction | 0.920 | <0.001 | 92.5 | 80.0 | 0.7250 | 334.3 |
| AUC | Sensitivity (%) | Specificity (%) | ||||
|---|---|---|---|---|---|---|
| Women | Men | Women | Men | Women | Men | |
| Katagiri et al. | 0.93 | 0.88 | 91.50 | 84.80 | 89.30 | 83.30 |
| Pawade et al. | 0.92 | 0.89 | 87 | 80 | 84 | 82 |
| Messika-Zeituon et al. | 0.89 | 93 | 83 | |||
| Clavel et al. | 0.91 | 0.90 | 86 | 89 | 89 | 80 |
| Ouchi et al. | 0.957 | 0.955 | 87.10 | 84.60 | 93.20 | 97.10 |
Disclaimer/Publisher’s Note: The statements, opinions and data contained in all publications are solely those of the individual author(s) and contributor(s) and not of MDPI and/or the editor(s). MDPI and/or the editor(s) disclaim responsibility for any injury to people or property resulting from any ideas, methods, instructions or products referred to in the content. |
© 2023 by the authors. Licensee MDPI, Basel, Switzerland. This article is an open access article distributed under the terms and conditions of the Creative Commons Attribution (CC BY) license (https://creativecommons.org/licenses/by/4.0/).
Share and Cite
Racz, A.O.; Szabo, G.T.; Papp, T.; Csippa, B.; Gyurki, D.; Kracsko, B.; Koszegi, Z.; Kolozsvari, R. Potential Clinical Usefulness of Post-Valvular Contrast Densities to Determine the Severity of Aortic Valve Stenosis Using Computed Tomography. J. Cardiovasc. Dev. Dis. 2023, 10, 412. https://doi.org/10.3390/jcdd10100412
Racz AO, Szabo GT, Papp T, Csippa B, Gyurki D, Kracsko B, Koszegi Z, Kolozsvari R. Potential Clinical Usefulness of Post-Valvular Contrast Densities to Determine the Severity of Aortic Valve Stenosis Using Computed Tomography. Journal of Cardiovascular Development and Disease. 2023; 10(10):412. https://doi.org/10.3390/jcdd10100412
Chicago/Turabian StyleRacz, Agnes Orsolya, Gabor Tamas Szabo, Tamas Papp, Benjamin Csippa, Daniel Gyurki, Bertalan Kracsko, Zsolt Koszegi, and Rudolf Kolozsvari. 2023. "Potential Clinical Usefulness of Post-Valvular Contrast Densities to Determine the Severity of Aortic Valve Stenosis Using Computed Tomography" Journal of Cardiovascular Development and Disease 10, no. 10: 412. https://doi.org/10.3390/jcdd10100412
APA StyleRacz, A. O., Szabo, G. T., Papp, T., Csippa, B., Gyurki, D., Kracsko, B., Koszegi, Z., & Kolozsvari, R. (2023). Potential Clinical Usefulness of Post-Valvular Contrast Densities to Determine the Severity of Aortic Valve Stenosis Using Computed Tomography. Journal of Cardiovascular Development and Disease, 10(10), 412. https://doi.org/10.3390/jcdd10100412