
A Cross-Sectional Study on the Association between Body Mass Index and Frailty According to Sex in Elderly Patients with Disabilities from an Elderly Day-Care Center

 , ,
, ,
Abstract
:1. Introduction
2. Materials and Methods
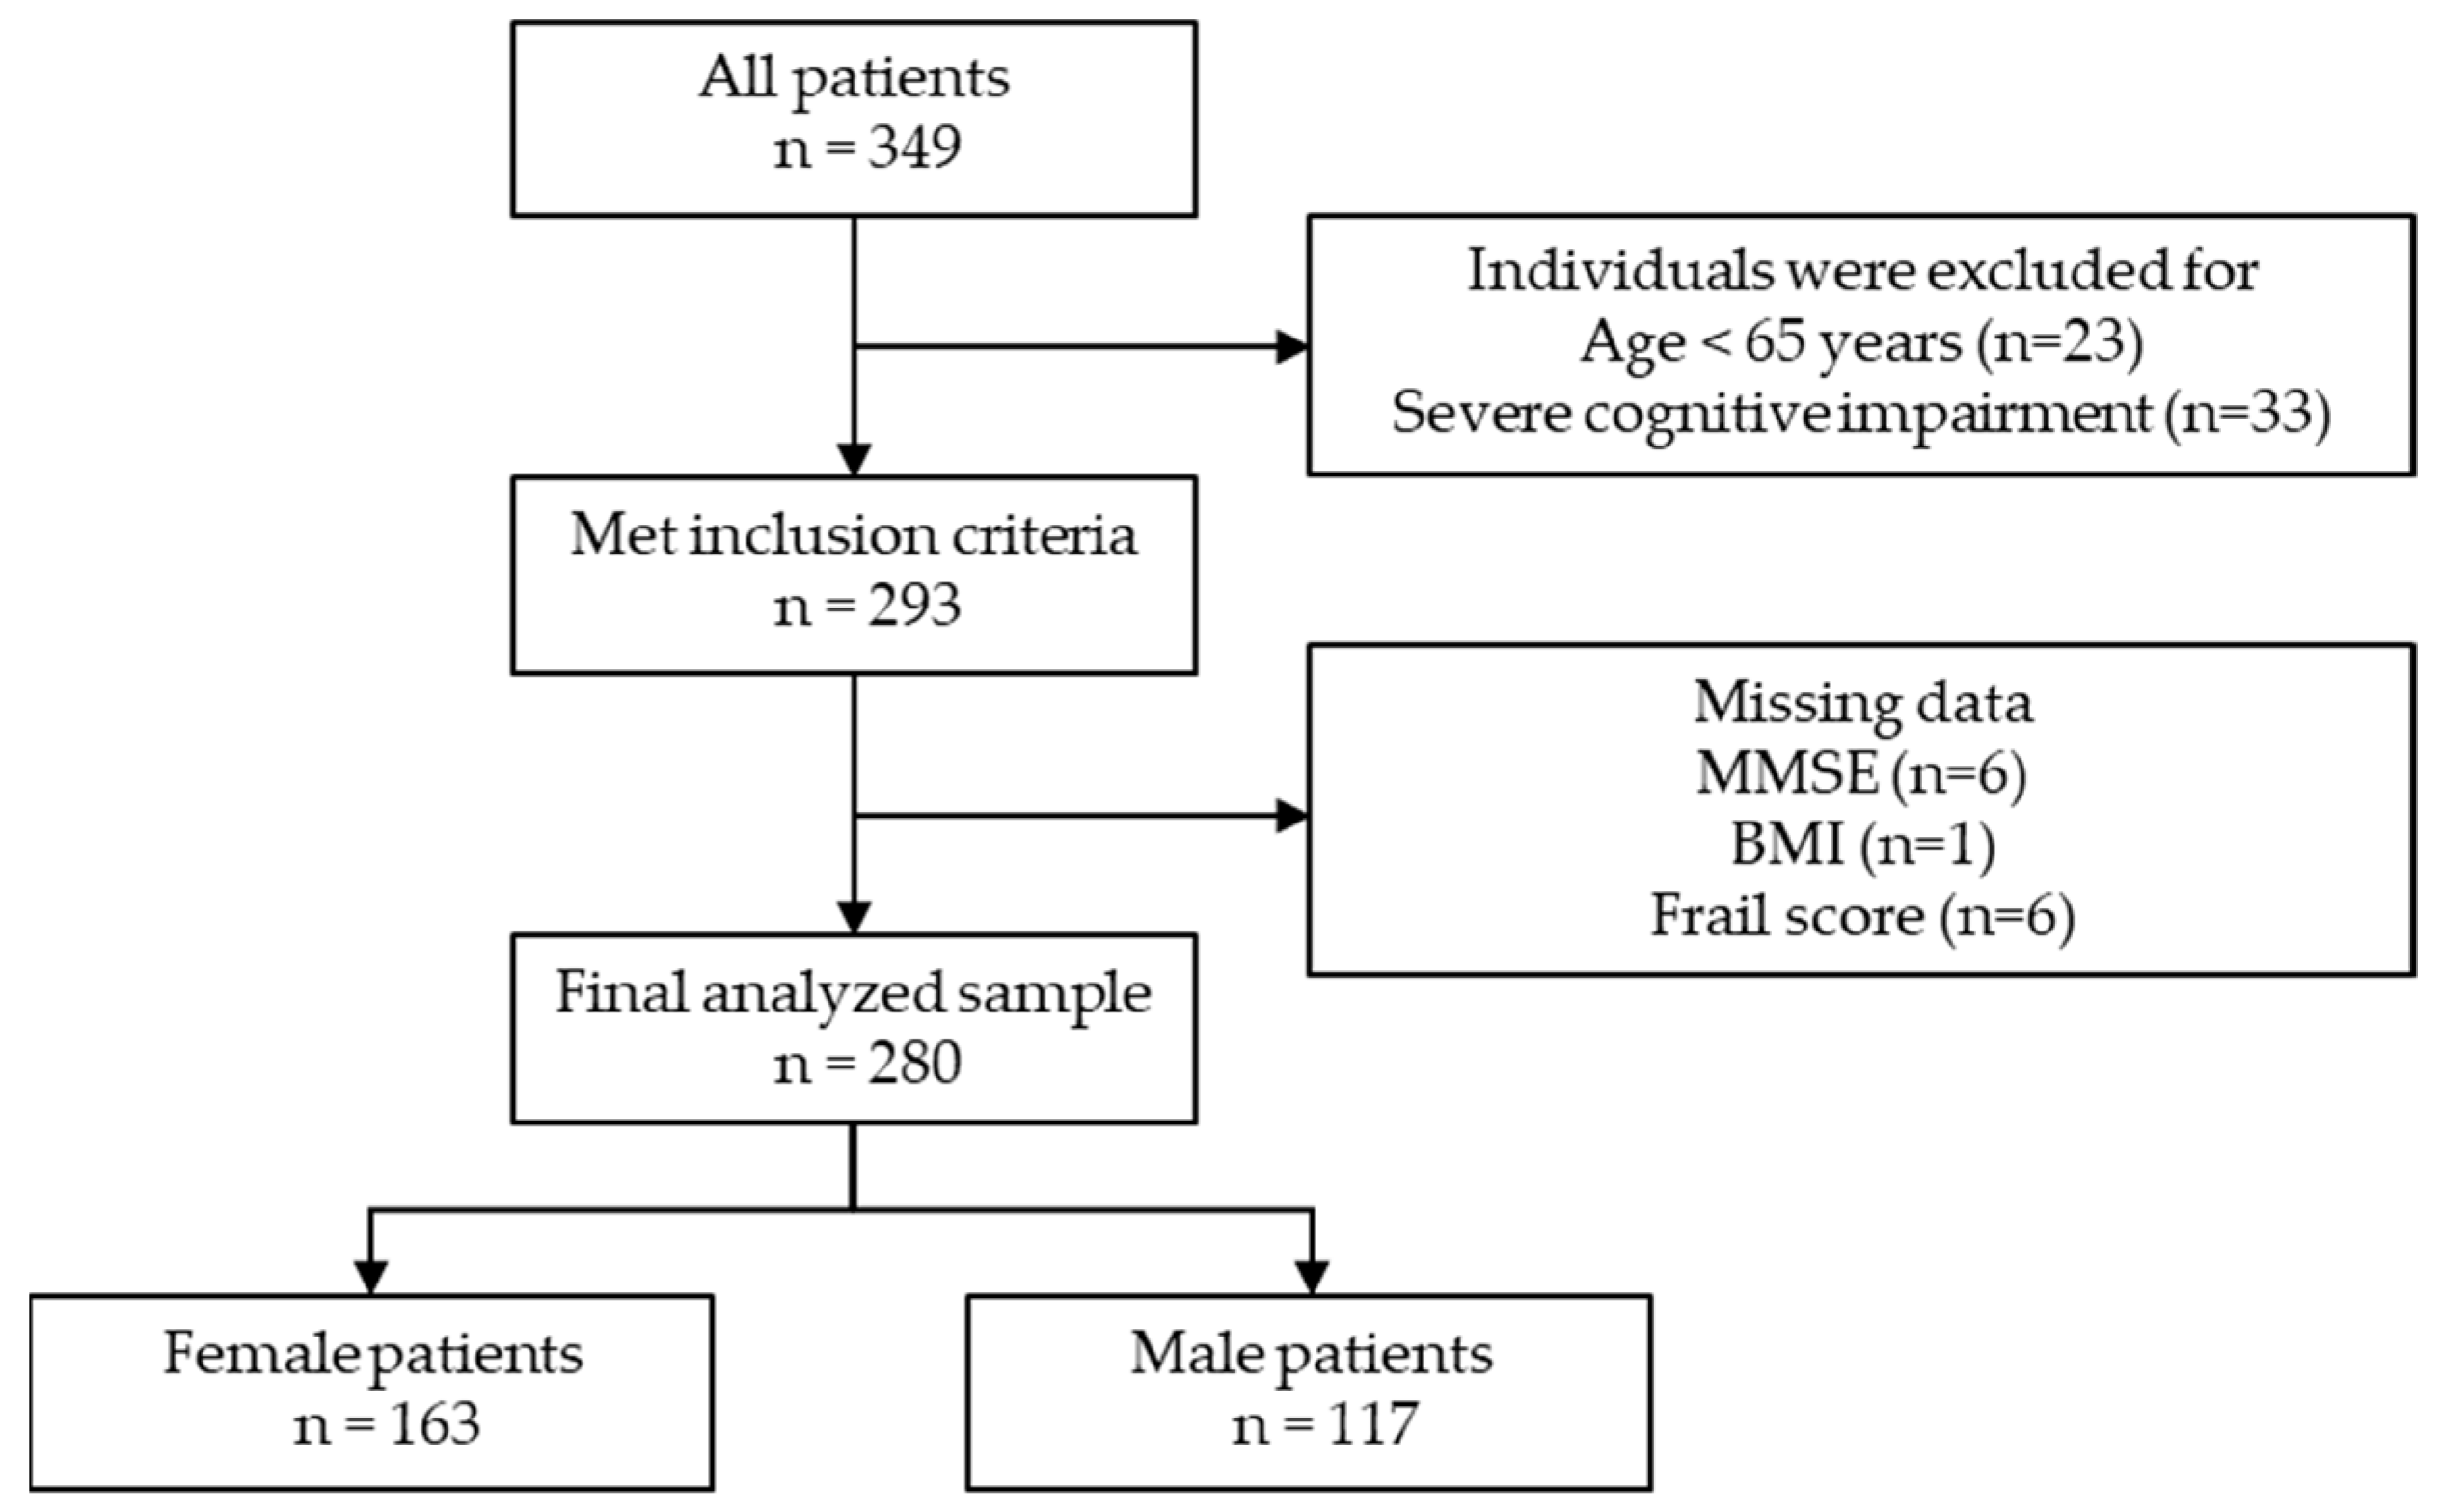
2.1. Patients
2.2. Data Collection
2.3. BMI Frail Score
2.4. Statistical Analysis
3. Results
4. Discussion
5. Conclusions
Author Contributions
Funding
Institutional Review Board Statement
Informed Consent Statement
Conflicts of Interest
References
- Xue, Q. The frailty syndrome: Definition and natural history. Clin. Geriatr. Med. 2011, 27, 1–15. [Google Scholar] [CrossRef] [PubMed] [Green Version]
- Fried, L.P.; Tangen, C.M.; Walston, J.; Newman, A.B.; Hirsch, C.; Gottdiener, J.; Seeman, T.; Tracy, R.; Kop, W.J.; Burke, G.; et al. Frailty in older adults: Evidence for a phenotype. J. Gerontol. A Biol. Sci. Med. Sci. 2001, 56, M146–M156. [Google Scholar] [CrossRef]
- Ensrud, K.E.; Ewing, S.K.; Taylor, B.C.; Fink, H.A.; Cawthon, P.M.; Stone, K.L.; Hillier, T.A.; Cauley, J.A.; Hochberg, M.C.; Rodondi, N.; et al. Comparison of 2 frailty indexes for prediction of falls, disability, fractures, and death in older women. Arch. Intern. Med. 2008, 168, 382–389. [Google Scholar] [CrossRef] [PubMed] [Green Version]
- Clegg, A.; Young, J.; Iliffe, S.; Rikkert, M.O.; Rockwood, K. Frailty in elderly people. Lancet Lond. Engl. 2013, 381, 752–762. [Google Scholar] [CrossRef] [Green Version]
- Han, L.; Clegg, A.; Doran, T.; Fraser, L. The impact of frailty on healthcare resource use: A longitudinal analysis using the clinical practice research datalink in England. Age Ageing 2019, 48, 665–671. [Google Scholar] [CrossRef]
- Bock, J.O.; König, H.H.; Brenner, H.; Haefeli, W.E.; Quinzler, R.; Matschinger, H.; Saum, K.U.; Schottker, B.; Heider, D. Associations of frailty with health care costs—Results of the ESTHER cohort study. BMC Health Serv. Res. 2016, 16, 128. [Google Scholar] [CrossRef] [PubMed] [Green Version]
- Tassiopoulos, K.; Abdo, M.; Wu, K.; Koletar, S.L.; Palella, F.J.; Kalayjian, R.; Taiwo, B.; Erlandson, K.M. Frailty is strongly associated with increased risk of recurrent falls among older HIV-infected adults: A prospective cohort study. AIDS Lond. Engl. 2017, 31, 2287–2294. [Google Scholar] [CrossRef]
- Hoogendijk, E.O.; Afilalo, J.; Ensrud, K.E.; Kowal, P.; Onder, G.; Fried, L.P. Frailty: Implications for clinical practice and public health. Lancet 2019, 394, 1365–1375. [Google Scholar] [CrossRef]
- Kojima, G.; Iliffe, S.; Taniguchi, Y.; Shimada, H.; Rakugi, H.; Walters, K. Prevalence of frailty in Japan: A systematic review and meta-analysis. J. Epidemiol. 2017, 27, 347–353. [Google Scholar] [CrossRef] [Green Version]
- Yoshiyuki, N.; Kono, A. Association between frailty community-dwelling older adults certified as requiring support in the long-term care insurance system and social capital among local neighborhood volunteers. Nihon Koshu Eisei Zasshi 2020, 67, 111–120. [Google Scholar] [PubMed]
- Boyd, C.M.; Xue, Q.L.; Simpson, C.F.; Guralnik, J.M.; Fried, L.P. Frailty, hospitalization, and progression of disability in a cohort of disabled older women. Am. J. Med. 2005, 118, 1225–1231. [Google Scholar] [CrossRef]
- Blaum, C.S.; Xue, Q.L.; Michelon, E.; Semba, R.D.; Fried, L.P. The association between obesity and the frailty syndrome in older women: The Women’s Health and Aging Studies. J. Am. Geriatr. Soc. 2005, 53, 927–934. [Google Scholar] [CrossRef]
- Hubbard, R.E.; Lang, I.A.; Llewellyn, D.J.; Rockwood, K. Frailty, body mass index, and abdominal obesity in older people. J. Gerontol. A Biol. Sci. Med. Sci. 2010, 65, 377–381. [Google Scholar] [CrossRef] [Green Version]
- Sewo Sampaio, P.Y.; Sampaio, R.A.C.; Coelho Júnior, H.J.; Teixeira, L.F.M.; Tessutti, V.D.; Uchida, M.C.; Arai, H. Differences in lifestyle, physical performance and quality of life between frail and robust Brazilian community-dwelling elderly women. Geriatr. Gerontol. Int. 2016, 16, 829–835. [Google Scholar] [CrossRef] [PubMed]
- Xu, L.; Zhang, J.; Shen, S.; Hong, X.; Zeng, X.; Yang, Y.; Liu, Z.; Chen, L.; Chen, X. Association between body composition and frailty in elder inpatients. Clin. Interv. Aging 2020, 15, 313–320. [Google Scholar] [CrossRef] [Green Version]
- WHO Expert Consultation. Appropriate body-mass index for Asian populations and its implications for policy and intervention strategies. Lancet 2004, 363, 157–163. [Google Scholar] [CrossRef]
- Global BMI Mortality Collaboration; Di Angelantonio, E.; Bhupathiraju, S.; Wormser, D.; Gao, P.; Kaptoge, S.; de Gonzalez, A.B.; Cairns, B.; Huxley, R.; Jackson, C.; et al. Body-mass index and all-cause mortality: Individual-participant-data meta-analysis of 239 prospective studies in four continents. Lancet Lond. Engl. 2016, 388, 776–786. [Google Scholar] [CrossRef] [Green Version]
- Bhaskaran, K.; dos-Santos-Silva, I.; Leon, D.A.; Douglas, I.J.; Smeeth, L. Association of BMI with overall and cause-specific mortality: A population-based cohort study of 3·6 million adults in the UK. Lancet Diabetes Endocrinol. 2018, 6, 944–953. [Google Scholar] [CrossRef] [Green Version]
- Ministry of Education, Culture, Sports, Science and Technology, Japan. Available online: https://www.mext.go.jp/a_menu/sports/stamina/03040901.htm (accessed on 19 June 2021).
- Folstein, M.F.; Folstein, S.E.; McHugh, P.R. “Mini-mental state”. A practical method for grading the cognitive state of patients for the clinician. J. Psychiatr. Res. 1975, 12, 189–198. [Google Scholar] [CrossRef]
- Gibson, M. The prevention of falls in later life: A report of the Kellogg International Work Group on the prevention of falls by the elderly. Dan. Med. Bull. 1987, 34, 1–24. [Google Scholar]
- World Health Organization. Available online: https://www.who.int/publications/i/item/9789241501491 (accessed on 22 September 2021).
- Satake, S.; Shimada, H.; Yamada, M.; Kim, H.; Yoshida, H.; Gondo, Y.; Matsubayashi, K.; Matsushita, E.; Kuzuya, M.; Kozaki, K.; et al. Prevalence of frailty among community-dwellers and outpatients in Japan as defined by the Japanese version of the Cardiovascular Health Study criteria. Geriatr. Gerontol. Int. 2017, 17, 2629–2634. [Google Scholar] [CrossRef] [PubMed]
- Dahl, A.K.; Fauth, E.B.; Ernsth-Bravell, M.; Hassing, L.B.; Ram, N.; Gerstof, D. Body mass index, change in body mass index, and survival in old and very old persons. J. Am. Geriatr. Soc. 2013, 61, 512–518. [Google Scholar] [CrossRef] [Green Version]
- Ministry of Health, Labour and Welfare, Japan. Available online: https://www.mhlw.go.jp/toukei/saikin/hw/life/life19/ (accessed on 7 June 2021).
- Stevens, J. Ethnic-specific revisions of body mass index cutoffs to define overweight and obesity in Asians are not warranted. Int. J. Obes. 2003, 27, 1297–1299. [Google Scholar] [CrossRef] [Green Version]
- He, W.; Li, Q.; Yang, M.; Jiao, J.; Ma, X.; Zhou, Y.; Song, A.; Heymsfield, S.B.; Zhang, S.; Zhu, S. Lower BMI cutoffs to define overweight and obesity in China. Obesity 2015, 23, 684–691. [Google Scholar] [CrossRef]
- Caleyachetty, R.; Barber, T.M.; Mohammed, N.I.; Cappuccio, F.P.; Hardy, R.; Mathur, R.; Banerjee, A.; Gill, P. Ethnicity-specific BMI cutoffs for obesity based on type 2 diabetes risk in England: A population-based cohort study. Lancet Diabetes Endocrinol. 2021, 9, 419–426. [Google Scholar] [CrossRef]
- Arvanitakis, Z.; Shah, R.C.; Bennett, D.A. Diagnosis and management of dementia: Review. JAMA 2019, 322, 1589–1599. [Google Scholar] [CrossRef] [PubMed]
- Jung, H.W.; Jang, I.Y.; Lee, C.K.; Yu, S.S.; Hwang, J.K.; Jeon, C.; Lee, Y.S.; Lee, E. Usual gait speed is associated with frailty status, institutionalization, and mortality in community-dwelling rural older adults: A longitudinal analysis of the Aging Study of Pyeongchang Rural Area. Clin. Interv. Aging 2018, 13, 1079–1089. [Google Scholar] [CrossRef] [PubMed] [Green Version]
- Clegg, A.; Rogers, L.; Young, J. Diagnostic test accuracy of simple instruments for identifying frailty in community-dwelling older people: A systematic review. Age Ageing 2015, 44, 148–152. [Google Scholar] [CrossRef] [Green Version]


| All Subjects | Female | Male | p-Value * | |
|---|---|---|---|---|
| n = 280 | n = 163 | n = 117 | ||
| Age (y) | 79.3 ± 6.2 | 79.4 ± 5.7 | 79.0 ± 6.8 | 0.573 |
| 65–74 | 58 (20.7) | 28 (17.2) | 30 (25.6) | 0.065 |
| 75–84 | 166 (59.3) | 106 (65.0) | 60 (51.3) | |
| >84 | 56 (20) | 29 (17.8) | 27 (23.1) | |
| BMI | 23.4 ± 3.7 | 23.7 ± 4.0 | 23.1 ± 3.2 | 0.249 |
| BMI groups for Asians, n (%) | ||||
| Underweight (<18.5) | 22 (7.9) | 14 (8.6) | 8 (6.8) | 0.272 |
| Normal (18.5–23) | 109 (38.9) | 60 (36.8) | 49 (41.9) | |
| Overweight (23–27.5) | 113 (40.4) | 63 (38.7) | 50 (42.7) | |
| Obesity (27.5<) | 36 (12.9) | 26 (16.0) | 10 (8.5) | |
| WHO BMI groups, n (%) | ||||
| Underweight (<18.5) | 22 (7.9) | 14 (8.6) | 8 (6.8) | 0.361 |
| Normal (18.5–24.9) | 173 (61.8) | 96 (58.9) | 77 (65.8) | |
| Overweight (25.0–29.9) | 71 (25.4) | 42 (25.8) | 29 (24.8) | |
| Obesity (30.0<) | 14 (5.0) | 11 (6.7) | 3 (2.6) | |
| Frail score | 2.3 ± 1.2 | 2.4 ± 1.2 | 2.2 ± 1.2 | 0.247 |
| Frail status, n (%) | ||||
| Non-frail | 155 (55.4) | 84 (51.5) | 71 (60.7) | 0.129 |
| Frail | 125 (44.6) | 79 (48.5) | 46 (39.3) | |
| Fall history a, n (%) | ||||
| Faller | 110 (44.2) | 63 (42.3) | 47 (47.0) | 0.462 |
| Non-faller | 139 (55.8) | 86 (57.7) | 53 (53.0) | |
| MMSE | 26.2 ± 2.6 | 26.3 ± 2.6 | 26.0 ± 2.7 | 0.381 |
| TUG (s) b | 14.6 ± 7.4 | 14.5 ± 6.6 | 14.8 ± 8.5 | 0.691 |
| Medical History | ||||
| Musculoskeletal diseases, n (%) | 218 (77.9) | 148 (90.8) | 70 (42.9) | <0.01 |
| Neurological disease, n (%) | 35 (12.5) | 9 (5.5) | 26 (16.0) | <0.01 |
| Heart failure, n (%) | 26 (9.3) | 11 (6.7) | 15 (9.2) | 0.080 |
| Cancer, n (%) | 22 (7.9) | 4 (2.5) | 18 (11.0) | <0.01 |
| mean ± standard deviation |
| All Patients (n = 280) | Model 1 * | Model 2 ** | Model 3 *** | ||||||
|---|---|---|---|---|---|---|---|---|---|
| Adjusted R2 = 0.02 | Adjusted R2 = 0.07 | Adjusted R2 = 0.09 | |||||||
| Odds Ratio | 95%CI | p-Value | Odds Ratio | 95%CI | p-Value | Odds Ratio | 95%CI | p-Value | |
| BMI groups a | |||||||||
| Normal | reference | reference | reference | ||||||
| Underweight | 1.92 | 0.74, 4.94 | 0.177 | 1.73 | 0.65, 4.57 | 0.270 | 1.69 | 0.61, 4.70 | 0.312 |
| Overweight | 0.81 | 0.47, 1.37 | 0.434 | 0.81 | 0.47, 1.41 | 0.458 | 0.82 | 0.46, 1.44 | 0.481 |
| Obesity | 0.48 | 0.22, 1.08 | 0.075 | 0.49 | 0.21, 1.13 | 0.093 | 0.52 | 0.22, 1.22 | 0.131 |
| Female | -------- | -------- | -------- | 1.59 | 0.95, 2.64 | 0.074 | 2.00 | 1.12, 3.61 | 0.020 |
| Age | -------- | -------- | -------- | 1.05 | 1.40, 15.94 | 0.011 | 1.05 | 1.01, 1.10 | 0.015 |
| MMSE | -------- | -------- | -------- | 0.87 | 0.96, 1.14 | 0.005 | 0.89 | 0.80, 0.98 | 0.014 |
| Musculoskeletal diseases | -------- | -------- | -------- | -------- | -------- | -------- | 0.97 | 0.47, 2.01 | 0.941 |
| Neurological diseases | -------- | -------- | -------- | -------- | -------- | -------- | 1.39 | 0.57, 3.37 | 0.463 |
| Heart failure | -------- | -------- | -------- | -------- | -------- | -------- | 3.85 | 1.44, 10.27 | 0.007 |
| Cancer | -------- | -------- | -------- | -------- | -------- | -------- | 1.96 | 0.70, 5.44 | 0.198 |
| Female Patients (n = 163) | Model 1 * | Model 2 ** | Model 3 *** | ||||||
|---|---|---|---|---|---|---|---|---|---|
| Adjusted R2 = 0.03 | Adjusted R2 = 0.11 | Adjusted R2 = 0.15 | |||||||
| Odds Ratio | 95%CI | p-Value | Odds Ratio | 95%CI | p-Value | Odds Ratio | 95%CI | p-Value | |
| BMI groups a | |||||||||
| Normal | reference | reference | reference | ||||||
| Underweight | 4.19 | 1.06, 16.55 | 0.041 | 4.33 | 1.04, 18.07 | 0.045 | 4.08 | 0.93, 17.90 | 0.063 |
| Overweight | 1.11 | 0.55, 2.25 | 0.778 | 1.10 | 0.52, 2.33 | 0.796 | 0.83 | 0.38, 1.83 | 0.652 |
| Obesity | 0.61 | 0.23, 1.57 | 0.302 | 0.72 | 0.27, 1.96 | 0.526 | 0.66 | 0.23 1.88 | 0.440 |
| Age | -------- | -------- | -------- | 1.11 | 1.04, 1.18 | 0.001 | 1.10 | 1.03, 1.18 | 0.004 |
| MMSE | -------- | -------- | -------- | 0.86 | 0.75, 0.98 | 0.019 | 0.86 | 0.75, 0.99 | 0.034 |
| Musculoskeletal diseases | -------- | -------- | -------- | -------- | -------- | -------- | 0.98 | 0.23, 4.27 | 0.979 |
| Neurological diseases | -------- | -------- | -------- | -------- | -------- | -------- | 13.62 | 1.06, 174.20 | 0.446 |
| Heart failure | -------- | -------- | -------- | -------- | -------- | -------- | 2.86 | 0.55, 14.9 | 0.210 |
| Cancer | -------- | -------- | -------- | -------- | -------- | -------- | 2.21 | 0.20, 25.06 | 0.522 |
| Male Patients (n = 117) | Model 1 * | Model 2 ** | Model 3 *** | ||||||
|---|---|---|---|---|---|---|---|---|---|
| Adjusted R2 = 0.03 | Adjusted R2 = 0.05 | Adjusted R2 = 0.09 | |||||||
| Odds Ratio | 95%CI | p-Value | Odds Ratio | 95%CI | p-Value | Odds Ratio | 95%CI | p-Value | |
| BMI groups a | |||||||||
| Normal | reference | reference | reference | ||||||
| Underweight | 0.63 | 0.13, 2.91 | 0.549 | 0.50 | 0.10, 2.60 | 0.430 | 0.39 | 0.07, 2.32 | 0.300 |
| Overweight | 0.54 | 0.24, 1.21 | 0.132 | 0.50 | 0.20, 1.20 | 0.144 | 0.56 | 0.23, 1.35 | 0.197 |
| Obesity | 0.26 | 0.05, 1.35 | 0.110 | 0.20 | 0.05, 1.33 | 0.104 | 0.34 | 0.06, 1.88 | 0.215 |
| Age | -------- | -------- | -------- | 1.01 | 0.95, 1.07 | 0.748 | 1.01 | 0.95, 1.07 | 0.796 |
| MMSE | -------- | -------- | -------- | 0.87 | 0.75, 1.00 | 0.055 | 0.87 | 0.87, 0.76 | 0.071 |
| Musculoskeletal diseases | -------- | -------- | -------- | -------- | -------- | -------- | 1.04 | 0.43, 2.53 | 0.932 |
| Neurological disease | -------- | -------- | -------- | -------- | -------- | -------- | 0.54 | 0.18, 1.69 | 0.292 |
| Heart failure | -------- | -------- | -------- | -------- | -------- | -------- | 3.00 | 0.86, 10.42 | 0.084 |
| Cancer | -------- | -------- | -------- | -------- | -------- | -------- | 2.00 | 0.61, 6.57 | 0.249 |
Publisher’s Note: MDPI stays neutral with regard to jurisdictional claims in published maps and institutional affiliations. |
© 2021 by the authors. Licensee MDPI, Basel, Switzerland. This article is an open access article distributed under the terms and conditions of the Creative Commons Attribution (CC BY) license (https://creativecommons.org/licenses/by/4.0/).
Share and Cite
Asai, T.; Wakida, M.; Kubota, R.; Fukumoto, Y.; Sato, H.; Nakano, J.; Hase, K. A Cross-Sectional Study on the Association between Body Mass Index and Frailty According to Sex in Elderly Patients with Disabilities from an Elderly Day-Care Center. Geriatrics 2022, 7, 7. https://doi.org/10.3390/geriatrics7010007
Asai T, Wakida M, Kubota R, Fukumoto Y, Sato H, Nakano J, Hase K. A Cross-Sectional Study on the Association between Body Mass Index and Frailty According to Sex in Elderly Patients with Disabilities from an Elderly Day-Care Center. Geriatrics. 2022; 7(1):7. https://doi.org/10.3390/geriatrics7010007
Chicago/Turabian StyleAsai, Tsuyoshi, Masanori Wakida, Ryo Kubota, Yoshihiro Fukumoto, Haruhiko Sato, Jiro Nakano, and Kimitaka Hase. 2022. "A Cross-Sectional Study on the Association between Body Mass Index and Frailty According to Sex in Elderly Patients with Disabilities from an Elderly Day-Care Center" Geriatrics 7, no. 1: 7. https://doi.org/10.3390/geriatrics7010007
APA StyleAsai, T., Wakida, M., Kubota, R., Fukumoto, Y., Sato, H., Nakano, J., & Hase, K. (2022). A Cross-Sectional Study on the Association between Body Mass Index and Frailty According to Sex in Elderly Patients with Disabilities from an Elderly Day-Care Center. Geriatrics, 7(1), 7. https://doi.org/10.3390/geriatrics7010007