Estimate of the Costs Caused by Adverse Effects in Hospitalised Patients Due to Hip Fracture: Design of the Study and Preliminary Results


 ,
,
Abstract

1. Introduction
2. Methodology
- Each episode is assigned an SOI (severity of illness) from 1 (not severe) to 4 (very severe).
- Each episode is assigned an ROM (risk of mortality) from 1 (low risk of mortality) to 4 (high risk of mortality).
- The relative weight of each DRG-APr is calculated for each combination of DRG/SOI which allows weights and costs much more adjusted not only to the pathology of the patient, but to his/her previous level of disease (comorbidity) and to its severity.
- At the end of 2015, the Ministry of Health and Consumption published a list of estimated relative weights and costs for each of the pairs of DRG/SOI [44].
- The “GRD on discharge”, which is calculated at the time of hospital discharge for the patient with all diagnoses and procedures coded in the CMBD.
- The “GRD on admission”, which is calculated with the information available at the time of admission, not using the diagnoses POA = NO that reflect the adverse effects during hospitalization.
- On the one hand, all secondary diagnoses whose variable POA is equal to “No” are added up and a discrete quantitative variable (NumPOAs) is obtained with the number of adverse effects that the patient has had during their hospitalization.
- On the other, the previous variable is simplified to know if the patient has or has not had any adverse effect, thus creating the dichotomous qualitative variable nPOA.
- In the same way, we add all secondary diagnoses with variable POA equal to “N” and with variable AffectSOIFlag = “1”. The result is a discrete quantitative variable (NumPOAs_AffectSOIFlag) with the number of adverse effects that affect the change in severity of the patient’s DRG.
- The previous variable is simplified into a qualitative dichotomous one nPOA_AffectSOIFlag as a function of the presence of new diagnoses that produce changes in severity and costs.
- The variable nPOA_Cost (dichotomous/binary) that will have a value = 1 if these adverse effects have resulted in a change in patient DRG and, therefore, in their relative weight and in their cost. The value will be 0 if, in spite of having suffered some adverse effect, it has not had consequences in the assignation of DRG and relative weight.
- The variable CostAPr (continuous quantitative) with the cost/tariff was calculated for the DRG-APr on patient discharge.
- The variable CostAPr_Adm (continuous quantitative) with the cost/tariff was calculated for the DRG-APr at the time of patient admission, not considering adverse effects (POA = NO).
- The variable Diff_Cost_APr (continuous quantitative) with the cost/tariff was calculated for the difference between the DRG-APr at discharge and the DRG-APr at the time of patient admission.
2.1. Statistical Analysis
2.2. Declaration of Ethical Commitment
3. Results
4. Discussion
Acknowledgments
Author Contributions
Conflicts of interest
References
- Institute of Medicine. Committee on Quality of Health Care in America. To err is human: Building a safer health system. Available online: https://www.nap.edu/catalog/9728/to-err-is-human-building-a-safer-health-system (accessed on 19 March 2017).
- AHRQ. Agency for Healthcare Research and Quality (AHRQ). Available online: https://qualityindicators.ahrq.gov/default.aspx (accessed on 19 March 2017).
- OECD. The Organisation for Economic Co-operation and Development (OECD): Health indicators. Available online: http://stats.oecd.org/Index.aspx?DatasetCode=HEALTH_STAT (accessed on 19 March 2017).
- European Commission. European Commission: Health indicators. Available online: http://ec.europa.eu/health/indicators/policy_en (accessed on 19 March 2017).
- OMS. Organizacion Mundial de la Salud: Seguridad del paciente. Available online: http://www.who.int/patientsafety/es/ (accessed on 19 March 2017).
- Ministerio de sanidad ssei. Icmbd: indicadores y ejes de análisis del cmbd. Available online: http://icmbd.es/login-success.do (accessed on 19 March 2017).
- Saturno, P.J.; Fernández-Maíllo, M. Construcción y validación de indicadores de buenas prácticas sobre seguridad del paciente. 2008. Available online: http://scholar.google.com/scholar?hl=en&btnG=Search&q=intitle:Construcción+y+validación+de+indicadores+de+buenas+prácticas+sobre+seguridad+del+paciente#0 (accessed on 20 March 2017).
- Generalitat de Catalunya. Observatorio del Sistema de Salud de Cataluña. Available online: http://observatorisalut.gencat.cat/es/central_de_resultats (accessed on 19 March 2017).
- Servicio Madrileño de Salud. Observatorio de resultados del Servicio Madrileño de Salud. Available online: http://observatorioresultados.sanidadmadrid.org/HospitalesLista.aspx (accessed on 19 March 2017).
- Pirson, M.; Martins, D.; Jackson, T.; Dramaix, M.; Leclercq, P. Prospective casemix-based funding, analysis and financial impact of cost outliers in all-patient refined diagnosis related groups in three Belgian general hospitals. Eur. J. Health Econ. 2006, 7, 55–65. [Google Scholar] [CrossRef] [PubMed]
- Ehsani, J.P.; Jackson, T.; Duckett, S.J. The incidence and cost of adverse events in Victorian hospitals 2003–2004. Med. J. Aust. 2006, 184, 551–555. [Google Scholar] [PubMed]
- Corral Baena, S.; Guerrero Aznar, M.D.; Beltrán García, M.; Salas Turrens, J. Use of MBDS as a tool for the detection of drug-related adverse events [Utilización del CMBD como herramienta para la detección de acontecimientos adversos a medicamentos]. Farm. Hosp. 2004, 28, 258–265. [Google Scholar] [PubMed]
- González Chordá, V.M.; Maciá Soler, M.L. Grupos de pacientes Relacionados por el Diagnóstico (GRD) en los hospitales generales españoles: Variabilidad en la estancia media y el coste medio por proceso. Enfermería Glob. 2011, 10, 125–143. [Google Scholar] [CrossRef]
- Devas, M. Geriatric orthopaedics. Int. Orthop. 1977, 1, 155–158. [Google Scholar] [CrossRef]
- Devas, M.B. Geriatric Orthopaedics. BMJ 1974, 1, 190–192. [Google Scholar] [CrossRef] [PubMed]
- Cummings, S.R.; Melton, L.J. Osteoporosis I: Epidemiology and outcomes of osteoporotic fractures. Lancet 2002, 359, 1761–1767. [Google Scholar] [CrossRef]
- Cummings, S.R.; Raisz, L.G. Hip fracture. N. Engl. J. Med. 1996, 335, 1994. [Google Scholar] [PubMed]
- Tarazona-Santabalbina, F.J.; Belenguer-Varea, A.; Rovira Daudi, E.; Salcedo Mahiques, E.; Cuesta Peredo, D.; Domenech-Pascual, J.R.; Gac Espínola, H.; Avellana Zaragoza, J.A. Severity of cognitive impairment as a prognostic factor for mortality and functional recovery of geriatric patients with hip fracture. Geriatr. Gerontol. Int. 2015, 15, 289–295. [Google Scholar] [CrossRef] [PubMed]
- Tarazona-Santabalbina, F.J.; Belenguer-Varea, Á.; Rovira, E.; Cuesta-Peredó, D. Orthogeriatric care: Improving patient outcomes. Clin. Interv. Aging 2016, 11, 843–856. [Google Scholar] [CrossRef] [PubMed]
- Tarazona-Santabalbina, F.J.; Belenguer-Varea, Á.; Rovira-Daudi, E.; Salcedo-Mahiques, E.; Cuesta-Peredó, D.; Doménech-Pascual, J.R.; Salvador-Pérez, M.I.; Avellana-Zaragoza, J.A. Early interdisciplinary hospital intervention for elderly patients with hip fractures–functional outcome and mortality. Clinics 2012, 67, 547–555. [Google Scholar] [CrossRef]
- News, U.S.; Allen, P. World-Renowned Johns Hopkins Hospital Improves Its Case Mix Index and Financial Performance Using 3M TM APR DRGs. 1999. Available online: http://solutions.3mitalia.it/3MContentRetrievalAPI/BlobServlet?locale=sq_AL&lmd=1218718954000&assetId=1180603361137&assetType=MMM_Image&blobAttribute=ImageFile (accessed on 15 November 2017).
- Rivero_Cuadrado, A.; Coord. Análisis y desarrollo de los GDR en el Sistema Nacional de Salud. 1999. Available online: http://www.msssi.gob.es/estadEstudios/estadisticas/docs/analisis.pdf (accessed on 15 November 2017).
- Tan, S.S.; Geissler, A.; Serdén, L.; Heurgren, M.; Martin Van Ineveld, B.; Ken Redekop, W.; Hakkaart-van Roijen, L.; EuroDRG Group. DRG systems in Europe: Variations in cost accounting systems among 12 countries. Eur. J. Public Health 2014, 24, 1023–1028. [Google Scholar] [CrossRef] [PubMed]
- Peiró, S.; Librero, J.; Peir¢, S.; Librero, J. Evaluación de la Calidad a partir del conjunto m¡nimo de datos básicos al alta hospitalaria. Rev. Neurol. 1999, 29, 651–661. [Google Scholar] [PubMed]
- Jiménez-Puente, A.; García-Alegría, J.; Lara-Blanquer, A. Sistemas de Información para Clínicos II. Como analizar la Eficiencia y Calidad de la Asistencia Intrahospitalaria. Rev. Clin. Esp. 2010, 210, 350–354. [Google Scholar] [CrossRef] [PubMed]
- Martín Hernández, J.C.; Ortega Diaz, M.I. Rendimiento Hospitalario y Benchmarking en España; Universidad de Sevilla: Sevilla, Spain, 2013; pp. 1–20. [Google Scholar]
- Lagoe, R.J.; Johnson, P.E.; Murphy, M.P. Inpatient hospital complications and lengths of stay: A short report. BMC Res. Notes 2011, 4, 135. [Google Scholar] [CrossRef] [PubMed]
- Miller, R.; Eng, T.; Kandilov, A.M.; Cromwell, J.; McCall, N. Readmissions Due to Hospital-Acquired Conditions (HACs): Multivariate Modeling and Under-coding Analyses. RTI Int.; 2012. Available online: https://www.cms.gov/Medicare/Medicare-Fee-for-Service-Payment/HospitalAcqCond/Downloads/Final-Report-Readmissions.pdf (Accessed on 15 November 2017).
- Barba, R.; Emilio Losa, J.; Guijarro, C.; Zapatero, A. Fiabilidad del conjunto mínimo básico de datos (CMBD) en el diagnóstico de la enfermedad tromboembólica. Med. Clin. (Barc). 2006, 127, 255–257. [Google Scholar] [CrossRef] [PubMed]
- Monge, V.; González, A. Hospital admissions for pneumonia in Spain. Infection 2001, 29, 3–6. [Google Scholar] [CrossRef] [PubMed]
- Sendra, J.M.; Sarría-Santamera, A.; Iñigo, J.; Regidor, E. Factores asociados a la mortalidad intrahospitalaria del infarto de miocardio. Resultados de un estudio observacional. Med. Clin. (Barc). 2005, 125, 641–646. [Google Scholar] [CrossRef] [PubMed]
- Reporting, I. Hospital-Acquired Conditions (HAC) in Acute Inpatient Prospective Payment System (IPPS) Hospitals. 2012. Available online: https://content.findacode.com/files/documents/medicare/factsheets/HACFactsheet.pdf (accessed on 15 September 2017).
- Mills, R.E.B. Impact of the Transition to ICD-10 on Medicare Inpatient Hospital Payments. Medicare Medicaid Res. Rev. 2011, 1, E1. [Google Scholar] [CrossRef] [PubMed]
- News, U.S.; Report, W. Case Study: Vanderbilt University Medical Center. 2012. Available online: http://solutions.3mitalia.it/3MContentRetrievalAPI/BlobServlet?lmd=1218719295000&locale=it_IT&assetType=MMM_Image&assetId=1180603361210&blobAttribute=ImageFile (Accessed on 18 October 2017).
- Brown, K. Methodist Medical Center Uses 3M TM APR DRGs to More Accurately Reflect the Patient Population in Its Quality Reporting Data. 2004. Available online: http://solutions.3mitalia.it/3MContentRetrievalAPI/BlobServlet?lmd=1218718727000&locale=it_IT&assetType=MMM_Image&assetId=1180603361073&blobAttribute=ImageFile (Accessed on 18 October 2017).
- Profile, C.; Medical, C.; Carolina, S. Conway Medical Center Implements the 3M TM APR DRG Methodology, Improving Patient Documentation and Enhancing Staff Communication. Available online: http://solutions.3mitalia.it/3MContentRetrievalAPI/BlobServlet?lmd=1218719085000&locale=it_IT&assetType=MMM_Image&assetId=1180603361143&blobAttribute=ImageFile (accessed on 18 October 2017).
- Quality, M. 3M TM APR DRG Classification System Improving Care with 3M APR DRGs. 2004. Available online: https://multimedia.3m.com/mws/media/478415O/3m-apr-drg-fact-sheet.pdf (accessed on 18 October 2017).
- Or, Z. Implementation of DRG Payment in France: Issues and recent developments. Health Policy 2014, 117, 146–150. [Google Scholar] [CrossRef] [PubMed]
- Aw, D.; Sahota, O. Orthogeriatrics moving forward. Age Ageing 2014, 43, 301–305. [Google Scholar] [CrossRef] [PubMed]
- Barr, L.V.; Vindlacheruvu, M.; Gooding, C.R. The effect of becoming a major trauma centre on outcomes for elderly hip fracture patients. Injury 2015, 46, 384–387. [Google Scholar] [CrossRef] [PubMed]
- Bhattacharyya, R.; Agrawal, Y.; Elphick, H.; Blundell, C. A unique orthogeriatric model: A step forward in improving the quality of care for hip fracture patients. Int. J. Surg. 2013, 11, 1083–1086. [Google Scholar] [CrossRef] [PubMed]
- Boddaert, J.; Cohen-Bittan, J.; Khiami, F.; Le Manach, Y.; Raux, M.; Beinis, J.Y.; Verny, M.; Riou, B. Postoperative admission to a dedicated geriatric unit decreases mortality in elderly patients with hip fracture. PLoS ONE 2014, 9, e83795. [Google Scholar] [CrossRef] [PubMed]
- Charlson, M.E.; Pompei, P.; Ales, K.L.; MacKenzie, C.R. A new method of classifying prognostic comorbidity in longitudinal studies: Development and validation. J. Chronic Dis. 1987, 40, 373–383. [Google Scholar] [CrossRef]
- Ministerio de Sanidad. Portal Estadístico del SNS—Costes Hopitalarios—Contabilidad Aálitica—Pesos y Costes de los GRDs APr32. Ministerio de Sanidad; 2015. Available online: http://www.msssi.gob.es/estadEstudios/estadisticas/inforRecopilaciones/anaDesarrolloGDR.htm (accessed on 19 March 2017).
- Hughes, J.S.; Averill, R.F.; Goldfield, N.I.; Gay, J.C.; Muldoon, J.; McCullough, E.; Xiang, J. Identifying potentially preventable complications using a present on admission indicator. Health Care Financ. Rev. 2006, 27, 63–82. [Google Scholar] [PubMed]
- Lau, T.-W.; Fang, C.; Leung, F. The effectiveness of a geriatric hip fracture clinical pathway in reducing hospital and rehabilitation length of stay and improving short-term mortality rates. Geriatr. Orthop. Surg. Rehabil. 2013, 4, 3–9. [Google Scholar] [CrossRef] [PubMed]
- Gupta, A. The effectiveness of geriatrician-led comprehensive hip fracture collaborative care in a new acute hip unit based in a general hospital setting in the UK. J. R. Coll. Physicians Edinb. 2014, 44, 20–26. [Google Scholar] [CrossRef] [PubMed]
- Suhm, N.; Kaelin, R.; Studer, P.; Wang, Q.; Kressig, R.W.; Rikli, D.; Jakob, M.; Pretto, M. Orthogeriatric care pathway: A prospective survey of impact on length of stay, mortality and institutionalisation. Arch. Orthop. Trauma Surg. 2014, 134, 1261–1269. [Google Scholar] [CrossRef] [PubMed]
- Culler, S.D.; Jevsevar, D.S.; McGuire, K.J.; Shea, K.G.; Little, K.M.; Schlosser, M.J. Predicting the Incremental Hospital Cost of Adverse Events Among Medicare Beneficiaries in the Comprehensive Joint Replacement Program During Fiscal Year 2014. J. Arthroplasty 2017, 32, 1732–1738. [Google Scholar] [CrossRef] [PubMed]
- Smith, T.; Pelpola, K.; Ball, M.; Ong, A.; Myint, P.K. Pre-operative indicators for mortality following hip fracture surgery: A systematic review and meta-analysis. Age Ageing 2014, 43, 464–471. [Google Scholar] [CrossRef] [PubMed]
- Rosso, F.; Dettoni, F.; Bonasia, D.E.; Olivero, F.; Mattei, L.; Bruzzone, M.; Marmotti, A.; Rossi, R. Prognostic factors for mortality after hip fracture: Operation within 48 h is mandatory. Injury 2016, 47 (Suppl. 4), S91–S97. [Google Scholar] [CrossRef] [PubMed]
- Ireland, A.W.; Kelly, P.J.; Cumming, R.G. Risk factor profiles for early and delayed mortality after hip fracture: Analyses of linked Australian Department of Veterans’ Affairs databases. Injury 2015, 46, 1028–1035. [Google Scholar] [CrossRef] [PubMed]
- Henderson, C.Y.; Ryan, J.P. Predicting mortality following hip fracture: An analysis of comorbidities and complications. Irish J. Med. Sci. 2015, 184, 667–671. [Google Scholar] [CrossRef] [PubMed]
- Aigner, R.; Meier Fedeler, T.; Eschbach, D.; Hack, J.; Bliemel, C.; Ruchholtz, S.; Bücking, B. Patient factors associated with increased acute care costs of hip fractures: A detailed analysis of 402 patients. Arch. Osteoporos 2016, 11, 38. [Google Scholar] [CrossRef] [PubMed]
- Nichols, C.I.; Vose, J.G.; Nunley, R.M. Clinical Outcomes and 90-Day Costs Following Hemiarthroplasty or Total Hip Arthroplasty for Hip Fracture. J. Arthroplasty 2017, 32, S128–S134. [Google Scholar] [CrossRef] [PubMed]
- Ginsberg, G.; Adunsky, A.; Rasooly, I. A cost-utility analysis of a comprehensive orthogeriatric care for hip fracture patients, compared with standard of care treatment. HIP Int. 2013, 23, 570–575. [Google Scholar] [CrossRef] [PubMed]
- Della Rocca, G.J.; Moylan, K.C.; Crist, B.D.; Volgas, D.A.; Stannard, J.P.; Mehr, D.R. Comanagement of geriatric patients with hip fractures: A retrospective, controlled, cohort study. Geriatr. Orthop. Surg. Rehabil. 2013, 4, 10–15. [Google Scholar] [CrossRef] [PubMed]
- Gonzalez Montalvo, J.I.; Gotor Perez, P.; Martin Vega, A.; Alarcon Alarcon, T.; de Linera, J.L.M.A.; Garayc, E.G.; Cimbrelo, E.G.; Biarge, J.A. La unidad de ortogeriatria de agudos. Evaluacion de su efecto en el curso clinico de los pacientes con fractura de cadera y estimacion de su impacto economico. Rev. Esp. Geriatr. Gerontol. 2011, 46, 193–199. [Google Scholar] [CrossRef] [PubMed]

| Variables | n = 1571 | |
|---|---|---|
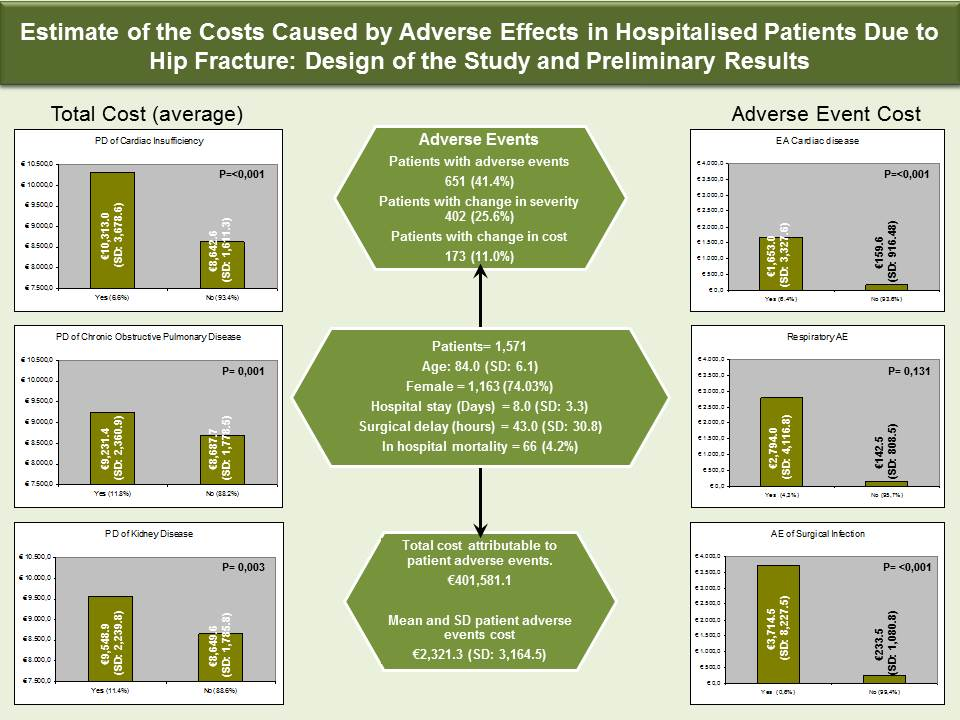
| Age (years) | 84.0 (SD: 6.1) | |
| Sex | Male | 408 (25.97%) |
| Female | 1163 (74.03%) | |
| Surgical delay (hours) | 43.0 (SD: 30.8) | |
| Delay < 48 h | 1038 (66.07%) | |
| Hospital stay (Days) | 8.0 (SD: 3.3) | |
| Stays < 10 Days | 1376 (87.59%) | |
| Mortality | 66 (4.2%) | |
| Fracture Type | Intracapsular | 907 (57.73%) |
| Extracapsular | 660 (42.02%) | |
| Other | 4 (0.25%) | |
| Surgery Type | Intracapsular | 1014 (64.55%) |
| Extracapsular | 527 (33.55%) | |
| Other | 30 (1.90%) | |
| Anaesthesia Type | Rachidian | 1302 (82.88%) |
| General | 222 (14.13%) | |
| Other | 47 (2.99%) | |
| ER admission | 16 (1.02%) | |
| Charlson Index | 2.4 (SD: 2.3) | |
| APrSev (SOI) | 1 | 652 (41.50%) |
| 2 | 746 (47.49%) | |
| 3 | 150 (9.55%) | |
| 4 | 23 (1.46%) | |
| APrMort (ROM) | 1 | 702 (44.68%) |
| 2 | 711 (45.26%) | |
| 3 | 133 (8.47%) | |
| 4 | 25 (1.59%) | |
| ASA | 0 | 5 (0.32%) |
| 1 | 416 (26.48%) | |
| 2 | 754 (47.99%) | |
| 3 | 60 (3.82%) | |
| AverWeight_Apr | 1.8284 (SD: 0.3895) | |
| Variables | n = 1,571 |
|---|---|
| nPOA | 651 (41.4%) |
| nPOA_AffectSOIFlag | 402 (25.6%) |
| nPOA_Cost | 173 (11.0%) |
| Cost_Apr (Total in Euros) annual | €13,749,524.6 |
| Cost_Apr (Mean and SD in Euros) | €8,752.1 (SD:1,864.4) |
| Diff_Cost_Apr (Total in Euros) annual | €401,581.1 |
| Diff_Cost_Apr (Mean and SD in Euros) | €2,321.3 (SD: 3,164.5) |
| VARIABLES | Discharges | Age (Years) | p Value | Hospital Stay (Days) | p Value | n (%) Mortality | p Value | DelayIQ (Hours) | p Value | AverWeight_APr | p Value | |
|---|---|---|---|---|---|---|---|---|---|---|---|---|
| Total Cases | 1571 | 84.1 (SD: 6.3) | 8.0 (SD: 3.3) | 4.2% | 43.0 (SD: 30.8) | 1.8284 (SD: 0.3895) | ||||||
| PREVIOUS DIAGNOSE (PD) | ||||||||||||
| PD of Ischemic Cardiopathy | Yes | 109 (6.9%) | 84.0 (SD: 6.1) | 0.772 | 8.4 (SD: 4.1) | 0.162 | 6 (5.5%) | 0.455 | 41.6 (SD: 23.8) | 0.602 | 1.8938 (SD: 0.2837) | 0.069 |
| No | 1462 (93.1%) | 84.2 (SD: 6.3) | 8.0 (SD: 3.3) | 60 (4.1%) | 43.2 (SD: 31.3) | 1.8236 (SD: 0.3959) | ||||||
| PD of Cardiac Insufficiency | Yes | 103 (6.6%) | 84.2 (SD: 6.3) | 0.941 | 9.6 (SD: 5.5) | 0.003 | 13 (12.6%) | <0.001 | 54.9 (SD: 61.4) | 0.039 | 2.1545 (SD: 0.7685) | <0.001 |
| No | 1468 (93.4%) | 84.2 (SD: 6.3) | 7.9 (SD: 3.1) | 53 (3.6%) | 42.2 (SD: 27.3) | 1.8056 (SD: 0.3366) | ||||||
| PD of Chronic Obstructive Pulmonary Disease | Yes | 186 (11.8%) | 83.3 (SD: 6.1) | 0.056 | 8.4 (SD: 3.8) | 0.131 | 12 (6.5%) | 0.117 | 46.9 (SD: 32.7) | 0.067 | 1.9286 (SD: 0.4932) | 0.003 |
| No | 1385 (88.2%) | 84.3 (SD: 6.3) | 8.0 (SD: 3.2) | 54 (3.9%) | 42.5 (SD: 30.5) | 1.8150 (SD: 0.3751) | ||||||
| PD of Cerebrovascular Disease | Yes | 29 (1.8%) | 82.7 (SD: 8.1) | 0.322 | 9.4 (SD: 5.3) | 0.022 | 2 (6.9%) | 0.346 | 43.6 (SD: 23.3) | 0.919 | 2.0380 (SD: 0.7277) | 0.126 |
| No | 1542 (98.2%) | 84.2 (SD: 6.2) | 8.0 (SD: 3.3) | 64 (4.2%) | 43.0 (SD: 30.9) | 1.8244 (SD: 0.3796) | ||||||
| PD of Dementia | Yes | 251 (16.0%) | 84.7 (SD: 6.0) | 0.152 | 8.0 (SD: 3.0) | 0.742 | 9 (3.6%) | 0.732 | 41.3 (SD: 24.6) | 0.339 | 1.8237 (SD: 0.3093) | 0.835 |
| No | 1320 (84.0%) | 84.1 (SD: 6.3) | 8.1 (SD: 3.4) | 57 (4.3%) | 43.4 (SD: 31.8) | 1.8293 (SD: 0.4030) | ||||||
| PD of Kidney Disease | Yes | 179 (11.4%) | 84.5 (SD: 6.5) | 0.375 | 8.7 (SD: 4.4) | 0.026 | 16 (8.9%) | 0.002 | 42.9 (SD: 25.3) | 0.957 | 1.9949 (SD: 0.4679) | <0.001 |
| No | 1392 (88.6%) | 84.1 (SD: 6.3) | 7.9 (SD: 3.1) | 50 (3.6%) | 43.1 (SD: 31.5) | 1.8070 (SD: 0.3731) | ||||||
| PD of Diabetes | Yes | 432 (27.5%) | 83.4 (SD: 5.8) | 0.001 | 8.0 (SD: 3.1) | 0.851 | 16 (3.7%) | 0.673 | 44.7 (SD: 39.8) | 0.192 | 1.8464 (SD: 0.4340) | 0.260 |
| No | 1139 (72.5%) | 84.5 (SD: 6.4) | 8.0 (SD: 3.4) | 50 (4.4%) | 42.4 (SD: 26.6) | 1.8216 (SD: 0.3712) | ||||||
| PD of Hypertension | Yes | 1051 (66.9%) | 84.5 (SD: 6.1) | <0.001 | 7.9 (SD: 3.1) | 0.639 | 45 (4.3%) | 0.469 | 42.4 (SD: 25.8) | 0.211 | 1.8217 (SD: 0.3281) | 0.330 |
| No | 520 (33.1%) | 83.3 (SD: 6.4) | 8.1 (SD: 3.7) | 21 (4.0%) | 44.4 (SD: 39.0) | 1.8420 (SD: 0.4907) | ||||||
| ADVERSE EFFECTS (AE) | ||||||||||||
| EA de Delirium | Yes | 238 (15.1%) | 86.5 (SD: 5.6) | <0.001 | 8.9 (SD: 4.1) | <0.001 | 6 (2.5%) | 0.218 | 45.8 (SD: 25.5) | 0.139 | 1.9229 (SD: 0.4153) | <0.001 |
| No | 1333 (84.9%) | 83.7 (SD: 6.3) | 7.9 (SD: 3.1) | 60 (4.5%) | 42.6 (SD: 31.6) | 1.8116 (SD: 0.3824) | ||||||
| EA Cardiac disease | Yes | 101 (6.4%) | 86.1 (SD: 6.4) | 0.001 | 10.8 (SD: 6.0) | <0.001 | 29 (28.7%) | <0.001 | 54.3 (SD: 62.1) | 0.056 | 2.1733 (SD: 0.7712) | <0.001 |
| No | 1,470 (93.6%) | 84.0 (SD: 6.3) | 7.8 (SD: 0.30) | 37 (2.5%) | 42.3 (SD: 27.4) | 1.8047 (SD: 0.3360) | ||||||
| AE of Anaemia | Yes | 188 (12.0%) | 84.2 (SD: 6.6) | 0.893 | 9.0 (SD: 4.6) | 0.002 | 11 (5.9%) | 0.243 | 40.0 (SD: 23.7) | 0.069 | 1.8941 (SD: 0.0337) | 0.014 |
| No | 1383 (88.0%) | 84.1 (SD: 6.1) | 7.9 (SD: 3.1) | 55 (4.0%) | 43.5 (SD: 31.6) | 1.8195 (SD: 0.3777) | ||||||
| AE of Urinary Infection | Yes | 50 (3.2%) | 83.3 (SD: 6.5) | 0.354 | 10.1 (SD: 4.1) | <0.001 | 1 (2.0%) | 0.721 | 45.9 (SD: 26.1) | 0.502 | 1.9961 (SD: 0.4166) | 0.002 |
| No | 1521 (96.8%) | 84.2 (SD: 6.3) | 7.9 (SD: 3.3) | 65 (4.3%) | 43.0 (SD: 31.0) | 1.8229 (SD: 0.3875) | ||||||
| Digestive AE | Yes | 7 (0.4%) | 87 (IQ: 77–91.5) | 0.982 | 12 (IQ: 9.5–15) | 0.099 | 3 (42.9%) | 0.002 | 25 (IQ: 14.5–38) | 0.456 | 2.1758 (IQ: 1.8588–2.1758) | 0.263 |
| No | 1564 (99.6%) | 84 (IQ: 80–88) | 7 (IQ: 6–9) | 63 (4.0%) | 34 (IQ: 23–58) | 1.7564 (IQ: 1.7564–1.8193) | ||||||
| Respiratory AE | Yes | 67 (4.3%) | 85.2 (SD: 6.7) | 0.147 | 14.3 (SD: 7.5) | <0.001 | 21 (31.3%) | <0.001 | 64.7 (SD: 85.0) | 0.033 | 2.3831 (SD: 0.9381) | <0.001 |
| No | 1504 (95.7%) | 84.1 (SD: 6.3) | 7.7 (SD: 2.7) | 45 (3.0%) | 42.1 (SD: 25.5) | 1.8037 (SD: 0.3248) | ||||||
| AE of Surgical Infection | Yes | 10 (0.6%) | 86 (IQ: 80–89) | 0.728 | 25 (IQ: 21.5–29.25) | <0.001 | 1 (10.0%) | 0.353 | 55 (IQ: 18–78.25) | 0.593 | 1.9612 (IQ: 1.9612–3.0556) | <0.001 |
| No | 1561 (99.4%) | 84 (IQ: 80–88) | 7 (IQ: 6–9) | 65 (4.2%) | 34 (IQ: 23–57) | 1.7564 (IQ: 1.7564–1.8193) | ||||||
| AE of Respiratory Infection | Yes | 23 (1.5%) | 87 (IQ: 82–89.5) | 0.202 | 10 (IQ: 9–13.5) | <0.001 | 5 (21.7%) | 0.002 | 48 (IQ: 23.5–79) | 0.065 | 1.9612 (IQ: 1.8193–2.1758) | <0.001 |
| No | 1548 (98.5%) | 84 (IQ: 80–88) | 7 (IQ: 6–9) | 61 (3.9%) | 33 (IQ: 23–56.25) | 1.7564 (IQ: 1.7564–1.8193) | ||||||
| AE of Sepsis | Yes | 9 (0.6%) | 82 (IQ: 80–84) | 0.247 | 10 (IQ: 8–13) | 0.015 | 3 (33.3%) | 0.005 | 48 (IQ: 25–59) | 0.639 | 1.9612 (IQ: 1.8193–2.1758) | 0.404 |
| No | 1562 (99.4%) | 84 (IQ: 80–88) | 7 (IQ: 6–9) | 63 (4.0%) | 34 (IQ: 23–57) | 1.7564 (IQ: 1.7564–1.8193) | ||||||
| AE of Shock | Yes | 3 (0.2%) | 87 (IQ: 80.5–89) | 0.842 | 13 (IQ: 9.5–21.5) | 0.179 | 1 (33.3%) | 0.121 | 59 (IQ: 38–81) | 0.505 | 1.7564 (IQ: 1.7564–2.5526) | 0.508 |
| No | 1568 (99.8%) | 84 (IQ: 80–88) | 7 (IQ: 6–9) | 65 (4.1%) | 34 (IQ: 23–57) | 1.7564 (IQ: 1.7564–1.8193) | ||||||
| AE of pulmonary embolism | Yes | 5 (0.3%) | 80 (IQ: 79–86) | 0.414 | 10 (IQ: 7–14) | 0.144 | 2 (40.0%) | 0.016 | 74 (IQ: 52–82) | 0.124 | 1.8193 (IQ: 1.7564–2.1758) | 0.406 |
| No | 1566 (99.7%) | 84 (IQ: 80–88) | 7 (IQ: 6–9) | 64 (4.1%) | 34 (IQ: 23–57) | 1.7564 (IQ: 1.7564–1.8193) | ||||||
| EA of Surgical haemorrhage | Yes | 9 (0.6%) | 86 (IQ: 82–86) | 0.857 | 9 (IQ: 8–10) | 0.060 | 2 (22.2%) | 0.052 | 40 (IQ: 26–64) | 0.911 | 1.8193 (IQ: 1.7564–2.1758) | 0.194 |
| No | 1562 (99.4%) | 84 (IQ: 80–88) | 7 (IQ: 6–9) | 64 (4.1%) | 34 (IQ: 23–57) | 1.7564 (IQ: 1.7564–1.8193) | ||||||
| EA exitus | Yes | 66 (4.2%) | 87.5 (SD: 7.0) | <0.001 | 9.1 (SD: 5.7) | 0.116 | 59.0 (SD: 67.4) | 0.049 | 2.2954 (SD: 1.0063) | <0.001 | ||
| No | 1505 (95.8%) | 84.0 (SD: 6.2) | 8.0 (SD: 3.2) | 42.3 (SD: 28.0) | 1.8080 (SD: 0.3234) | |||||||
| VARIABLES | Cost_APr | p Value | nPOA | p Value | nPOA_AffectSOIFlag | p Value | nPOA_Cost | p Value | Diff_Cost_Apr | p Value | |
|---|---|---|---|---|---|---|---|---|---|---|---|
| Total Cases | €8752.1 (SD: 1864.4) | 651 (41.4%) | 402 (25.6%) | 173 (11.0%) | €2321.3 (SD: 3164.5) | ||||||
| PREVIOUS DIAGNOSE (PD) | |||||||||||
| PD of Ischemic Cardiopathy | Yes | €9,065.1 (SD: 1,358.0) | 0.069 | 64 (58.7%) | <0.001 | 34 (31.2%) | 0.173 | 13 (11.9%) | 0.751 | €212.1 (SD: 901.2) | 0.712 |
| No | €8,728.7 (SD: 1,895.1) | 587 (40.2%) | 365 (25.2%) | 160 (10.9%) | €258.9 (SD: 1,298.7) | ||||||
| PD of Cardiac Insufficiency | Yes | €10,313.0 (SD: 3,678.6) | <0.001 | 58 (56.3%) | 0.002 | 36 (35.0%) | 0.027 | 19 (18.4%) | 0.021 | €827.9 (SD: 2,979.8) | 0.041 |
| No | €8,642.6 (SD: 1,611.3) | 593 (40.4%) | 366 (24.9%) | 154 (10.5%) | €215.5 (SD: 1,047.7) | ||||||
| PD of Chronic Obstructive Pulmonary Disease | Yes | €9,231.4 (SD: 2,360.9) | 0.003 | 83 (44.6%) | 0.383 | 53 (28.5%) | 0.326 | 28 (15.1%) | 0.079 | €447.4 (SD: 1,888.8) | 0.127 |
| No | €8,687.7 (SD: 1,778.5) | 568 (41.0%) | 349 (25.2%) | 145 (10.5%) | €229.9 (SD: 1,166.8) | ||||||
| PD of Cerebrovascular Disease | Yes | €9,755.3 (SD: 3,483.1) | 0.123 | 16 (55.2%) | 0.133 | 7 (24.1%) | 1.000 | 3 (10.3%) | 1.000 | €116.1 (SD: 403.6) | 0.552 |
| No | €8,733.2 (SD: 1,817.1) | 635 (41.2%) | 395 (25.6%) | 170 (11.0%) | €258.2 (SD: 1,285.6) | ||||||
| PD of Dementia | Yes | €8,729.6 (SD: 1,480.7) | 0.835 | 117 (46.6%) | 0.081 | 75 (29.9%) | 0.097 | 29 (11.6%) | 0.742 | €243.2 (SD: 1,016.2) | 0.867 |
| No | €8,756.4 (SD: 1,929.2) | 534 (40.5%) | 327 (24.8%) | 144 (10.9%) | €258.0 (SD: 1,318.7) | ||||||
| PD of Kidney Disease | Yes | €9,548.9 (SD: 2,239.8) | 0.001 | 104 (58.1%) | <0.001 | 70 (39.1%) | <0.001 | 36 (20.1%) | 0.001 | €589.5 (SD: 1,904.2) | 0.010 |
| No | €8,649.6 (SD: 1,785.8) | 547 (39.3%) | 332 (23.9%) | 137 (9.8%) | €212.7 (SD: 1,163.8) | ||||||
| PD of Diabetes | Yes | €8,838.2 (SD: 2,077.2) | 0.260 | 195 (45.1%) | 0.075 | 129 (29.9%) | 0.020 | 55 (12.7%) | 0.206 | €301.2 (SD: 1,575.4) | 0.383 |
| No | €8,719.4 (SD: 1,776.9) | 456 (40.0%) | 273 (24.0%) | 118 (10.4%) | €238.4 (SD: 1,140.8) | ||||||
| PD of Hypertension | Yes | €8,719.9 (SD: 1,570.7) | 0.003 | 468 (55.5%) | <0.001 | 288 (27.4%) | 0.011 | 119 (11.3%) | 0.320 | €219.1 (SD: 917.3) | 0.002 |
| No | €8,817.2 (SD: 2,348.9) | 183 (35.2%) | 114 (21.9%) | 54 (10.4%) | €329.4 (SD: 1,790.7) | ||||||
| ADVERSE EFFECTS (AE) | |||||||||||
| EA de Delirium | Yes | €9,204.2 (SD: 1,988.4) | <0.001 | 238 (100.0%) | <0.001 | 211 (88.7%) | <0.001 | 67 (28.2%) | <0.001 | €602.2 (SD: 1,775.9) | 0.001 |
| No | €8,671.4 (SD: 1,830.5) | 413 (31.0%) | 191 (14.3%) | 106 (8.0%) | €193.7 (SD: 1,153.0) | ||||||
| EA Cardiac disease | Yes | €10,403.3 (SD: 3,691.5) | <0.001 | 101 (100.0%) | <0.001 | 73 (72.3%) | <0.001 | 55 (54.5%) | <0.001 | €1,653.0 (SD: 3,327.6) | <0.001 |
| No | €8,638.6 (SD: 1,608.4) | 550 (37.4%) | 329 (22.4%) | 118 (8.0%) | €159.6 (SD: 916.48) | ||||||
| AE of Anaemia | Yes | €9,066.5 (SD: 2,216.0) | 0.014 | 188 (100.0%) | <0.001 | 116 (61.7%) | <0.001 | 41 (21.8%) | <0.001 | €387.6 (SD: 1,144.8) | 0.131 |
| No | €8,709.3 (SD: 1,808.1) | 463 (33.5%) | 286 (20.7%) | 132 (9.5%) | €237.7 (SD: 1,291.0) | ||||||
| AE of Urinary Infection | Yes | €9,554.5 (SD: 1,994.2) | 0.005 | 50 (100.0%) | <0.001 | 44 (88.0%) | <0.001 | 24 (48.0%) | <0.001 | €964.1 (SD: 1,639.3) | 0.003 |
| No | €8,725.7 (SD: 1,854.8) | 601 (39.5%) | 358 (23.5%) | 149 (9.8%) | €232.3 (SD: 1,255.1) | ||||||
| Digestive AE | Yes | €10,736.6 (SD: 3,203.8) | 0.005 | 6 (85.7%) | 0.023 | 6 (85.7%) | 0.001 | 3 (42.9%) | 0.033 | €1,572.5 (SD: 3,066.3) | 0.297 |
| No | €8,743.2 (SD: 1,853.2) | 645 (41.2%) | 396 (25.3%) | 170 (10.9%) | €249.7 (SD: 1,260.5) | ||||||
| Respiratory AE | Yes | €11,407.1 (SD: 4,490.2) | <0.001 | 67 (100.0%) | <0.001 | 57 (85.1%) | <0.001 | 49 (73.1%) | <0.001 | €2,794.0 (SD: 4,116.8) | <0.001 |
| No | €8,633.8 (SD: 1,554.8) | 584 (38.8%) | 345 (22.9%) | 124 (8.2%) | €142.5 (SD: 808.5) | ||||||
| AE of Surgical Infection | Yes | €13,439.4 (SD: 8,596.1) | 0.117 | 10 (100.0%) | <0.001 | 6 (60.0%) | 0.022 | 5 (50.0%) | 0.002 | €3,714.5 (SD: 8,227.5) | 0.214 |
| No | €8,722.1 (SD: 1,711.8) | 641 (41.1%) | 396 (25.4%) | 168 (10.8%) | €233.5 (SD: 1,080.8) | ||||||
| AE of Respiratory Infection | Yes | €9,433.1 (SD: 1,862.7) | 0.078 | 23 (100.0%) | <0.001 | 19 (82.6%) | <0.001 | 15 (65.2%) | <0.001 | €1,046.3 (SD: 1,314.9) | 0.008 |
| No | €8,742.0 (SD: 1,863.2) | 628 (40.6%) | 383 (24.7%) | 158 (10.2%) | €243.9 (SD: 1,271.1) | ||||||
| AE of Sepsis | Yes | €9,388.1 (IQ: 8,708.4–10,414.8) | 0.003 | 9 (100.0%) | <0.001 | 7 (77.8%) | 0.002 | 6 (66.7%) | <0.001 | €679.6 (IQ: 0–2,007.3) | <0.001 |
| No | €8,407.6 (IQ: 8,407.6–8,708.4) | 642 (41.1%) | 395 (25.3%) | 167 (10.7%) | 0 (IQ: 0–0) | ||||||
| AE of Shock | Yes | €8,407.6 (IQ: 8,407.6–12,218.8) | 0.635 | 3 (100.0%) | 0.071 | 0 (0.0%) | 0.412 | 0 (0.0%) | 0.705 | 0 (IQ: 0–0) | 0.543 |
| No | €8,407.6 (IQ: 8,407.6–8,708.4) | 648 (41.3%) | 402 (25.6%) | 173 (11.0%) | 0 (IQ: 0–0) | ||||||
| AE of pulmonary embolism | Yes | €8,708.4 (IQ: 8,407.6–10,414.8) | 0.349 | 5 (100.0%) | 0.012 | 4 (80.0%) | 0.017 | 3 (60.0%) | 0.011 | €983.6 (IQ: 0–2,990.9) | <0.001 |
| No | €8,407.6 (IQ: 8,407.6–8,708.4) | 646 (41.3%) | 398 (25.4%) | 170 (10.9%) | 0 (IQ: 0–0) | ||||||
| EA of Surgical haemorrhage | Yes | €8,708.4 (IQ: 8,407.6–10,414.8) | 0.187 | 9 (100.0%) | <0.001 | 4 (44.4%) | 0.176 | 2 (22.2%) | 0.260 | 0 (IQ: 0–0) | 0.255 |
| No | €8,407.6 (IQ: 8,407.6–8,708.4) | 642 (41.1%) | 398 (25.5%) | 171 (10.9%) | 0 (IQ: 0–0) | ||||||
| EA exitus | Yes | €10,987.4 (SD: 4,816.9) | <0.001 | 54 (81.8%) | <0.001 | 43 (65.2%) | <0.001 | 34 (51.5%) | <0.001 | €2,193.0 (SD: 4,373.2) | <0.001 |
| No | €8,654.1 (SD: 1,548.2) | 597 (39.7%) | 359 (23.9%) | 139 (9.2%) | €170.7 (SD: 835.6) | ||||||
© 2018 by the authors. Licensee MDPI, Basel, Switzerland. This article is an open access article distributed under the terms and conditions of the Creative Commons Attribution (CC BY) license (http://creativecommons.org/licenses/by/4.0/).
Share and Cite
Cuesta-Peredo, D.; Tarazona-Santabalbina, F.J.; Borras-Mañez, C.; Belenguer-Varea, A.; Avellana-Zaragoza, J.A.; Arteaga-Moreno, F. Estimate of the Costs Caused by Adverse Effects in Hospitalised Patients Due to Hip Fracture: Design of the Study and Preliminary Results. Geriatrics 2018, 3, 7. https://doi.org/10.3390/geriatrics3010007
Cuesta-Peredo D, Tarazona-Santabalbina FJ, Borras-Mañez C, Belenguer-Varea A, Avellana-Zaragoza JA, Arteaga-Moreno F. Estimate of the Costs Caused by Adverse Effects in Hospitalised Patients Due to Hip Fracture: Design of the Study and Preliminary Results. Geriatrics. 2018; 3(1):7. https://doi.org/10.3390/geriatrics3010007
Chicago/Turabian StyleCuesta-Peredo, David, Francisco Jose Tarazona-Santabalbina, Carlos Borras-Mañez, Angel Belenguer-Varea, Juan Antonio Avellana-Zaragoza, and Francisco Arteaga-Moreno. 2018. "Estimate of the Costs Caused by Adverse Effects in Hospitalised Patients Due to Hip Fracture: Design of the Study and Preliminary Results" Geriatrics 3, no. 1: 7. https://doi.org/10.3390/geriatrics3010007
APA StyleCuesta-Peredo, D., Tarazona-Santabalbina, F. J., Borras-Mañez, C., Belenguer-Varea, A., Avellana-Zaragoza, J. A., & Arteaga-Moreno, F. (2018). Estimate of the Costs Caused by Adverse Effects in Hospitalised Patients Due to Hip Fracture: Design of the Study and Preliminary Results. Geriatrics, 3(1), 7. https://doi.org/10.3390/geriatrics3010007