
Study on the Discrimination of Possible Error Sources That Might Affect the Quality of Volatile Organic Compounds Signature in Dairy Cattle Using an Electronic Nose

 , , , ,
Abstract
Simple Summary
Abstract
1. Introduction
2. Materials and Methods
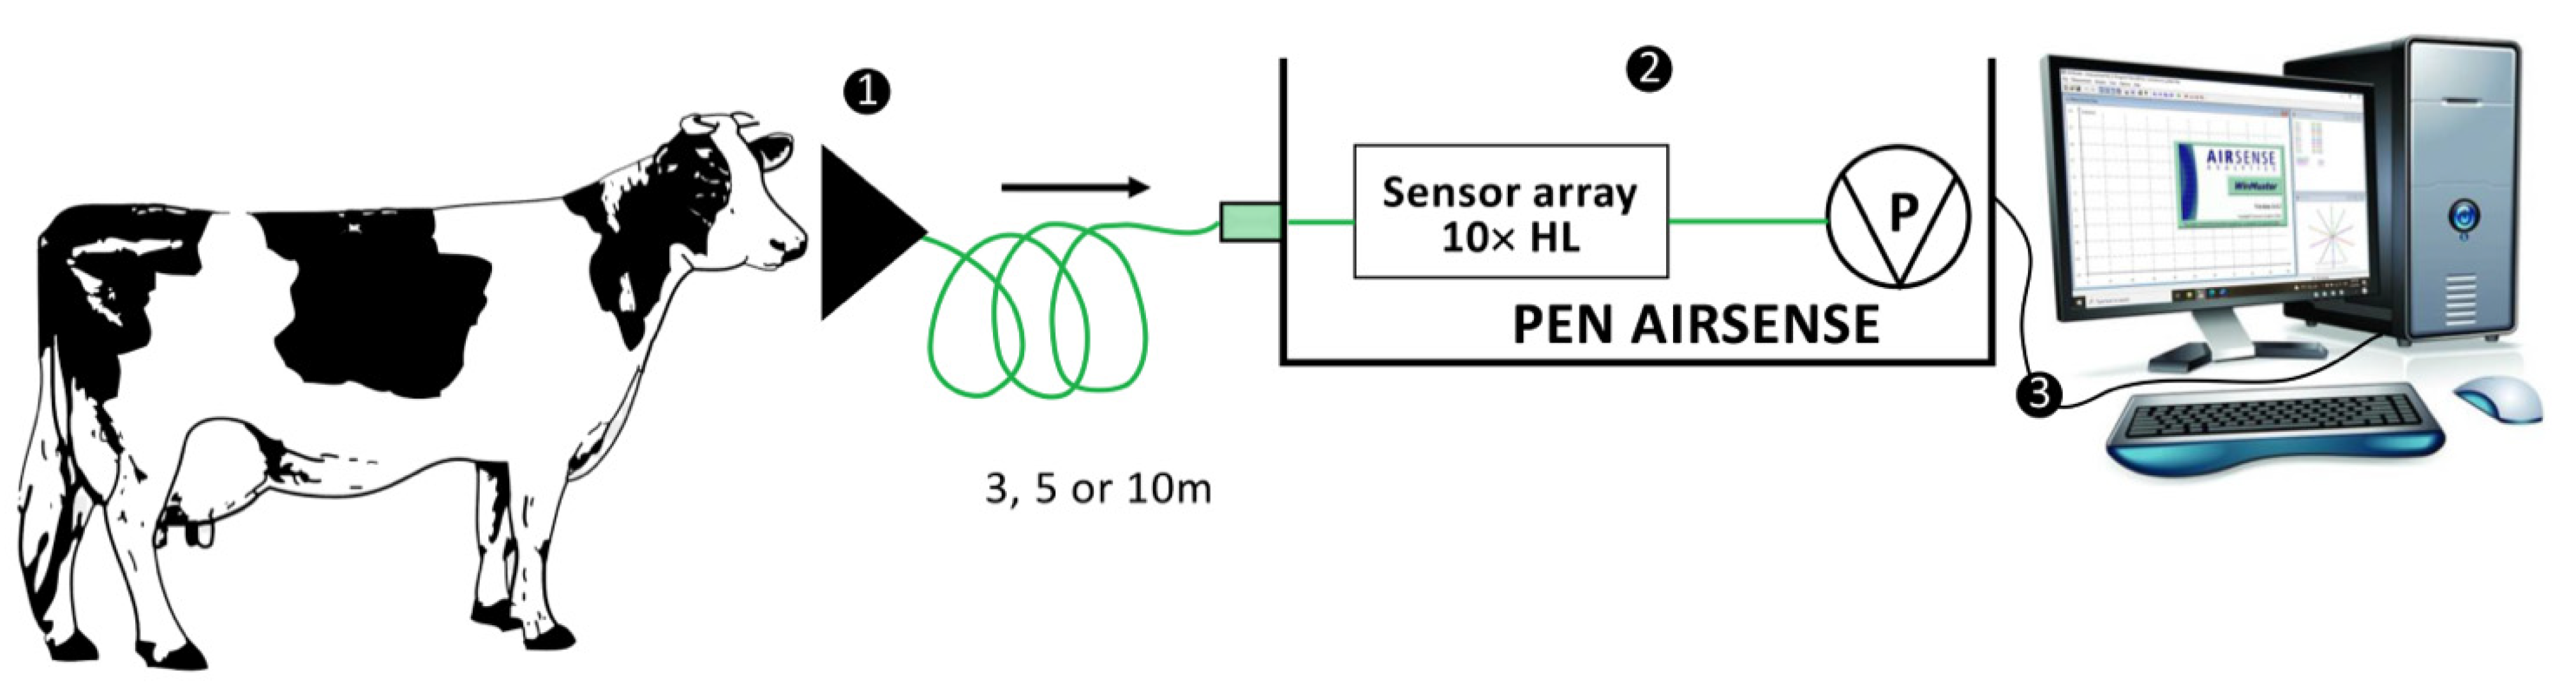
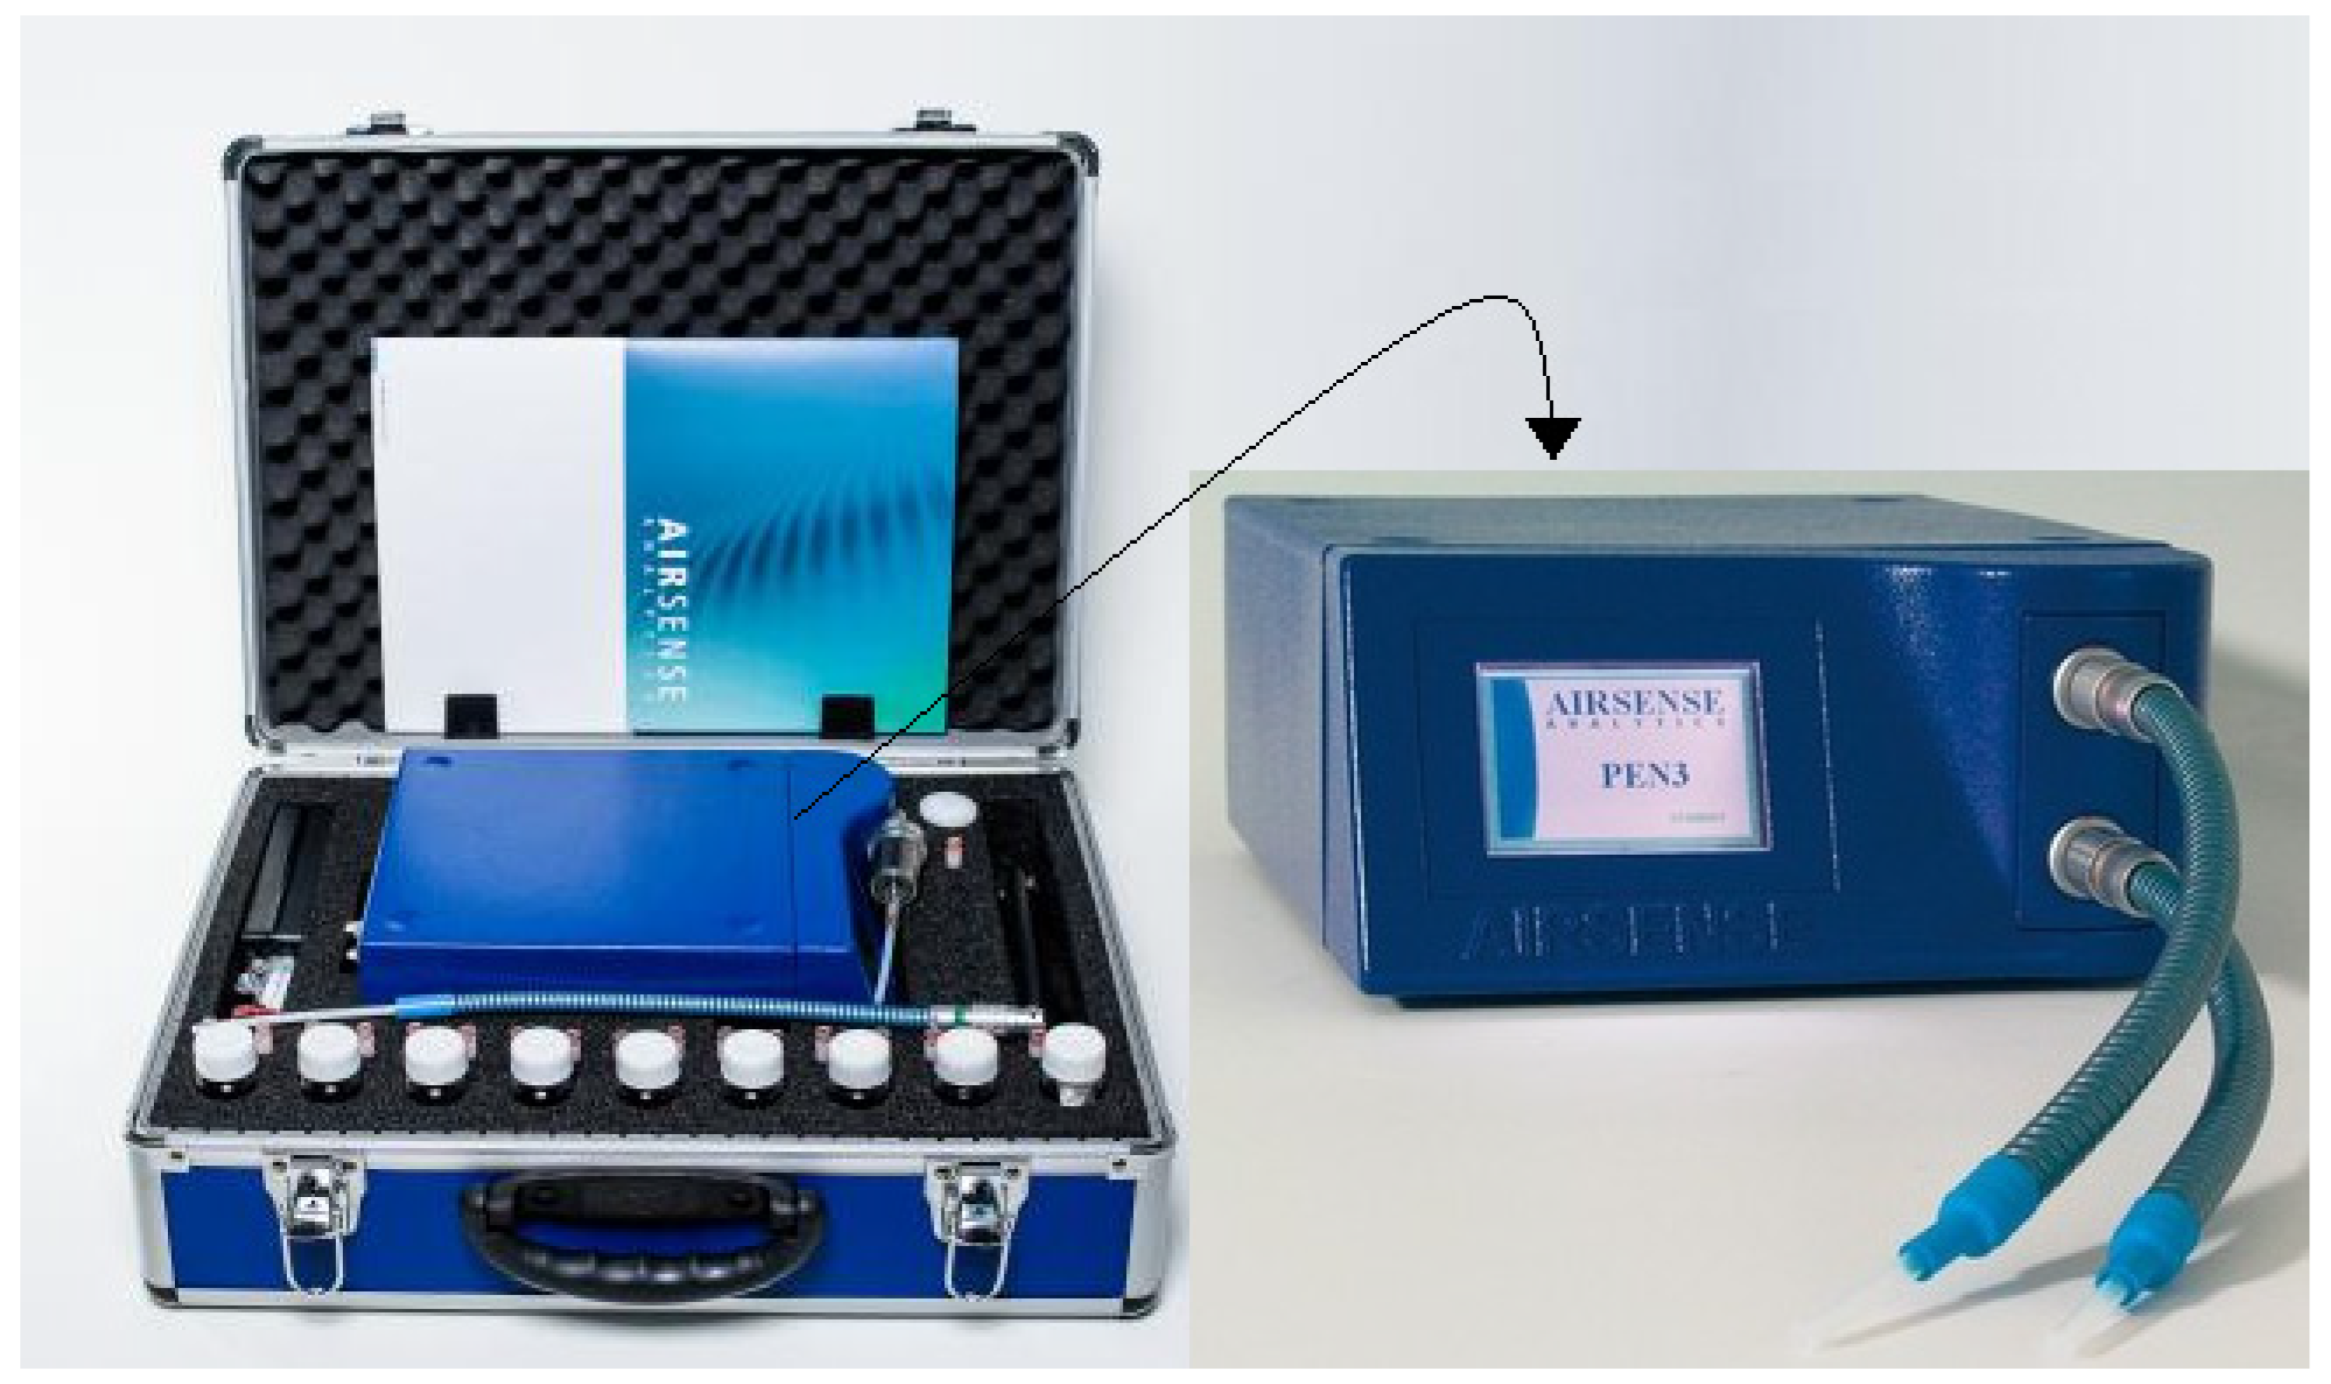
2.1. Instrumentation and Sampling Measurements
2.2. Animals, Diet and Housing
- -
- Group I included six lactating cows (n = 6), who were fed twice daily (6:00 am and 4:30 pm) on a conventional lactation diet (LD) (Table 1). In this group, cows were chosen randomly from healthy lactating cows, regardless of their age or days in milk (DIM).
- -
- Group II included five (n = 5) non-lactating late pregnant cows (7 to 9 months of pregnancy), which were fed twice daily (6:00 am and 4:30 pm) on a conventional far-off diet (FD) (Table 1). In this group, cows were randomly chosen from healthy non-lactating cows.
2.3. Type of VOC Determination
2.3.1. Environmental Background VOC Determination
2.3.2. Feed Headspace VOC Determination
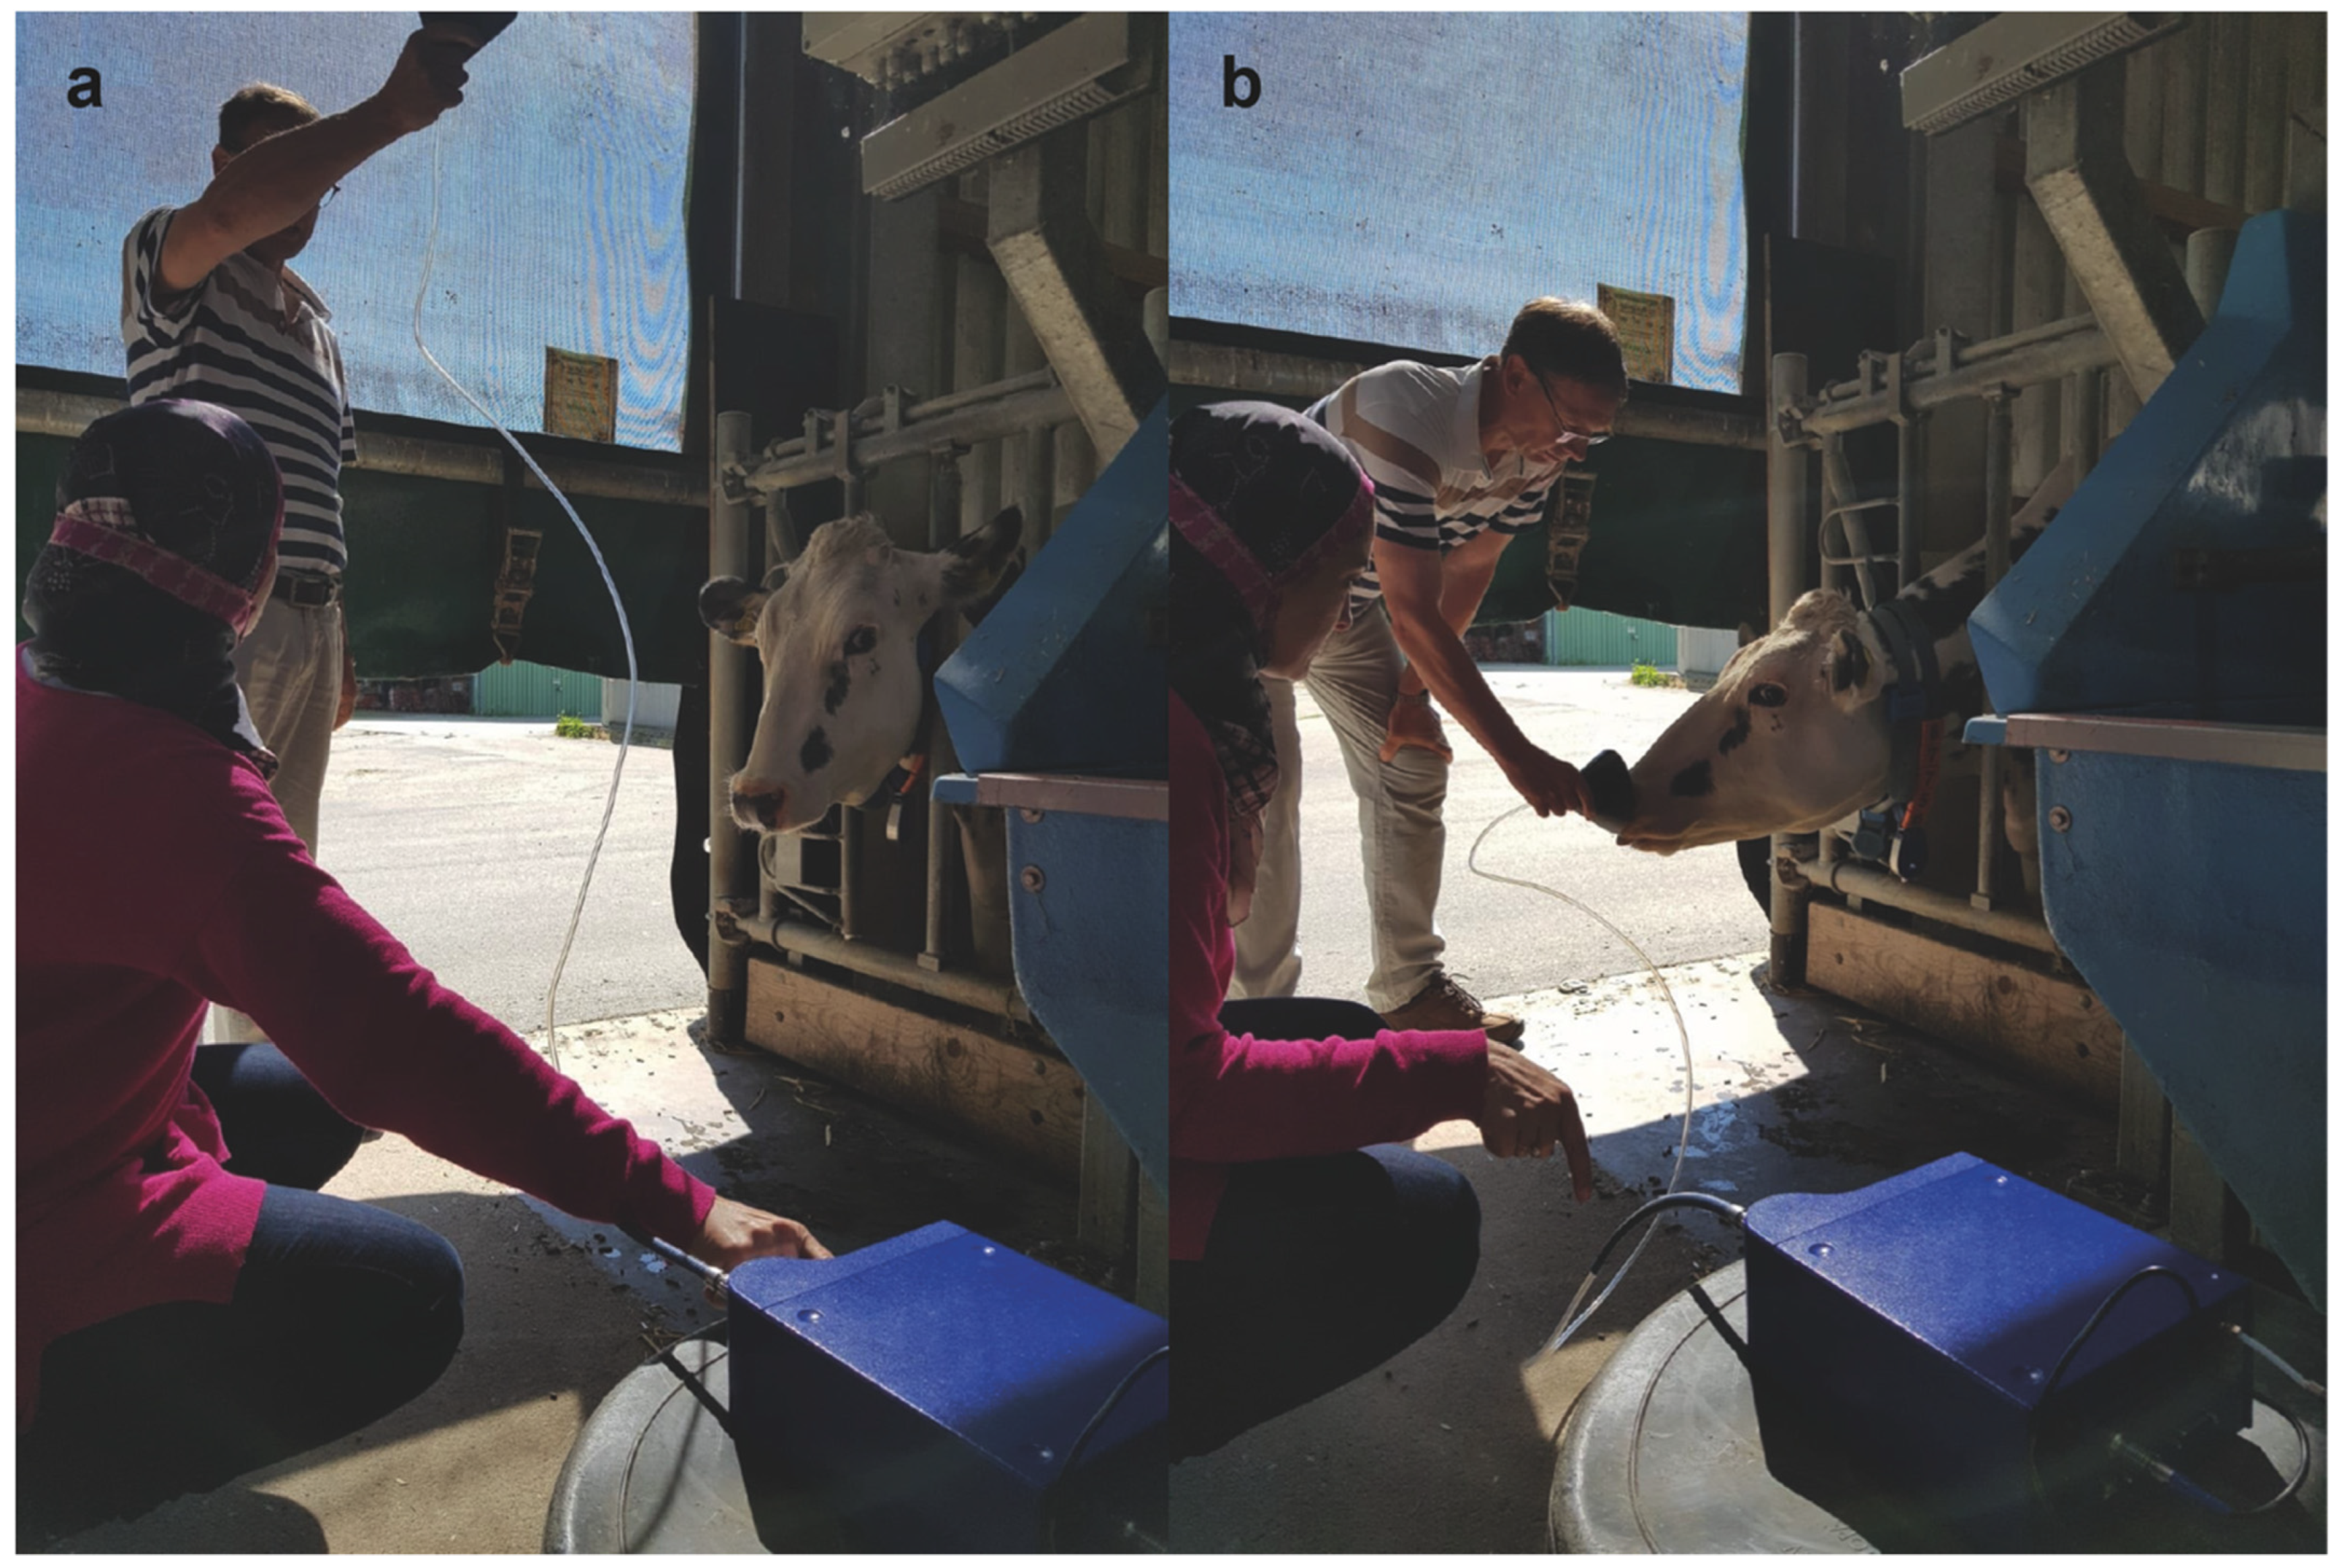
2.3.3. Exhaled Breath VOC Determination
2.4. Response to the Sensor and Data Analysis
2.5. Ethics Statement
3. Results
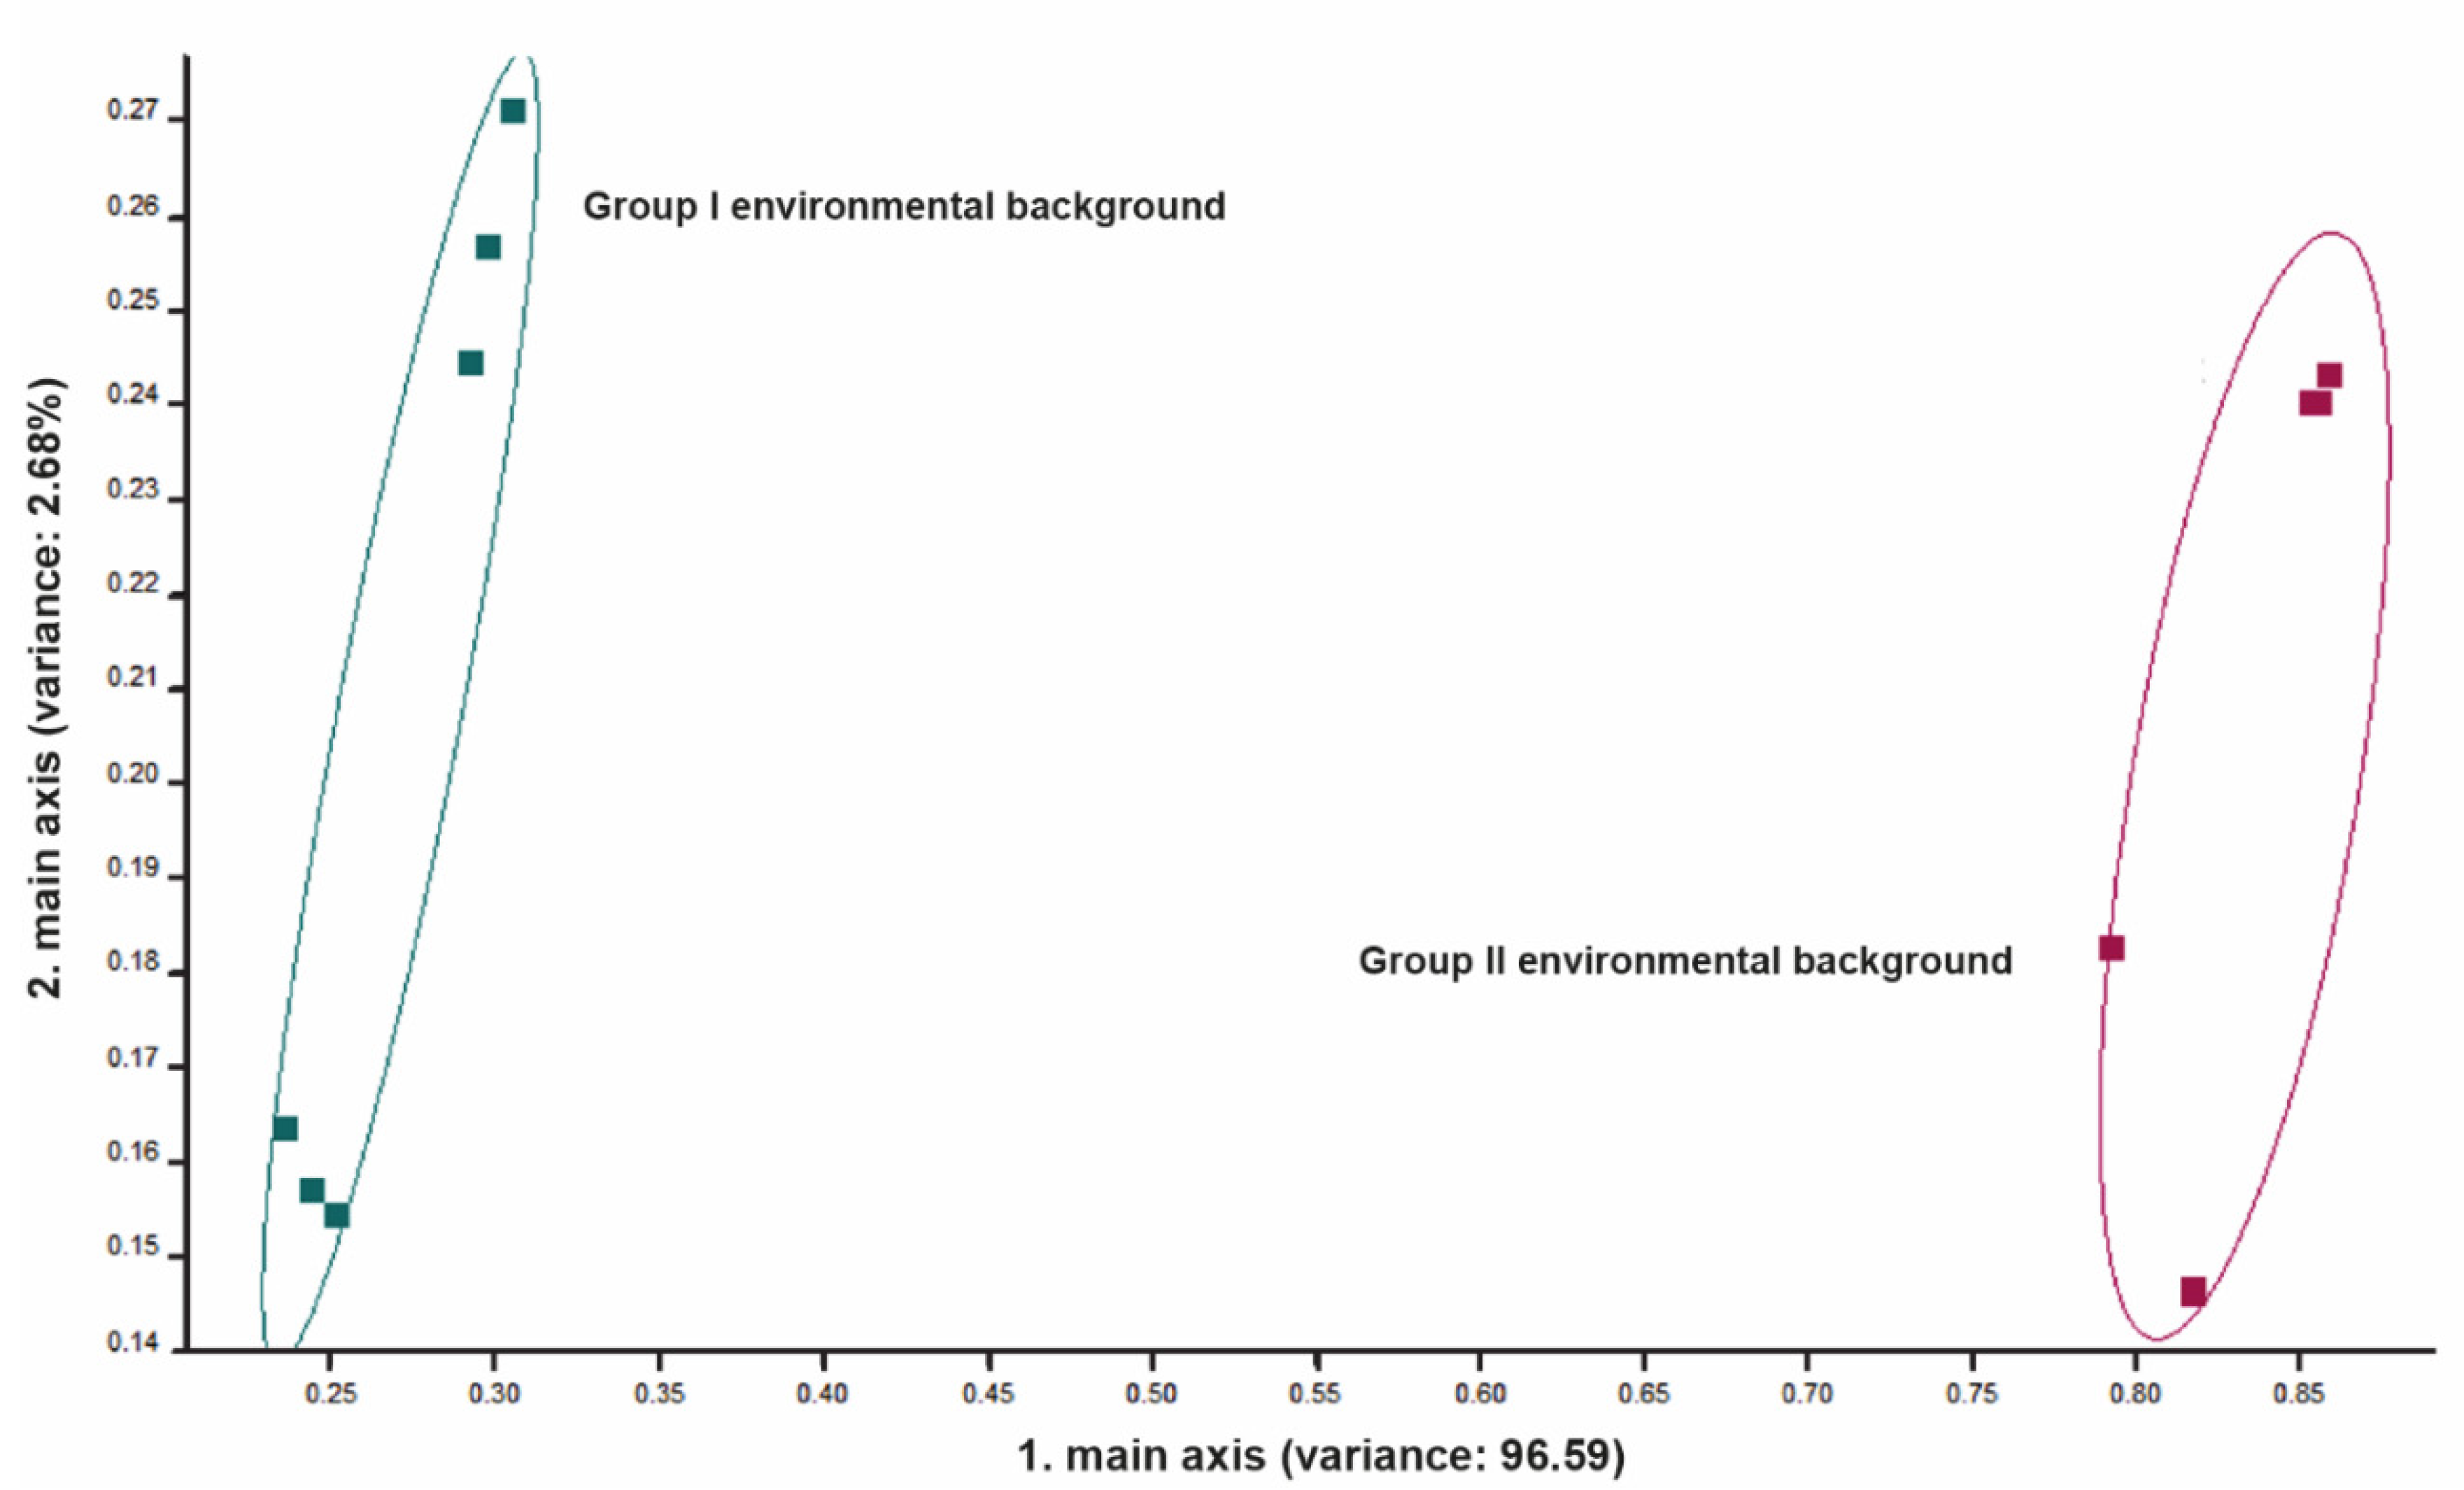
3.1. Environmental Background
3.2. Feed Headspace
3.3. Exhaled Breath
4. Discussion
5. Conclusions
Author Contributions
Funding
Institutional Review Board Statement
Informed Consent Statement
Data Availability Statement
Acknowledgments
Conflicts of Interest
References
- Cattle Eye: Unleash Your Cow’s Potential with Autonomous Video Monitoring. Home—CattleEye. Available online: https://cattleeye.com (accessed on 5 May 2022).
- Pavlou, A.K.; Turner, A.P.F. Sniffing out the truth: Clinical diagnosis using the electronic nose. Clin. Chem. Lab. Med. (CCLM) 2000, 38, 99–112. [Google Scholar] [CrossRef]
- Bartlett, P.N.; Elliott, J.M.; Gardner, J.W. Applications of and developments in machine olfaction. Ann. Di Chimica. 1997, 87, 33–44. [Google Scholar]
- Pearce, T.C. Computational parallels between the biological olfactory pathway and its analogue. The Electronic Nose; Part I. Biological olfaction. BioSystems 1997, 41, 43–67. [Google Scholar] [CrossRef]
- Pearce, T.C. Computational parallels between the biological olfactory pathway and its analogue. The Electronic Nose’: Part II. Sensor-based machine olfaction. Biosystems 1997, 41, 69–90. [Google Scholar] [CrossRef]
- Gardner, J.W.; Bartlett, P.N. A brief history of electronic noses. Sens. Actuators B. 1994, 18–19, 211–220. [Google Scholar] [CrossRef]
- Gardner, J.W.; Hines, E.L.; Molinier, F.; Bartlett, P.N.; Mottram, T.T. Prediction of health of dairy cattle from breath samples using neural network with parametric model of dynamic response of array of semiconducting gas sensors. IEE Proc.-Sci. Meas. Technol. 1999, 146, 102–106. [Google Scholar] [CrossRef]
- Fend, R.; Geddes, R.; Lesellier, S.; Vordermeier, H.-M.; Corner, L.A.L.; Gormley, E.; Costello, E.; Hewinson, R.G.; Marlin, D.J.; Woodman, A.C.; et al. Use of an electronic nose to diagnose Mycobacterium Bovis infection in badgers and cattle. J. Clin. Microbiol. 2005, 43, 1745–1751. [Google Scholar] [CrossRef]
- Yuan, H.; Xiao, C.; Zhan, W.; Wang, Y.; Shi, C.; Ye, H.; Jiang, K.; Ye, Z.; Zhou, C.; Wen, Y.; et al. Target Detection, Positioning and Tracking Using New UAV Gas Sensor Systems: Simulation and Analysis. J. Intell. Robot. Syst. 2019, 94, 871–882. [Google Scholar] [CrossRef]
- Wei, G.; Gardner, J.W.; Cole, M.; Xing, Y. Multi-Sensor Module for a Mobile Robot Operating in Harsh Environments. In Proceedings of the 2016 IEEE SENSORS, Orlando, FL, USA, 30 October–3 November 2016; pp. 1–3. [Google Scholar] [CrossRef]
- Xing, Y.; Vincent, T.A.; Cole, M.; Gardner, J.W.; Fan, H.; Bennetts, V.H.; Schaffernicht, E.; Lilienthal, A.J. Mobile Robot Multi-Sensor Unit for Unsupervised Gas Discrimination in Uncontrolled Environments. In Proceedings of the 2017 IEEE SENSORS, Glasgow, UK, 29 October–1 November 2017; pp. 1–3. [Google Scholar] [CrossRef]
- Xing, Y.; Vincent, T.A.; Cole, M.; Gardner, J.W. Real-Time Thermal Modulation of High Bandwidth MOX Gas Sensors for Mobile Robot Applications. Sensors 2019, 19, 1180. [Google Scholar] [CrossRef]
- Herrero, J.L.; Lozano, J.; Santos, J.P.; Suárez, J.I. On-Line Classification of Pollutants in Water Using Wireless Portable Electronic Noses. Chemosphere 2016, 152, 107–116. [Google Scholar] [CrossRef]
- Blanco-Rodríguez, A.; Camara, V.F.; Campo, F.; Becherán, L.; Durán, A.; Vieira, V.D.; de Melo, H.; Garcia-Ramirez, A.R. Development of an Electronic Nose to Characterize Odours Emitted from Different Stages in a Wastewater Treatment Plant. Water Res. 2018, 134, 92–100. [Google Scholar] [CrossRef] [PubMed]
- Cho, J.; Kim, Y.; Na, K.; Jeon, G. Wireless Electronic Nose System for Real-Time Quantitative Analysis of Gas Mixtures Using Micro-Gas Sensor Array and Neuro-Fuzzy Network. Sens. Actuators B Chem. 2008, 134, 104–111. [Google Scholar] [CrossRef]
- Zhang, D.; Liu, J.; Jiang, C.; Liu, A.; Xia, B. Quantitative Detection of Formaldehyde and Ammonia Gas via Metal Oxide-Modified Graphene-Based Sensor Array Combining with Neural Network Model. Sens. Actuators B Chem. 2017, 240, 55–65. [Google Scholar] [CrossRef]
- Zhi, R.; Zhao, L.; Zhang, D. A Framework for the Multi-Level Fusion of Electronic Nose and Electronic Tongue for Tea Quality Assessment. Sensors 2017, 17, 1007. [Google Scholar] [CrossRef] [PubMed]
- Dai, Y.; Zhi, R.; Zhao, L.; Gao, H.; Shi, B.; Wang, H. Longjing Tea Quality Classification by Fusion of Features Collected from E-Nose. Chemom. Intell. Lab. Syst. 2015, 144, 63–70. [Google Scholar] [CrossRef]
- Gu, D.-C.; Liu, W.; Yan, Y.; Wei, W.; Gan, J.; Lu, Y.; Jiang, Z.-L.; Wang, X.-C.; Xu, C.-H. A Novel Method for Rapid Quantitative Evaluating Formaldehyde in Squid Based on Electronic Nose. LWT 2019, 101, 382–388. [Google Scholar] [CrossRef]
- Wijaya, D.R.; Sarno, R. Mobile Electronic Nose Architecture for Beef Quality Detection Based on Internet of Things. Technology 2015, 2, 10. [Google Scholar]
- Rusinek, R.; Kmiecik, D.; Gawrysiak-Witulska, M.; Malaga-Toboła, U.; Tabor, S.; Findura, P.; Siger, A.; Gancarz, M. Identification of the Olfactory Profile of Rapeseed Oil as a Function of Heating Time and Ratio of Volume and Surface Area of Contact with Oxygen Using an Electronic Nose. Sensors 2021, 21, 303. [Google Scholar] [CrossRef]
- Chen, C.-Y.; Lin, W.-C.; Yang, H.-Y. Diagnosis of Ventilator-Associated Pneumonia Using Electronic Nose Sensor Array Signals: Solutions to Improve the Application of Machine Learning in Respiratory Research. Respir. Res. 2020, 21, 45. [Google Scholar] [CrossRef]
- Sánchez, C.; Santos, J.; Lozano, J. Use of Electronic Noses for Diagnosis of Digestive and Respiratory Diseases through the Breath. Biosensors 2019, 9, 35. [Google Scholar] [CrossRef]
- Dragonieri, S.; Pennazza, G.; Carratu, P.; Resta, O. Electronic Nose Technology in Respiratory Diseases. Lung 2017, 195, 157–165. [Google Scholar] [CrossRef] [PubMed]
- Tiele, A.; Wicaksono, A.; Ayyala, S.K.; Covington, J.A. Development of a Compact, IoT-Enabled Electronic Nose for Breath Analysis. Electronics 2020, 9, 84. [Google Scholar] [CrossRef]
- Saidi, T.; Zaim, O.; Moufid, M.; El Bari, N.; Ionescu, R.; Bouchikhi, B. Exhaled Breath Analysis Using Electronic Nose and Gas Chromatography–Mass Spectrometry for Non-Invasive Diagnosis of Chronic Kidney Disease, Diabetes Mellitus and Healthy Subjects. Sens. Actuators B Chem. 2018, 257, 178–188. [Google Scholar] [CrossRef]
- Lane, A.J.P.; Wathes, D.C. An electronic nose to detect changes in perineal odors associated with estrus in the cow. J. Dairy Sci. 1998, 81, 2145–2150. [Google Scholar] [CrossRef]
- Asmaa, A.; Fekry, H.; Ehab, M.; Hadeer, M. Biophysical analysis of emanated pheromonal odor changes in cows using electronic nose technology. Anim. Biol. 2019, 21, 11–15. [Google Scholar]
- Wiegerinck, W.A.J.J.; Setkus, A.; Buda, V.; Borg-Karlson, A.K.; Mozuraitis, R.; De Gee, A. BOVINOSE: Pheromone-based sensor system for detecting estrus in dairy cows. Procedia Comput. Sci. 2011, 7, 340–342. [Google Scholar] [CrossRef][Green Version]
- Turner, C.; Knobloch, H.; Richards, J.; Richards, P.; Mottram, T.T.; Marlin, D.; Chambers, M.A. Development of a device for sampling cattle breath. Biosyst. Eng. 2012, 112, 75–81. [Google Scholar] [CrossRef]
- Sanderink, F.E.; Gerritsen, J.W.; Koerkamp, P.W.G.; van Mourik, S. Automatic detection of oestrus cows via breath sampling with an electronic nose: A pilot study. Biosyst. Eng. 2017, 156, 1–6. [Google Scholar] [CrossRef]
- Elliott-Martin, R.J.; Mottram, T.T.; Gardner, J.W.; Hobbs, P.J.; Bartlett, P.N. Preliminary investigation of breath sampling as a monitor of health in dairy cattle. J. Agric. Eng. Res. 1997, 67, 267–275. [Google Scholar] [CrossRef]
- Kuchmenko, T.; Shuba, A.; Umarkhanov, R.; Chernitskiy, A. Portable Electronic Nose for Analyzing the Smell of Nasal Secretions in Calves: Toward Noninvasive Diagnosis of Infectious Bronchopneumonia. Vet. Sci. 2021, 8, 74. [Google Scholar] [CrossRef]
- Haddadi, S.; Koziel, J.A.; Engelken, T.J. Breath VOC biomarkers of cattle diseases—A review. Anal. Chim. Acta. 2022, 1206, 339565. [Google Scholar] [CrossRef] [PubMed]
- Wu, L.; Koerkamp, P.W.G.; Ogink, N. Uncertainty assessment of the breath methane concentration method to determine methane production of dairy cows. J. Dairy Sci. 2018, 101, 1554–1564. [Google Scholar] [CrossRef] [PubMed]
- Ali, A.; Ali, M. A device used for Estrus detection using electronic nose technology during milking. Academy of Scientific Research and Technology. Egypt Patent No: 29568/2019, 31 December 2019. [Google Scholar]
- Milking Machine Electronic Nose Technology. WO2010099800A2—Milking Machine Electronic Nose Technology—Google Patents. Available online: https://patents.google.com/patent/WO2010099800A2/ (accessed on 5 May 2022).
- Tabachnick, B.G.; Fidell, L.S.; Ullman, J.B. Using Multivariate Statistics; Pearson: Boston, MA, USA, 2007; Volume 5, pp. 481–498. Available online: https://www.pearsonhighered.com/assets/preface/0/1/3/4/0134790545.pdf (accessed on 5 May 2022).
- Jolliffe, I.T.; Cadima, J. Principal component analysis: A review and recent developments. Philos. Trans. R. Soc. A Math. Phys. Eng. Sci. 2016, 374, 20150202. [Google Scholar] [CrossRef]
- Alban, L.; Agger, J.F.; Lawson, L.G. Lameness in tied Danish dairy cattle: The possible influence of housing systems, management, milk yield, and prior incidents of lameness. Prev. Vet. Med. 1996, 29, 135–149. [Google Scholar] [CrossRef]
- De Roos, A.P.W.; Van Den Bijgaart, H.J.C.M.; Hørlyk, J.; De Jong, G. Screening for subclinical ketosis in dairy cattle by Fourier transform infrared spectrometry. J. Dairy Sci. 2007, 90, 1761–1766. [Google Scholar] [CrossRef]
- Rao, T.K.S.; Kumar, N.; Kumar, P.; Chaurasia, S.; Patel, N.B. Heat detection techniques in cattle and buffalo. Vet. World 2013, 6, 363–369. [Google Scholar] [CrossRef]
- Schnabel, R.M.; Boumans, M.L.L.; Smolinska, A.; Stobberingh, E.E.; Kaufmann, R.; Roekaerts, P.M.H.J.; Bergmans, D.C.J.J. Electronic nose analysis of exhaled breath to diagnose ventilator-associated pneumonia. Respir. Med. 2015, 109, 1454–1459. [Google Scholar] [CrossRef]
- Scarlata, S.; Pennazza, G.; Santonico, M.; Pedone, C.; Antonelli Incalzi, R. Exhaled breath analysis by electronic nose in respiratory diseases. Expert Rev. Mol. Diagn. 2015, 15, 933–956. [Google Scholar] [CrossRef]
- Horvath, I.; Lazar, Z.; Gyulai, N.; Kollai, M.; Losonczy, G. Exhaled biomarkers in lung cancer. Eur. Respir. J. 2009, 34, 261–275. [Google Scholar] [CrossRef]
- Dobbelaar, P.; Mottram, T.; Nyabadza, C.; Hobbs, P.; Elliott-Martin, R.J.; Schukken, Y.H. Detection of ketosis in dairy cows by analysis of exhaled breath. Vet. Q. 1996, 18, 151–152. [Google Scholar] [CrossRef]
- Oertel, P.; Küntzel, A.; Reinhold, P.; Köhler, H.; Schubert, J.K.; Kolb, J.; Miekisch, W. Continuous real-time breath analysis in ruminants: Effect of eructation on exhaled VOC profiles. J. Breath Res. 2018, 12, 036014. [Google Scholar] [CrossRef] [PubMed]
- Ricci, P.; Rooke, J.A.; Nevison, I.; Waterhouse, A. Methane emissions from beef and dairy cattle: Quantifying the effect of physiological stage and diet characteristics. J. Anim. Sci. 2013, 91, 5379–5389. [Google Scholar] [CrossRef] [PubMed]
- Lassey, K.R.; Ulyatt, M.J.; Martin, R.J.; Walker, C.F.; Shelton, I.D. Methane emissions measured directly from grazing livestock in New Zealand. Atmos. Environ. 1997, 31, 2905–2914. [Google Scholar] [CrossRef]
- Holter, J.B.; Young, A.J. Methane prediction in dry and lactating Holstein cows. J. Dairy Sci. 1992, 75, 2165–2175. [Google Scholar] [CrossRef]
- Moraes, L.E.; Strathe, A.B.; Fadel, J.G.; Casper, D.P.; Kebreab, E. Prediction of enteric methane emissions from cattle. Glob. Chang. Biol. 2014, 20, 2140–2148. [Google Scholar] [CrossRef]
- Jonker, A.; Molano, G.; Koolaard, J.; Muetzel, S. Methane emissions from lactating and non-lactating dairy cows and growing cattle fed fresh pasture. Anim. Prod. Sci. 2016, 57, 643–648. [Google Scholar] [CrossRef]
- Ramírez-Restrepo, C.A.; Clark, H.; Muetzel, S. Methane emissions from young and mature dairy cattle. Anim. Prod. Sci. 2015, 56, 1897–1905. [Google Scholar] [CrossRef]
- Münger, A.; Kreuzer, M. Methane emission as determined in contrasting dairy cattle breeds over the reproduction cycle. Int. Congr. Ser. 2006, 1293, 119–122. [Google Scholar] [CrossRef]


| Lactation Diet (LD) | Far-Off Diet (FD) | ||
|---|---|---|---|
| Feed Constitute | Mass (kg, Organic Matter) | Feed Constitute | Mass (kg, Organic Matter) |
| Gras silage | 5.00 | Gras silage | 5.00 |
| Gras silage | 7.00 | Gras silage | 7.00 |
| Corn silage | 26.00 | Corn silage | 15.00 |
| Barley straw | 1.00 | Barley straw | 1.50 |
| Concentrate | 6.00 | Concentrate | 3.00 |
| Rapeseed extraction meal | 1.20 | Rapeseed extraction meal | 0.5 |
| Wheat | 0.46 | Wheat | 1.00 |
| Soybean extraction meal | 0.46 | Hay | 1.00 |
| Corn | 1.64 | Minerals | 0.22 |
| Minerals | 0.16 | ||
| Lime | 0.09 | ||
Publisher’s Note: MDPI stays neutral with regard to jurisdictional claims in published maps and institutional affiliations. |
© 2022 by the authors. Licensee MDPI, Basel, Switzerland. This article is an open access article distributed under the terms and conditions of the Creative Commons Attribution (CC BY) license (https://creativecommons.org/licenses/by/4.0/).
Share and Cite
Ali, A.S.; Jacinto, J.G.P.; Mϋnchemyer, W.; Walte, A.; Kuhla, B.; Gentile, A.; Abdu, M.S.; Kamel, M.M.; Ghallab, A.M. Study on the Discrimination of Possible Error Sources That Might Affect the Quality of Volatile Organic Compounds Signature in Dairy Cattle Using an Electronic Nose. Vet. Sci. 2022, 9, 461. https://doi.org/10.3390/vetsci9090461
Ali AS, Jacinto JGP, Mϋnchemyer W, Walte A, Kuhla B, Gentile A, Abdu MS, Kamel MM, Ghallab AM. Study on the Discrimination of Possible Error Sources That Might Affect the Quality of Volatile Organic Compounds Signature in Dairy Cattle Using an Electronic Nose. Veterinary Sciences. 2022; 9(9):461. https://doi.org/10.3390/vetsci9090461
Chicago/Turabian StyleAli, Asmaa S., Joana G. P. Jacinto, Wolf Mϋnchemyer, Andreas Walte, Björn Kuhla, Arcangelo Gentile, Mohamed S. Abdu, Mervat M. Kamel, and Abdelrauf Morsy Ghallab. 2022. "Study on the Discrimination of Possible Error Sources That Might Affect the Quality of Volatile Organic Compounds Signature in Dairy Cattle Using an Electronic Nose" Veterinary Sciences 9, no. 9: 461. https://doi.org/10.3390/vetsci9090461
APA StyleAli, A. S., Jacinto, J. G. P., Mϋnchemyer, W., Walte, A., Kuhla, B., Gentile, A., Abdu, M. S., Kamel, M. M., & Ghallab, A. M. (2022). Study on the Discrimination of Possible Error Sources That Might Affect the Quality of Volatile Organic Compounds Signature in Dairy Cattle Using an Electronic Nose. Veterinary Sciences, 9(9), 461. https://doi.org/10.3390/vetsci9090461