

A Review of Radiomics and Artificial Intelligence and Their Application in Veterinary Diagnostic Imaging
Abstract
Simple Summary
Abstract
1. Introduction
2. Radiomics and AI
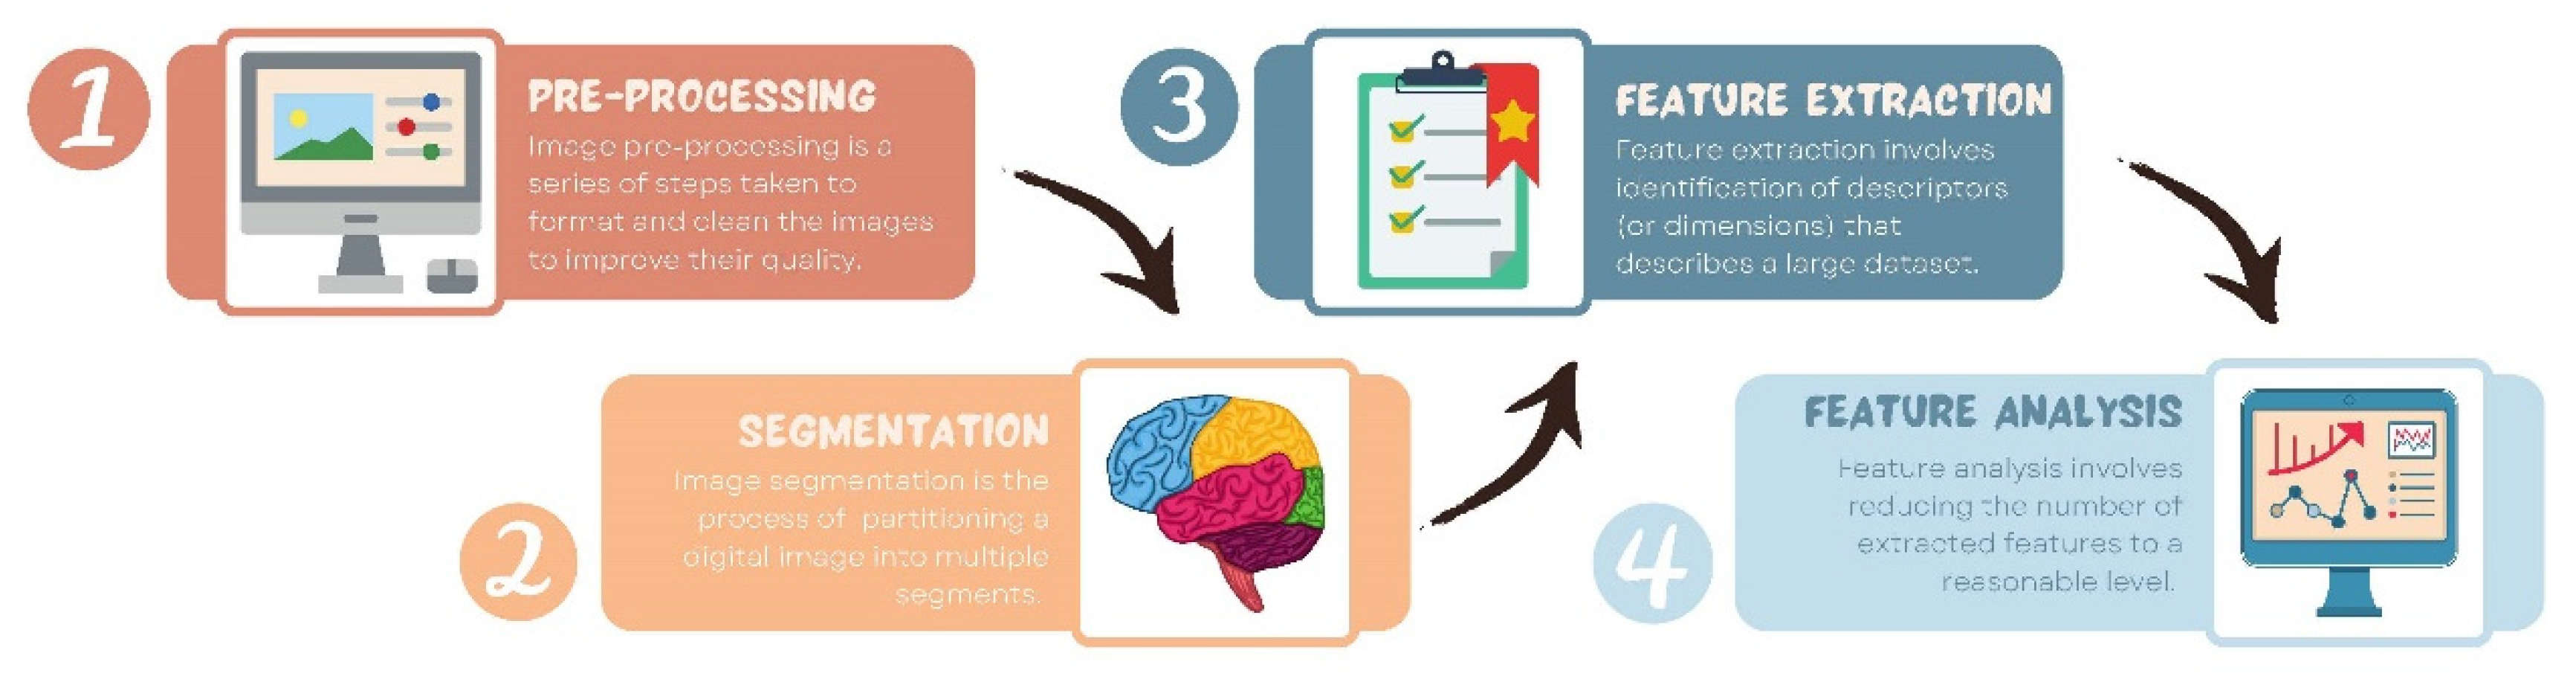
2.1. Radiomics
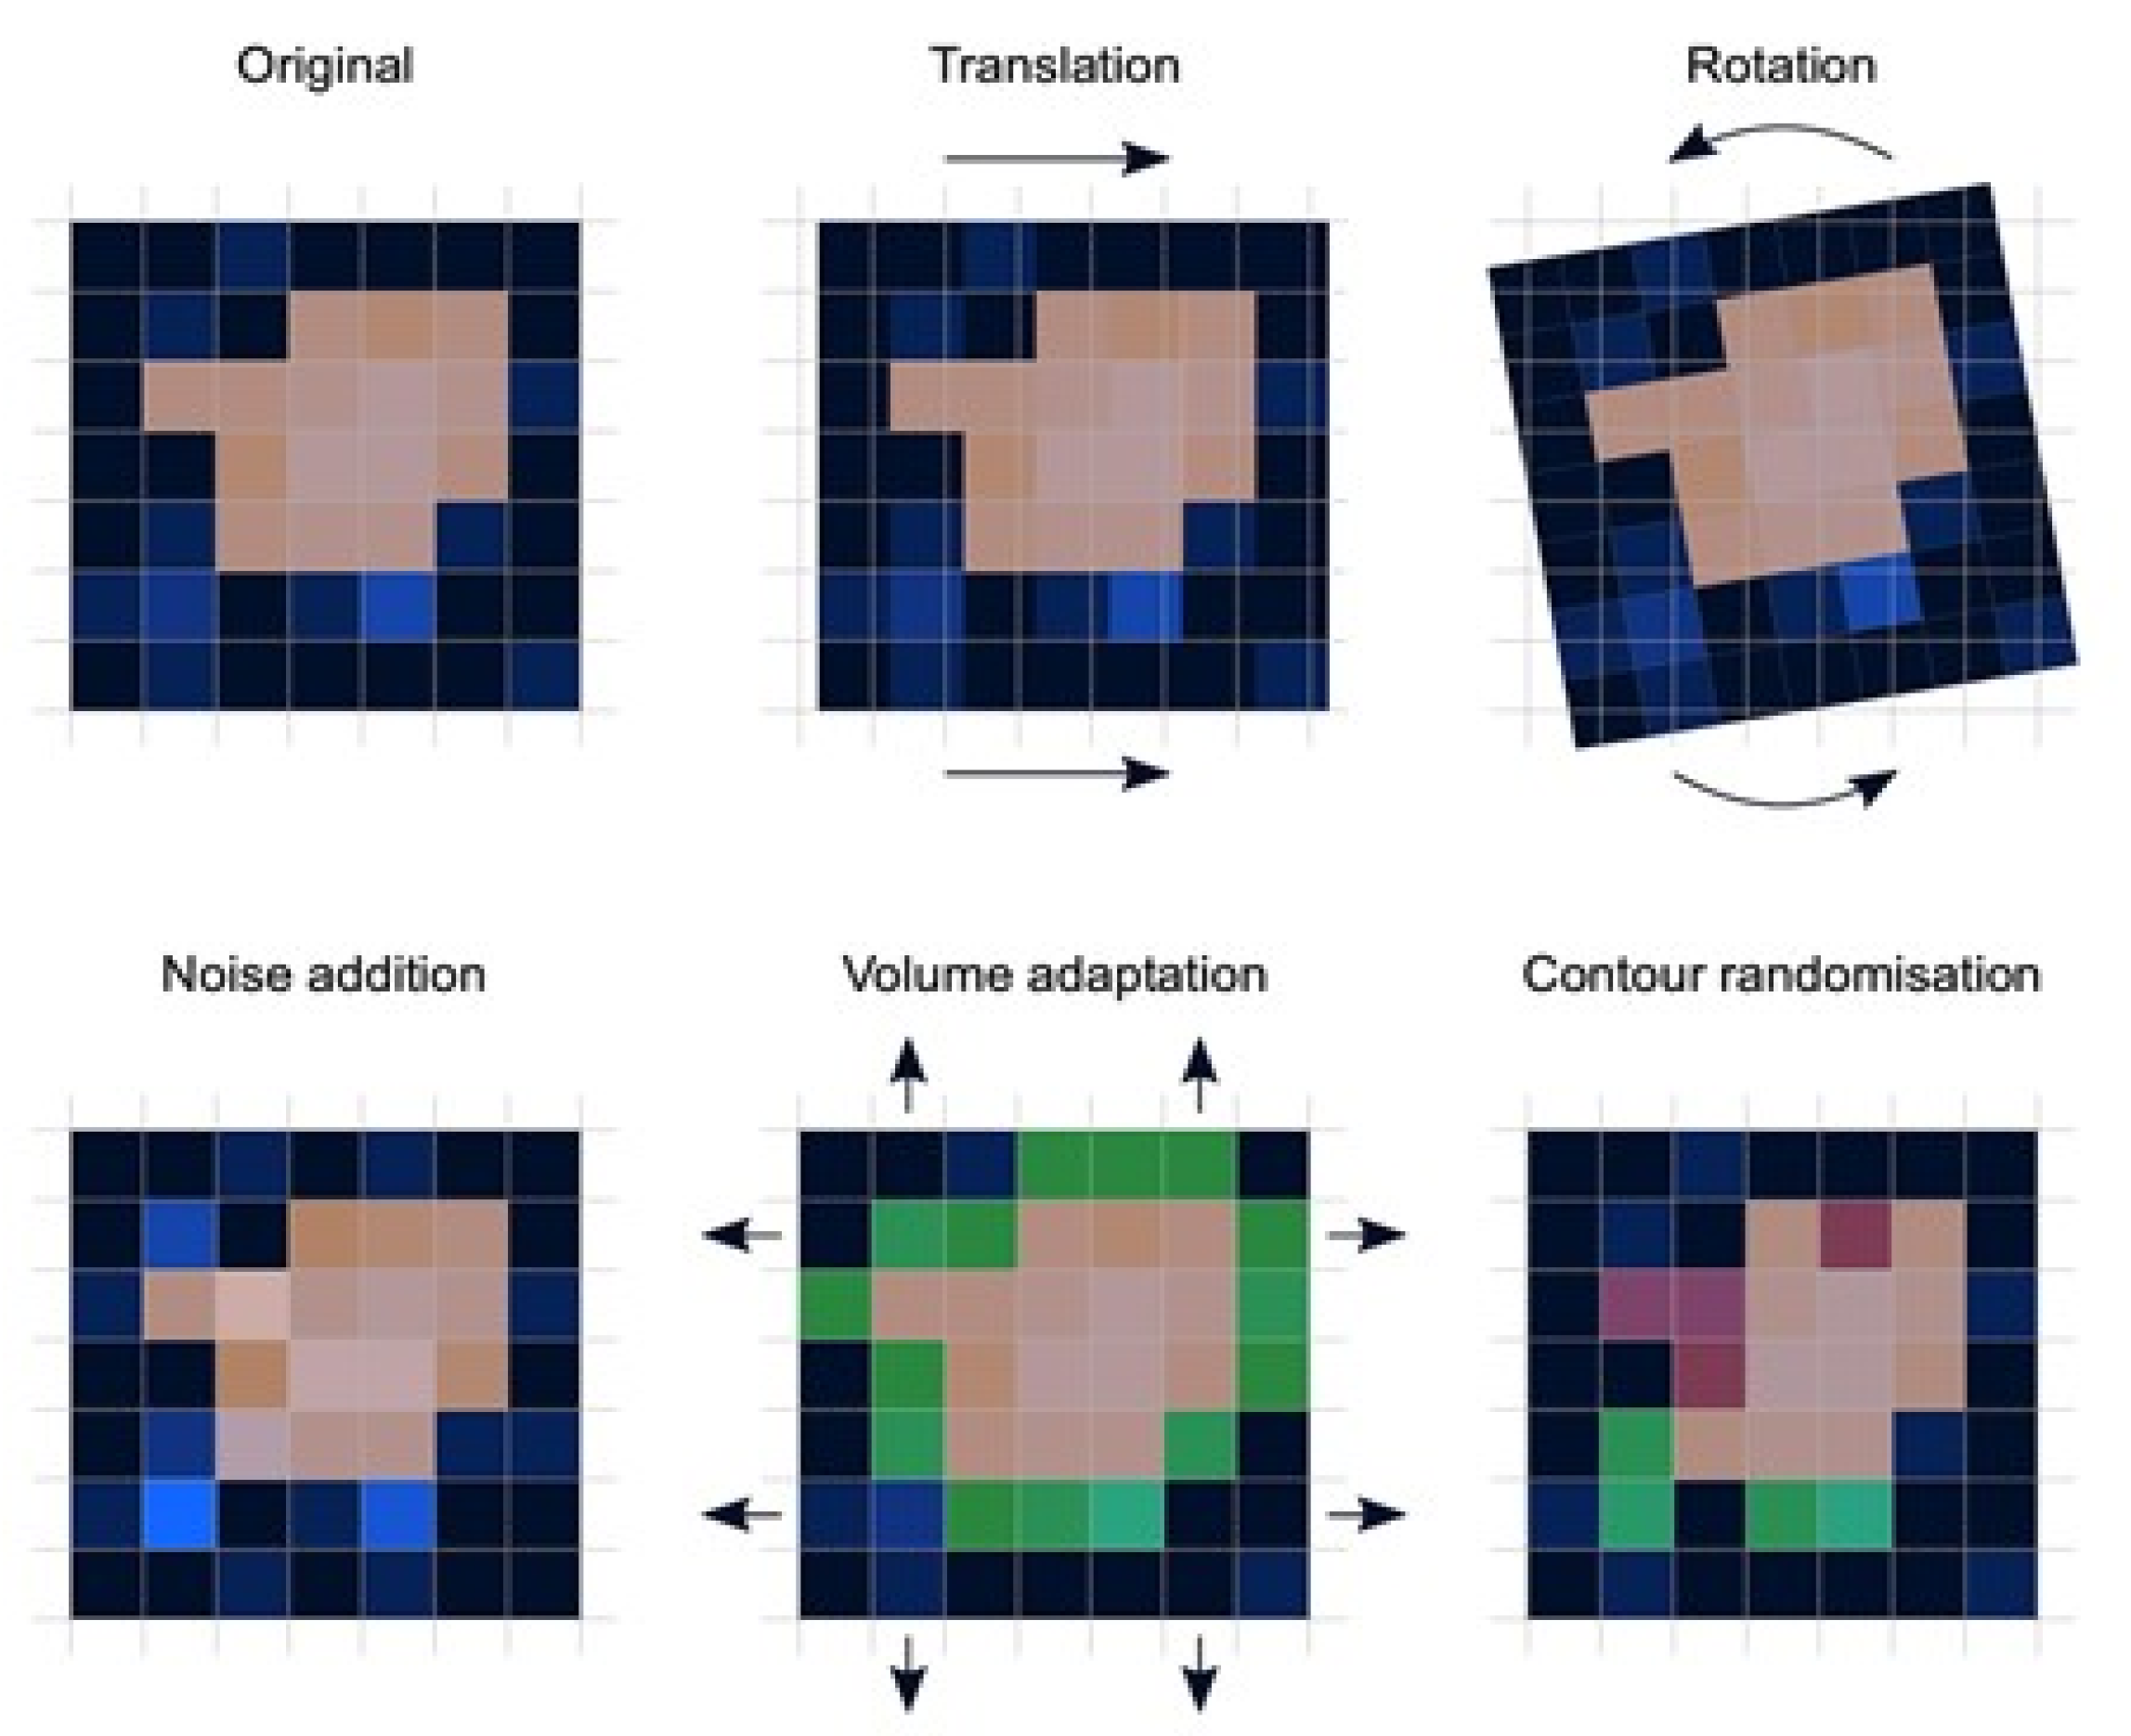
- Preprocessing: Image preprocessing is the practice of applying a series of transformations to an initial image in order to improve image quality and make statistical analysis more repeatable and comparable. However, there is no predetermined analytic method to do this, and it varies depending on collected data and disease to study. Since radiomics deals primarily with images, it depends highly on image parameters of a given modality such as: the size of pixels (2D) or voxels (3D), the number of gray levels and range of the gray-level values, as well as the type of 3D-reconstruction algorithms [14]. This is important because the stability and robustness of radiomics features depend on the image processing settings [14,15]. Image acquisition, segmentation, intensity normalization, co-regulation, and noise filtering are three more analytical techniques that are crucial for processing the quantitative analysis of the images (Figure 2).
- Segmentation: This is the delineation of the region of interest (ROI) in 2D or volume of interest (VOI) in 3D. This is the most critical step in the radiomics workflow since it specifies the area/volume from which the features will be extracted. Segmentation is tedious and is usually done manually by a human operator or semi-manually using standard segmentation software [16]. However, segmentation is subject to intra- and inter-operator variability. Therefore, fully automated segmentation was introduced recently, using deep learning techniques [17]. Deep learning (DL) is based on artificial neural networks where multiple layers (such as neurons in the human brain) are used to perform complex operations and extract higher levels of features from data. DL techniques require a large amount of data and considerable computing resources to achieve the required accuracy.
- Feature extraction: This is mainly a software-based process aimed at extracting and calculating quantitative feature descriptors. Most of the feature extraction procedures follow the guidelines of ISBI “Image Biomarker Standard Initiative”, which clusters features in major categories such as intensity-based features, shape and edge features, texture features, and morphological features [18]. On the other hand, using only gray-level descriptors or histograms provides no information on the spatial distribution of an image’s content, which can be obtained by evaluating texture features [19]. Because of their varied textures, regions with comparable pixels/voxels can be distinguished in some images. Because texture features can represent the intricacies of a lesion observed in an image, they have become increasingly relevant [20]. The geometric features extracted from the segmented object, such as its contours, junctions, curves, and polygonal regions, are referred to as shape features. Quantifying item shapes is a difficult task because it is dependent on the efficacy of segmentation algorithms. Moreover, methods such as wavelet transformation, Laplacian of Gaussian, square root, and local binary pattern are used to polish this step. For example, a wavelet transformation is a powerful tool for multiscale feature extraction. A wavelet is a function that resembles a wave. Scale and location are the basic characteristics of the wavelet function. The scale defines how "stretched" or “squished” the function is, whereas placement identifies the wavelet’s position in time (or space). Decreasing the scale (resolution) of the wavelet can capture high-frequency information and, therefore, analyze well high-spatial frequency phenomena localized in space and can effectively extract information derived from localized high-frequency signals. Laplacian of Gaussian filter smooths the image by using a Gaussian filter, then applies the Laplacian to find edges (areas of gray-level rapid change). Square and square root image filters are tagged as Gamma modifiers. The square filter is accomplished by taking the square of image intensities, and the square root filter by taking the square root of the absolute value of image intensities [21]. Local binary pattern relies on labeling a binary value to each pixel of the image by thresholding the neighboring pixels based on the central pixel value, and the histogram of these labels is considered as texture features [22].
- Feature analysis: The number of features extracted can be very high, which makes the analysis process cumbersome and the application of artificial intelligence ill-posed, in particular, if the number of data is not high. Reducing the number of features to a reasonable yet meaningful number is called “feature selection” or “dimension reduction” and helps to exclude features that are redundant and non-relevant from the data set before doing the final analysis. It also helps gather only the features that are the most consistent and relevant to build a reliable model for further prediction and classification [23]. Dimension reduction techniques, such as principal component analysis and partial least squares, construct ‘super variables’—usually linear combinations of original input variables—and use them in classification. Although they may also lead to satisfactory classification, biomedical implications of the classifiers are usually not obvious since all input features are used in the construction of the super features and hence classification. Feature selection methods can be classified into three categories. The filter approach separates feature selection from classifier construction. This implies that the machine learning algorithm handles the feature removal and data classification in separate steps. As a result, the algorithm begins by picking out the most crucial features and eliminating the others, and then, in the second step, it only uses those features to classify the data. The wrapper approach measures the “usefulness” of features based on the classifier performance by using a greedy search approach that evaluates all the possible combinations of features against the classification-based evaluation criterion and keeps searching until a certain accuracy criterion is satisfied. The embedded approach embeds feature selection within classifier construction. Embedded approaches have less computational complexity than wrapper methods. Compared with filter methods, embedded methods can better account for correlations among input variables. Penalization methods are a subset of embedded methods in which feature selection and classifier construction are achieved simultaneously by computing parameters involved in the penalized objective function. Many algorithms have been proposed to achieve this; the most popular ones are lasso, adaptive lasso, bridge, elastic net, and SCAD, to name a few [24,25,26,27,28]. Table 1 summarizes an assessment of some publicly available open-source radiomics extraction tools and their primary characteristics.
2.2. AI
2.3. Radiomics-AI Combination
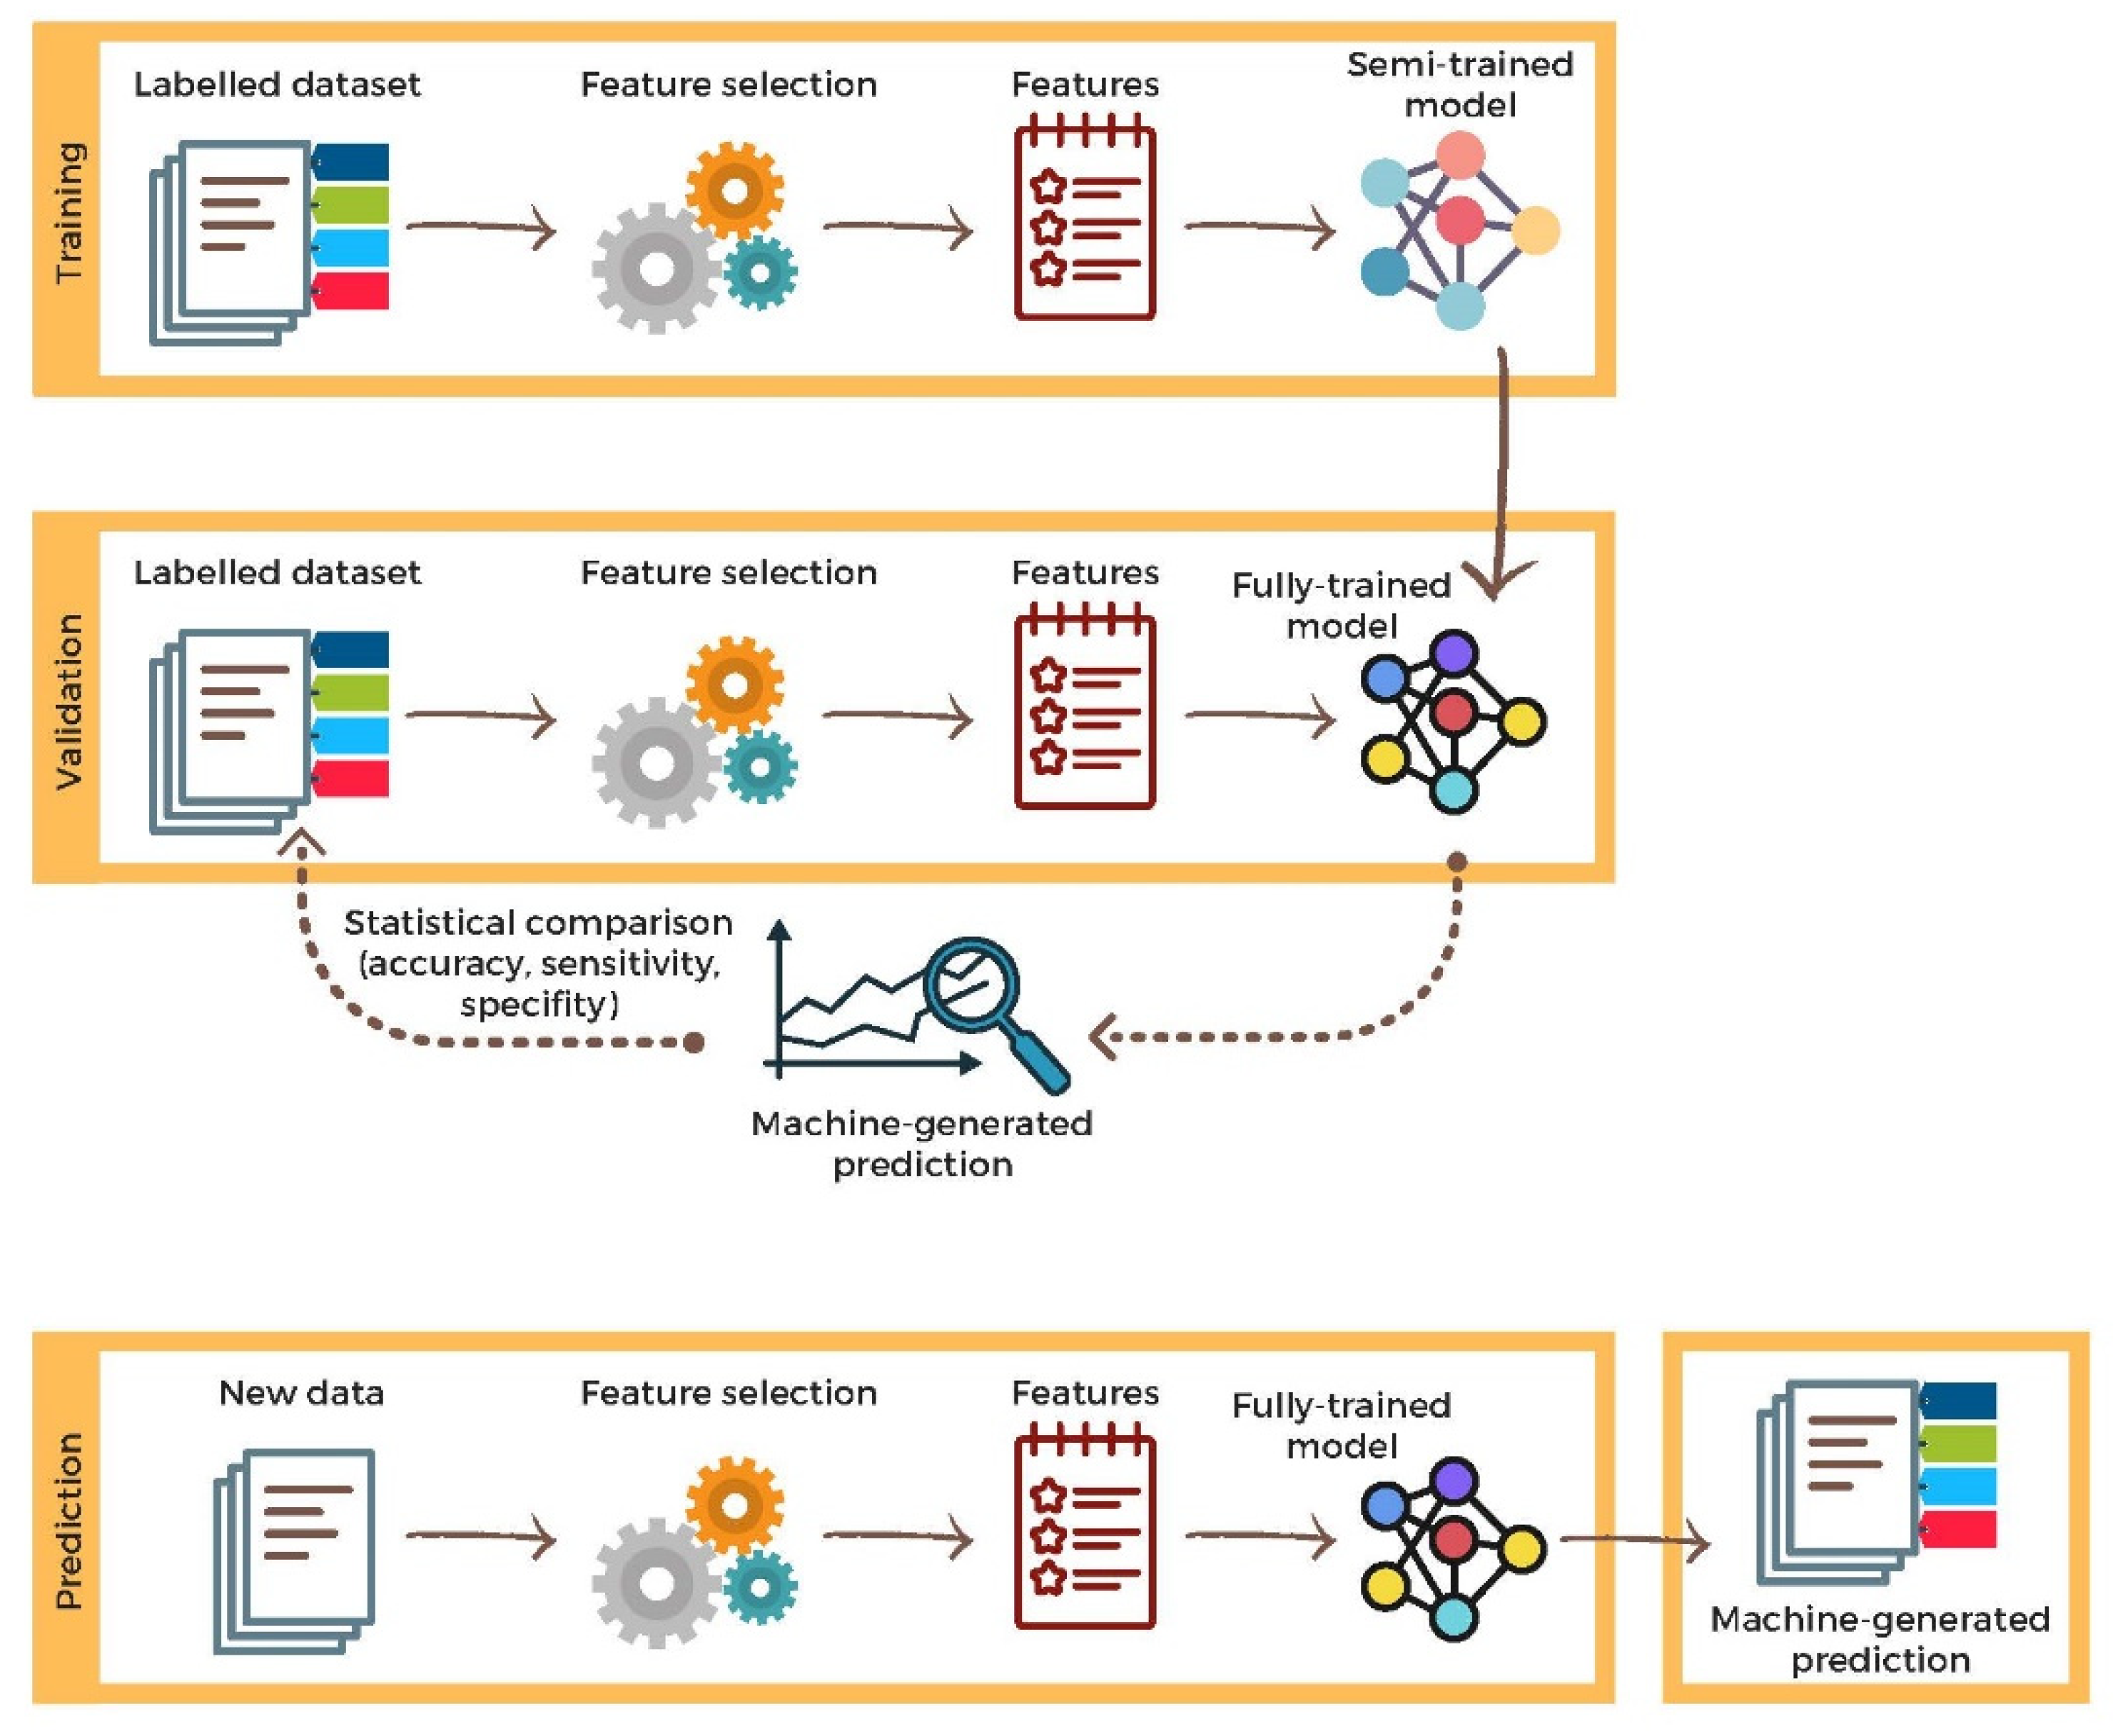
2.4. Validation
2.5. Open-Source Data for Radiomics
3. Application of AI and Radiomics in Veterinary Diagnostic Imaging
3.1. Lesion Detection
3.2. Lesion Characterization
4. Discussion
5. Conclusions
Author Contributions
Funding
Institutional Review Board Statement
Informed Consent Statement
Data Availability Statement
Conflicts of Interest
References
- Hosny, A.; Parmar, C.; Quackenbush, J.; Schwartz, L.H.; Aerts, H.J.W.L. Artificial Intelligence in Radiology. Nat. Rev. Cancer 2018, 18, 500–510. [Google Scholar] [CrossRef] [PubMed]
- Ker, J.; Wang, L.; Rao, J.; Lim, T. Deep Learning Applications in Medical Image Analysis. IEEE Access 2017, 6, 9375–9389. [Google Scholar] [CrossRef]
- Gillies, R.J.; Kinahan, P.E.; Hricak, H. Radiomics: Images Are More than Pictures, They Are Data. Radiology 2016, 278, 563–577. [Google Scholar] [CrossRef] [PubMed]
- Mannil, M.; von Spiczak, J.; Manka, R.; Alkadhi, H. Texture Analysis and Machine Learning for Detecting Myocardial Infarction in Noncontrast Low-Dose Computed Tomography: Unveiling the Invisible. Investig. Radiol. 2018, 53, 338–343. [Google Scholar] [CrossRef]
- Miles, K. Radiomics for Personalised Medicine: The Long Road Ahead. Br. J. Cancer 2020, 122, 929–930. [Google Scholar] [CrossRef]
- Castellano, G.; Bonilha, L.; Li, L.M.; Cendes, F. Texture Analysis of Medical Images. Clin. Radiol. 2004, 59, 1061–1069. [Google Scholar] [CrossRef]
- Tourassi, G.D. Journey toward Computer-Aided Diagnosis: Role of Image Texture Analysis. Radiology 1999, 213, 317–320. [Google Scholar] [CrossRef]
- Wang, X.-H.; Long, L.-H.; Cui, Y.; Jia, A.Y.; Zhu, X.-G.; Wang, H.-Z.; Wang, Z.; Zhan, C.-M.; Wang, Z.-H.; Wang, W.-H. MRI-Based Radiomics Model for Preoperative Prediction of 5-Year Survival in Patients with Hepatocellular Carcinoma. Br. J. Cancer 2020, 122, 978–985. [Google Scholar] [CrossRef]
- Reuzé, S.; Schernberg, A.; Orlhac, F.; Sun, R.; Chargari, C.; Dercle, L.; Deutsch, E.; Buvat, I.; Robert, C. Radiomics in Nuclear Medicine Applied to Radiation Therapy: Methods, Pitfalls, and Challenges. Int. J. Radiat. Oncol. Biol. Phys. 2018, 102, 1117–1142. [Google Scholar] [CrossRef]
- Li, Y.; Yu, M.; Wang, G.; Yang, L.; Ma, C.; Wang, M.; Yue, M.; Cong, M.; Ren, J.; Shi, G. Contrast-Enhanced CT-Based Radiomics Analysis in Predicting Lymphovascular Invasion in Esophageal Squamous Cell Carcinoma. Front. Oncol. 2021, 11, 644165. [Google Scholar] [CrossRef]
- Qin, H.; Wu, Y.-Q.; Lin, P.; Gao, R.-Z.; Li, X.; Wang, X.-R.; Chen, G.; He, Y.; Yang, H. Ultrasound Image-Based Radiomics: An Innovative Method to Identify Primary Tumorous Sources of Liver Metastases. J. Ultrasound Med. 2021, 40, 1229–1244. [Google Scholar] [CrossRef] [PubMed]
- Aerts, H.J.W.L.; Velazquez, E.R.; Leijenaar, R.T.H.; Parmar, C.; Grossmann, P.; Cavalho, S.; Bussink, J.; Monshouwer, R.; Haibe-Kains, B.; Rietveld, D.; et al. Decoding Tumour Phenotype by Noninvasive Imaging Using a Quantitative Radiomics Approach. Nat. Commun. 2014, 5, 4006. [Google Scholar] [CrossRef] [PubMed]
- van Timmeren, J.E.; Cester, D.; Tanadini-Lang, S.; Alkadhi, H.; Baessler, B. Radiomics in Medical Imaging-“how-to” Guide and Critical Reflection. Insight. Imaging 2020, 11, 91. [Google Scholar] [CrossRef]
- Wichtman, B.D.; Attenberger, U.I.; Harder, F.N.; Schonberg, S.O.; Maintz, D.; Weiss, K.; Pinto dos Santos, D.; Baessler, B. Influence of Image Processing on the Robustness of Radiomic Features Derived from Magnetic Resonance Imaging—A Phantom Study. In Proceedings of the ISMRM 27th Annual Meeting & Exhibition, Montreal, QC, Canada, 27 May 2019. [Google Scholar]
- Altazi, B.A.; Zhang, G.G.; Fernandez, D.C.; Montejo, M.E.; Hunt, D.; Werner, J.; Biagioli, M.C.; Moros, E.G. Reproducibility of F18-FDG PET Radiomic Features for Different Cervical Tumor Segmentation Methods, Gray-Level Discretization, and Reconstruction Algorithms. J. Appl. Clin. Med. Phys. 2017, 18, 32–48. [Google Scholar] [CrossRef] [PubMed]
- Olabarriaga, S.D.; Smeulders, A.W. Interaction in the Segmentation of Medical Images: A Survey. Med. Image Anal 2001, 5, 127–142. [Google Scholar] [CrossRef]
- Egger, J.; Colen, R.R.; Freisleben, B.; Nimsky, C. Manual Refinement System for Graph-Based Segmentation Results in the Medical Domain. J. Med. Syst. 2012, 36, 2829–2839. [Google Scholar] [CrossRef]
- Zwanenburg, A.; Leger, S.; Vallières, M.; Löck, S. Image Biomarker Standardisation Initiative. Radiology 2020, 295, 328–338. [Google Scholar] [CrossRef]
- Bovik, A.C. Handbook of Image and Video Processing (Communications, Networking and Multimedia); Academic Press: Cambridge, MA, USA, 2005. [Google Scholar]
- Bernal, J.; del C. Valdés-Hernández, M.; Escudero, J.; Viksne, L.; Heye, A.K.; Armitage, P.A.; Makin, S.; Touyz, R.M.; Wardlaw, J.M. Analysis of Dynamic Texture and Spatial Spectral Descriptors of Dynamic Contrast-Enhanced Brain Magnetic Resonance Images for Studying Small Vessel Disease. Magn. Reson. Imaging 2020, 66, 240–247. [Google Scholar] [CrossRef]
- Huang, K.; Aviyente, S. Wavelet Feature Selection for Image Classification. IEEE Trans. Image Process. 2008, 17, 1709–1720. [Google Scholar] [CrossRef]
- Bernatz, S.; Zhdanovich, Y.; Ackermann, J.; Koch, I.; Wild, P.; Santos, D.P.D.; Vogl, T.; Kaltenbach, B.; Rosbach, N. Impact of Rescanning and Repositioning on Radiomic Features Employing a Multi-Object Phantom in Magnetic Resonance Imaging. Sci. Rep. 2021, 11, 14248. [Google Scholar] [CrossRef]
- Hira, Z.M.; Gillies, D.F. A Review of Feature Selection and Feature Extraction Methods Applied on Microarray Data. Adv. Bioinform. 2015, 2015, 127–142. [Google Scholar] [CrossRef] [PubMed]
- Tibshirani, R. Regression Shrinkage and Selection Via the Lasso. J. R. Stat. Soc. Ser. B Methodol. 1996, 58, 267–288. [Google Scholar] [CrossRef]
- Leng, C.; Lin, Y.; Wahba, G. A note on the lasso and related procedures in model selection. Stat. Sin. 2006, 16, 1273–1284. [Google Scholar]
- Fu, W.; Knight, K. Asymptotics for Lasso-Type Estimators. Ann. Stat. 2000, 28, 1356–1378. [Google Scholar] [CrossRef]
- Zou, H.; Hastie, T. Regularization and Variable Selection via the Elastic Net. J. R. Stat. Soc. Ser. B Stat. Methodol. 2005, 67, 301–320. [Google Scholar] [CrossRef]
- Fan, J.; Li, R. Variable Selection via Nonconcave Penalized Likelihood and Its Oracle Properties. J. Am. Stat. Assoc. 2001, 96, 1348–1360. [Google Scholar] [CrossRef]
- Götz, M.; Nolden, M.; Maier-Hein, K. MITK Phenotyping: An Open-Source Toolchain for Image-Based Personalized Medicine with Radiomics. Radiother. Oncol. 2019, 131, 108–111. [Google Scholar] [CrossRef]
- Szczypiński, P.M.; Strzelecki, M.; Materka, A.; Klepaczko, A. MaZda--a Software Package for Image Texture Analysis. Comput. Methods Programs Biomed 2009, 94, 66–76. [Google Scholar] [CrossRef]
- van Griethuysen, J.J.; Fedorov, A.; Parmar, C.; Hosny, A.; Aucoin, N.; Narayan, V.; Beets-Tan, R.G.; Fillion-Robin, J.-C.; Pieper, S.; Aerts, H.J. Computational Radiomics System to Decode the Radiographic Phenotype. Cancer Res. 2017, 77, e104–e107. [Google Scholar] [CrossRef]
- Zhang, L.; Fried, D.V.; Fave, X.J.; Hunter, L.A.; Yang, J.; Court, L.E. IBEX: An Open Infrastructure Software Platform to Facilitate Collaborative Work in Radiomics. Med. Phys. 2015, 42, 1341–1353. [Google Scholar] [CrossRef]
- Apte, A.P.; Iyer, A.; Crispin-Ortuzar, M.; Pandya, R.; van Dijk, L.V.; Spezi, E.; Thor, M.; Um, H.; Veeraraghavan, H.; Oh, J.H.; et al. Technical Note: Extension of CERR for Computational Radiomics: A Comprehensive MATLAB Platform for Reproducible Radiomics Research. Med. Phys. 2018. [Google Scholar] [CrossRef] [PubMed]
- Erhan, D.; Bengio, Y.; Courville, A.; Manzagol, P.-A.; Vincent, P.; Bengio, S. Why Does Unsupervised Pre-Training Help Deep Learning? J. Mach. Learn. Res. 2010, 11, 625–660. [Google Scholar]
- Nelder, J.A.; Wedderburn, R.W.M. Generalized Linear Models. J. R. Stat. Soc. Ser. A Gen. 1972, 135, 370. [Google Scholar] [CrossRef]
- Jolliffe, I.T. Principle Component Analysis, 2nd ed.; Springer: New York, NY, USA, 2002. [Google Scholar]
- McLachlan, G.J.; Frontmatter. Discriminant Analysis and Statistical Pattern Recognition; John Wiley & Sons, Ltd.: Hoboken, NJ, USA, 1992; ISBN 978-0-471-72529-9. [Google Scholar]
- Walker, S.H.; Duncan, D.B. Estimation of the Probability of an Event as a Function of Several Independent Variables. Biometrika 1967, 54, 167–179. [Google Scholar] [CrossRef] [PubMed]
- Norvig, P.; Russell, S.J. Artificial Intelligence: A Modern Approach, 4th ed.; Prentice Hall: Hoboken, NJ, USA; Available online: http://aima.cs.berkeley.edu/ (accessed on 10 October 2021).
- Hastie, T.; Tibshirani, R.; Friedman, J. Boosting and Additive Trees. In The Elements of Statistical Learning: Data Mining, Inference, and Prediction; Hastie, T., Tibshirani, R., Friedman, J., Eds.; Springer Series in Statistics; Springer: New York, NY, USA, 2009; pp. 337–387. ISBN 978-0-387-84858-7. [Google Scholar]
- Quinlan, J.R. Simplifying Decision Trees. Int. J. Man-Mach. Stud. 1987, 27, 221–234. [Google Scholar] [CrossRef]
- Cortes, C.; Vapnik, V. Support-Vector Networks. Mach. Learn 1995, 20, 273–297. [Google Scholar] [CrossRef]
- Chen, T.; Guestrin, C. XGBoost: A Scalable Tree Boosting System. In Proceedings of the 22nd ACM SIGKDD International Conference on Knowledge Discovery and Data Mining, San Francisco, CA, USA,, 13 August 2016; 2016; pp. 785–794. [Google Scholar]
- Ho, T.K. The Random Subspace Method for Constructing Decision Forests. IEEE Trans. Pattern Anal. Mach. Intell. 1998, 20, 832–844. [Google Scholar] [CrossRef]
- Kleene, S.C. Representation of Events in Nerve Nets and Finite Automata; RAND Corporation: Santa Monica, CA, USA, 1951. [Google Scholar]
- Fix, E.; Hodges, J.L. Discriminatory Analysis. Nonparametric Discrimination: Consistency Properties. Int. Stat. Rev. Rev. Int. Stat. 1989, 57, 238–247. [Google Scholar] [CrossRef]
- Bishop Pattern Recognition and Machine Learning. Available online: https://docs.google.com/viewer?a=v&pid=sites&srcid=aWFtYW5kaS5ldXxpc2N8Z3g6MjViZDk1NGI1NjQzOWZiYQ (accessed on 10 October 2021).
- Schmidhuber, J. Deep Learning in Neural Networks: An Overview. Neural Netw. 2015, 61, 85–117. [Google Scholar] [CrossRef]
- LeCun, Y.; Bengio, Y.; Hinton, G. Deep Learning. Nature 2015, 521, 436–444. [Google Scholar] [CrossRef]
- Goodfellow, I.; Bengio, Y.; Courville, A. Deep Learning; MIT Press: Cambridge, UK, 2016. [Google Scholar]
- Alzubaidi, L.; Zhang, J.; Humaidi, A.J.; Al-Dujaili, A.; Duan, Y.; Al-Shamma, O.; Santamaría, J.; Fadhel, M.A.; Al-Amidie, M.; Farhan, L. Review of Deep Learning: Concepts, CNN Architectures, Challenges, Applications, Future Directions. J. Big Data 2021, 8, 53. [Google Scholar] [CrossRef] [PubMed]
- Jonsson, A. Deep Reinforcement Learning in Medicine. Kidney Dis. 2019, 5, 18–22. [Google Scholar] [CrossRef] [PubMed]
- Sollini, M.; Antunovic, L.; Chiti, A.; Kirienko, M. Towards Clinical Application of Image Mining: A Systematic Review on Artificial Intelligence and Radiomics. Eur. J. Nucl. Med. Mol. Imaging 2019, 46, 2656–2672. [Google Scholar] [CrossRef]
- Bartholomai, B.; Koo, C.; Johnson, G.; White, D.; Raghunath, S.; Rajagopalan, S.; Moynagh, M.; Lindell, R.; Hartman, T. Pulmonary Nodule Characterization, Including Computer Analysis and Quantitative Features. J. Thorac. Imaging 2015, 30, 139–156. [Google Scholar] [CrossRef] [PubMed]
- Fukushima, K. Neocognitron: A Self Organizing Neural Network Model for a Mechanism of Pattern Recognition Unaffected by Shift in Position. Biol. Cybern. 1980, 36, 193–202. [Google Scholar] [CrossRef] [PubMed]
- Lecun, Y.; Bottou, L.; Bengio, Y.; Haffner, P. Gradient-Based Learning Applied to Document Recognition; Scientific Research Publishing: Wuhan, China, 1998; Volume 86, pp. 2278–2324. Available online: https://www.scirp.org/reference/referencespapers.aspx?referenceid=2761538 (accessed on 10 June 2022).
- Aerts, H.J.W.L.; Grossmann, P.; Tan, Y.; Oxnard, G.R.; Rizvi, N.; Schwartz, L.H.; Zhao, B. Defining a Radiomic Response Phenotype: A Pilot Study Using Targeted Therapy in NSCLC. Sci. Rep. 2016, 6, 33860. [Google Scholar] [CrossRef]
- Erickson, B.J.; Korfiatis, P.; Akkus, Z.; Kline, T.L. Machine Learning for Medical Imaging. Radiographics 2017, 37, 505–515. [Google Scholar] [CrossRef]
- Ronneberger, O.; Fischer, P.; Brox, T. U-Net: Convolutional Networks for Biomedical Image Segmentation. In Medical Image Computing and Computer-Assisted Intervention—MICCAI 2015; Navab, N., Hornegger, J., Wells, W.M., Frangi, A.F., Eds.; Lecture Notes in Computer Science; Springer International Publishing: Cham, Switzerland, 2015; Volume 9351, pp. 234–241. ISBN 978-3-319-24573-7. [Google Scholar]
- Zhao, B.; James, L.P.; Moskowitz, C.S.; Guo, P.; Ginsberg, M.S.; Lefkowitz, R.A.; Qin, Y.; Riely, G.J.; Kris, M.G.; Schwartz, L.H. Evaluating Variability in Tumor Measurements from Same-Day Repeat CT Scans of Patients with Non–Small Cell Lung Cancer. Radiology 2009, 252, 263–272. [Google Scholar] [CrossRef]
- Kalendralis, P.; Traverso, A.; Shi, Z.; Zhovannik, I.; Monshouwer, R.; Starmans, M.P.A.; Klein, S.; Pfaehler, E.; Boellaard, R.; Dekker, A.; et al. Multicenter CT Phantoms Public Dataset for Radiomics Reproducibility Tests. Med. Phys. 2019, 46, 1512–1518. [Google Scholar] [CrossRef]
- McEvoy, F.J.; Amigo, J.M. Using Machine Learning to Classify Image Features from Canine Pelvic Radiographs: Evaluation of Partial Least Squares Discriminant Analysis and Artificial Neural Network Models. Vet. Radiol. Ultrasound 2013, 54, 122–126. [Google Scholar] [CrossRef]
- Basran, P.S.; Gao, J.; Palmer, S.; Reesink, H.L. A Radiomics Platform for Computing Imaging Features from ΜCT Images of Thoroughbred Racehorse Proximal Sesamoid Bones: Benchmark Performance and Evaluation. Equine Vet. J. 2021, 53, 277–286. [Google Scholar] [CrossRef] [PubMed]
- Becker, A.S.; Schneider, M.A.; Wurnig, M.C.; Wagner, M.; Clavien, P.A.; Boss, A. Radiomics of Liver MRI Predict Metastases in Mice. Eur. Radiol. Exp. 2018, 2, 11. [Google Scholar] [CrossRef] [PubMed]
- Boissady, E.; de La Comble, A.; Zhu, X.; Hespel, A.-M. Artificial Intelligence Evaluating Primary Thoracic Lesions Has an Overall Lower Error Rate Compared to Veterinarians or Veterinarians in Conjunction with the Artificial Intelligence. Vet. Radiol. Ultrasound 2020, 61, 619–627. [Google Scholar] [CrossRef] [PubMed]
- Yoon, Y.; Hwang, T.; Lee, H. Prediction of Radiographic Abnormalities by the Use of Bag-of-Features and Convolutional Neural Networks. Vet. J. 2018, 237, 43–48. [Google Scholar] [CrossRef] [PubMed]
- Banzato, T.; Bernardini, M.; Cherubini, G.B.; Zotti, A. A Methodological Approach for Deep Learning to Distinguish between Meningiomas and Gliomas on Canine MR-Images. BMC Vet. Res. 2018, 14, 317. [Google Scholar] [CrossRef] [PubMed]
- D’Souza, J.C.; Sultan, L.R.; Hunt, S.J.; Schultz, S.M.; Brice, A.K.; Wood, A.K.W.; Sehgal, C.M. B-Mode Ultrasound for the Assessment of Hepatic Fibrosis: A Quantitative Multiparametric Analysis for a Radiomics Approach. Sci. Rep. 2019, 9, 8708. [Google Scholar] [CrossRef] [PubMed]
- Kim, J.Y.; Lee, H.E.; Choi, Y.H.; Lee, S.J.; Jeon, J.S. CNN-Based Diagnosis Models for Canine Ulcerative Keratitis. Sci. Rep. 2019, 9, 14209. [Google Scholar] [CrossRef]
- Wanamaker, M.W.; Vernau, K.M.; Taylor, S.L.; Cissell, D.D.; Abdelhafez, Y.G.; Zwingenberger, A.L. Classification of Neoplastic and Inflammatory Brain Disease Using MRI Texture Analysis in 119 Dogs. Vet. Radiol. Ultrasound 2021, 62, 445–454. [Google Scholar] [CrossRef]
- Boddapati, V.; Petef, A.; Rasmusson, J.; Lundberg, L. Classifying Environmental Sounds Using Image Recognition Networks. Procedia Comput. Sci. 2017, 112, 2048–2056. [Google Scholar] [CrossRef]
- McAllister, P.; Zheng, H.; Bond, R.; Moorhead, A. Combining Deep Residual Neural Network Features with Supervised Machine Learning Algorithms to Classify Diverse Food Image Datasets. Comput. Biol. Med. 2018, 95, 217–233. [Google Scholar] [CrossRef]
- Jalali, A.; Mallipeddi, R.; Lee, M. Sensitive Deep Convolutional Neural Network for Face Recognition at Large Standoffs with Small Dataset. Expert Syst. Appl. 2017, 87, 304–315. [Google Scholar] [CrossRef]
- Abuzaid, M.; Elshami, W.; Tekin, H.; Issa, B. Assessment of the Willingness of Radiologists and Radiographers to Accept the Integration of Artificial Intelligence into Radiology Practice. Acad. Radiol. 2022, 29, 87–94. [Google Scholar] [CrossRef] [PubMed]
- Bhandari, A.; Purchuri, S.N.; Sharma, C.; Ibrahim, M.; Prior, M. Knowledge and Attitudes towards Artificial Intelligence in Imaging: A Look at the Quantitative Survey Literature. Clin. Imaging 2021, 80, 413–419. [Google Scholar] [CrossRef] [PubMed]


| Programming Language | IBSI 1 Feature Definition | Full OS Compatibility | DICOM-RT 2 Import | Integrated Visualization | Radiomics Metadata Storage | Built-in Segme-Ntation | Reference | |
|---|---|---|---|---|---|---|---|---|
| MITK | C++ | No | Yes | Yes | No | No | No | Götz et al. 2019 [29] |
| MaZda | C++/Delphi | No | No | No | Yes | No | Yes | Szczypinski et al. 2009 [30] |
| PyRadiomics | Python | Yes | Yes | No | No | No | No | van Griethuysen et al. 2017 [31] |
| IBEX | Matlab/C++ | No | No | Yes | Yes | Yes | Yes | Zhang et al. 2015 [32] |
| CERR | Matlab | Yes | Yes | Yes | Yes | Yes | Yes | Apte et al. 2018 [33] |
| Model | Algorithm | Reference |
|---|---|---|
| Linear Learning model |
| |
| Nonlinear Learning model |
|
(2015) [49]; Goodfellow (2016) [50]
|
| Reference | Topic | Scale | Species | AI/Radiomic Algorithms | Accuracy | Conclusion |
|---|---|---|---|---|---|---|
| Basran et al., 2021 [63] | Lesion detection: equine proximal sesamoid bone micro-CT | Clinical N = 8 cases and 8 controls | Equine | Radiomics | N/A | Radiomics analysis of μCT images of equine proximal sesamoid bones was able to identify image feature differences in image features in cases and controls |
| Becker et al., 2018 [64] | Lesion detection: murine hepatic MRIs | Pre-clinical N = 8 cases and 2 controls. | Murine | Radiomics | N/A | Texture features may quantitatively detect intrahepatic tumor growth not yet visible to the human eye |
| Boissady et al., 2020 [65] | Lesion detection: canine and feline thoracic radiographic lesions | Clinical N = 6584 cases | Canine and feline | Machine learning
| N/A | The described network can aid detection of lesions but not provide a diagnosis; potential to be used as tool to aid general practitioners |
| McEvoy and Amigo, 2013 [62] | Lesion detection: canine pelvic radiograph classification | Clinical N = 60 cases | Canine | Machine learning
| N/A | Demonstrated feasibility to classify images, dependent on availability of training data |
| Yoon et al., 2018 [66] | Lesion detection: canine thoracic radiographic lesions | Clinical N = 3122 cases | Canine | Machine learning
| CNN: 92.9–96.9% BOF: 79.6–96.9% | Both CNN and BOF capable of distinguishing abnormal thoracic radiographs, CNN showed higher accuracy and sensitivity than BOF |
| Banzato et al., 2018 [67] | Lesion characterization: MRI differentiation of canine meningiomas vs. gliomas | Clinical N = 80 cases | Canine | Machine learning
| 94% on post-contrast T1 images, 91% on pre-contrast T1-images, 90% on T2 images | CNN can reliably distinguish between different meningiomas and gliomas on MR images |
| D’Souza et al., 2019 [68] | Lesion characterization: assessment of B-mode US for murine hepatic fibrosis | Pre-clinical N = 22 cases and 4 controls. | Murine | Radiomics | N/A | Quantitative analysis of computer-extracted B-mode ultrasound features can be used to characterize hepatic fibrosis in mice |
| Kim et al., 2019 [69] | Lesion characterization: canine corneal ulcer image classification | Clinical N = 281 cases | Canine | Machine learning
| Most models > 90% for superficial and deep corneal ulcers; ResNet and VGGNet > 90% for normal corneas, superficial and deep corneal ulcers | CNN multiple image classification models can be used to effectively determine corneal ulcer severity in dogs |
| Wanamaker et al., 2021 [70] | Lesion characterization: MRI differentiation of canine glial cell neoplasia vs. noninfectious inflammatory meningoencephalitis | Clinical N = 119 cases | Canine | Radiomics | Random forest classifier accuracy was 76% to differentiate glioma vs. noninfectious inflammatory meningoencephalitis | Texture analysis using random forest algorithm to classify inflammatory and neoplastic lesions approached previously reported radiologist accuracy, however performed poorly for differentiating tumor grades and types |
Publisher’s Note: MDPI stays neutral with regard to jurisdictional claims in published maps and institutional affiliations. |
© 2022 by the authors. Licensee MDPI, Basel, Switzerland. This article is an open access article distributed under the terms and conditions of the Creative Commons Attribution (CC BY) license (https://creativecommons.org/licenses/by/4.0/).
Share and Cite
Bouhali, O.; Bensmail, H.; Sheharyar, A.; David, F.; Johnson, J.P. A Review of Radiomics and Artificial Intelligence and Their Application in Veterinary Diagnostic Imaging. Vet. Sci. 2022, 9, 620. https://doi.org/10.3390/vetsci9110620
Bouhali O, Bensmail H, Sheharyar A, David F, Johnson JP. A Review of Radiomics and Artificial Intelligence and Their Application in Veterinary Diagnostic Imaging. Veterinary Sciences. 2022; 9(11):620. https://doi.org/10.3390/vetsci9110620
Chicago/Turabian StyleBouhali, Othmane, Halima Bensmail, Ali Sheharyar, Florent David, and Jessica P. Johnson. 2022. "A Review of Radiomics and Artificial Intelligence and Their Application in Veterinary Diagnostic Imaging" Veterinary Sciences 9, no. 11: 620. https://doi.org/10.3390/vetsci9110620
APA StyleBouhali, O., Bensmail, H., Sheharyar, A., David, F., & Johnson, J. P. (2022). A Review of Radiomics and Artificial Intelligence and Their Application in Veterinary Diagnostic Imaging. Veterinary Sciences, 9(11), 620. https://doi.org/10.3390/vetsci9110620