Author Contributions
Y.L. (Yujue Li) and S.W. contributed equally to this work. Conceptualization, Y.L. (Yujue Li) and Y.Z.; methodology, Y.L. (Yujue Li) and S.W.; validation, Y.L. (Yujue Li) and S.W.; formal analysis, Y.L. (Yujue Li) and Y.Z.; investigation, Z.Z., J.G. and X.T. (sample processing); Y.C. (HE staining); S.Y. (pathological reporting); resources, Y.Z. (experimental equipment); data curation, Y.L. (Yujue Li), J.G. and X.T.; writing—original draft, Y.L. (Yujue Li); writing—review and editing, S.W. and Y.Z.; visualization, Y.L. (Yujue Li), J.G. and X.T.; supervision, Y.Z. (data interpretation); Y.L. (Yang Liu) (pathological review); funding acquisition, Y.Z. All authors have read and agreed to the published version of the manuscript.
Figure 1.
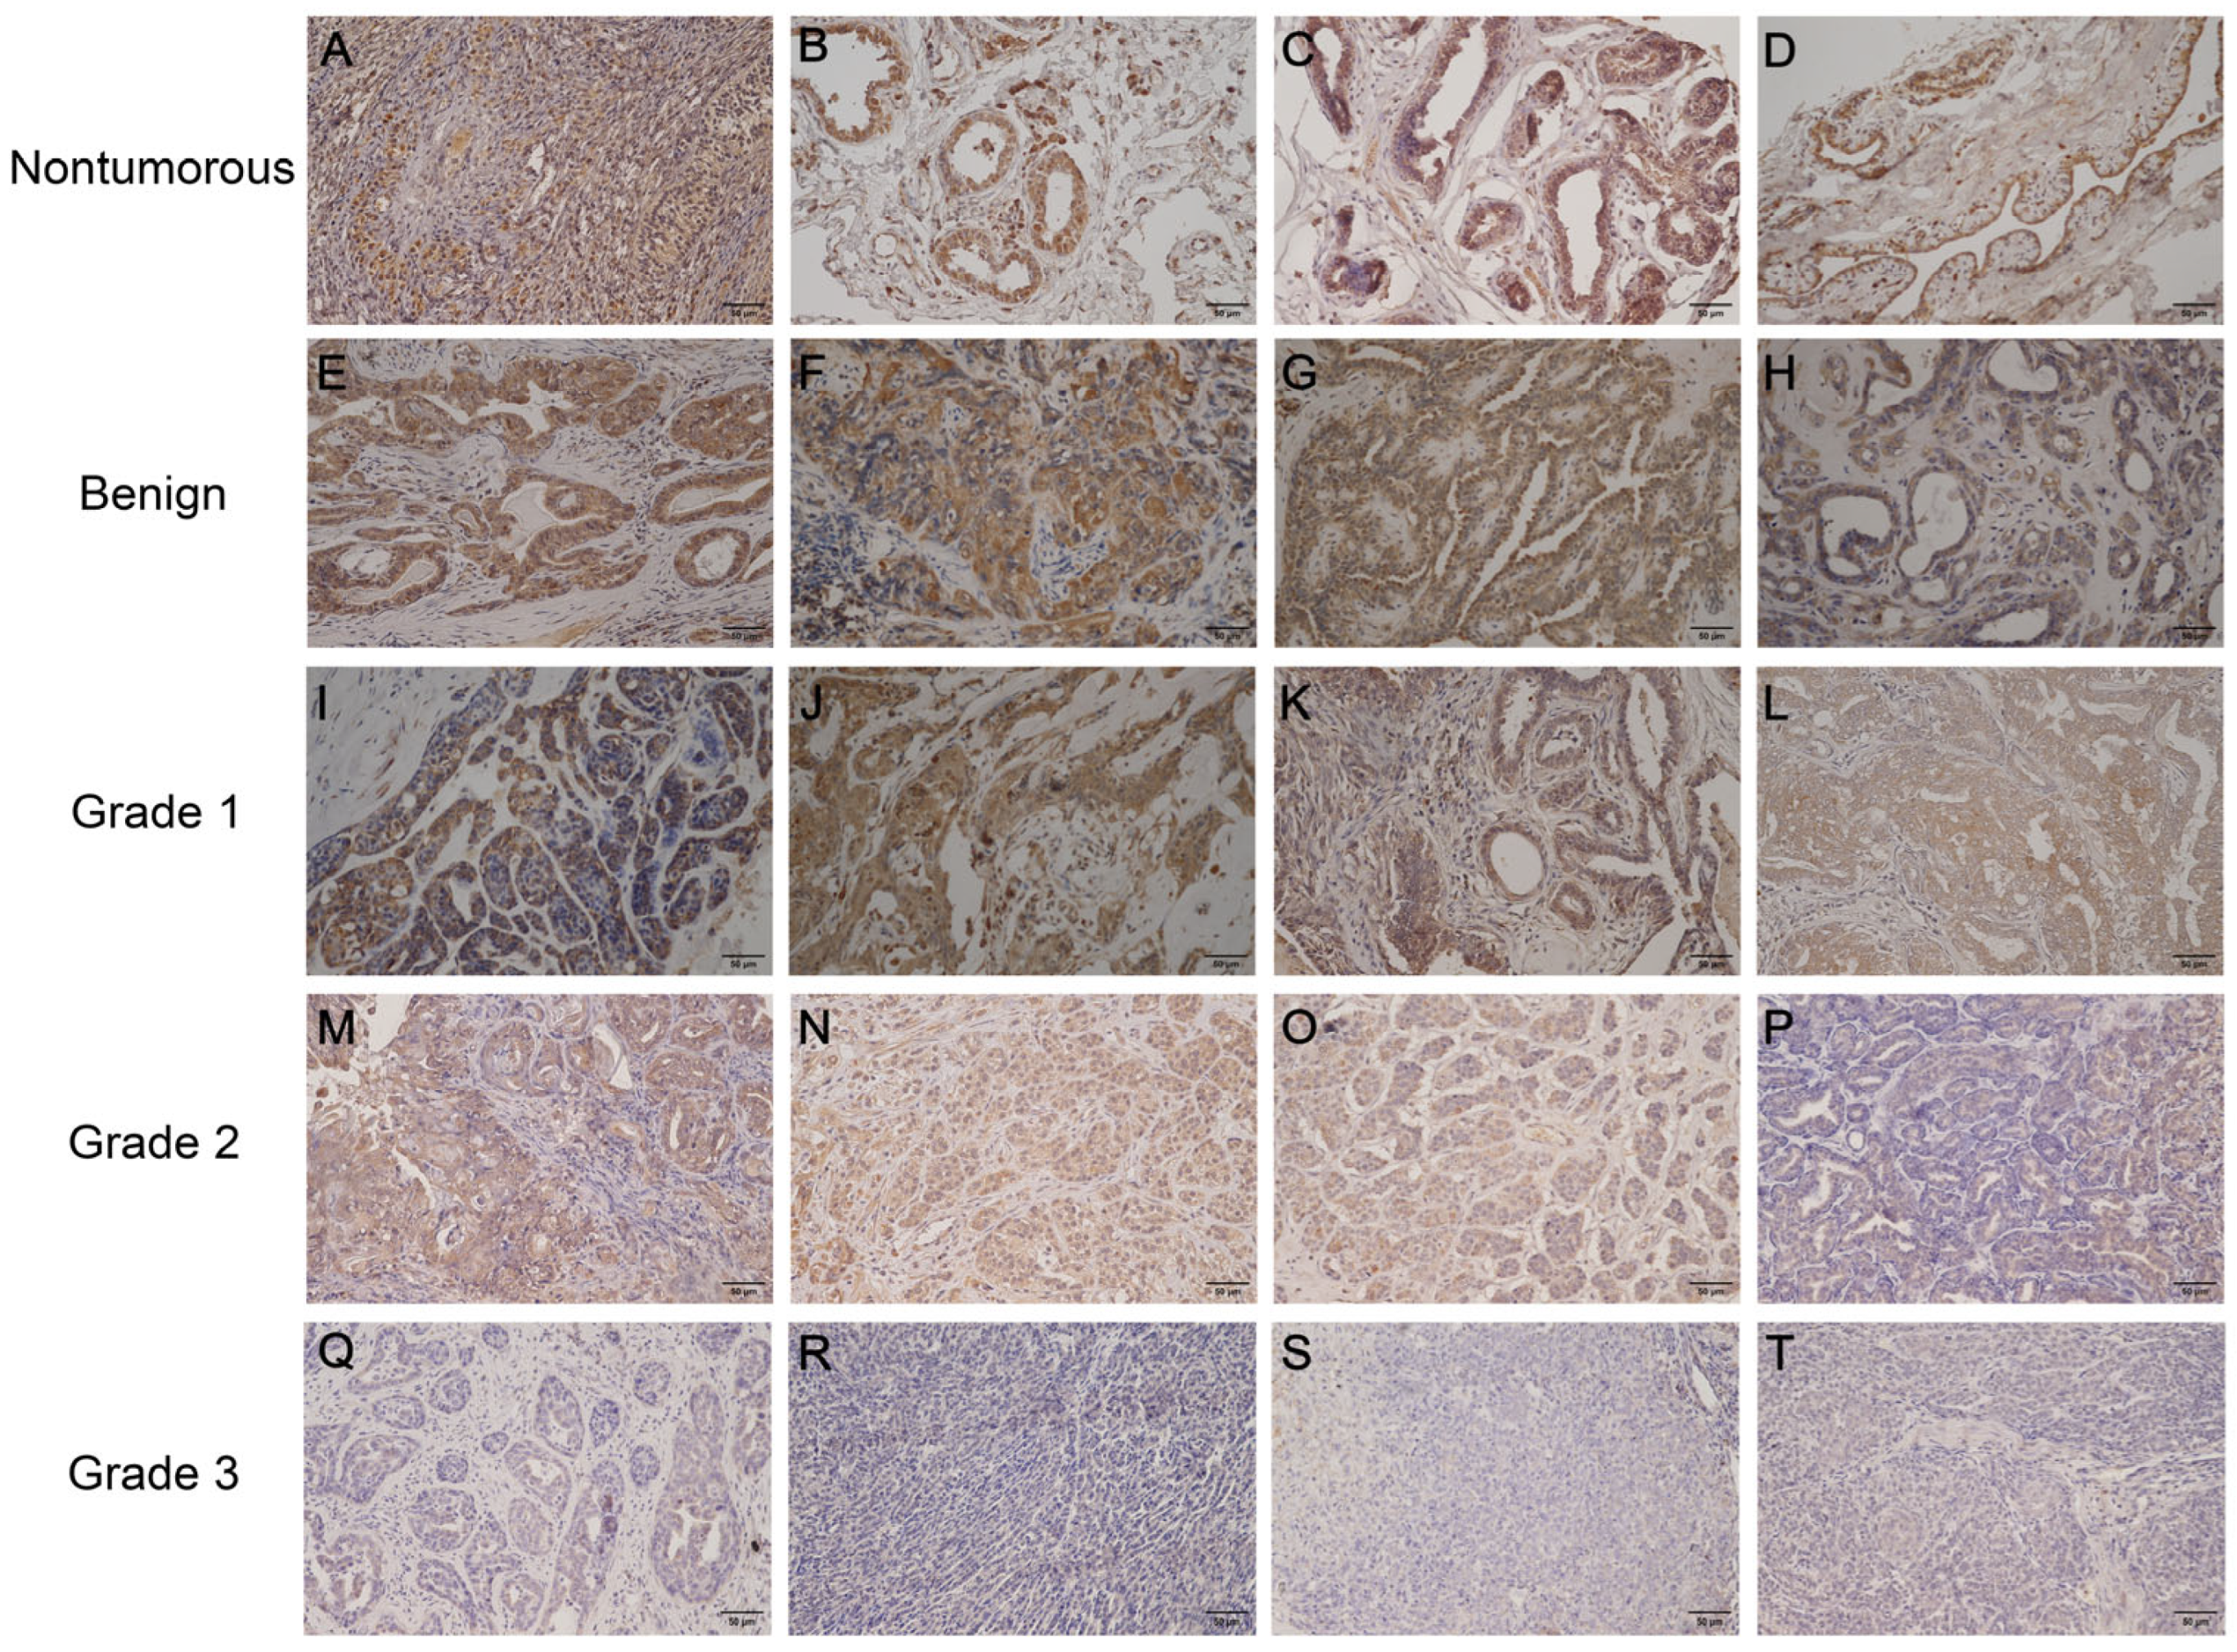
Immunohistochemical analysis of luteinizing hormone receptor (LHR) expression in canine mammary tissues. Positive control (canine ovarian tissue) (A); normal mammary tissues (B–D): cytoplasmic immunostaining intensity was strong in epithelial cells (histoscore [HS]: 9); benign tumors (E–H): cytoplasmic immunostaining intensity ranged from moderate to weak in neoplastic epithelial cells (HS: 6, 4, 3, 2); grade 1 malignant tumors (I–L): cytoplasmic immunostaining intensity decreased from moderate to weak (HS: 4, 3, 2, 1); grade 2 malignant tumors (M–P): weak cytoplasmic immunostaining (HS: 2, 2, 1, 1); grade 3 malignant tumors (Q–T): no detectable immunostaining signals were identified in the cytoplasm of neoplastic epithelial cells (HS: 0 in all samples). Scale bar: 50 μm.
Figure 1.
Immunohistochemical analysis of luteinizing hormone receptor (LHR) expression in canine mammary tissues. Positive control (canine ovarian tissue) (A); normal mammary tissues (B–D): cytoplasmic immunostaining intensity was strong in epithelial cells (histoscore [HS]: 9); benign tumors (E–H): cytoplasmic immunostaining intensity ranged from moderate to weak in neoplastic epithelial cells (HS: 6, 4, 3, 2); grade 1 malignant tumors (I–L): cytoplasmic immunostaining intensity decreased from moderate to weak (HS: 4, 3, 2, 1); grade 2 malignant tumors (M–P): weak cytoplasmic immunostaining (HS: 2, 2, 1, 1); grade 3 malignant tumors (Q–T): no detectable immunostaining signals were identified in the cytoplasm of neoplastic epithelial cells (HS: 0 in all samples). Scale bar: 50 μm.
Figure 2.
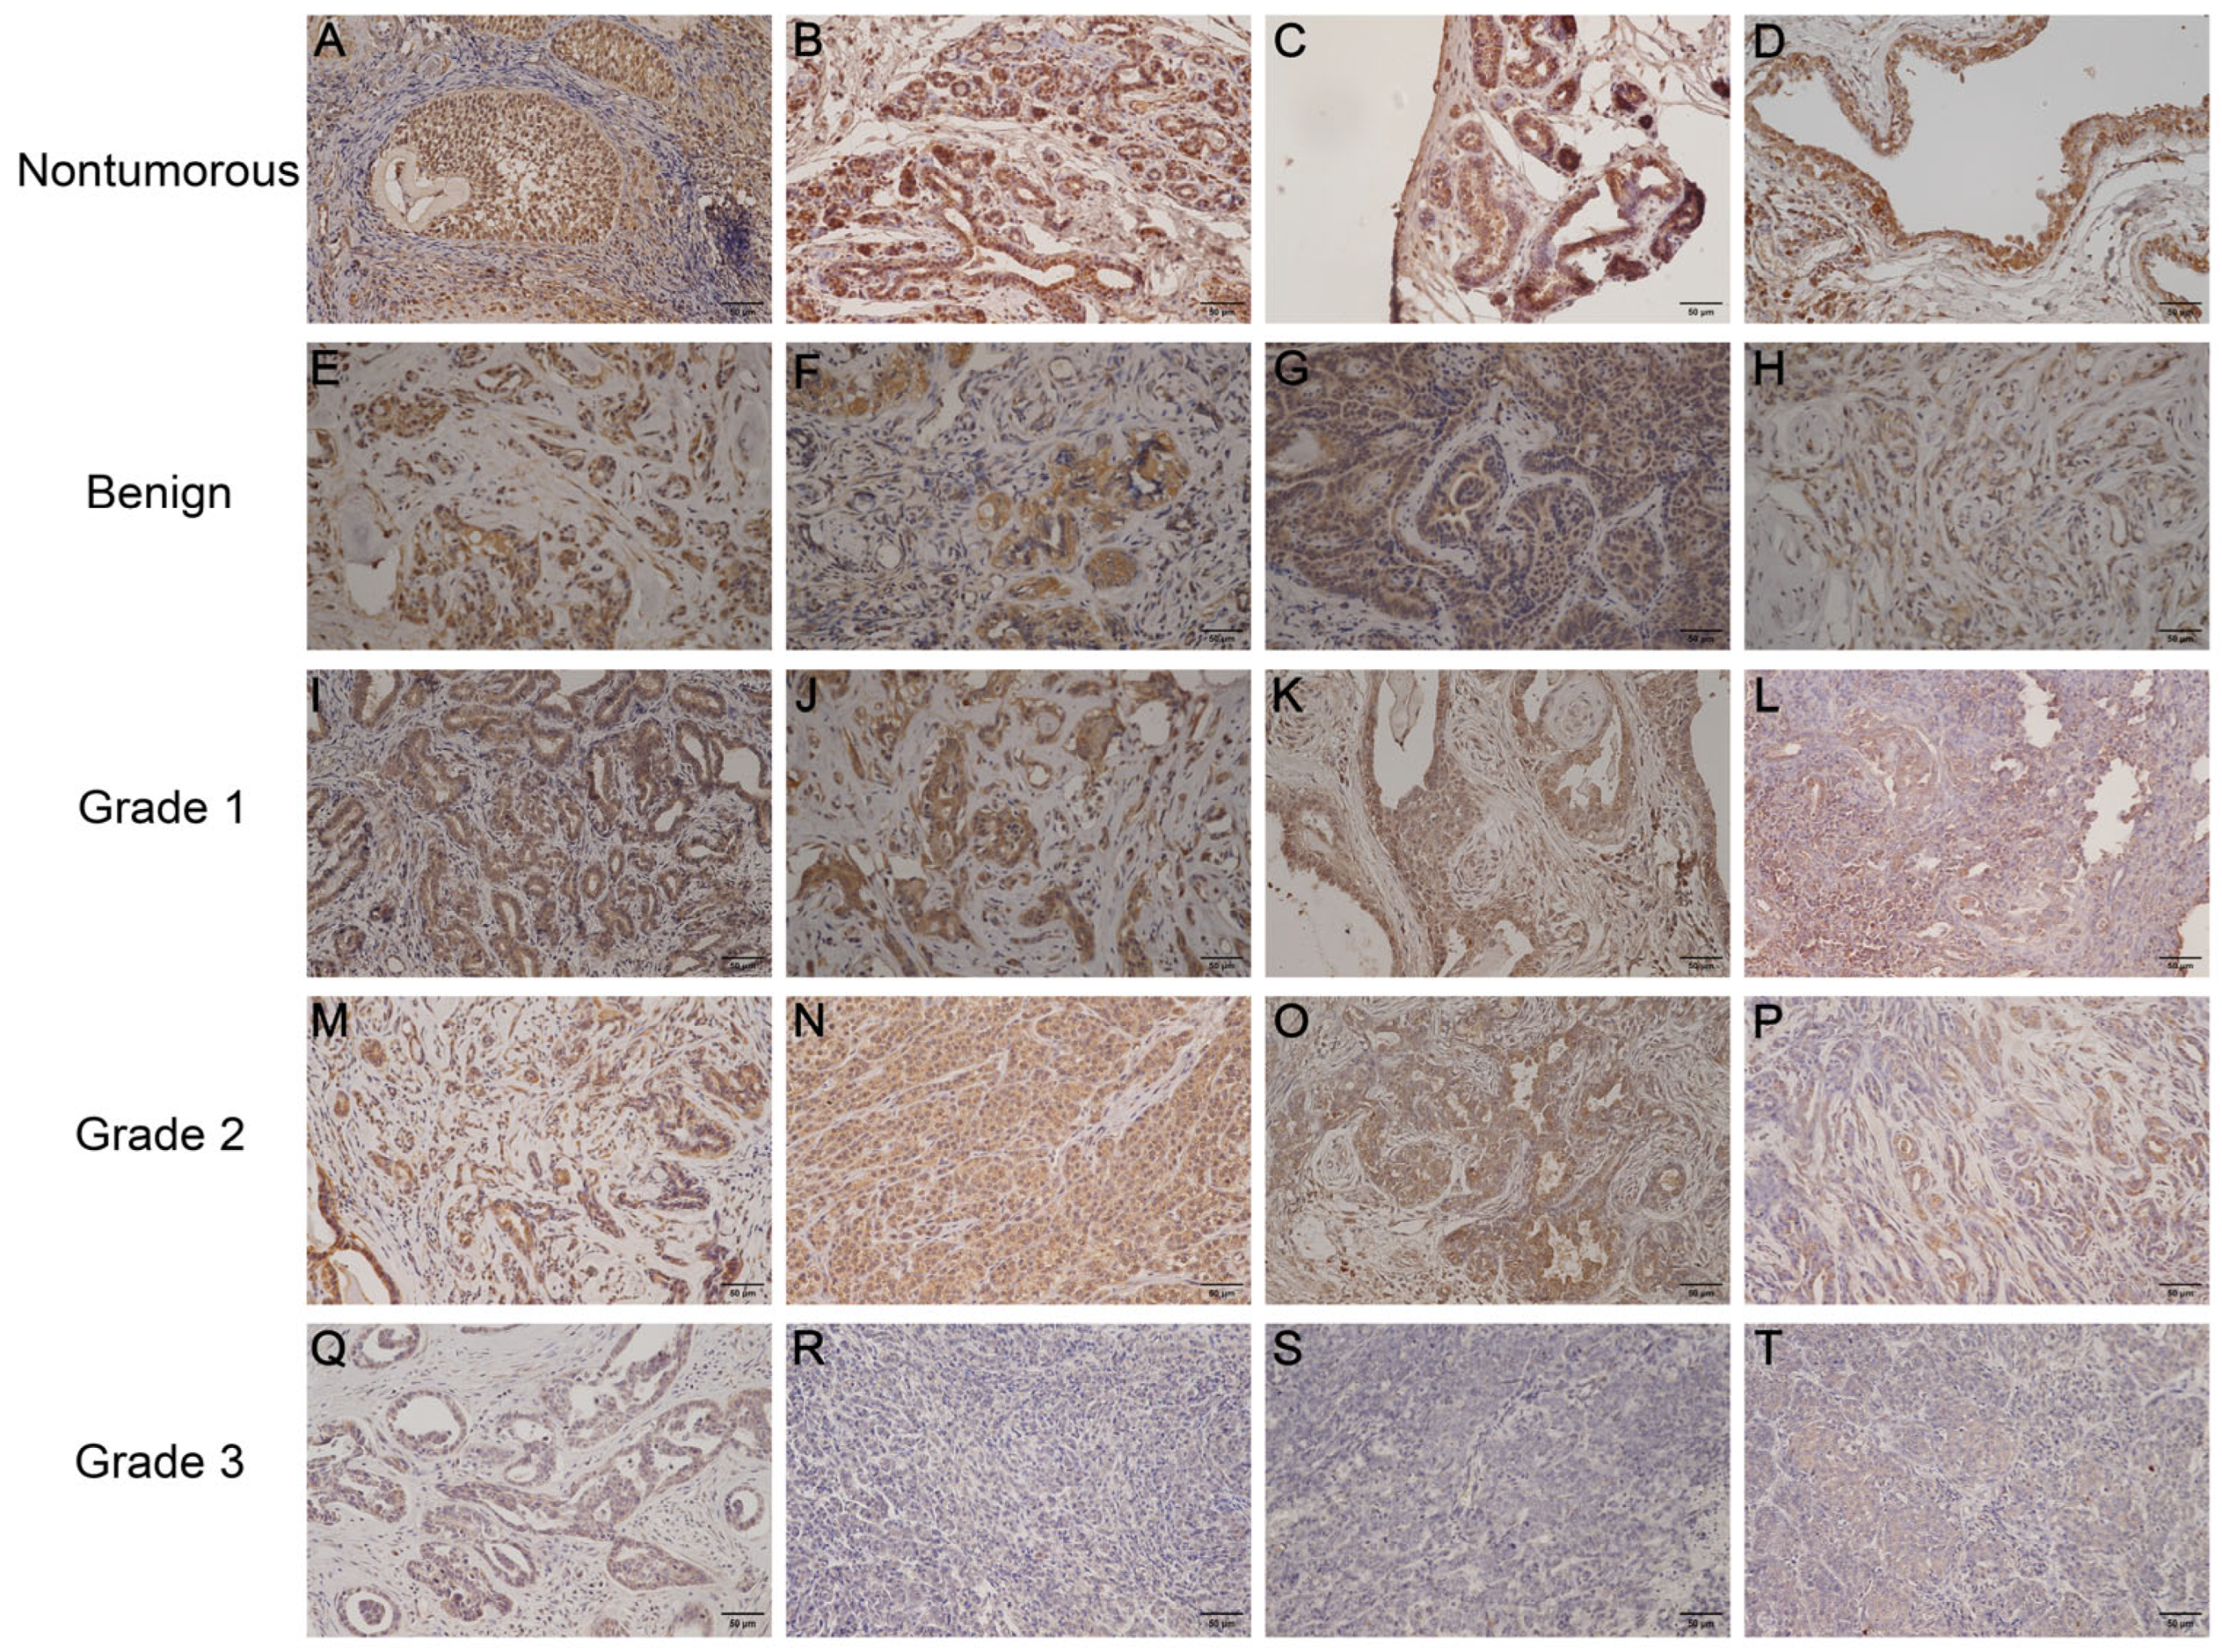
Immunohistochemical analysis of follicle-stimulating hormone receptor (FSHR) expression in canine mammary tissues. Positive control (canine ovarian tissue) (A); normal mammary tissues (B–D): cytoplasmic immunostaining intensity was strong in epithelial cells (HS: 9); benign tumors (E–H): cytoplasmic immunostaining intensity ranged from moderate to weak in neoplastic epithelial cells (HS: 6, 4, 3, 2); grade 1 malignant tumors (I–L): cytoplasmic immunostaining intensity decreased from moderate to weak (HS: 4, 3, 2, 2); grade 2 malignant tumors (M–P): cytoplasmic immunostaining intensity progressively decreased (HS: 4, 3, 2, 1); grade 3 malignant tumors (Q–T): cytoplasmic immunostaining intensity ranged from weak to none (HS: 1, 0, 0, 0). Scale bar: 50 μm.
Figure 2.
Immunohistochemical analysis of follicle-stimulating hormone receptor (FSHR) expression in canine mammary tissues. Positive control (canine ovarian tissue) (A); normal mammary tissues (B–D): cytoplasmic immunostaining intensity was strong in epithelial cells (HS: 9); benign tumors (E–H): cytoplasmic immunostaining intensity ranged from moderate to weak in neoplastic epithelial cells (HS: 6, 4, 3, 2); grade 1 malignant tumors (I–L): cytoplasmic immunostaining intensity decreased from moderate to weak (HS: 4, 3, 2, 2); grade 2 malignant tumors (M–P): cytoplasmic immunostaining intensity progressively decreased (HS: 4, 3, 2, 1); grade 3 malignant tumors (Q–T): cytoplasmic immunostaining intensity ranged from weak to none (HS: 1, 0, 0, 0). Scale bar: 50 μm.
Figure 3.
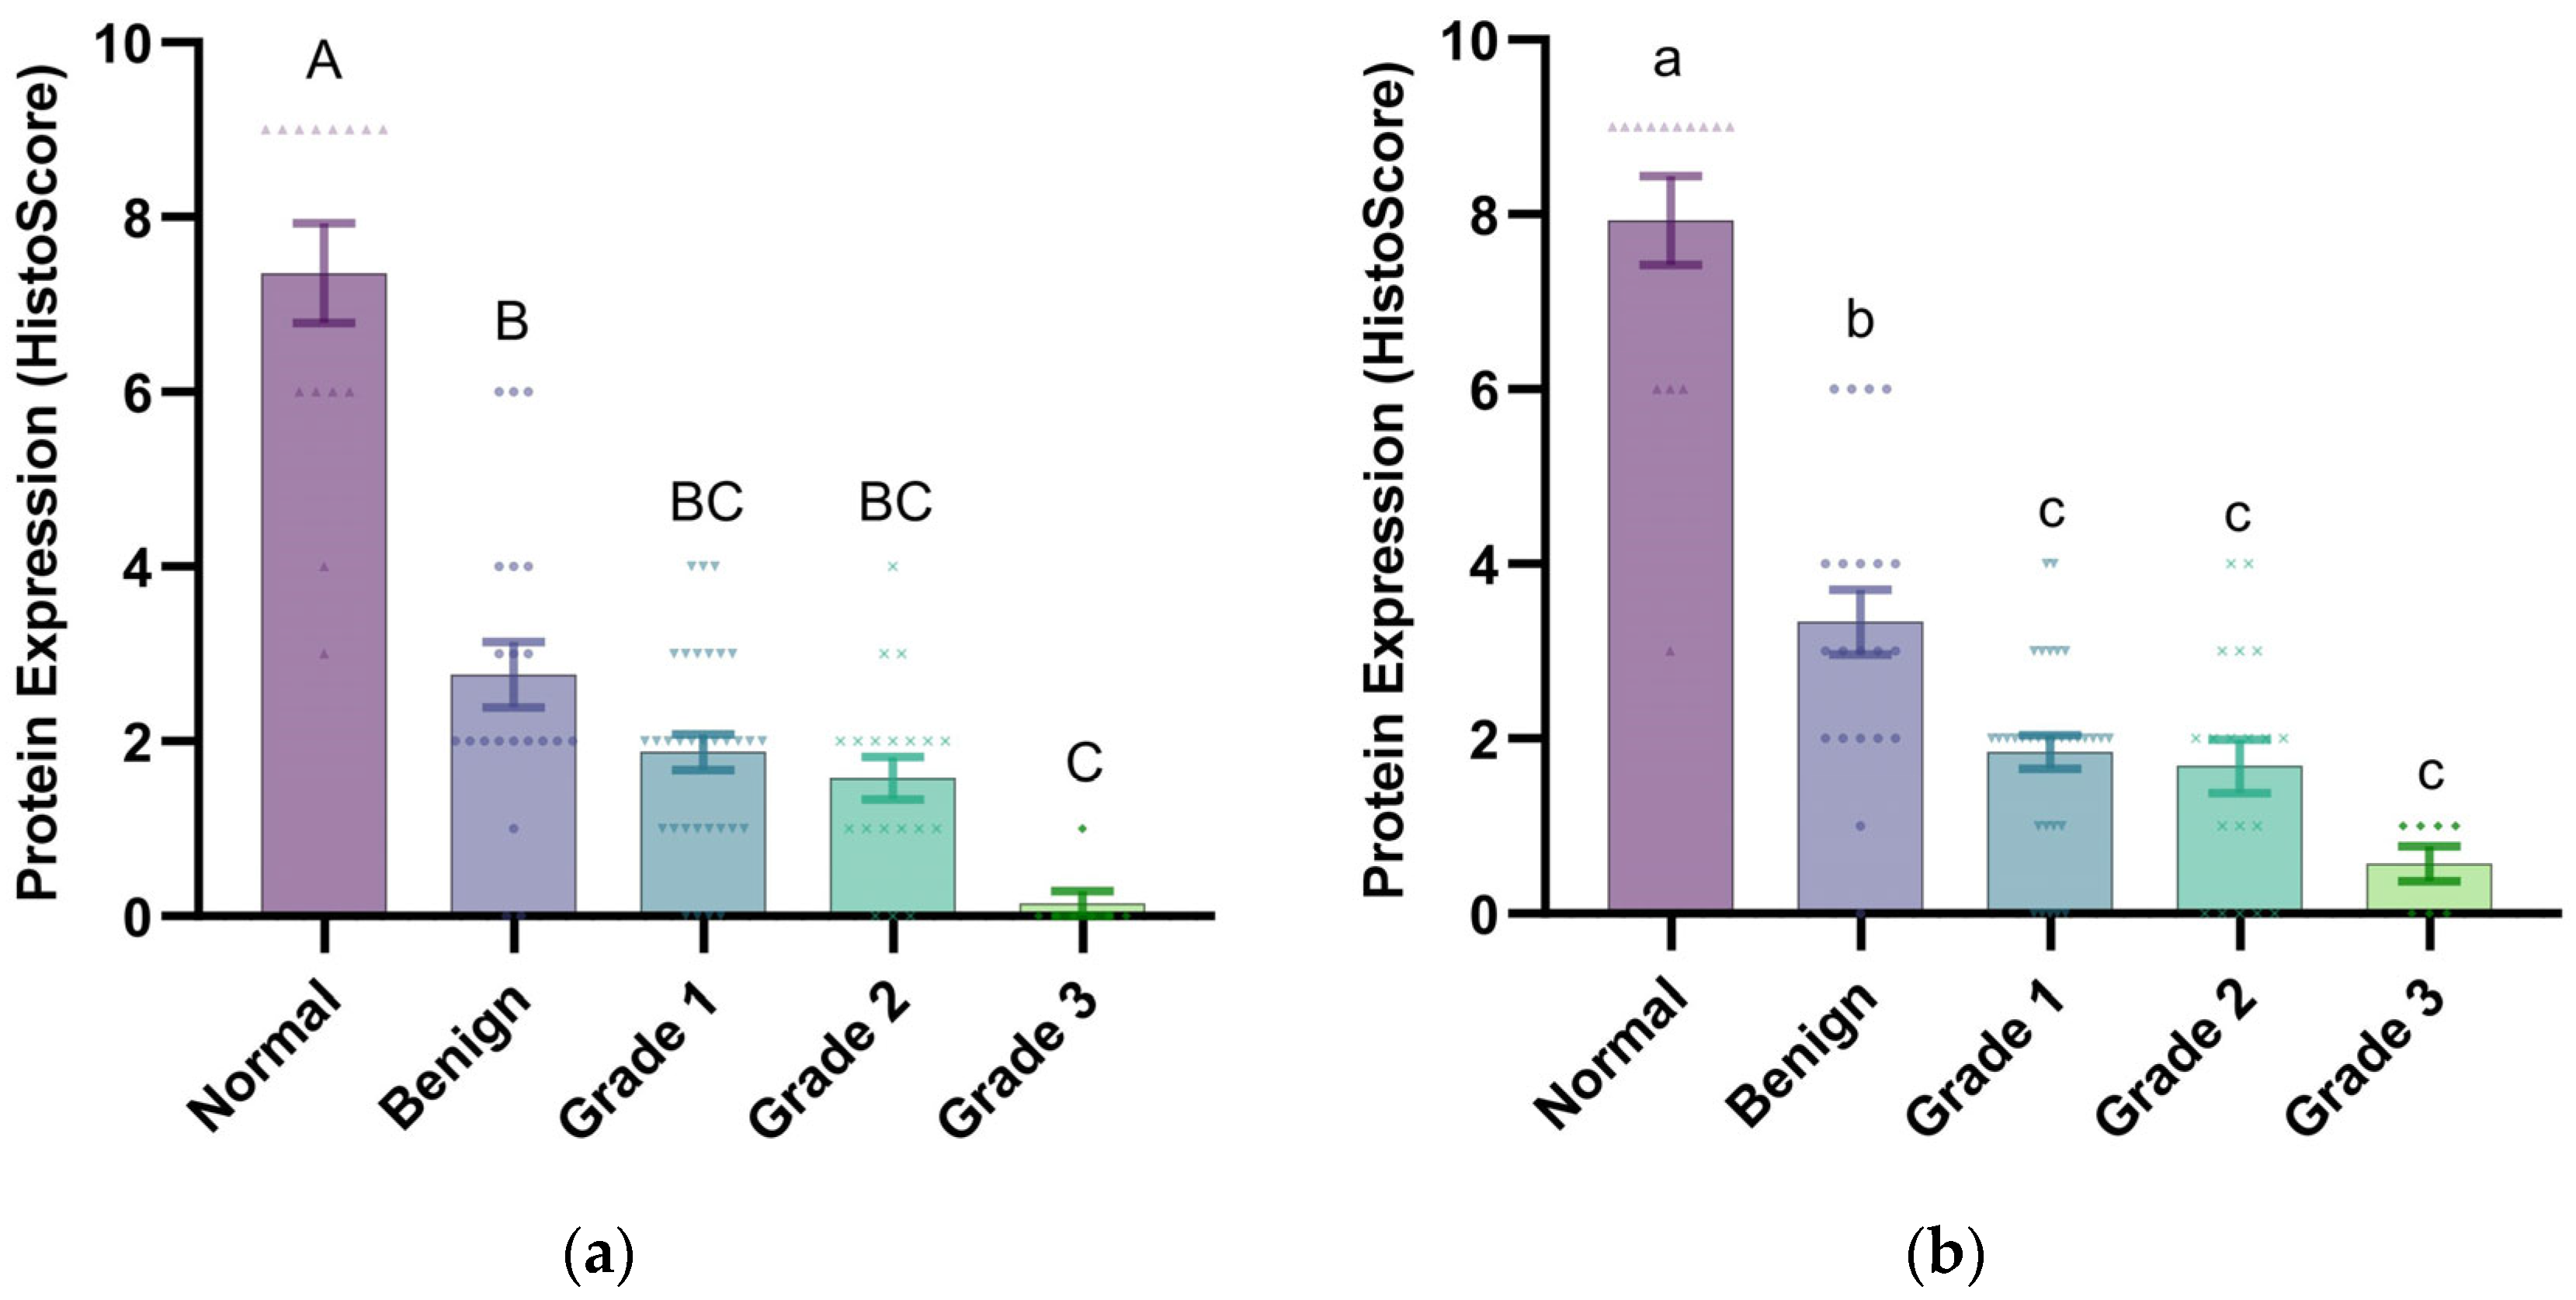
Expression levels of LHR and FSHR proteins in canine mammary tissues. (a) LHR histoscore: notable distinctions were identified among normal tissues, benign tumors, and malignant tumors (grades 1–3) (p < 0.01, uppercase letters A/B/C); (b) FSHR histoscore: notable distinctions were identified among normal tissues, benign tumors, and malignant tumors (grades 1–3) (p < 0.05, lowercase letters a/b/c). Data points represent individual samples, with distinct marker shapes indicating tissue types: normal mammary tissues (▲, n = 14), benign mammary tumors (●, n = 21), grade 1 mammary tumors (▼, n = 32), grade 2 mammary tumors (✖, n = 19), and grade 3 mammary tumors (◆, n = 7).
Figure 3.
Expression levels of LHR and FSHR proteins in canine mammary tissues. (a) LHR histoscore: notable distinctions were identified among normal tissues, benign tumors, and malignant tumors (grades 1–3) (p < 0.01, uppercase letters A/B/C); (b) FSHR histoscore: notable distinctions were identified among normal tissues, benign tumors, and malignant tumors (grades 1–3) (p < 0.05, lowercase letters a/b/c). Data points represent individual samples, with distinct marker shapes indicating tissue types: normal mammary tissues (▲, n = 14), benign mammary tumors (●, n = 21), grade 1 mammary tumors (▼, n = 32), grade 2 mammary tumors (✖, n = 19), and grade 3 mammary tumors (◆, n = 7).
Figure 4.
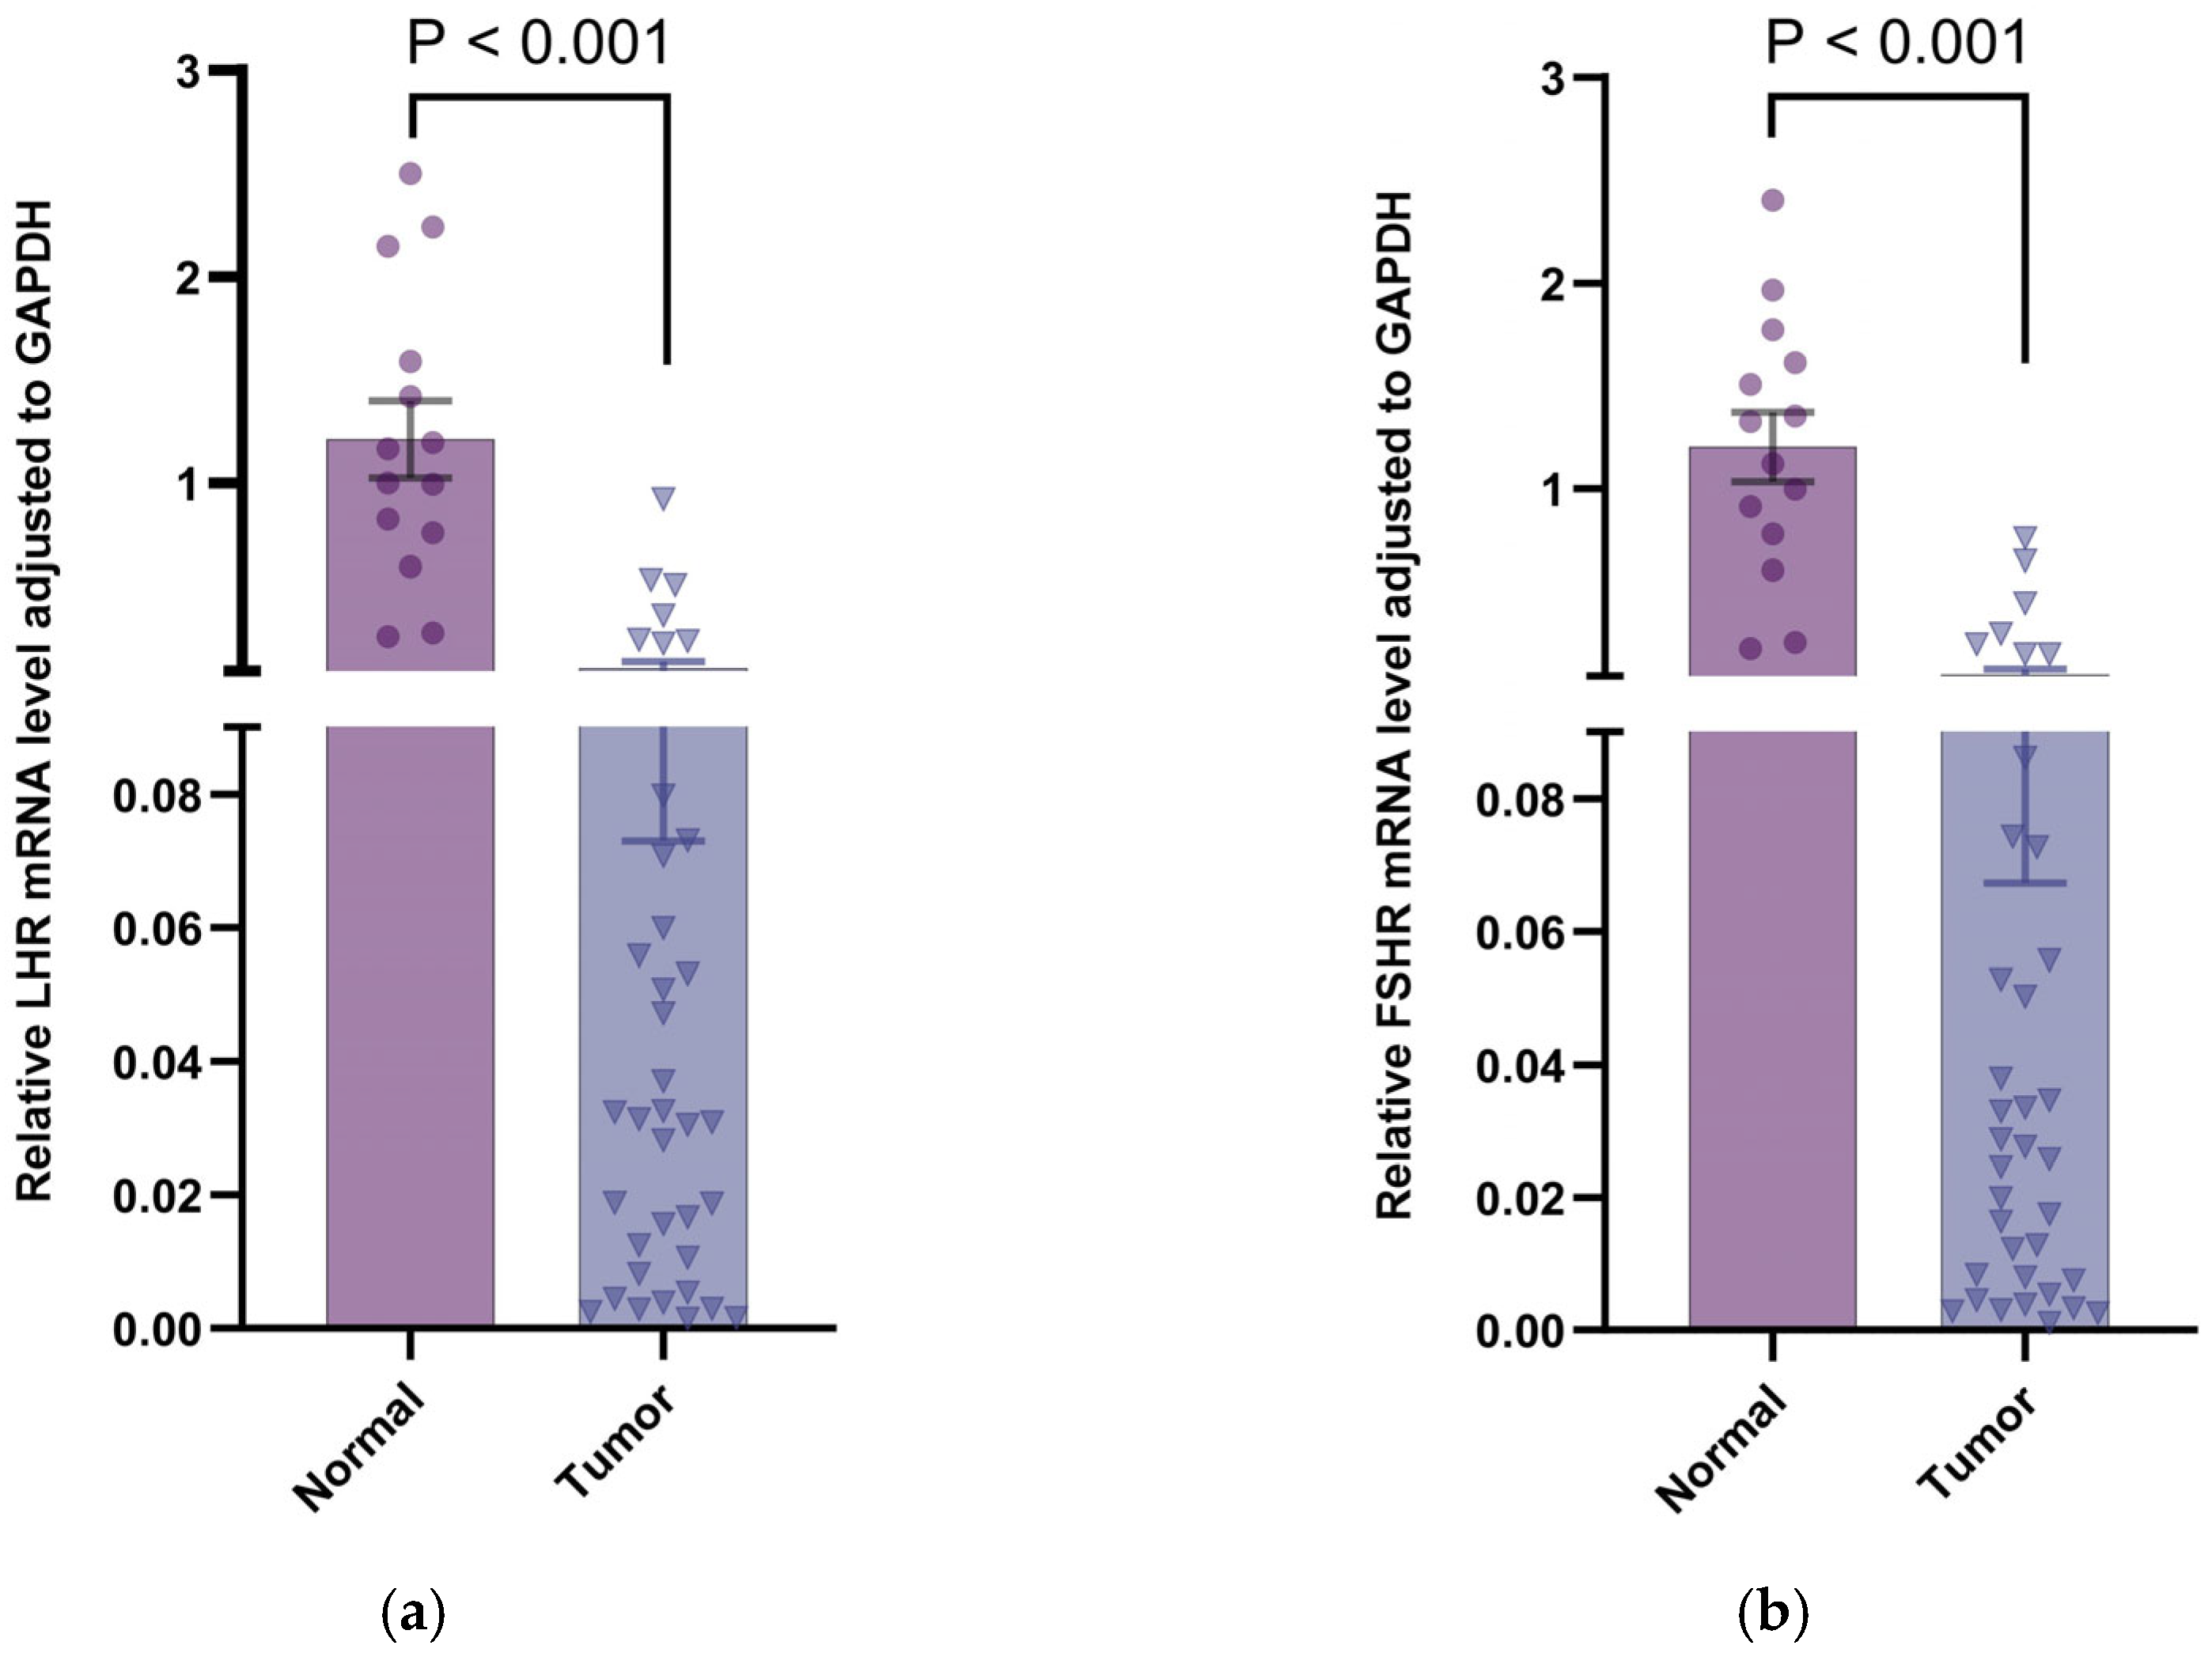
Relative mRNA expression of gonadotropin receptor in canine mammary tissues. (a) LHR mRNA expression normalized to GAPDH: a marked reduction in expression was observed in tumor tissues relative to normal counterparts (p < 0.001); (b) FSHR mRNA expression normalized to GAPDH: a marked reduction in expression was observed in tumor tissues relative to normal counterparts (p < 0.001). Data points represent individual samples, with distinct marker shapes indicating tissue types: normal mammary tissues (●, n = 14), mammary tumor tissues (▼, n = 37).
Figure 4.
Relative mRNA expression of gonadotropin receptor in canine mammary tissues. (a) LHR mRNA expression normalized to GAPDH: a marked reduction in expression was observed in tumor tissues relative to normal counterparts (p < 0.001); (b) FSHR mRNA expression normalized to GAPDH: a marked reduction in expression was observed in tumor tissues relative to normal counterparts (p < 0.001). Data points represent individual samples, with distinct marker shapes indicating tissue types: normal mammary tissues (●, n = 14), mammary tumor tissues (▼, n = 37).
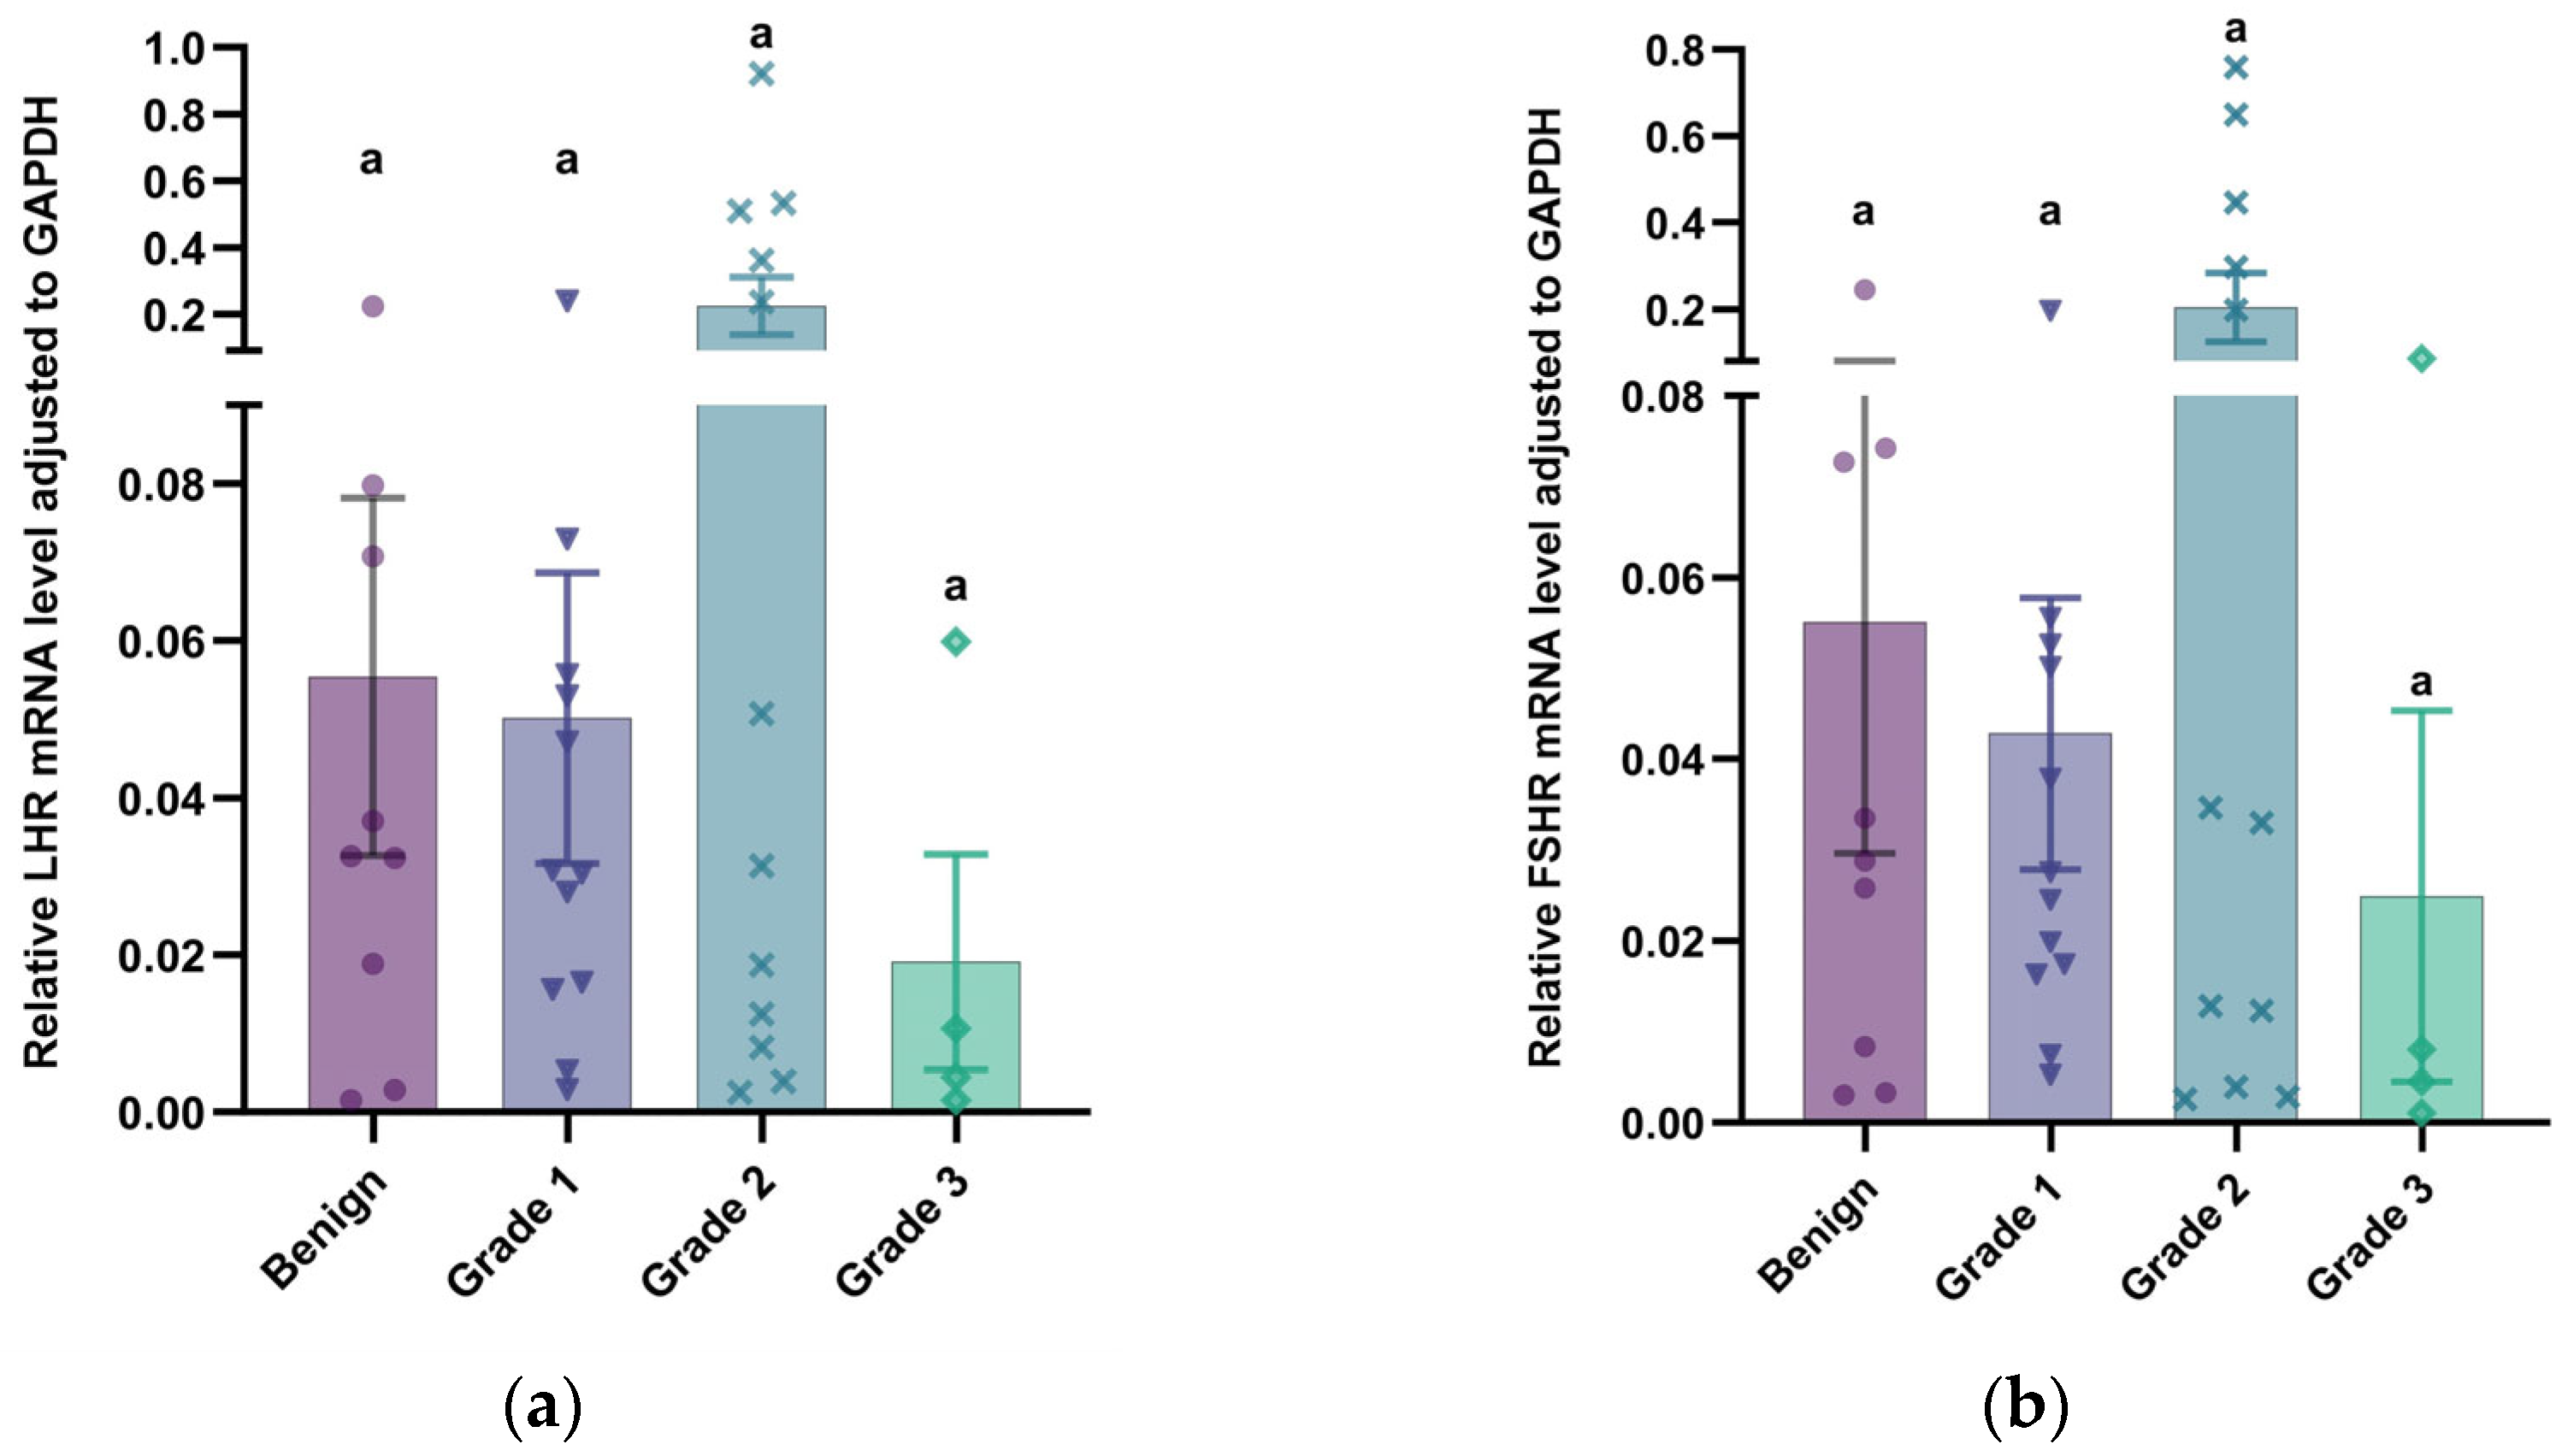
Figure 5.
Relative mRNA expression of gonadotropin receptor in canine mammary tumors. (a) LHR mRNA expression normalized to GAPDH in benign tumors and malignant mammary tumors (grades 1–3). Statistical comparisons between any groups showed nonsignificant divergence (p > 0.05); (b) FSHR mRNA expression normalized to GAPDH in benign tumors and malignant mammary tumors (grades 1–3). Statistical comparisons between the groups showed nonsignificant divergence (p > 0.05, lowercase letter a). Data points represent individual samples, with distinct marker shapes indicating tissue types: benign mammary tumors (●, n = 9), grade 1 mammary tumors (▼, n = 12), grade 2 mammary tumors (✖, n = 12), and grade 3 mammary tumors (◆, n = 4).
Table 1.
Primer sequences utilized for the measurement of mRNA synthesis via real-time RT-PCR.
Table 1.
Primer sequences utilized for the measurement of mRNA synthesis via real-time RT-PCR.
| Gene Symbol | Gene Name | Primer Sequence (5′→3′) | Amplicon Length (bp) | Accession Number | Reference |
|---|
| GAPDH | Glyceraldehyde 3-phosphate dehydrogenase | F: CTGAACGGGAAGCTCACTGG | 220 | NP 001003142.2 | Adapted from [26] |
| R: CGTCGAAGGTGGAAGAGTGG |
| LHR | Luteinizing hormone receptor | F: AAACCAAAGGCCAGTATTATAACCA | 78 | XP 038534822.1 | Adapted from [8] |
| R: AGTGAAAAAGCCAGCTGCACTAC |
| FSHR | Follicle-stimulating hormone receptor | F: ATTAGCATCCTGGCCATCAC | 122 | XM_014117520.1 | Adapted from [27] |
| R: CCAATGCAGAGATCAGCAAA |
Table 2.
Information of dogs with mammary tumors.
Table 2.
Information of dogs with mammary tumors.
| | Total (n = 59) | Intact (n = 43) | Spayed (n = 16) |
|---|
| Age of case (y) | | | |
| Range | 4.00–16.00 | 5.00–16.00 | 4.00–15.00 |
| Mean ± SEM | 10.29 ± 0.37 | 9.79 ± 0.40 | 11.66 ± 0.77 |
| Breed | | | |
| Poodle | 33 (55.9%) | 27 (62.8%) | 6 (37.5%) |
| Mixed breed | 9 (15.3%) | 6 (14.0%) | 3 (18.8%) |
| Bichon Frise | 5 (8.5%) | 5 (11.6%) | 0 |
| Pomeranian | 2 (3.4%) | 1 (2.3%) | 1 (6.3%) |
| Siberian Husky | 2 (3.4%) | 0 | 2 (12.5%) |
| Border Collie | 1 (1.7%) | 0 | 1 (6.3%) |
| German Shepherd | 1 (1.7%) | 1 (2.3%) | 0 |
| Golden Retriever | 1 (1.7%) | 1 (2.3%) | 0 |
| Corgi | 1 (1.7%) | 1 (2.3%) | 0 |
| Labrador Retriever | 1 (1.7%) | 1 (2.3%) | 0 |
| Rottweiler | 1 (1.7%) | 0 | 1 (6.3%) |
| Samoyed | 1 (1.7%) | 0 | 1 (6.3%) |
| Japanese Spitz | 1 (1.7%) | 0 | 1 (6.3%) |
| Tumor size 1 | | | |
| T1 | 30 (50.8%) | 21 (48.8%) | 9 (56.3%) |
| T2 | 18 (30.5%) | 16 (37.2%) | 2 (12.5%) |
| T3 | 11 (18.6%) | 6 (15.0%) | 5 (31.3%) |
| Lymphatic invasion 2 | | | |
| N0 | 53 (89.8%) | 39 (90.7%) | 14 (87.5%) |
| N1 | 6 (10.2%) | 4 (9.3%) | 2 (12.5%) |
| Distant metastases 3 | | | |
| M0 | 54 (91.5%) | 40 (93.0%) | 14 (87.5%) |
| M1 | 5 (8.5%) | 3 (7.0%) | 2 (12.5%) |
| Clinical stage 4 | | | |
| I | 28 (47.5%) | 19 (44.2%) | 9 (56.3%) |
| II | 14 (23.7%) | 13 (30.2%) | 1 (6.3%) |
| III | 7 (11.9%) | 4 (9.3%) | 3 (18.8%) |
| IV | 5 (8.5%) | 4 (9.3%) | 1 (6.3%) |
| V | 5 (8.5%) | 3 (7.0%) | 2 (12.5%) |
| Histological type | | | |
| Benign | 8 (13.6%) | 6 (14.0%) | 2 (12.5%) |
| Malignant | 51 (86.4%) | 37 (86.0%) | 14 (87.5%) |
| Grade 1 | 26 (44.1%) | 18 (41.9%) | 8 (50.0%) |
| Grade 2 | 18 (30.5%) | 14 (32.6%) | 4 (25.0%) |
| Grade 3 | 7 (11.9%) | 5 (11.6%) | 2 (12.5%) |
Table 3.
Histological subtypes of tumor samples.
Table 3.
Histological subtypes of tumor samples.
| Histologic Subtype | Total (n = 79) | Intact (n = 53) | Spayed (n = 26) |
|---|
| Benign tumor | 21 (26.6%) | 12 (22.6%) | 9 (34.6%) |
| Benign mixed tumor | 10 (12.7%) | 6 (11.3%) | 4 (15.4%) |
| Complex adenoma | 8 (10.1%) | 6 (11.3%) | 2 (7.7%) |
| Simple adenoma | 3 (3.8%) | 0 | 3 (11.5%) |
| Malignant tumor | 58 (73.4%) | 41 (77.4%) | 17 (65.4%) |
| Mixed carcinoma | 15 (19.0%) | 13 (24.5%) | 2 (7.7%) |
| Complex carcinoma | 12 (15.2%) | 10 (18.9%) | 2 (7.7%) |
| Simple carcinoma | 7 (8.9%) | 5 (9.4%) | 2 (7.8%) |
| Intraductal papillary carcinoma | 7 (8.9%) | 5 (9.4%) | 2 (7.9%) |
| Tubular carcinoma | 5 (6.3%) | 3 (5.7%) | 2 (7.10%) |
| Ductal carcinoma | 4 (5.1%) | 2 (3.8%) | 2 (7.11%) |
| Carcinoma with malignant myoepithelioma | 2 (2.5%) | 1 (1.9%) | 1 (3.8%) |
| Solid carcinoma | 2 (2.5%) | 1 (1.9%) | 1 (3.8%) |
| Malignant spindle cell tumor | 1 (1.3%) | 0 | 1 (3.8%) |
| Carcinoma arising in a benign mixed tumor | 1 (1.3%) | 0 | 1 (3.8%) |
| Comedocarcinoma | 1 (1.3%) | 0 | 1 (3.8%) |
| Micropapillary invasive carcinoma | 1 (1.3%) | 1 (1.9%) | 0 |
Table 4.
Histopathological classification, spay status of bitch, and malignancy grade of immunohistochemistry samples.
Table 4.
Histopathological classification, spay status of bitch, and malignancy grade of immunohistochemistry samples.
| Histological Type | Number of Immunohistochemistry Samples |
|---|
| Total [Grade 1, 2, 3] | Intact [Grade 1, 2, 3] | Spayed [Grade 1, 2, 3] |
|---|
| Benign tumor | 21 | 12 | 9 |
| Benign mixed tumor | 10 | 6 | 4 |
| Complex adenoma | 8 | 6 | 2 |
| Simple adenoma | 3 | 0 | 3 |
| Malignant tumor | 58 | 41 | 17 |
| Mixed carcinoma | 15 (11, 4, 0) | 13 (9, 4) | 2 (2, 0, 0) |
| Complex carcinoma | 12 (7, 5, 0) | 10 (5, 5, 0) | 2( 2, 0, 0) |
| Simple carcinoma | 7 (2, 3, 2) | 5 (0, 3, 2) | 2 (2, 0, 0) |
| Intraductal papillary carcinoma | 7 (6, 1, 0) | 5 (4, 1, 0) | 2 (2, 0, 0) |
| Tubular carcinoma | 5 (2, 3, 0) | 3 (1, 2, 0) | 2 (1, 1, 0) |
| Ductal carcinoma | 4 (3, 1, 0) | 2 (2, 0, 0) | 2 (1, 1, 0) |
| Carcinoma with malignant myoepithelioma | 2 (0, 0, 2) | 1 (0, 0, 1) | 1 (0, 0, 1) |
| Solid carcinoma | 2 (0, 1, 1) | 1 (0, 0, 1) | 1 (0, 1, 0) |
| Malignant spindle cell tumor | 1 (0, 1, 0) | 0 | 1 (0, 1, 0) |
| Carcinoma arising in a benign mixed tumor | 1 (1, 0, 0) | 0 | 1 (1, 0, 0) |
| Comedocarcinoma | 1 (0, 0, 1) | 0 | 1 (0, 0, 1) |
| Micropapillary invasive carcinoma | 1 (0, 0, 1) | 1 (0, 0, 1) | 0 |
Table 5.
LHR/FSHR immunohistochemical expression in neoplastic and normal mammary tissues.
Table 5.
LHR/FSHR immunohistochemical expression in neoplastic and normal mammary tissues.
| | Number of Samples | PS 1 (LHR) | IS 2 (LHR) | HS 3 (LHR) | PS (FSHR) | IS (FSHR) | HS (FSHR) |
|---|
| Normal mammary tissue | 14 | 64.06 ± 6.09 | 2.79 ± 0.11 | 7.36 ± 0.57 | 65.24 ± 6.74 | 3.00 ± 0.00 | 7.93 ± 0.51 |
| Mammary tumor | 79 | 37.12 ± 3.01 | 1.23 ± 0.06 | 1.89 ± 0.16 | 38.20 ± 2.88 | 1.48 ± 0.07 | 2.09 ± 0.17 |
| Benign tumor | 21 | 44.91 ± 6.32 | 1.62 ± 0.11 | 2.76 ± 0.38 | 47.10 ± 5.18 | 1.67 ± 0.13 | 3.33 ± 0.37 |
| Malignant tumor | 58 | 34.30 ± 3.37 | 1.16 ± 0.06 | 1.57 ± 0.16 | 34.97 ± 3.37 | 1.41 ± 0.09 | 1.64 ± 0.16 |
| Grade 1 | 32 | 41.77 ± 4.77 | 1.25 ± 0.08 | 1.88 ± 0.20 | 40.80 ± 4.43 | 1.31 ± 0.09 | 1.84 ± 0.19 |
| Grade 2 | 19 | 30.45 ± 4.87 | 1.16 ± 0.09 | 1.58 ± 0.25 | 33.53 ± 6.12 | 1.68 ± 0.19 | 1.68 ± 0.31 |
| Grade 3 | 7 | 10.61 ± 4.37 | 0.71 ± 0.18 | 0.14 ± 0.14 | 12.23 ± 3.62 | 1.14 ± 0.14 | 0.57 ± 0.20 |
Table 6.
LHR/FSHR immunohistochemistry in mammary tumors across spay status (PS, IS, HS).
Table 6.
LHR/FSHR immunohistochemistry in mammary tumors across spay status (PS, IS, HS).
| | Intact (a) | Spayed (b) | p (a vs. b) |
|---|
| Number of samples | 53 | 26 | |
| PS (LHR) | 35.41 ± 3.82 | 40.62 ± 4.84 | 0.298 |
| IS (LHR) | 1.25 ± 0.07 | 1.35 ± 0.10 | 0.478 |
| HS (LHR) | 1.66 ± 0.19 | 2.35 ± 0.28 | 0.033 |
| PS (FSHR) | 40.80 ± 3.65 | 32.90 ± 4.52 | 0.286 |
| IS (FSHR) | 1.51 ± 0.10 | 1.423 ± 0.10 | 0.905 |
| HS (FSHR) | 2.13 ± 0.21 | 2.00 ± 0.31 | 0.456 |
Table 7.
Histopathological classification, spay status of bitch, and malignancy grade of qRT-PCR samples.
Table 7.
Histopathological classification, spay status of bitch, and malignancy grade of qRT-PCR samples.
| Histological Type | Number of qRT-PCR Samples |
|---|
| Total [Grade 1, 2, 3] | Intact [Grade 1, 2, 3] | Spayed [Grade 1, 2, 3] |
|---|
| Benign tumor | 9 | 9 | 0 |
| Benign mixed tumor | 5 | 5 | 0 |
| Complex adenoma | 4 | 4 | 0 |
| Malignant tumor | 28 (12, 12, 4) | 24 (11, 10, 3) | 4 (1, 2, 1) |
| Mixed carcinoma | 9 (6, 3, 0) | 9 (6, 3, 0) | 0 |
| Complex carcinoma | 5 (3, 2, 0) | 5 (3, 2, 0) | 0 |
| Simple carcinoma | 5 (1, 2, 2) | 4 (0, 2, 2) | 1 (1, 0, 0) |
| Intraductal papillary carcinoma | 3 (2, 1, 0) | 3 (2, 1, 0) | 0 |
| Tubular carcinoma | 3 (0, 3, 0) | 2 (0, 2, 0) | 1 (0, 1, 0) |
| Carcinoma with malignant myoepithelioma | 1 (0, 0, 1) | 1 (0, 0, 1) | 0 |
| Solid carcinoma | 1 (0, 1, 0) | 0 | 1 (0, 1, 0) |
| Comedocarcinoma | 1 (0, 0, 1) | 0 | 1 (0, 0, 1) |


