Article

16S rRNA Gene Amplicon Sequencing of Gut Microbiota Affected by Four Probiotic Strains in Mice

College of Veterinary Medicine, Qingdao Agricultural University, Qingdao 266109, China
*
Author to whom correspondence should be addressed.
These authors contributed equally to this work.
Vet. Sci. 2023, 10(4), 288; https://doi.org/10.3390/vetsci10040288
Submission received: 23 February 2023 / Revised: 23 March 2023 / Accepted: 11 April 2023 / Published: 12 April 2023

Abstract

:

Simple Summary

The overuse of antibiotics has led to an increase in resistant bacteria and unnecessary culture contamination. As one of the best green pollution-free antibiotics, probiotics and their preparations have become research hotspots. The different effects of different probiotics on gut microbiota are still unclear. In this study, the gut microbiota of mice treated with Lactobacillus acidophilus, Lactobacillus plantarum, Bacillus subtilis and Enterococcus faecalis for 14 days was assessed used 16S amplificon sequencing. The results showed that the four probiotics caused changes in the composition and structure of the gut microbiota in mice, but they did not cause changes in the diversity of the gut microbiota. These results provide a strong basis for the preparation of probiotics and theory regarding their targets.

Abstract

Probiotics, also referred to as “living microorganisms,” are mostly present in the genitals and the guts of animals. They can increase an animal’s immunity, aid in digestion and absorption, control gut microbiota, protect against sickness, and even fight cancer. However, the differences in the effects of different types of probiotics on host gut microbiota composition are still unclear. In this study, 21-day-old specific pathogen-free (SPF) mice were gavaged with Lactobacillus acidophilus (La), Lactiplantibacillus plantarum (Lp), Bacillus subtilis (Bs), Enterococcus faecalis (Ef), LB broth medium, and MRS broth medium. We sequenced 16S rRNA from fecal samples from each group 14 d after gavaging. According to the results, there were significant differences among the six groups of samples in Firmicutes, Bacteroidetes, Proteobacteria, Bacteroidetes, Actinobacteria, and Desferribacter (p < 0.01) at the phylum level. Lactobacillus, Erysipelaceae Clostridium, Bacteroides, Brautella, Trichospiraceae Clostridium, Verummicroaceae Ruminococcus, Ruminococcus, Prevotella, Shigella, and Clostridium Clostridium differed significantly at the genus level (p < 0.01). Four kinds of probiotic changes in the composition and structure of the gut microbiota in mice were observed, but they did not cause changes in the diversity of the gut microbiota. In conclusion, the use of different probiotics resulted in different changes in the gut microbiota of the mice, including genera that some probiotics decreased and genera that some pathogens increased. According to the results of this study, different probiotic strains have different effects on the gut microbiota of mice, which may provide new ideas for the mechanism of action and application of microecological agents.

1. Introduction

The gut microbiota and the host complement each other and are indispensable in the intestinal tract of animals [1]. The gut microbiota is a microbial community formed when animals are born, and it is transmitted from the mother and subsequently influenced by the external environment [2]. In the gut of an animal, the gut microbiota is maintained in a balanced state. In such a balanced state, the microbial community interacts with each other and the host, so that the animal can maintain a healthy body condition [3]. The symbiotic interactions between resident microorganisms and the gastrointestinal tract significantly contribute to maintaining gut homeostasis. Disorder of the gut microbiota can cause a variety of host-related diseases [4], such as functional gastrointestinal diseases [5], intestinal infectious diseases [6], liver diseases [7], obesity and metabolic syndrome [8], diabetes mellitus [9], autism [10], etc.
There are many factors that can influence gut microbiota. Diet plays a key role in the regulation of gut microbiota composition. Different diets can cause different changes in the composition of gut microbiota [4]. Antibiotic use leads to long-term consequences such as reduced microbial diversity, disproportion, and increased expansion of the opportunistic pathogens Escherichia and Klebsiella [11]. With the entry of probiotics and prebiotics into the public eye, their potential role in reshaping the gut microbiota to enhance gut health has been gradually established [12]. Because of their green and pollution-free characteristics, they can be used as effective substitutes for antibiotics and have been widely used in the animal rearing industry. Probiotics can produce active substances that have positive effects on the host, promote digestion and nutrient absorption, regulate the gut microbiota, improve animal immunity, prevent and treat diseases, and even resist cancer [13]. Some probiotics can effectively inhibit the growth of pathogenic bacteria, promote gut peristalsis, stimulate the immune system, and strengthen the gut mucosal barrier in the gastrointestinal tract of animals [14].
As commonly used probiotics, Lactobacillus and its subspecies are widely used in food processing, preservation, and fermentation. Because most Lactobacillus have the biological characteristics of acid and bile salt tolerance, they can utilize their good characteristics in the intestine [15,16,17]. L. acidophilus and L. plantarum are currently widely used in food as safe probiotics [18,19]. B. subtilis [20] can produce spores, enabling it to tolerate gastric fluid and bile salts and have a probiotic effect in the gut. E. faecalis can tolerate relatively severe environments, such as pH 9.6 and high concentrations of salt, and is often used in fermented products [21]. Therefore, good stability will be maintained during the processing, storage, and transportation of probiotic preparations [22,23,24].
As for L. acidophilus, L. plantarum, B. subtilis, and E. Faecalis, which act as probiotics on the gut in the body, the differences in the effects on gut microbiota are still unclear. In this study, mice were orally gavaged with a fresh bacterial culture of four probiotics with specific concentrations, and changes in the gut microbiota of the mice were analyzed.

2. Materials and Methods

Table 1 shows the sources and storage locations of L. plantarum, L. acidophilus, B. subtilis, and E. faecalis; the Kunming mice (bought from Qingdao Daren Fucheng Co., Ltd., Qingdao, China) in this study were fifteen days old and pre-fed for one week (21 d old) for the test. The animal experiments performed in this study strictly followed the national guidelines for experimental animal welfare announced by the Ministry of Science and Technology of the People’s Republic of China in 2006 (Guiding Opinions on Kindly Treating Laboratory Animals. Relevant link: https://www.most.gov.cn/xxgk/xinxifenlei/fdzdgknr/fgzc/gfxwj/gfxwj2010before/201712/t20171222_137025.html (accessed on 3 April 2021)) and were approved by the Animal Welfare and Research Ethics Committee at Qingdao Agricultural University, Shandong, China (Approval NO: 2021-56). An LB broth medium and an MRS broth medium (Qingdao Haibo Biotechnology Co., Qingdao, China) were used in the study.
L. plantarum, L. acidophilus, B. subtilis, and E. faecalis were incubated for 6 h, 8 h, 10 h, 12 h, and 14 h. L. plantarum and L. acidophilus were incubated in a warm oven with an MRS broth, while B. subtilis and E. faecalis were incubated in a shaker with an LB broth at 180 rpm/min. The turbidity of each bacterium was measured at different incubation times (the turbidity was measured by a WGZ-XT intelligent bacterial turbidity meter, Hangzhou Qiwei Instrument Co., Hangzhou, China).
Thirty-six mice of approximately the same size and weight, eighteen males and eighteen females, were selected and divided equally into six groups.
Gavage was administered to each group of mice separately and continued for 14 d. L. plantarum (Lp) and L. acidophilus (La) were selected as the test groups where the MRS broth medium was selected as the control group (MRS). B. subtilis (Bs) and E. faecalis (Ef) were selected as the test groups where the LB broth medium (LB) was selected as the control group. Bacterial liquid and broths were administered in quantities of 0.1 mL/animal and gavage took place at 17:00 BST daily.
The experiment was conducted for 14 d, and at the end of the experiment, fresh feces from each group of mice were collected separately and transferred to a −80 °C freezer for storage.
Total microbial genomic DNA samples were extracted using an OMEGA Soil DNA Kit (D5625-01) (Omega Bio-Tek, Inc.; Norcross, GA, USA) following the manufacturer’s instructions, and they were stored at −20 °C prior to further assessment. The extracted DNA was determined in terms of quantity and quality using a NanoDrop ND-1000 spectrophotometer (Thermo Fisher Scientific, Waltham, MA, USA) and agarose gel electrophoresis, respectively.
The quality DNA was sent to Personal Biotechnology Co., Ltd. (Shanghai, China) for sequencing of the bacterial 16S V3V4 region.
Sequence quality control and splicing were performed using the DADA2 method. QIIME2(2019.4) and R software were used to analyze the taxonomic composition, α-diversity, and β-diversity of the samples.

3. Results

3.1. Bacterial Concentration Results

The results in Table 2 show that the colony concentration of L. plantarum and L. acidophilus still grew rapidly after 6 h of incubation. The proliferation of bacteria started to slow down after 8 h of incubation. The growth of B. subtilis and E. faecalis slowed down after 6 h of incubation. The proliferation of bacteria almost stopped after 8 h of incubation. In this study, the selected bacterial liquid was cultured for 8 h, and 0.1 mL was used, with the concentration of bacterial liquid being ≥108 CFU/mL.

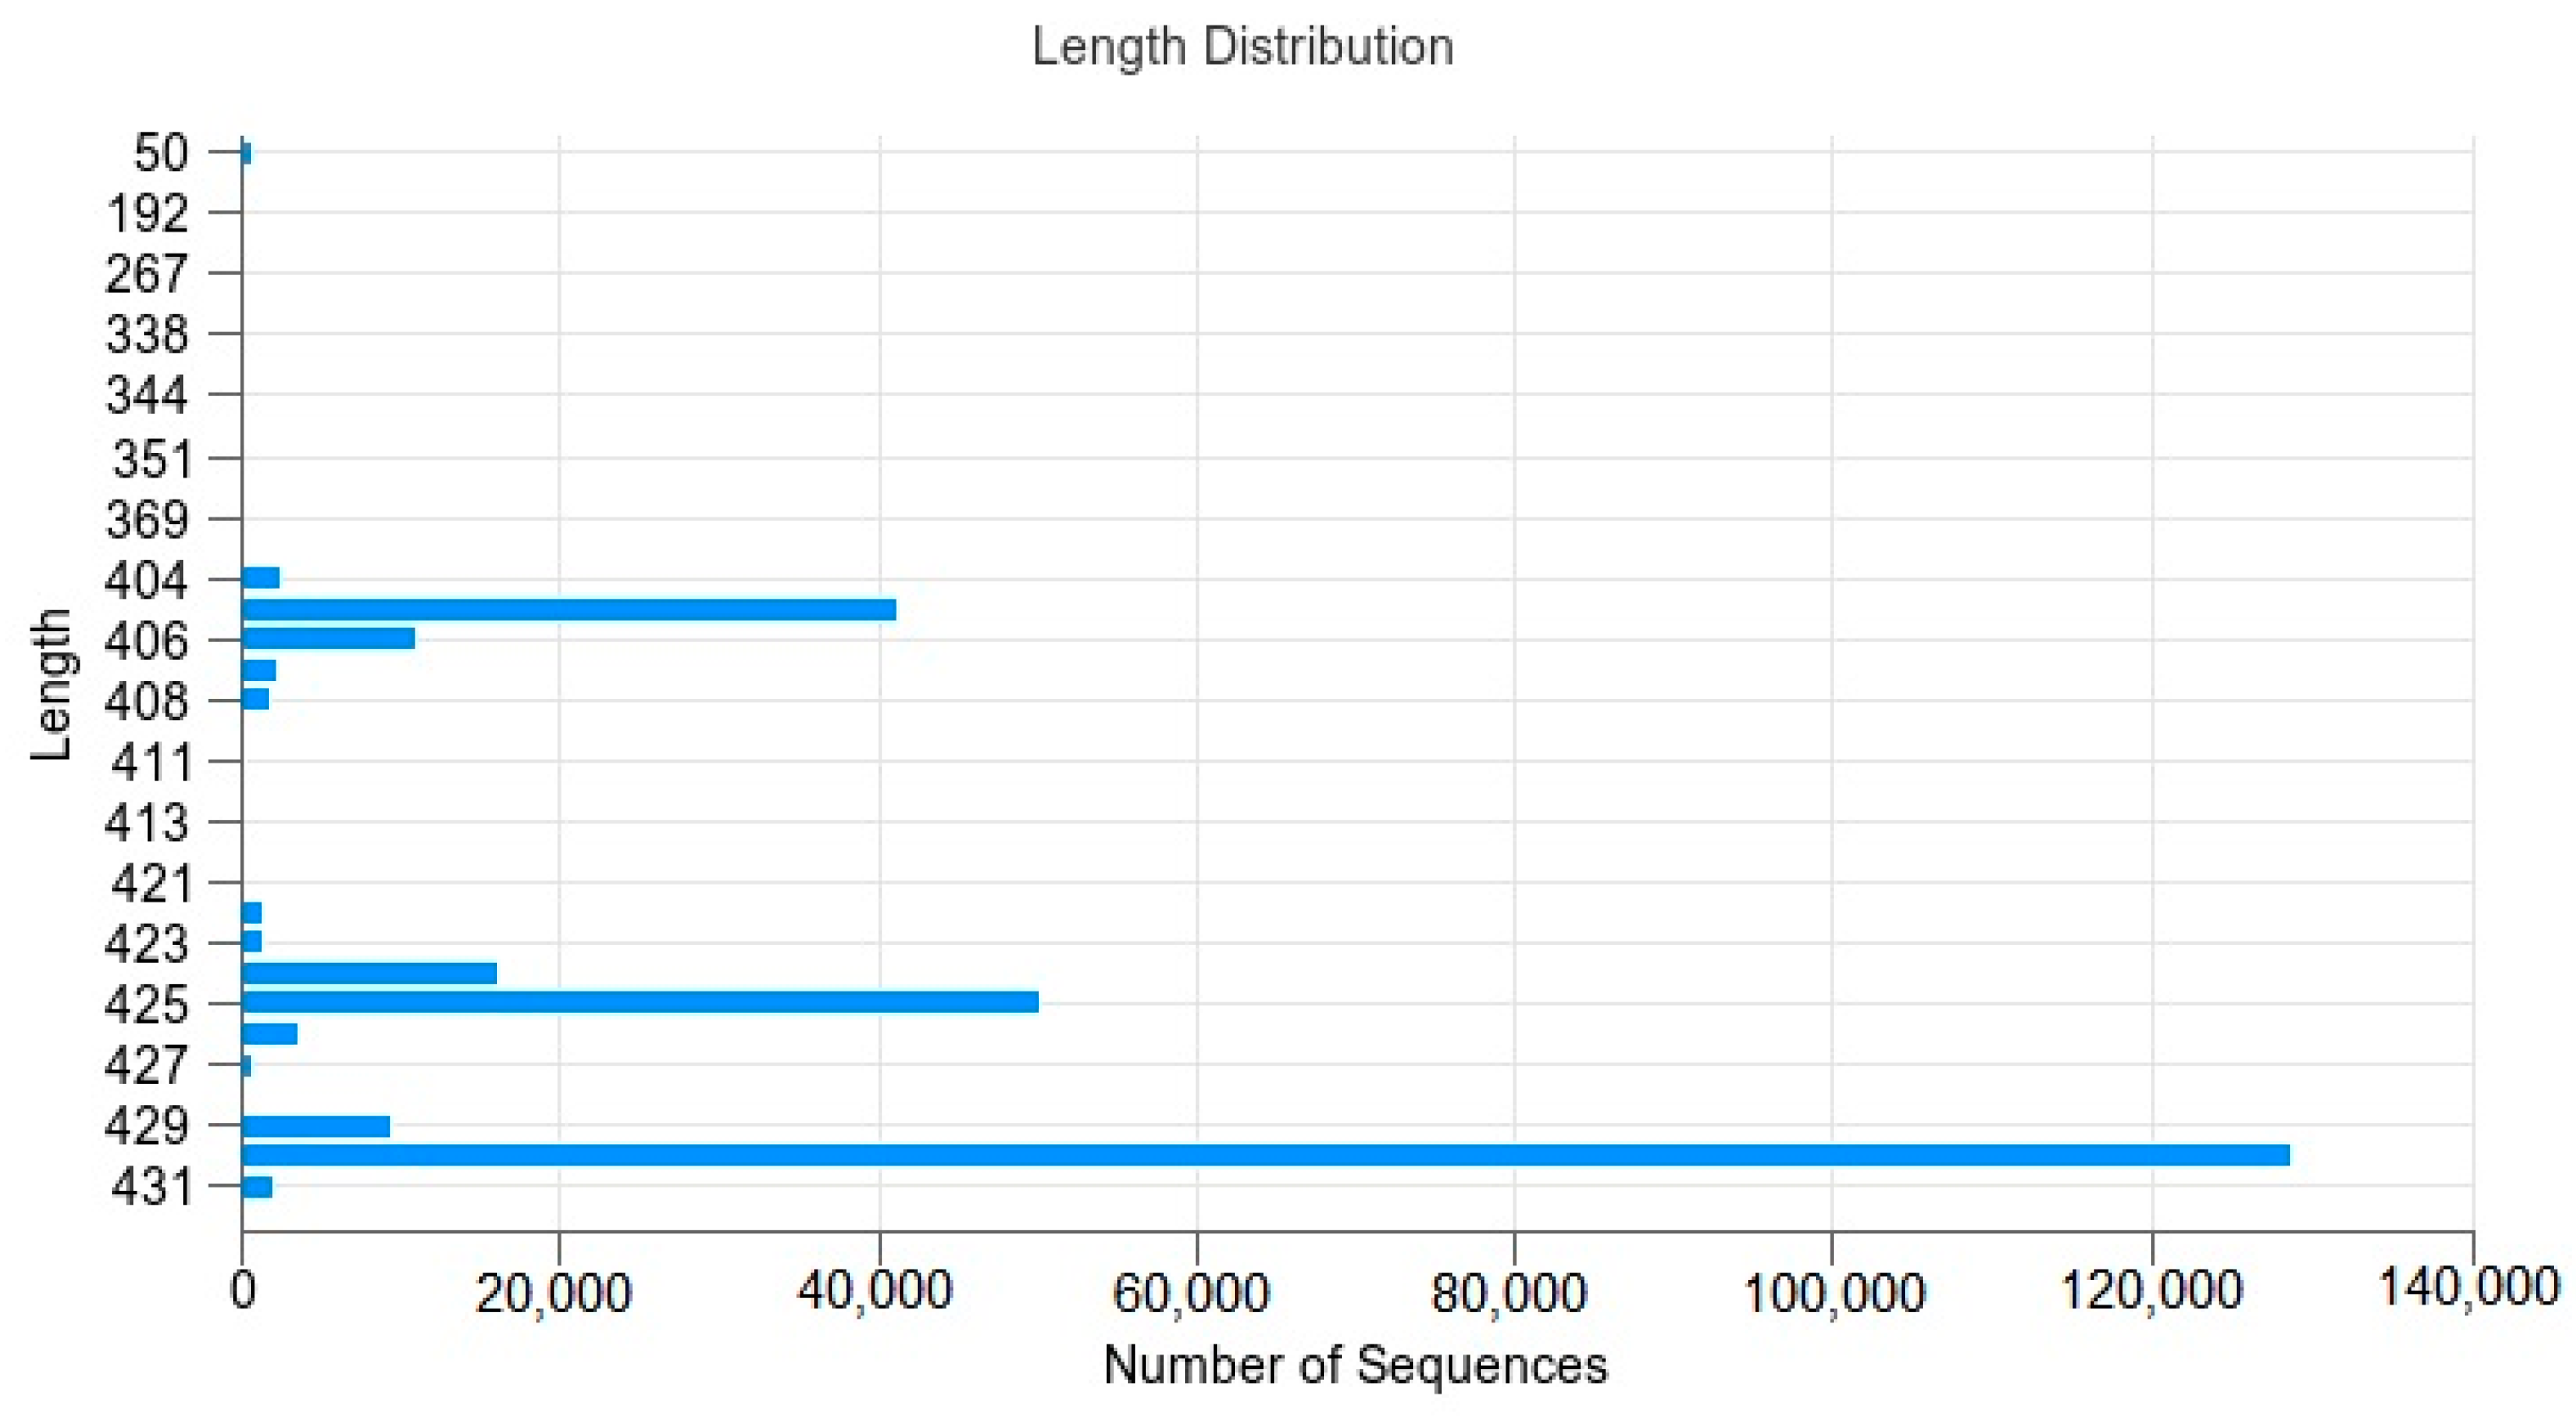
3.2. Sequence Processing

Table 3 shows the basic sequencing information of the six groups of samples in this study. The number of original sequences and the number of sequences after quality control and trimming were included. After quality control and denoising, the effective sequences obtained were as follows: La group 69,469; Lp group 119,571; MRS group 51,734; Bs group 52,800; Ef group 51,550; LB group 72,382. The number of sequences was as follows: La 63,712; Lp 109,512; MRS 47,739; Bs 50,650; Ef 47,408; LB 69,136. The amount of data after removing low-quality sequences were as follows: La group 44,755; Lp group 72,120; MRS group 34,229; Bs group 36,812; Ef group 36,800; LB group 49,334.
Figure 1 shows the distribution of sequences in the sample as well as their lengths.
The results show that the sequence lengths were mainly distributed as follows: 405 bp; 406 bp; 424 bp; 425 bp; 429 bp; 430 bp. The numbers were 41,115; 11,065; 16,081; 50,169; 9203; 128,783.

3.3. Four Probiotics Affect Gut Microbiota Diversity in Mice

As shown in Figure 2a, the mean number of OTUs annotated to the Lp and La groups was higher than the other groups; LB, as a control group for the Bs and Ef groups, contained the lowest number of OTUs (Figure 2a: petal plot Lp 2572; La 2452; MRS 1745; Bs 1214; Ef 929; LB 645). The specific composition of the microbial community in each sample at each taxonomic level could be obtained by counting the ASV/OTU after flat sampling, as shown in Figure 2b. In each of the six groups, different numbers of taxonomic units were detected. The La, Lp, and MRS groups contained 101, 151, and 131 taxonomic units, respectively; the Bs, Ef, and LB groups contained 80, 122, and 157 OTUs, respectively. Among them, the La group contained 6 phyla, 10 classes, 12 orders, 22 families, 29 genera, and 21 species. The Lp group contained 10 phyla, 17 classes, 20 orders, 35 families, 41 genera, and 27 species. There were 5 phyla, 12 classes, 15 orders, 31 families, 41 genera, and 26 species in the MRS Group. There were 7 phyla, 12 classes, 13 orders, 20 families, 17 genera, and 10 species in the Bs group. The Ef group contained 7 phyla, 12 classes, 13 orders, 24 families, 36 genera, and 30 species. The LB group contained 8 phyla, 15 classes, 21 orders, 36 families, 40 genera, and 36 species.

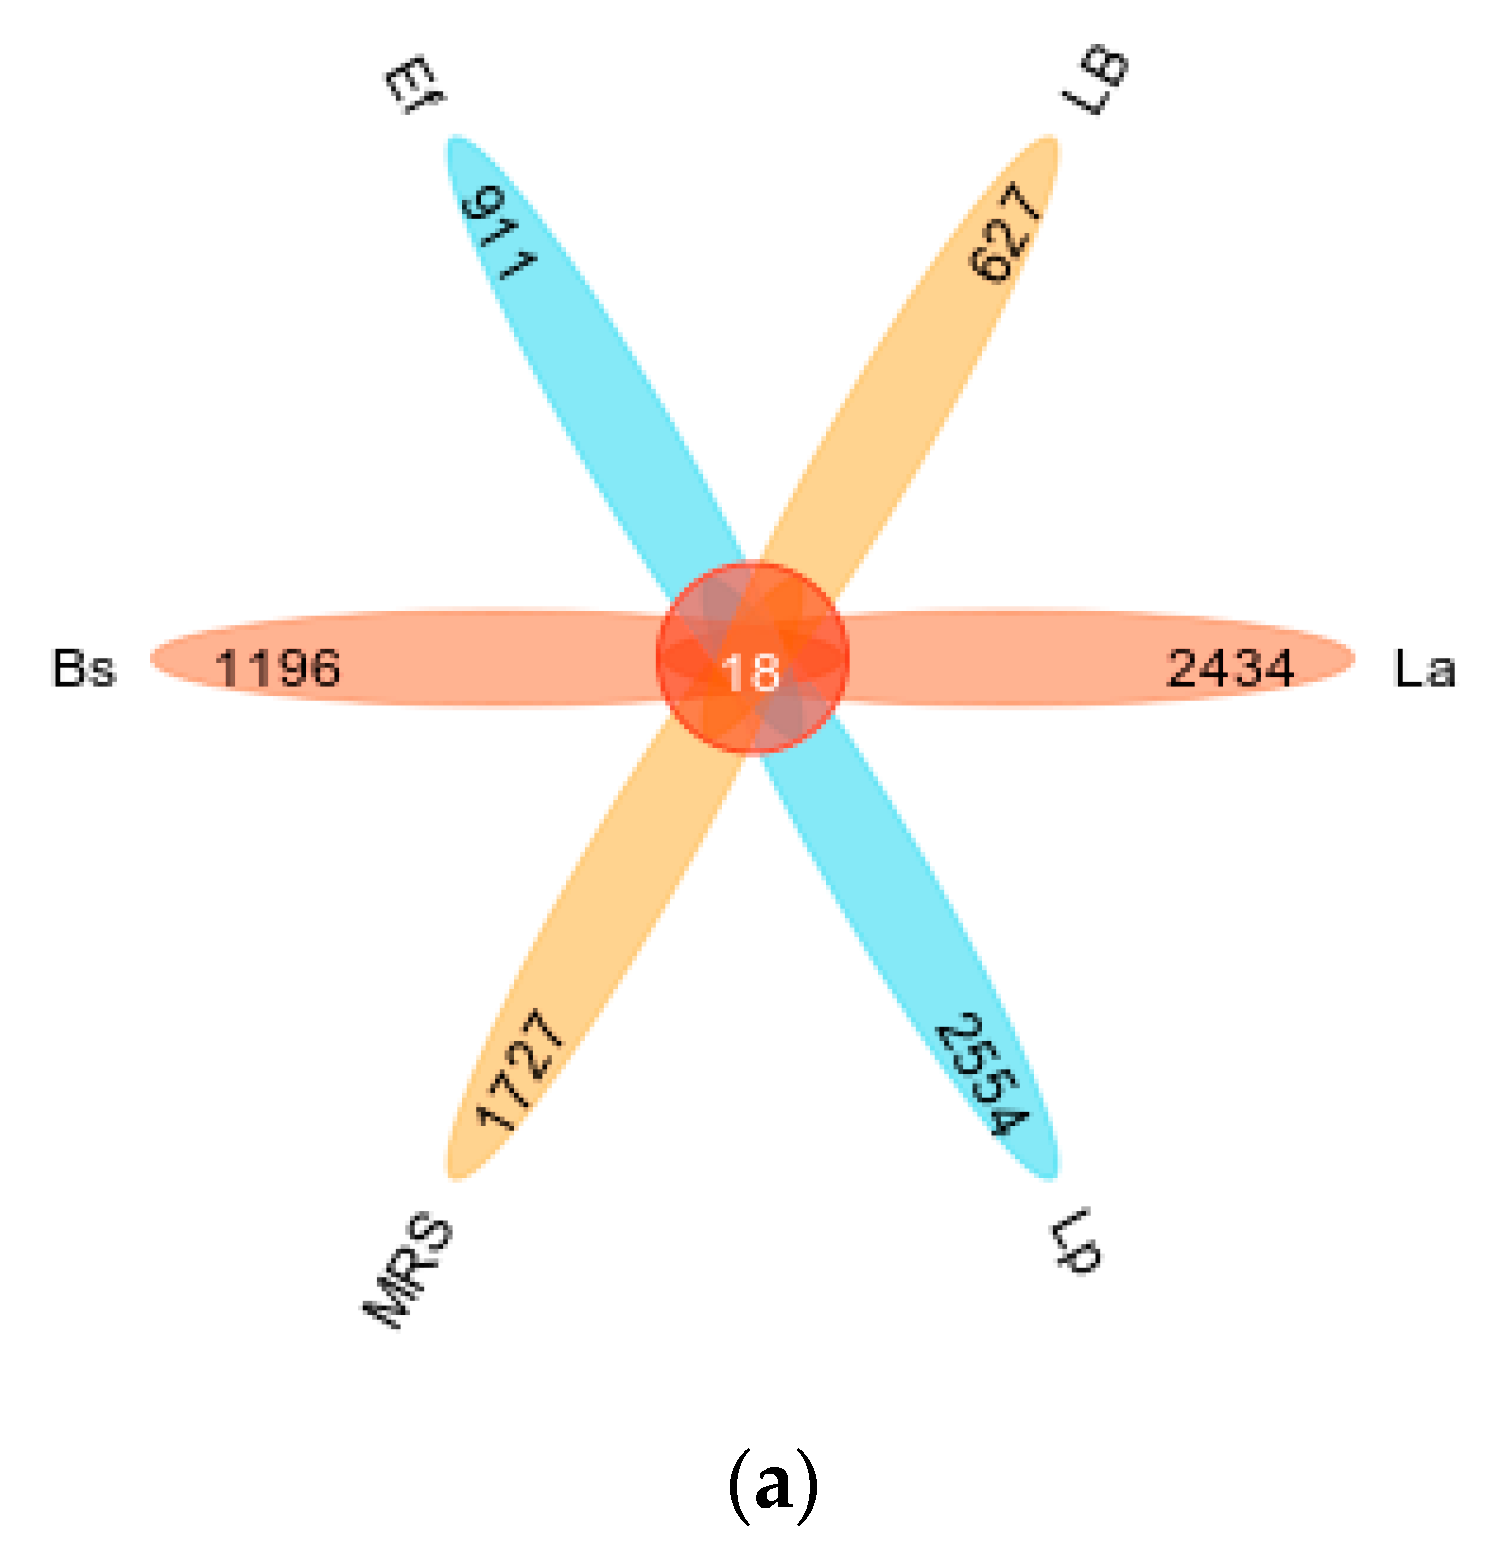
3.4. Four Probiotics Alter the Distribution of Gut Microbiota in Mice

To study the effects caused by the four probiotics on the gut microbiota in mice, the top ten species with relative proportions at the phylum level and the genus level were selected, and a small number of species were classified as other species to evaluate the distribution of gut microbiota composition in mice. The species composition at the phylum level is shown in Figure 3a. Firmicutes and Bacteroidetes were dominant in the La group, and Firmicutes and Proteobacteria were dominant in the Lp group. In addition, the proportion of Proteobacteria was significantly increased in the Lp group compared with the control MRS group (p < 0.01). Firmicutes and Bacteroidetes were dominant in the Bs group; Firmicutes, Bacteroidetes, and Proteobacteria were dominant in the Ef group. Compared with the control LB group, Firmicutes, Bacteroidetes, and Proteobacteria in the Bs and Ef groups did not change significantly (p > 0.05). A few Bacteroidetes, Actinobacteria, and Deferribacteria were detected in the LB group, where Actinobacteria and Deferribacteres were significantly higher than those in the Bs and Ef groups (p < 0.01).
The species composition at the genus level is shown in Figure 3b. At the genus level, the distribution of the species in the six groups varied greatly. Lactobacillus was present in all six groups. Lactobacillus, Bacteroides, Blautia, Lachnospiraceae Clostridium, and Erysipelotrichaceae Clostridium were dominant in the La group. Lactobacillus, Shigella, Blautia, Ruminococcus, Erysipelotrichaceae Clostridium, and Clostridiaceae Clostridium were dominant in the Lp group. Compared with the control MRS group, Lactobacillus and Lachnospiraceae Clostridium in the La group were significantly higher (p < 0.01) and Bacteroides was significantly lower (p < 0.01). Lactobacillus, Shigella, Blautia, and Clostridiaceae Clostridium in the Lp group were significantly higher (p < 0.01), and Ruminococcus was significantly lower (p < 0.01). Lactobacillus and Ruminococcaceae Ruminococcus were dominant in the Bs group. Lactobacillus, Prevotella, Shigella, Bacteroides, Blautia, Ruminococcus, and Erysipelotrichaceae Clostridium were dominant in the Ef group. Compared with the control LB group, Ruminococcaceae Ruminococcus in the Bs group was significantly higher (p < 0.01), and Prevotella, Bacteroides, Ruminococcus, Erysipelotrichaceae Clostridium, and Lachnospiraceae Clostridium were significantly lower (p < 0.01). Prevotella, Shigella, Blautia, and Ruminococcaceae Ruminococcus in the Ef group were significantly higher (p < 0.01) and Lactobacillus, Ruminococcus, Erysipelotrichaceae Clostridium, and Lachnospiraceae Clostridium were significantly lower (p < 0.01).
Compared with the four experimental groups, Lactobacillus was significantly higher in the La and Bs groups than in the other two groups (p < 0.01). Blautia and Erysipelotrichaceae Clostridium in the La, Lp, and Ef groups were significantly higher than those in the Bs group (p < 0.01). Bacteroides and Prevotella had the highest proportion in the Ef group. Blautia had the highest proportion in the Lp group. Shigella in the Lp and Ef groups were significantly higher than those in the other two groups (p < 0.01), and Shigella was higher in the Lp group. Clostridiaceae Clostridium in the Lp group was significantly higher than in the other three groups (p < 0.01). Lactobacillus accounted for the highest proportion in the Bs group.

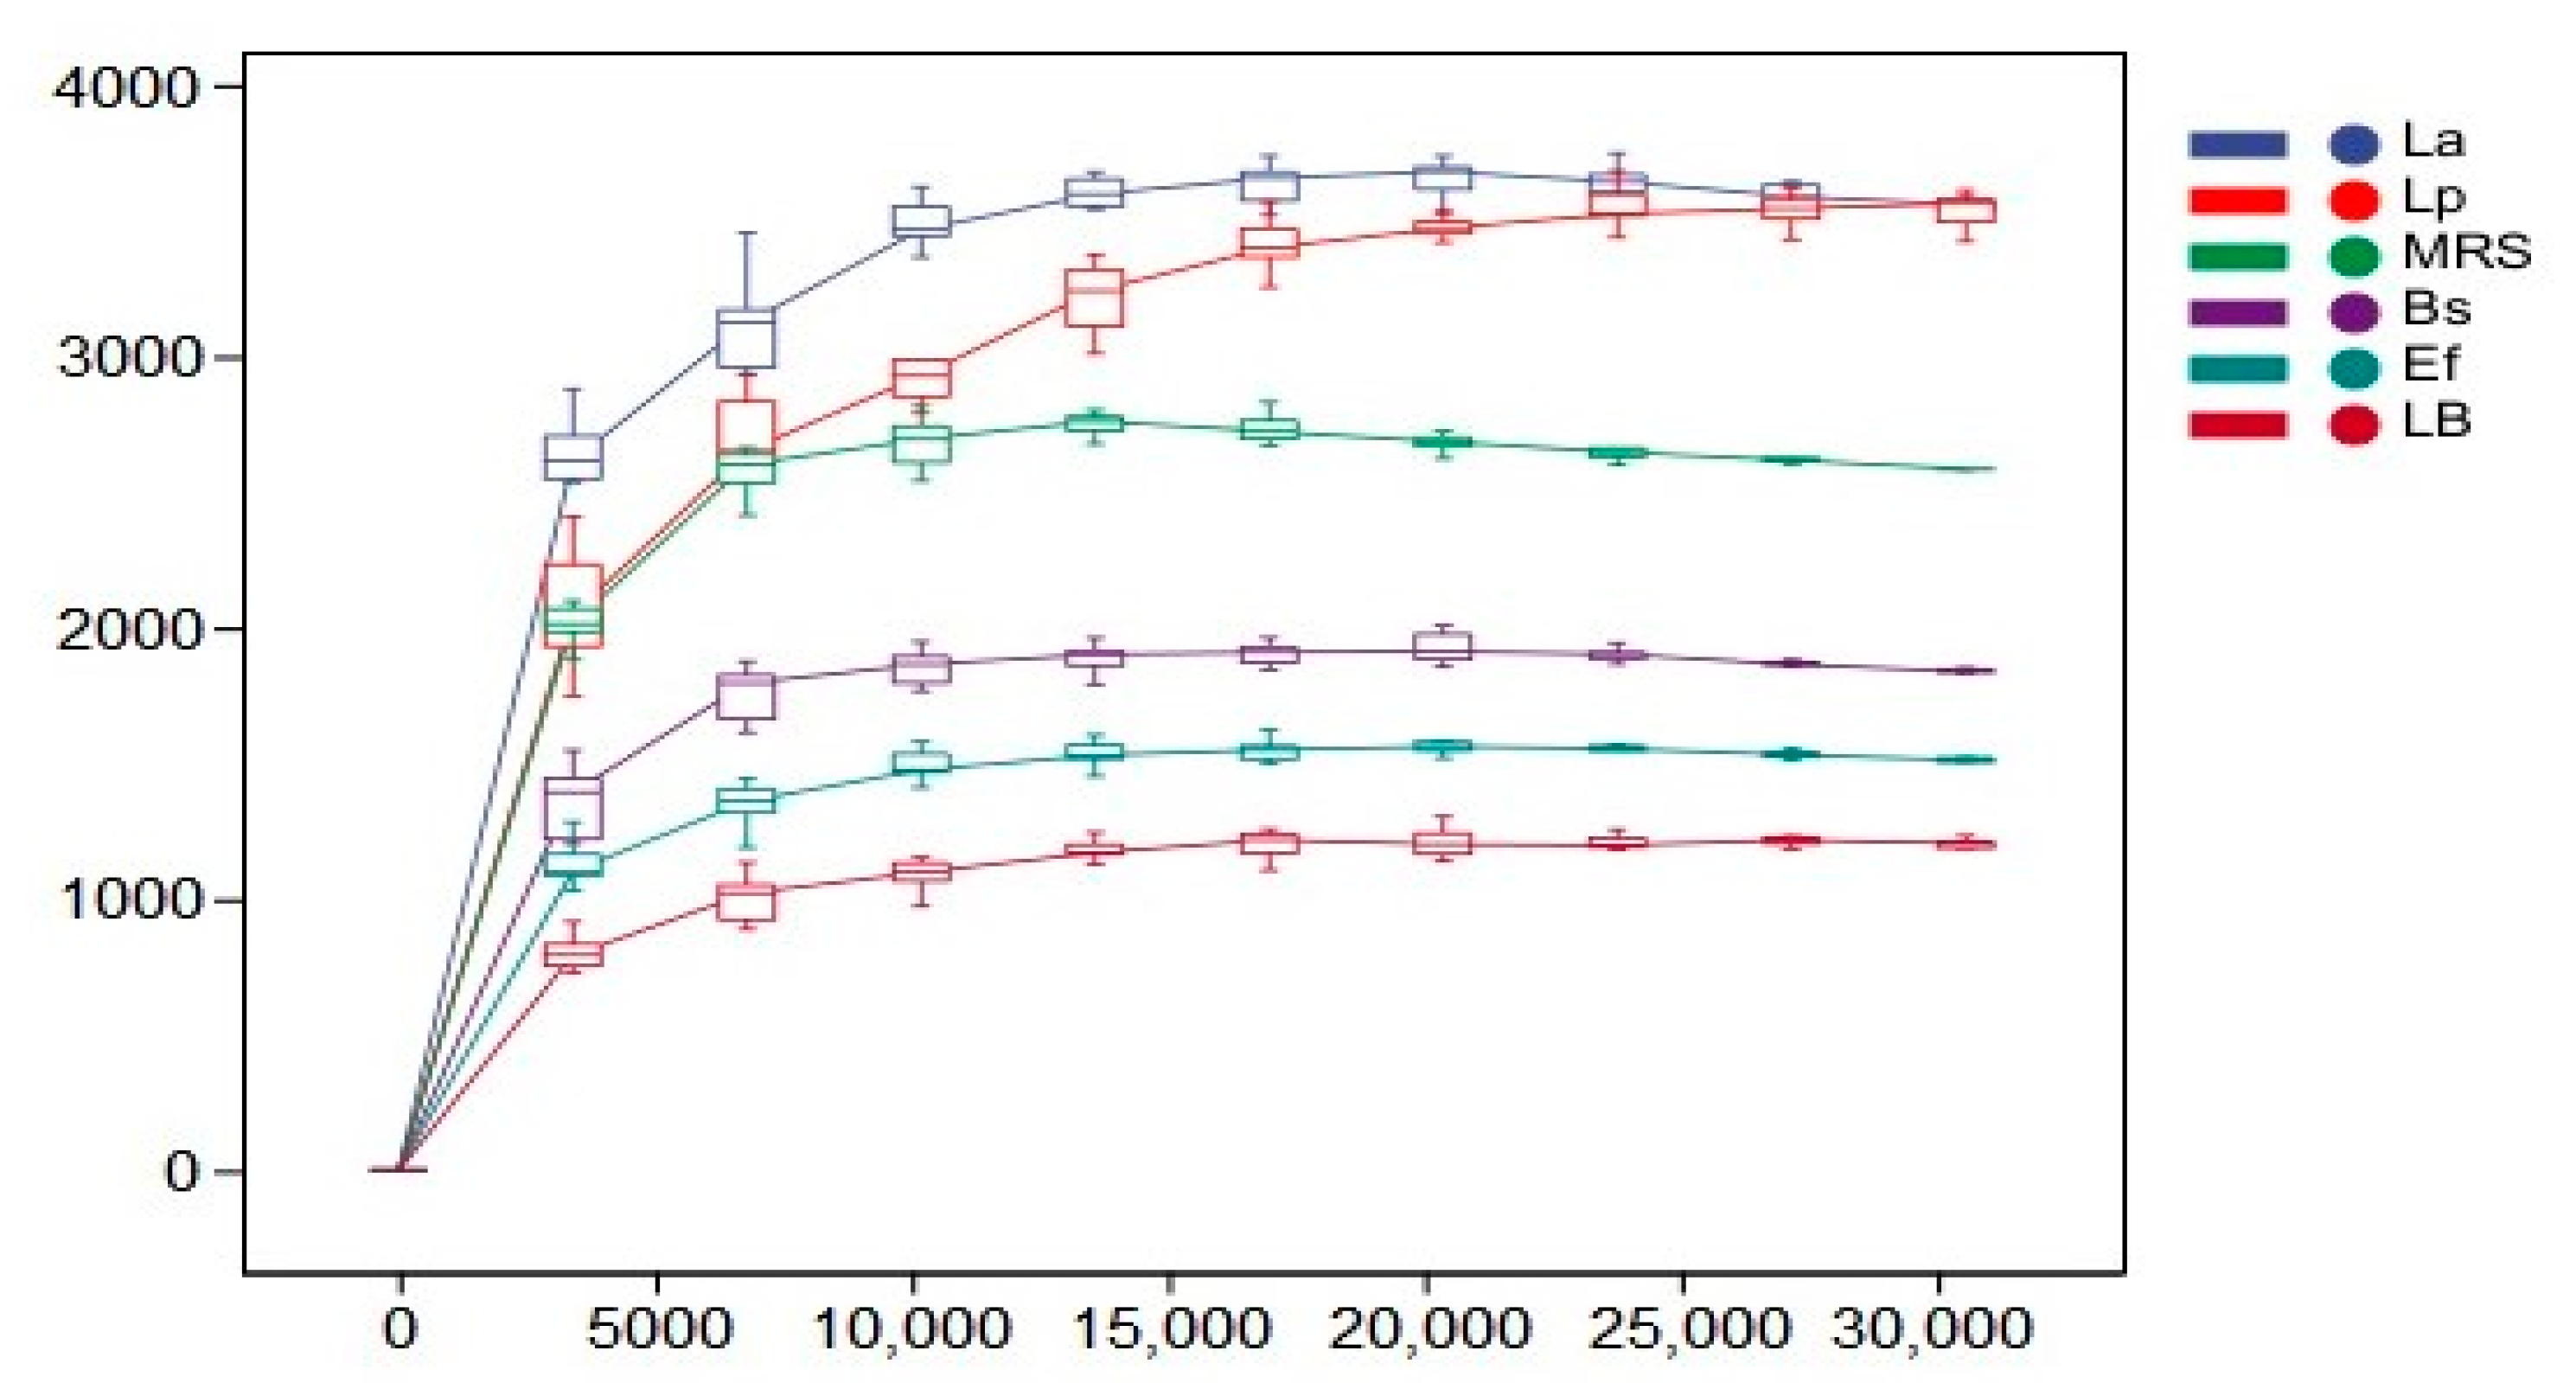
3.5. α-Diversity Analysis

The rarefaction curves indicate the magnitude of the effect of sequencing depth on the diversity of the observed samples. The results are shown in Figure 4. With the increase in sequencing depth, the rarefaction curves of all six groups leveled off. The species diversity of all groups reached saturation, and no new ASV/OTU could be detected by continuing to increase the sequencing depth.
In order to assess the effect of four probiotics on the diversity and richness of the intestinal microbial community in mice, this study characterized the richness by the Chao1 index and the diversity by the Shannon and Simpson indices, and the individual indices of the samples are shown in Table 4. The mean Chao1 indices of the Bs, Ef, and LB groups were 1839.56, 1512.04, and 1214.77, respectively; the mean Shannon indices of the Lp, La, and MRS groups were 8.06856, 7.7823, and 8.39776, respectively; the mean Shannon indices of the Bs, Ef, and LB groups were 6.62015, 6.2814, and 6.237, respectively. The mean Simpson indices of the Lp, La, and MRS groups were 0.958022, 0.961972, and 0.964692, respectively, and the mean Simpson indices of the Bs, Ef, and LB groups were 0.88648, 0.904921, and 0.901051, respectively.
Relatively high Chao1, Shannon, and Simpson indices indicated high bacterial richness and diversity. In this study, the abundance of the La and Lp groups was significantly higher than in the control MRS group (p < 0.01). The diversity was not significantly different from the MRS group (p > 0.05). The abundance of Bs and Ef groups was significantly higher than the control LB group (p < 0.01). The diversity was not significantly different from the LB group (p > 0.05).
Compared with the four test groups, there was no significant difference between the La and Lp groups (p > 0.05). The richness of the Bs group was significantly higher than that of the Ef group (p < 0.01). Both the La group and the Lp group were significantly higher in richness and diversity than the Bs and Ef groups (p < 0.01).

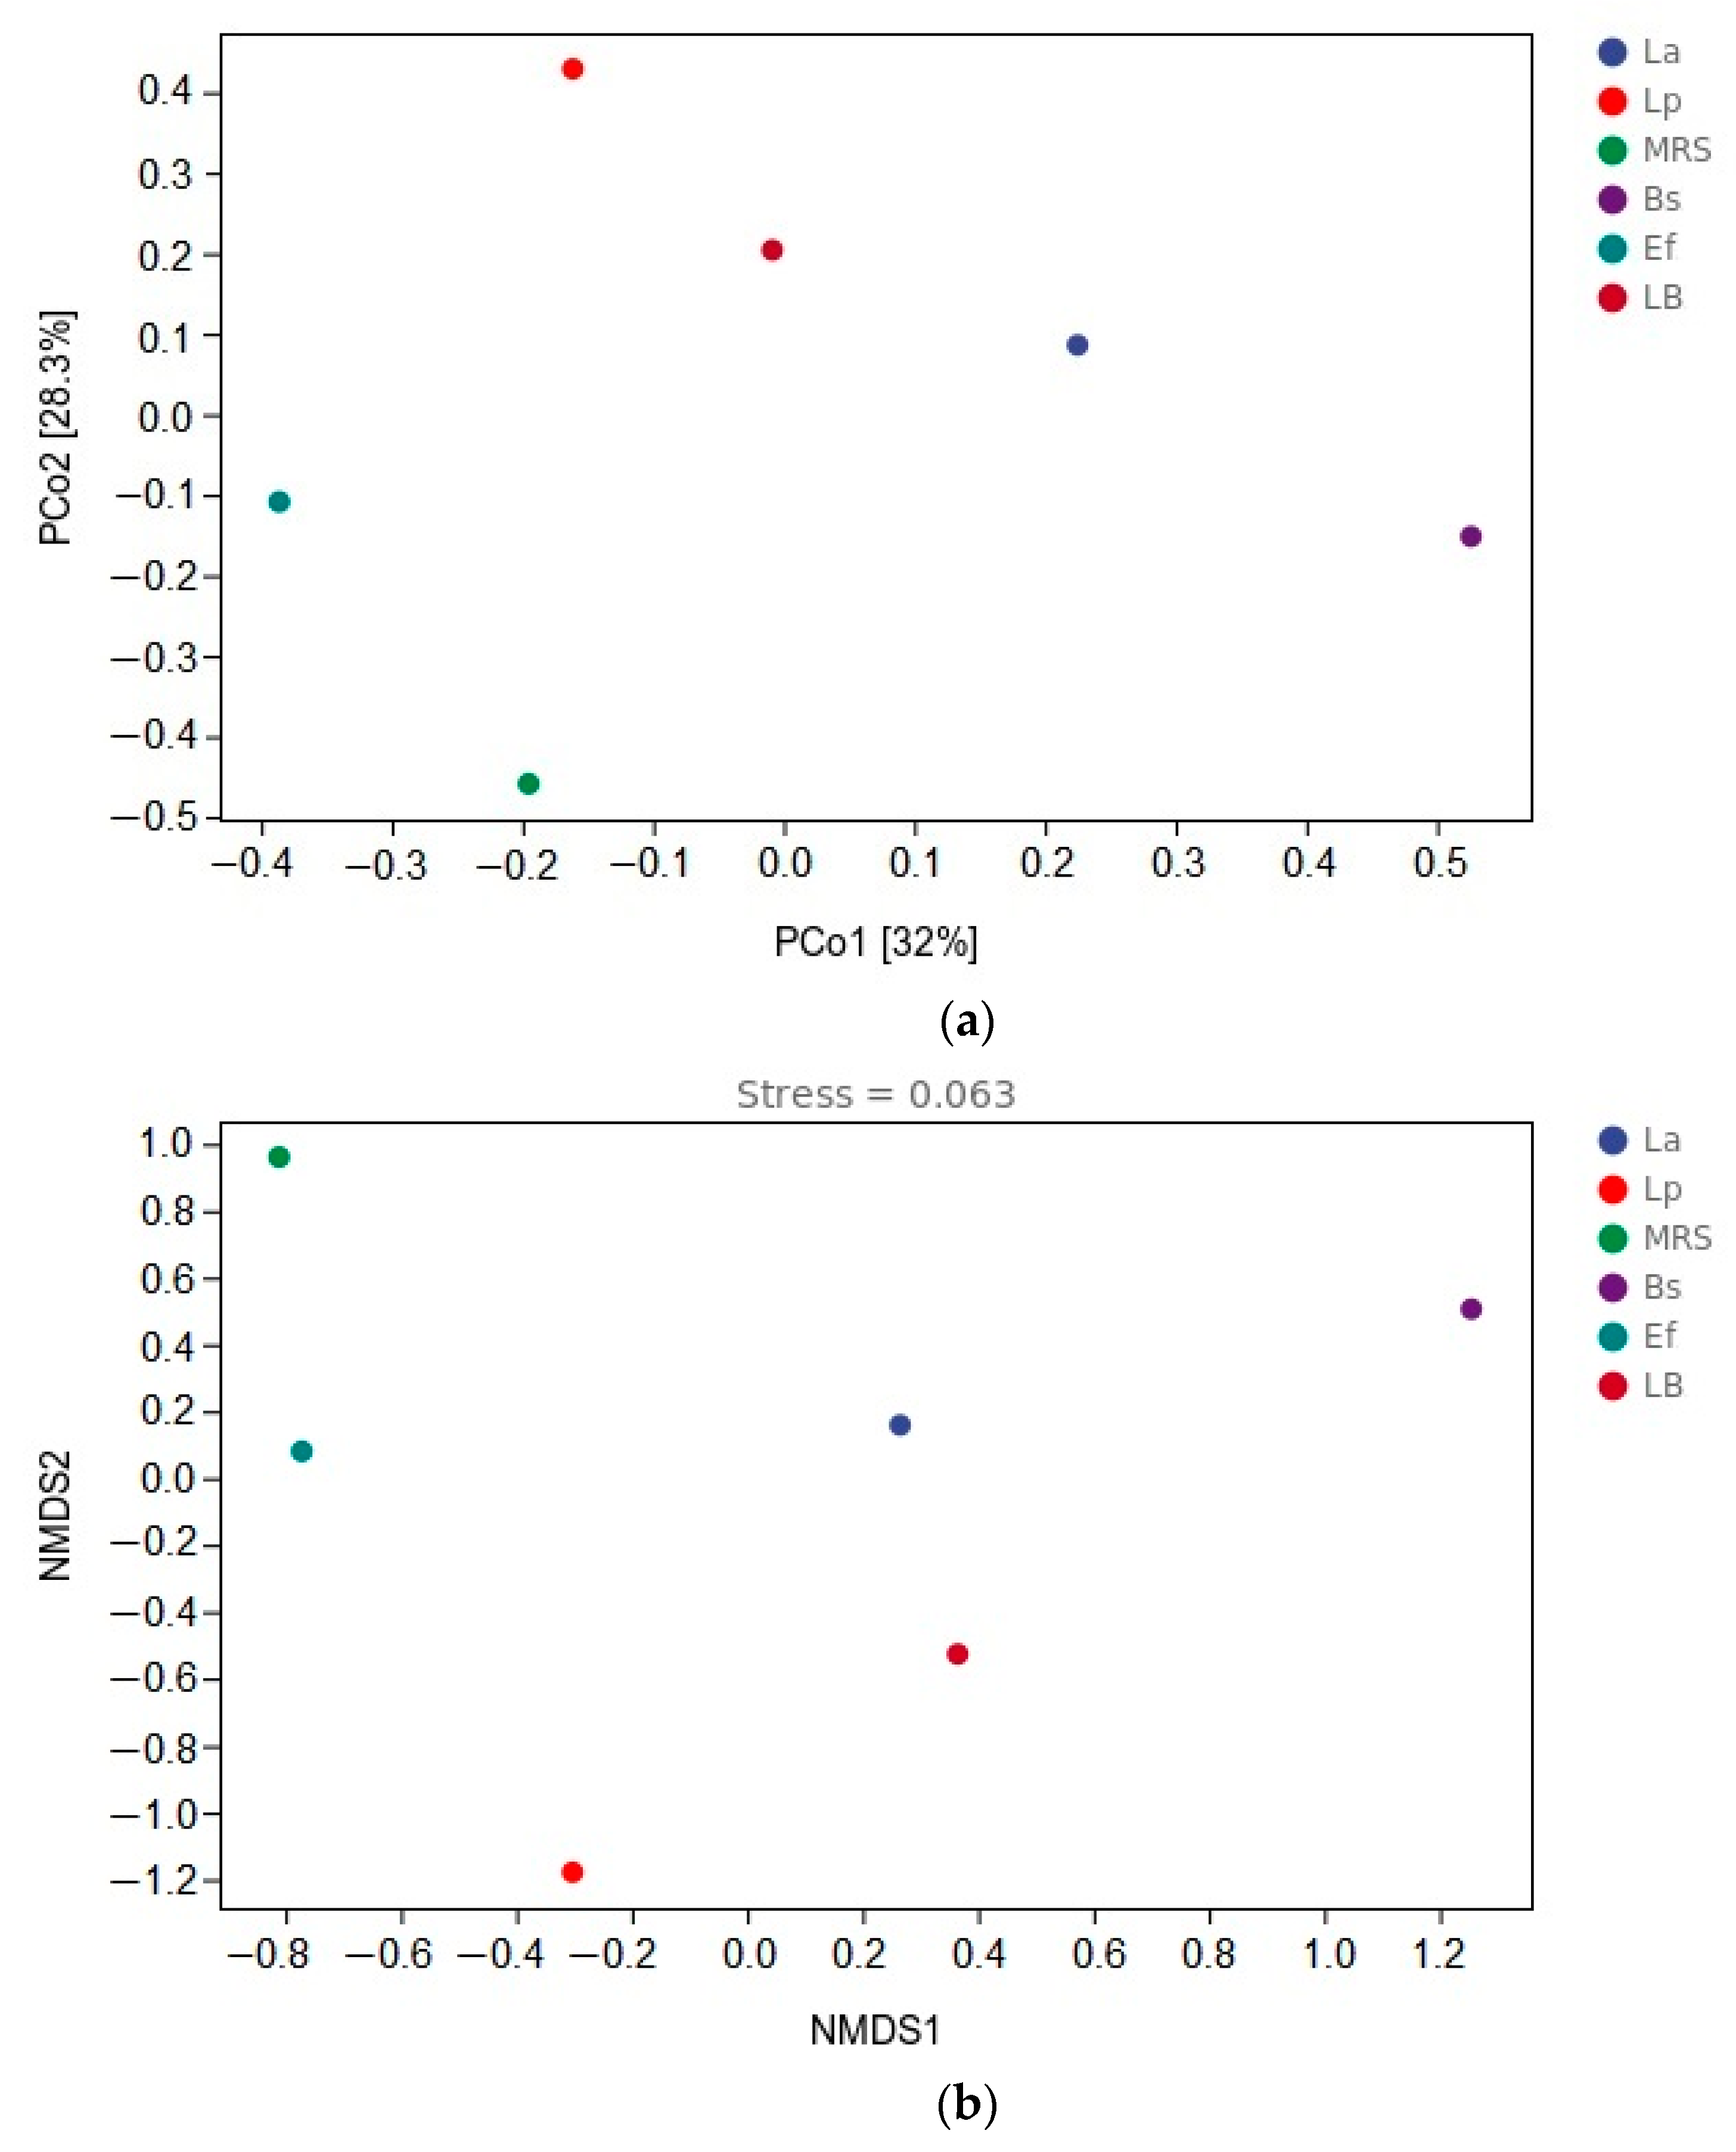
3.6. β-Diversity Analysis

To show the variability and similarity of microbial communities among the six groups of samples, this study used the principal co-ordinates analysis (PCoA) method and NMDS analysis. PCoA was used to expand the sample distance matrix in the low dimensional space after projection and to retain the distance relationship of the original samples to the maximum, as shown in Figure 5a. PCo1 and PCo2 accounted for 32% and 28.3% of the total variation, respectively. In the PCoA analysis, the coordinates of the six groups in the distance matrix were: La group (0.225, 0.086); Lp group (−0.161, 0.429); MRS group (−0.195, −0.458); Bs group (0.526, −0.151); Ef group (−0.386, (p < 0.05) −0.108); LB group (−0.008, −0.204). There were different clusters in all six groups of samples, and the distance between the six groups of samples was large. NMDS uses rank ordering, and the farther the distance between two points, the greater the difference between the microbial communities in the two samples, and vice versa, as shown in Figure 5b. In the NMDS analysis, the coordinates of the six groups in the distance matrix were: La group (0.265, 0.158); Lp group (−0.302, (p < 0.05). −1.178); MRS group (−0.811, 0.961); Bs group (1.255, 0.506); Ef group (−0.771, 0.080); LB group (0.365, −0.527). The greater distance between the six groups of samples in the NMDS analysis indicates that the difference in community composition is more significant (p < 0.01).

4. Discussion

According to the available studies, animal gut microbiota mainly includes bacteria, fungi, archaea, protozoa and viruses, which maintain the gut microecological balance in the host and interact with the host, thus influencing the host’s physiology and health [25]. The balance of gut microecology is closely related to the cardiovascular, neurological, immune, and metabolic systems of the host, and it is particularly important to maintain the composition and structure of the gut microbiota and to preserve its diversity [26]. Therefore, the aim of this study was to evaluate the effects of L. acidophilus, L. plantarum, B. subtilis, and E. faecalis on the structure and diversity of the gut microbiota in mice.
The results of this study show that. L. acidophilus can increase the proportion of Firmicutes, Lactobacillus, Erysipelotrichaceae Clostridium, and Lachnospiraceae Clostridium in the gut and reduce the proportion of Bacteroides. L. plantarum can increase the proportion of Firmicutes, Proteobacteria, Lactobacillus, Shigella, Blautia, and Clostridiaceae Clostridium in the gut and reduce the proportion of Ruminococcus. B. subtilis can increase the proportion of Lactobacillus and Ruminococcaceae Ruminococcus, and reduce the proportion of Prevotella, Bacteroides, Ruminococcus, Erysipelotrichaceae Clostridium, and Lachnospiraceae Clostridium. E. faecalis can increase the proportion of Prevotella, Shigella, Blautia, and Ruminococcaceae Ruminococcus and reduce the proportion of Lactobacillus and Lachnospirace Clostridium.
L. acidophilus, L. plantarum, B. subtilis, and E. faecalis could significantly increase the richness of the gut microbiota in mice. The effects of L. acidophilus and L. plantarum were more obvious. In addition, the four strains did not significantly affect the diversity of the gut microbiota in mice. The colony structure was greatly affected by the four species.
In previous studies, probiotic strains have been shown to be able to maintain the stability of the gut microbiota and interact with the intestinal microbiota by competing for nutrients, such as oxygen, through antagonism and cross-feeding in the gut [27]. The use of probiotics can reshape gut microbiota composition and improve microbial metabolism [28]. The four probiotics used in the present study altered the structure of the gut microbiota, which is consistent with the results of other studies. Several studies have shown that L. acidophilus increased the abundance of Firmicutes and Lactobacillus and decreased the abundance of Bacteroidetes, Vibrio spp., and Ruminococcus [29]; in other studies, L. plantarum increased the abundance of Firmicutes, Proteobacteria, and Lactobacillus and decreased the abundance of Bacteroidetes, [30,31]; B. subtilis can increase the abundance of Firmicutes, Bacteroidetes, and Lactobacillus [32]; E. faecalis can increase the abundance of Bacteroidetes and Ruminococcus and decrease the abundance of Proteobacteria [33]. This is similar to the results observed in the present study, where all four probiotics affected gut microbiota diversity differently, with significant changes in abundance (p < 0.01). In this study, although the four probiotics added did not have a significant effect on flora diversity, it was found that the four experimental groups differed significantly in their flora structure when analyzed between the groups.
In the present study, the increase in the abundance of Firmicutes may be related to the increase in beneficial bacterial species, such as Lactobacillus [34]. Notably, in the Bs group, the abundance of Firmicutes increased, which may be related to the consumption of oxygen by B. subtilis after colonization and the formation of an anaerobic environment, resulting in an increase in the abundance of anaerobionts such as Lactobacillus. In general, Firmicutes are associated with the ratio of Bacteroidetes and the susceptibility to disease states [35], but in the present study, the abundance of Bacteroidetes was reduced in the Lp group and Proteobacteria took the place of the original Bacteroidetes, making this ratio significant, while the mice did not exhibit significant disease, so, as a result, remained in a healthy state. Meanwhile, Actinobacteria and Deferribacteres appeared in the control LB group, so B. subtilis and E. faecalis may reduce the abundance of these two clades.
In addition, the present study found different variations at the genus level, with increased abundance of Shigella [36] in the Lp, Ef, and LB groups, and both in vivo [37,38] and in vitro [39,40] tests demonstrated that L. plantarum and E. faecalis could inhibit the growth of Shigella and alleviate the symptoms caused by Shigella, which differed significantly from the results of the present study, probably due to the use of Blautia, which is a newly discovered potential probiotic, the abundance of which is influenced by some prebiotics [41]. In this study, the increase in the abundance of Blautia may be influenced by L. acidophilus, L. plantarum, and E. faecalis; B. subtilis did not increase its abundance, and whether its growth is influenced by the growth of B. subtilis needs to be studied. Prevotella is abundant in the body as a key player in the balance between health and disease [42]. It has been shown that L. acidophilus can increase the abundance of Prevotella [29], which is contrary to the results of the present study; L. plantarum can decrease the abundance of Prevotella and Bacteroides [43,44], and B. subtilis and E. faecalis can increase the abundance of Prevotella [45,46]. All of these results are similar to the present study.

5. Conclusions

In this study, four probiotics: L. acidophilus, L. plantarum, B. subtilis, and E. faecalis, were gavaged into mice. The study showed that the four probiotics exerted different effects on the structure and richness of the gut microbiota in the intestines of the mice, and the study elucidated the mechanism of probiotic interactions in the intestine, which further provided a strong basis for the preparation of probiotics and theory regarding their targets.

Author Contributions

Conceptualization, J.R., F.H., D.Y., H.X., N.L., Z.C. and J.W.; methodology, J.R., F.H. and H.X.; software, J.R. and D.Y.; validation, J.R. and D.Y.; formal analysis, J.R.; resources, J.W.; data curation, J.R.; writing—original draft preparation, J.R., F.H. and N.L.; writing—review and editing, Z.C. and J.W.; visualization, J.R.; supervision, Z.C. and J.W.; project administration, J.W.; funding acquisition, J.W. All authors have read and agreed to the published version of the manuscript.

Funding

This research was funded by Shandong Modern Agricultural Technology and Industry System, grant number SDAIT-21-13, awarded to J.W.

Institutional Review Board Statement

The animal experiments performed in this study strictly followed the national guidelines for experimental animal welfare announced by the Ministry of Science and Technology of the People’s Republic of China in 2006 (Guiding Opinions on Kindly Treating Laboratory Animals) and were approved by the Animal Welfare and Research Ethics Committee of Qingdao Agricultural University, Shandong, China (Approval NO: 2021-56).

Informed Consent Statement

Not applicable.

Data Availability Statement

The sequence data from this study have been uploaded to the NCBI database. BioProject: SUB12706298, BioSample: SUB12706389, and SRA: SUB12707064.

Acknowledgments

The authors would like to thank Shandong Modern Agricultural Technology and Industry System, Personal Biotechnology Co., Ltd. (Shanghai, China), and the Laboratory of Veterinary Microbiology and Immunology for their help during this work.

Conflicts of Interest

The authors declare no conflict of interest.

References

  1. Adak, A.; Khan, M.R. An insight into gut microbiota and its functionalities. Cell. Mol. Life Sci. 2019, 76, 473–493. [Google Scholar] [CrossRef] [PubMed]
  2. Kc, D.; Sumner, R.; Lippmann, S. Gut microbiota and health. Postgrad. Med. 2020, 132, 274. [Google Scholar] [CrossRef] [Green Version]
  3. Clemente, J.C.; Ursell, L.K.; Parfrey, L.W.; Knight, R. The impact of the gut microbiota on human health: An integrative view. Cell 2012, 148, 1258–1270. [Google Scholar] [CrossRef] [Green Version]
  4. Bibbo, S.; Ianiro, G.; Giorgio, V.; Scaldaferri, F.; Masucci, L.; Gasbarrini, A.; Cammarota, G. The role of diet on gut microbiota composition. Eur. Rev. Med. Pharmacol. Sci. 2016, 20, 4742–4749. [Google Scholar] [PubMed]
  5. Simren, M.; Barbara, G.; Flint, H.J.; Spiegel, B.M.; Spiller, R.C.; Vanner, S.; Verdu, E.F.; Whorwell, P.J.; Zoetendal, E.G.; Rome Foundation, C. Intestinal microbiota in functional bowel disorders: A Rome foundation report. Gut 2013, 62, 159–176. [Google Scholar] [CrossRef]
  6. Bibbo, S.; Lopetuso, L.R.; Ianiro, G.; Di Rienzo, T.; Gasbarrini, A.; Cammarota, G. Role of microbiota and innate immunity in recurrent Clostridium difficile infection. J. Immunol. Res. 2014, 2014, 462740. [Google Scholar] [CrossRef] [PubMed] [Green Version]
  7. Aron-Wisnewsky, J.; Gaborit, B.; Dutour, A.; Clement, K. Gut microbiota and non-alcoholic fatty liver disease: New insights. Clin. Microbiol. Infect. 2013, 19, 338–348. [Google Scholar] [CrossRef] [Green Version]
  8. D’Aversa, F.; Tortora, A.; Ianiro, G.; Ponziani, F.R.; Annicchiarico, B.E.; Gasbarrini, A. Gut microbiota and metabolic syndrome. Intern. Emerg. Med. 2013, 8 (Suppl. S1), S11–S15. [Google Scholar] [CrossRef]
  9. Bibbo, S.; Dore, M.P.; Pes, G.M.; Delitala, G.; Delitala, A.P. Is there a role for gut microbiota in type 1 diabetes pathogenesis? Ann. Med. 2017, 49, 11–22. [Google Scholar] [CrossRef]
  10. Li, Q.; Zhou, J.M. The microbiota-gut-brain axis and its potential therapeutic role in autism spectrum disorder. Neuroscience 2016, 324, 131–139. [Google Scholar] [CrossRef]
  11. Dudek-Wicher, R.K.; Junka, A.; Bartoszewicz, M. The influence of antibiotics and dietary components on gut microbiota. Prz. Gastroenterol. 2018, 13, 85–92. [Google Scholar] [CrossRef]
  12. Khan, S.; Moore, R.J.; Stanley, D.; Chousalkar, K.K. The Gut Microbiota of Laying Hens and Its Manipulation with Prebiotics and Probiotics To Enhance Gut Health and Food Safety. Appl. Environ. Microbiol. 2020, 86, e00600-20. [Google Scholar] [CrossRef]
  13. Kim, S.K.; Guevarra, R.B.; Kim, Y.T.; Kwon, J.; Kim, H.; Cho, J.H.; Kim, H.B.; Lee, J.H. Role of Probiotics in Human Gut Microbiome-Associated Diseases. J. Microbiol. Biotechnol. 2019, 29, 1335–1340. [Google Scholar] [CrossRef]
  14. Ragan, M.V.; Wala, S.J.; Goodman, S.D.; Bailey, M.T.; Besner, G.E. Next-Generation Probiotic Therapy to Protect the Intestines From Injury. Front. Cell. Infect. Microbiol. 2022, 12, 863949. [Google Scholar] [CrossRef]
  15. Ruiz, L.; Margolles, A.; Sanchez, B. Bile resistance mechanisms in Lactobacillus and Bifidobacterium. Front. Microbiol. 2013, 4, 396. [Google Scholar] [CrossRef] [PubMed] [Green Version]
  16. Kajikawa, A.; Nordone, S.K.; Zhang, L.; Stoeker, L.L.; LaVoy, A.S.; Klaenhammer, T.R.; Dean, G.A. Dissimilar properties of two recombinant Lactobacillus acidophilus strains displaying Salmonella FliC with different anchoring motifs. Appl. Environ.Microbiol. 2011, 77, 6587–6596. [Google Scholar] [CrossRef] [Green Version]
  17. Wells, J.M.; Mercenier, A. Mucosal delivery of therapeutic and prophylactic molecules using lactic acid bacteria. Nat. Rev. Microbiol. 2008, 6, 349–362. [Google Scholar] [CrossRef]
  18. Bull, M.J.; Jolley, K.A.; Bray, J.E.; Aerts, M.; Vandamme, P.; Maiden, M.C.; Marchesi, J.R.; Mahenthiralingam, E. The domestication of the probiotic bacterium Lactobacillus acidophilus. Sci. Rep. 2014, 4, 7202. [Google Scholar] [CrossRef] [Green Version]
  19. Russo, P.; Arena, M.P.; Fiocco, D.; Capozzi, V.; Drider, D.; Spano, G. Lactobacillus plantarum with broad antifungal activity: A promising approach to increase safety and shelf-life of cereal-based products. Int. J. Food Microbiol. 2017, 247, 48–54. [Google Scholar] [CrossRef] [PubMed]
  20. Maughan, H.; Van der Auwera, G. Bacillus taxonomy in the genomic era finds phenotypes to be essential though often misleading. Infect. Genet. Evol. 2011, 11, 789–797. [Google Scholar] [CrossRef] [PubMed]
  21. Ayyash, M.; Stathopoulos, C.; Abu-Jdayil, B.; Esposito, G.; Baig, M.; Turner, M.S.; Baba, A.S.; Apostolopoulos, V.; Al-Nabulsi, A.; Osaili, T. Exopolysaccharide produced by potential probiotic Enterococcus faecalis MS79: Characterization, bioactivities and rheological properties influenced by salt and pH. Lwt-Food Sci. Technol. 2020, 131, 109741. [Google Scholar] [CrossRef]
  22. Elshaghabee, F.M.F.; Rokana, N.; Gulhane, R.D.; Sharma, C.; Panwar, H. Bacillus As Potential Probiotics: Status, Concerns, and Future Perspectives. Front. Microbiol. 2017, 8, 1490. [Google Scholar] [CrossRef] [PubMed] [Green Version]
  23. Cutting, S.M.; Ricca, E. Bacterial spore-formers: Friends and foes. FEMS Microbiol. Lett. 2014, 358, 107–109. [Google Scholar] [CrossRef] [PubMed] [Green Version]
  24. Hong, H.A.; Duc, L.H.; Cutting, S.M. The use of bacterial spore formers as probiotics. FEMS Microbiol. Rev. 2005, 29, 813–835. [Google Scholar] [CrossRef] [Green Version]
  25. Claesson, M.J.; Jeffery, I.B.; Conde, S.; Power, S.E.; O’Connor, E.M.; Cusack, S.; Harris, H.M.; Coakley, M.; Lakshminarayanan, B.; O’Sullivan, O.; et al. Gut microbiota composition correlates with diet and health in the elderly. Nature 2012, 488, 178–184. [Google Scholar] [CrossRef]
  26. Yegani, M.; Korver, D.R. Factors affecting intestinal health in poultry. Poult. Sci. 2008, 87, 2052–2063. [Google Scholar] [CrossRef]
  27. Sanders, M.E.; Merenstein, D.J.; Reid, G.; Gibson, G.R.; Rastall, R.A. Probiotics and prebiotics in intestinal health and disease: From biology to the clinic. Nat. Rev. Gastroenterol. Hepatol. 2019, 16, 605–616. [Google Scholar] [CrossRef] [PubMed]
  28. Yan, B.; Han, J.; Sun, Y.; Lei, L.; Yuan, J.; Qiao, Z.; Men, J.; Wang, X.; Guo, Y.; Wang, Q.; et al. Probiotics ameliorate growth retardation of glyphosate by regulating intestinal microbiota and metabolites in crucian carp (Carassius auratus). Sci. Total. Environ. 2022, 851, 158260. [Google Scholar] [CrossRef]
  29. Vemuri, R.; Shinde, T.; Gundamaraju, R.; Gondalia, S.V.; Karpe, A.V.; Beale, D.J.; Martoni, C.J.; Eri, R. Lactobacillus acidophilus DDS-1 Modulates the Gut Microbiota and Improves Metabolic Profiles in Aging Mice. Nutrients 2018, 10, 1255. [Google Scholar] [CrossRef] [Green Version]
  30. Tong, T.; Niu, X.; Li, Q.; Ling, Y.; Li, Z.; Liu, J.; Zhang, M.; Bai, Z.; Xia, R.; Wu, Z.; et al. The Effect of Lactobacillus plantarum BW2013 on The Gut Microbiota in Mice Analyzed by 16S rRNA Amplicon Sequencing. Pol. J. Microbiol. 2021, 70, 235–243. [Google Scholar] [CrossRef]
  31. Wang, T.; Teng, K.; Liu, Y.; Shi, W.; Zhang, J.; Dong, E.; Zhang, X.; Tao, Y.; Zhong, J. Lactobacillus plantarum PFM 105 Promotes Intestinal Development Through Modulation of Gut Microbiota in Weaning Piglets. Front. Microbiol. 2019, 10, 90. [Google Scholar] [CrossRef]
  32. Li, A.; Jiang, X.; Wang, Y.; Zhang, L.; Zhang, H.; Mehmood, K.; Li, Z.; Waqas, M.; Li, J. The impact of Bacillus subtilis 18 isolated from Tibetan yaks on growth performance and gut microbial community in mice. Microb. Pathog. 2019, 128, 153–161. [Google Scholar] [CrossRef]
  33. Wang, W.; Cai, H.; Zhang, A.; Chen, Z.; Chang, W.; Liu, G.; Deng, X.; Bryden, W.L.; Zheng, A. Enterococcus faecalis Modulates the Gut Microbiota of Broilers and Enhances Phosphorus Absorption and Utilization. Animals 2020, 10, 1232. [Google Scholar] [CrossRef] [PubMed]
  34. Shi, Y.; Zhao, X.; Zhao, J.; Zhang, H.; Zhai, Q.; Narbad, A.; Chen, W. A mixture of Lactobacillus species isolated from traditional fermented foods promote recovery from antibiotic-induced intestinal disruption in mice. J. Appl. Microbiol. 2018, 124, 842–854. [Google Scholar] [CrossRef]
  35. Ley, R.E.; Turnbaugh, P.J.; Klein, S.; Gordon, J.I. Microbial ecology: Human gut microbes associated with obesity. Nature 2006, 444, 1022–1023. [Google Scholar] [CrossRef] [PubMed]
  36. Anderson, M.; Sansonetti, P.J.; Marteyn, B.S. Shigella Diversity and Changing Landscape: Insights for the Twenty-First Century. Front. Cell. Infect. Microbiol. 2016, 6, 45. [Google Scholar] [CrossRef] [PubMed] [Green Version]
  37. Wang, B.; Gong, L.; Zhou, Y.; Tang, L.; Zeng, Z.; Wang, Q.; Zou, P.; Yu, D.; Li, W. Probiotic Paenibacillus polymyxa 10 and Lactobacillus plantarum 16 enhance growth performance of broilers by improving the intestinal health. Anim. Nutr. 2021, 7, 829–840. [Google Scholar] [CrossRef]
  38. Karimaei, S.; Sadeghi, J.; Asadian, M.; Esghaei, M.; Pourshafie, M.R.; Talebi, M. Antibacterial potential and genetic profile of Enterococcus faecalis strains isolated from human normal flora. Microb. Pathog. 2016, 96, 67–71. [Google Scholar] [CrossRef]
  39. Zare Mirzaei, E.; Lashani, E.; Davoodabadi, A. Antimicrobial properties of lactic acid bacteria isolated from traditional yogurt and milk against Shigella strains. GMS Hyg. Infect. Control 2018, 13, Doc01. [Google Scholar] [CrossRef]
  40. Apas, A.L.; Dupraz, J.; Ross, R.; Gonzalez, S.N.; Arena, M.E. Probiotic administration effect on fecal mutagenicity and microflora in the goat’s gut. J. Biosci. Bioeng. 2010, 110, 537–540. [Google Scholar] [CrossRef]
  41. Yang, J.; Bindels, L.B.; Segura Munoz, R.R.; Martinez, I.; Walter, J.; Ramer-Tait, A.E.; Rose, D.J. Disparate Metabolic Responses in Mice Fed a High-Fat Diet Supplemented with Maize-Derived Non-Digestible Feruloylated Oligo- and Polysaccharides Are Linked to Changes in the Gut Microbiota. PLoS ONE 2016, 11, e0146144. [Google Scholar] [CrossRef]
  42. Tett, A.; Pasolli, E.; Masetti, G.; Ercolini, D.; Segata, N. Prevotella diversity, niches and interactions with the human host. Nat. Rev. Microbiol. 2021, 19, 585–599. [Google Scholar] [CrossRef] [PubMed]
  43. Rahayu, E.S.; Mariyatun, M.; Putri Manurung, N.E.; Hasan, P.N.; Therdtatha, P.; Mishima, R.; Komalasari, H.; Mahfuzah, N.A.; Pamungkaningtyas, F.H.; Yoga, W.K.; et al. Effect of probiotic Lactobacillus plantarum Dad-13 powder consumption on the gut microbiota and intestinal health of overweight adults. World J. Gastroenterol. 2021, 27, 107–128. [Google Scholar] [CrossRef] [PubMed]
  44. Lin, S.; Yang, X.; Long, Y.; Zhong, H.; Wang, P.; Yuan, P.; Zhang, X.; Che, L.; Feng, B.; Li, J.; et al. Dietary supplementation with Lactobacillus plantarum modified gut microbiota, bile acid profile and glucose homoeostasis in weaning piglets. Br. J. Nutr. 2020, 124, 797–808. [Google Scholar] [CrossRef] [PubMed]
  45. Wang, X.; Tsai, T.; Wei, X.; Zuo, B.; Davis, E.; Rehberger, T.; Hernandez, S.; Jochems, E.J.M.; Maxwell, C.V.; Zhao, J. Effect of Lactylate and Bacillus subtilis on Growth Performance, Peripheral Blood Cell Profile, and Gut Microbiota of Nursery Pigs. Microorganisms 2021, 9, 803. [Google Scholar] [CrossRef] [PubMed]
  46. Mamuad, L.L.; Kim, S.H.; Biswas, A.A.; Yu, Z.; Cho, K.K.; Kim, S.B.; Lee, K.; Lee, S.S. Rumen fermentation and microbial community composition influenced by live Enterococcus faecalis supplementation. AMB Express 2019, 9, 123. [Google Scholar] [CrossRef]
Figure 1. Sequence–length distribution: The abscissa is the number of sequences, and the ordinate is the length of the sequence.
Vetsci 10 00288 g001
Figure 2. Classification unit number statistics: (a) petal map of taxonomic unit statistics (indicating the number of OTUs unique and common to each of the six groups Lp, La, MRS, Bs, Ef, and LB); (b) histogram of taxonomic unit statistics (indicating the number of taxonomic units contained in each of the six groups Lp, La, MRS, Bs, Ef, and LB at the seven taxonomic levels of domain, phylum, order, family, genus, and species, respectively, with unclassified, uncultured, uncultivated, unknown, metagenome, etc., units removed).
Vetsci 10 00288 g002aVetsci 10 00288 g002b
Figure 3. Distribution of gut microbiota: (a) species composition at the phylum level; (b) species composition at the genus level.
Vetsci 10 00288 g003
Figure 4. Dilution curves of the six sets of samples. Horizontal coordinates indicate the depth of sequencing, and vertical coordinates indicate the total number of species detected in the samples.
Vetsci 10 00288 g004
Figure 5. β-diversity analysis: (a) distance matrix and PCoA analysis; (b) β-diversity analysis and NMDS analysis.
Vetsci 10 00288 g005
Table 1. Information on strains used in the experiment.
Number.StrainSourcePreservation Location
1L. plantarumSeparated from mink manure in August 2017Laboratory of Veterinary Microbiology and Immunology, College of Veterinary Medicine, Qingdao Agricultural University
2L. acidophilusSeparated from mink manure in August 2017Laboratory of Veterinary Microbiology and Immunology, College of Veterinary Medicine, Qingdao Agricultural University
3B. subtilisSeparated from mink manure in August 2017Laboratory of Veterinary Microbiology and Immunology, College of Veterinary Medicine, Qingdao Agricultural University
4E.faecalisSeparated from mink manure in August 2017Laboratory of Veterinary Microbiology and Immunology, College of Veterinary Medicine, Qingdao Agricultural University
Table 2. Bacterial concentration results.
Time6 h8 h10 h12 h14 h
Strains
L. plantarum6.01 × 1081.72 × 1092.34 × 1092.58 × 1092.62 × 109
L. acidophilus2.98 × 1081.35 × 1092.35 × 1093.55 × 1093.59 × 109
B. subtilis1.78 × 1092.28 × 1092.62 × 1092.65 × 1092.66 × 109
E.faecalis2.20 × 1092.61 × 1092.82 × 1092.90 × 1092.91 × 109
Colony count formula:   Colony   concentration = Bacterial   turbidity   value × 6.2 × 10 9 . Unit: CFU/mL.
Table 3. Sample sequencing statistics.
Sample IDInputFilteredDenoisedMergedNon-ChimericNon-Singleton
La77,69571,28569,46963,71244,75542,656
Lp132,321122,785119,571109,51272,12070,366
MRS57,51153,10751,73447,73934,22932,166
Bs57,89153,64952,80050,65036,81235,819
Ef56,74652,82551,55047,40836,80036,000
LB77,80473,48372,38269,13649,33448,793
In the table, “Sample ID” represents each group and sequentially represents the six groups of L. acidophilus, L. plantarum, MRS broth, B. subtilis, E. faecalis, and LB broth by gavage.
Table 4. α-diversity index.
SampleChao1ShannonSimpson
La3555.38.068560.958022
Lp3532.697.78230.961972
MRS2582.618.397760.964692
Bs1839.566.620150.88648
Ef1512.046.28140.904921
LB1214.776.237550.901051
In the table, “Sample” represents each group and sequentially represents the six groups of L. acidophilus, L. plantarum, MRS broth, B. subtilis, E. faecalis, and LB broth by gavage.
Disclaimer/Publisher’s Note: The statements, opinions and data contained in all publications are solely those of the individual author(s) and contributor(s) and not of MDPI and/or the editor(s). MDPI and/or the editor(s) disclaim responsibility for any injury to people or property resulting from any ideas, methods, instructions or products referred to in the content.

