1. Introduction
COVID-19 is a potentially fatal respiratory illness that predominantly affects the lungs, but can also damage several other organs, such as the heart, brain, liver, and kidneys [
1]. A wide spectrum of research studies has analyzed COVID-19-related risk factors [
2,
3,
4] and treatments [
5,
6,
7]. While most people recover from COVID-19 without needing hospital treatment, COVID-19 can be fatal in older individuals (≥60 years) as well as persons with certain medical conditions (e.g., diabetes, hypertension, obesity, etc.), often requiring hospital-based treatment such as oxygen supplementation for these individuals [
8,
9]. Nonetheless, the fatal progression of the disease in younger patients as well as in re-infected patients is also being observed [
10], and the human response to COVID-19 infection appears to be very heterogeneous [
11]. This heterogeneity among infected individuals calls for modeling approaches that can predict the risk of a given patient with the ultimate goal of preventing and personalizing their treatment.
Data-driven personalized models have the potential to predict individualized risks as they can identify more relevant and informative patient-specific risk factors based on previously generated patient-level data [
12]. However, there are several factors that need to be considered about the preexisting data in order to build personalized predictive models, such as adequate sample size, relevant endpoints, the types of variables, and the longitudinal aspect of data points [
13]. Experimental results show that with increasing training data, the accuracy and robustness of data-driven models can be improved, which in turn could lead to better predictions and the use of these models in day-to-day clinical practice [
14,
15]. Thus, the first step in building personalized COVID-19 predictive models is to generate a detailed overview of the available trial and study data suited for the training of COVID-19 personalized models.
From the start of the COVID-19 pandemic, various data catalogues (i.e., services or tools that manage various datasets in a central metadata directory) have been established, such as COVIC [
16], openICPSR (
https://www.openicpsr.org/openicpsr/search/studies, accessed on 27 November 2020), the Microsoft Azure COVID-19 data catalogue (
https://azure.microsoft.com/de-de/services/open-datasets/catalog/bing-covid-19-data, accessed on 27 November 2020), the Amazon COVID-19 data catalogue (
https://aws.amazon.com/data-exchange/covid-19, accessed on 27 November 2020), and the World Bank data catalogue (
https://datacatalog.worldbank.org, accessed on 27 November 2020). While, the studies listed in the aforementioned data catalogues focus on general information such as hospital capacities, participant mobility, and social distances, they ignore relevant features that are critical for building predictive models (e.g., biomarkers). Moreover, the number of collected studies in these data catalogues is either limited (<100 datasets) as, for example, in the Microsoft Azure COVID-19 data catalogue that has 35 studies, or limited to a specific data source as, for example, COVIC, which exclusively contains clinical trial data. For these reasons, although the organization of this information and published data are critical for predicting and better understanding COVID-19 epidemiology, they are not suitable for training and developing personalized predictive models as they lack longitudinal data points and clinical variables from hospitalized patients or they include a limited range of variables.
To address these shortcomings, we collected and curated COVID-19 datasets from clinical trials, publications, and other global initiatives, building a comprehensive COVID-19 data catalogue as a source to bring together published findings within the context of study information, study design, and other related variables, which could inform risk-modeling approaches. We collected information from around 500 studies (conducted between January 2020 and January 2021), which not only include general study information, such as the number of patients, study location, and patient outcomes, but also contain more specific information for each individual study, including measurement class (e.g., intensive unit care (ICU), clinical, laboratory), the measured features of a particular class (e.g., oxygen saturation, lymphocyte), and study type (e.g., observational, interventional).
The resulting COVID-19 data catalogue provides a comprehensive and interactive view of results from an extensive, systematic search and curation effort of several hundreds of global initiatives, clinical trial registries, and scientific articles. We prioritized the collected studies based on different criteria, including (i) number of patients, (ii) data availability, (iii) measured variables (e.g., ICU, clinical, laboratory), (iv) one-time measurements (cross-sectional data) or multiple-time measurements (longitudinal data). Next, based on the study rank, the corresponding principal investigators (PIs) were contacted to acquire the datasets of interest. Since the data structure and format of a study are defined based on the study’s goal and the available resources, they are not compatible with each other, nor are they directly usable for downstream applications. Thus, in the last step, the acquired datasets were harmonized, normalized, and curated to be applicable for machines to develop and train COVID-19 personalized predictive models. Finally, the presented resource lays the groundwork for modeling approaches that support the identification of patient-specific risk factors, which can ultimately improve our understanding of the disease.
2. Materials and Methods
The major objective of this work was to generate a comprehensive data catalogue that contains the data and variables necessary to model the individual progression of COVID-19. To reach our goal, we designed a workflow with five main steps, namely: (1) study selection, (2) data investigation and quality assessment, (3) data acquisition, (4) data curation, harmonization, and variable mapping, and (5) dataset preparation (
Figure 1). The corresponding activities of each step are described in
Section 2.1,
Section 2.2,
Section 2.3,
Section 2.4 and
Section 2.5.
The workflow represented in
Figure 1 includes five major steps from study selection to the preparation of datasets for machine learning pipelines. Detailed explanations of each step are described in the corresponding subsections below.
2.1. Study Selection
Studies included in our data catalogue were identified via four different routes: global initiatives, clinical trial repositories, publications, and data repositories. The catalogue is available at
https://github.com/SCAI-BIO/covid-data-catalogue (accessed on 7 June 2023).
Global initiatives
These encompass (i) COVID-Analytics (
https://covidanalytics.io/dataset, accessed on 27 November 2020), a group of researchers from the MIT Operations Research Center, (ii) COVID-NMA (
https://covid-nma.com/, accessed on 27 November 2020), (iii) COVID-evidence (
https://covid-evidence.org/database, accessed on 27 November 2020), a continuously updated database of worldwide evidence on interventions for COVID-19, (iv) the COVID-19 Data Catalogue (
https://datacatalog.worldbank.org/story/covid-19-data, accessed on 27 November 2020), (v) the Global Health Drug Discovery Institute (GHDDI) (
http://www.ghddi.org/, accessed on 27 November 2020), a transformative drug discovery and translational platform, and (vi) CORONAWHY (
https://www.coronawhy.org/, accessed on 27 November 2020), a globally distributed, volunteer-powered research organization attempting to assist the medical community in answering key questions related to COVID-19.
2.1.1. Clinical Trials Repositories
Clinical trial repositories include Clinical Trials Map (HeiGIT) (
https://apps.heigit.org/covid-19-map-of-hope/clinical_trials.html, accessed on 27 November 2020), Chinese Clinical Trial Registry (ChiCTR) (
http://www.chictr.org.cn/abouten.aspx, accessed on 27 November 2020), and the WHO-International Clinical Trials Registry Platform (ICTRP) (
https://www.who.int/clinical-trials-registry-platform, accessed on 27 November 2020), a meta-repository of registered trial information from more than 20 registries worldwide. The ICTRP provided structured information for 4957 COVID-19-related trials (retrieved on 14 August 2020), including the number of participants, contact address, intervention, and study type. However, not all of the trials are relevant for us as we need those that provide longitudinal data on COVID-19 progression for at least more than 100 participants. Based on these minimum criteria, we classified the trials into highly relevant, relevant, less relevant, and not relevant, of which only the first three trial types were added to our data catalogue. The classes and their corresponding criteria are summarized below. The complete list of criteria as well as different outcome measures is provided in
Supplementary Table S1.
Highly relevant: Studies with at least 2 outcome measures, high participant rates, interventional studies, studies with longitudinal data, and those with our outcome of interest (e.g., studies containing data of ICU or respiratory intermediate care unit (RICU) participants).
Relevant: Studies with 1 or 2 outcome measures or with a target outcome of medium interest (e.g., identification of COVID-19, mortality).
Less relevant: Studies with highly specific subject groups (e.g., pregnant women, cancer patients, healthcare workers).
Not relevant: Studies with no follow-up, very short time frames, cross-sectional studies, and studies with no target outcomes.
We would like to highlight that studies that met two or more criteria were ranked based on the combination of the criteria. Moreover, for the relevant studies that were identified, information on the (expected) completeness of the study and the data of contact persons (typically the PI) were also collected.
As the ICTRP platform does not contain all the details required to select relevant studies (e.g., contact data, outcome measure, and study status) and is seldom updated after the first registration, information was also collected from the individual registries included in the ICTRP. For example, in order to identify clinical trials described in the ChiCTR (
http://www.chictr.org.cn, accessed on 27 November 2020), we first identified all studies with a Chinese clinical trial repository ID (ChiCTR followed by 10 digits) described in the ICTRP as of 27 November 2020 (
https://www.who.int/clinical-trials-registry-platform, accessed on 27 November 2020), which resulted in 789 COVID-19-related clinical trials. The ChiCTR was used to obtain additional information for criteria missing from the ICTRP, such as secondary outcomes. The following steps were applied to narrow the list of studies from 789 studies (selected based on relevant criteria):
Nearly all studies that specified the different participant subgroups provided the number of subjects in each of them (e.g., intervention group: 80; control group: 80), and we considered the total number of participants as the sum of participants across all subgroups. Thus, we were able to select a subset of 288 studies out of a total of 789, with at least 100 or more participants, to satisfy the criteria described above.
Studies canceled/retracted for any reason (e.g., due to a lack of participants) were removed from the list of target studies (i.e., 47 studies were removed in total).
Sequential, cross-sectional, and dose comparison studies were excluded, as were studies with a factorial study design.
The remaining clinical trials (233) were checked and ranked in terms of relevance as per the criteria described above.
Of the studies obtained from the ChiCTR, 32 studies were noted as highly relevant for AI-based risk modeling as of 1 December 2021. One limitation of the ChiCTR was the absence of information on study completeness. To overcome this limitation, trial identifiers were cross-checked in EUROPE PMC and PubMed: if publications on these trials could be found, we considered the studies to have intermediate results and took them into consideration. The publications retrieved also contained review articles discussing several trials, including the trial originally searched. These articles were removed and only the ones directly describing a particular study were considered as trial publications. In many cases, results may be published at a later date or may not be published at all. In addition, although longitudinal trials may not yet be completed, they may contain valuable intermediate results.
By comparing the trials from the ICTRP with the ones selected earlier (i.e., based on sources used in previously described efforts, such as our text mining approach), we noted that 25 CHiCTR trials were already included in the data catalogue, of which 13 would have been excluded when applying our abovementioned criteria (i.e., either the number of subjects was below 100 or the study design was sequential), 3 were marked as highly relevant, and 6 as relevant.
Additionally, we have collected publications that refer to COVID-19 clinical trial information. This more comprehensive search for publications on completed clinical trials was conducted by our in-house text mining tool, SCAIView, using the clinical trial identifier tagger with a text mining approach. We have generated a clinical trial identifier tagger that enabled us to search for all clinical trial IDs, e.g., clinicaltrials.gov: NCT + 8 numbers (e.g., NCT04299152) or Chinese clinical trial registry: ChiCTR + 10 numbers. Using this clinical trial identifier tagger, we have searched the CORD19 corpus and Medline 2020. As a result, we obtained 12,247 publications that refer to 4540 studies from 17 different clinical trial repositories. Several papers referring to multiple studies and 4442 publications in CORD19 containing literature on clinical trials from before 2020 were removed. Additional search criteria, such as “clinical outcome”, were also added in SCAIView. Please see the
Supplementary Materials.
Overall, we have manually inspected each of these trials and selected 298 studies that could potentially be used for AI application based on the number of participants (more than 100), completion date (or intermediate results available before September 2021), and study type (e.g., longitudinal).
2.1.2. Publications
From the start of the pandemic, a wide spectrum of studies that focus on different aspects, such as COVID-19-related risk factors [
17] and its treatment [
9], have been published. However, we aimed to gather studies that are useful in developing predictive risk models in which the collection of longitudinal data is one of their main characteristics. Thus, to narrow down the publication search domain, we defined longitudinal data as one of our main keywords. In addition, in order to minimize false positive hits, we used ‘risk modeling’ and ‘prediction analysis’ as other keywords. Taken together, we applied the search paradigms ‘longitudinal data’, ‘prediction analysis’, ‘risk modeling’, ‘COVID-19’, and ‘SARS-CoV-2’ to PubMed in order to identify work that was done in the context of COVID-19 risk prediction modeling.
In parallel to the collection of studies with any of the abovementioned keywords, we also searched for publications in PubMed applying the search paradigms ‘serology’ and ‘serological profiling’ to specifically identify COVID-19-related articles with serological information. We set the goal of collecting serological surveys and investigating their metadata because these data are important for evaluating relevant factors, such as the extent and duration of immunity to SARS-CoV-2 infection or possible cross-immunity. Furthermore, serological data are required to determine seroprevalence and to detect previously undetected asymptomatic infections. Another pertinent aspect is the investigation of serological details such as the study design, laboratory methods, and outcome measures in relation to demographic factors in order to predict the risk of infection and the severity of the disease for different populations in society.
2.1.3. Data Repositories
Studies included in our data catalogue were also identified through major data repositories, including Lean European Open Survey on SARS-CoV-2-infected patients (LEOSS), BBMRI-ERIC, and European Clinical Research Infrastructure Network (ECRIN).
- (1)
LEOSS (
https://leoss.net/, accessed on 27 November 2020) is a clinical patient registry for patients infected with SARS-CoV-2 established by the joint effort from the EITaF and the German Society for Infectious Diseases. It comprises patient data from the LEOSS cohort, including patients on whom invasive ventilation was performed, and variables such as age, gender, month of diagnosis, outcome, and the presence of administered vasopressor agents.
- (2)
BBMRI-ERIC (
https://www.bbmri-eric.eu/, accessed on 27 November 2020) is a European research infrastructure for biobanking integrating information and associated samples from over 60 organizations in 20 countries to store all types of human biological samples, such as blood, tissue, cells, or DNA.
- (3)
ECRIN (
https://ecrin.org/, accessed on 27 November 2020) is a nonprofit organization that regulates multinational clinical trials by linking scientific partners and networks across Europe.
In general, studies that evaluated different measurement categories, such as ICU, clinical, and laboratory, in a longitudinal manner were included in the data catalogue. However, some studies with cross-sectional data may also have been included considering the outcome of the study.
2.2. Data Investigation and Quality Assessment
The metadata information contained in the resulting data catalogue was manually extracted by ten independent curators and added to the data catalogue template. The spectrum of curated metadata covers numerous fields, including study reference and title, study location, the number of subjects, study type, data type, study duration, existence of a variable category, and measured variables for a particular category (the full list of metadata is available at
https://github.com/SCAI-BIO/covid-data-catalogue (accessed on 7 June 2023)). The data catalogue template was predefined based on the initial set of 15 studies. However, new fields were subsequently added to accommodate the information extracted from additional studies. Furthermore, we conducted a quality control step where entries were reviewed by multiple curators to exclusively retain those studies that fulfilled our criteria, including data availability, the number of subjects, phase of the study (completed studies in the context of clinical trials), contact information availability, useful data in the context of the measured variables and the number of follow-up measurements.
2.3. Data Acquisition
The studies included in the data catalogue were divided into 3 priority levels based on various criteria, including (i) the number of patients, (ii) data availability, (iii) measured variables (e.g., ICU, clinical, laboratory), and (iv) the number of follow-up measurements. Studies with longitudinal data, a substantial number of patients (e.g., 1000 or more), variable types, including ICU, clinical, and laboratory features, and data availability were assigned the highest priority level. Similarly, the studies with longitudinal data, patients within a range of one hundred to one thousand, variable types such as ICU, clinical, and laboratory features, and data availability were assigned the second highest priority level, while the remaining studies were considered as the third priority. Then, based on the study rank, the corresponding PI(s) of the studies with the highest priority were contacted in the first round and the other two priorities were contacted in the second and third rounds, respectively.
2.4. Data Curation, Harmonization, and Variable Mapping
From the start of the COVID-19 pandemic, numerous regional, national, and international studies have been performed, each of which provides important insights into the disease. To develop a robust personalized predictive risk model, these studies should be semantically interoperable and the data points used by these datasets need to be normalized. However, a global standard data model that comprises all COVID-19-related terms is not available as of now. Therefore, we have used three controlled vocabularies to establish the interoperability and mapping towards various datasets and data points, namely, the German Corona Consensus Dataset (GECCO) [
18], the COVID-19 Ontology [
19], and the Corona Virus Vocabulary (COVOC) (
https://github.com/EBISPOT/covoc/raw/master/covoc.owl, accessed on 27 November 2020).
However, assessing this interoperability is not straightforward as the studies investigated neither followed a common naming system for variables nor represented values of the same measurement in an equal manner. For example, variable names in individual datasets may be in different languages based on the origin of the study. Moreover, units of measurements in different datasets may also differ. For example, while hemoglobin may be measured based on a mole per volume in one dataset, it may be measured based on grams per deciliter in another dataset. In addition, even if an overlap does exist between two variables, they may not be the same. For instance, while in a dataset the age of a sample might be explicitly mentioned, in another dataset it is implicit in the date of birth and thus must be inferred to enable data interoperability.
To enable a meaningful and comparable assessment of data interoperability, harmonization and variable mappings have been performed in two steps:
Variable name normalization: All non-English variable names were translated into English using common translators. Next, a native speaker checked whether the original variable names and their translations were correct.
Variable mapping: Mapping of variables was performed in a semi-automatic way. First, the variables of datasets were mapped using the tidystringdist string-matching package in the R programming language. The tidystringdist package calculates the distance between variables (all against all) of datasets (pairwise) in the range of zero (completely similar) and 1 (completely different). Next, the variables whose distance was more than 0.25 were filtered. This threshold was selected after a manual investigation of the variable mapping results of multiple datasets. We found that the proportion of correct mapped variables with a distance less than 0.25 was the highest among all other tested thresholds. Then, the mapped variables were manually investigated by a trained curator to check whether they indicated the same concept (flagged 1, otherwise 0). Finally, the number of mapped variables that were flagged as 1 was considered as an interoperability score of two datasets.
After the harmonizing and variable mapping procedure, the mapped and unmapped variables were added to our variable mapping catalogue. Using this catalogue, we have extended the ontology that reuses the provided GECCOplus data model and dataset (
https://art-decor.org/art-decor/decor-project--covid19f, accessed on 27 November 2020). Using this ontology, we enable data stewards or data scientists to map variables from new clinical datasets to concepts in our data model via the web-based INDAST Tool (
http://coperimo.mevis.fraunhofer.de/ (accessed on 7 June 2023)). The main goal of the INDAST Tool is to provide a platform for sharing and harmonizing new clinical datasets (not only in the COVID-19 context) as input for machine learning pipelines.
2.5. Dataset Preparation for Machine Learning Pipelines
The ability to build a generalizable, (personalized) predictive machine learning model based on given data is dependent on a number of criteria (
Table 1). In this table, we define several important criteria and assess the AI readiness of the acquired datasets based on them.
For the general support of downstream AI tasks and dataset AI-readiness evaluation, we performed basic data cleaning and preprocessing and compiled a data dictionary. See details in the
Supplementary Materials.
2.6. Visualization and COVID-19 Data Viewer
We have developed an interface to facilitate access to the curated metadata of the datasets included in the COVID-19 data catalogue. This interface summarizes the most important metadata, such as measured features, and provides a means to obtain access to the datasets. The web application was implemented in Python using Flask and several JavaScript libraries for visualization purposes including D3.js, DataTables, and DataMaps.
3. Results
3.1. Data Catalogue Content
The data catalogue includes information on around 500 studies that were extracted from different sources:
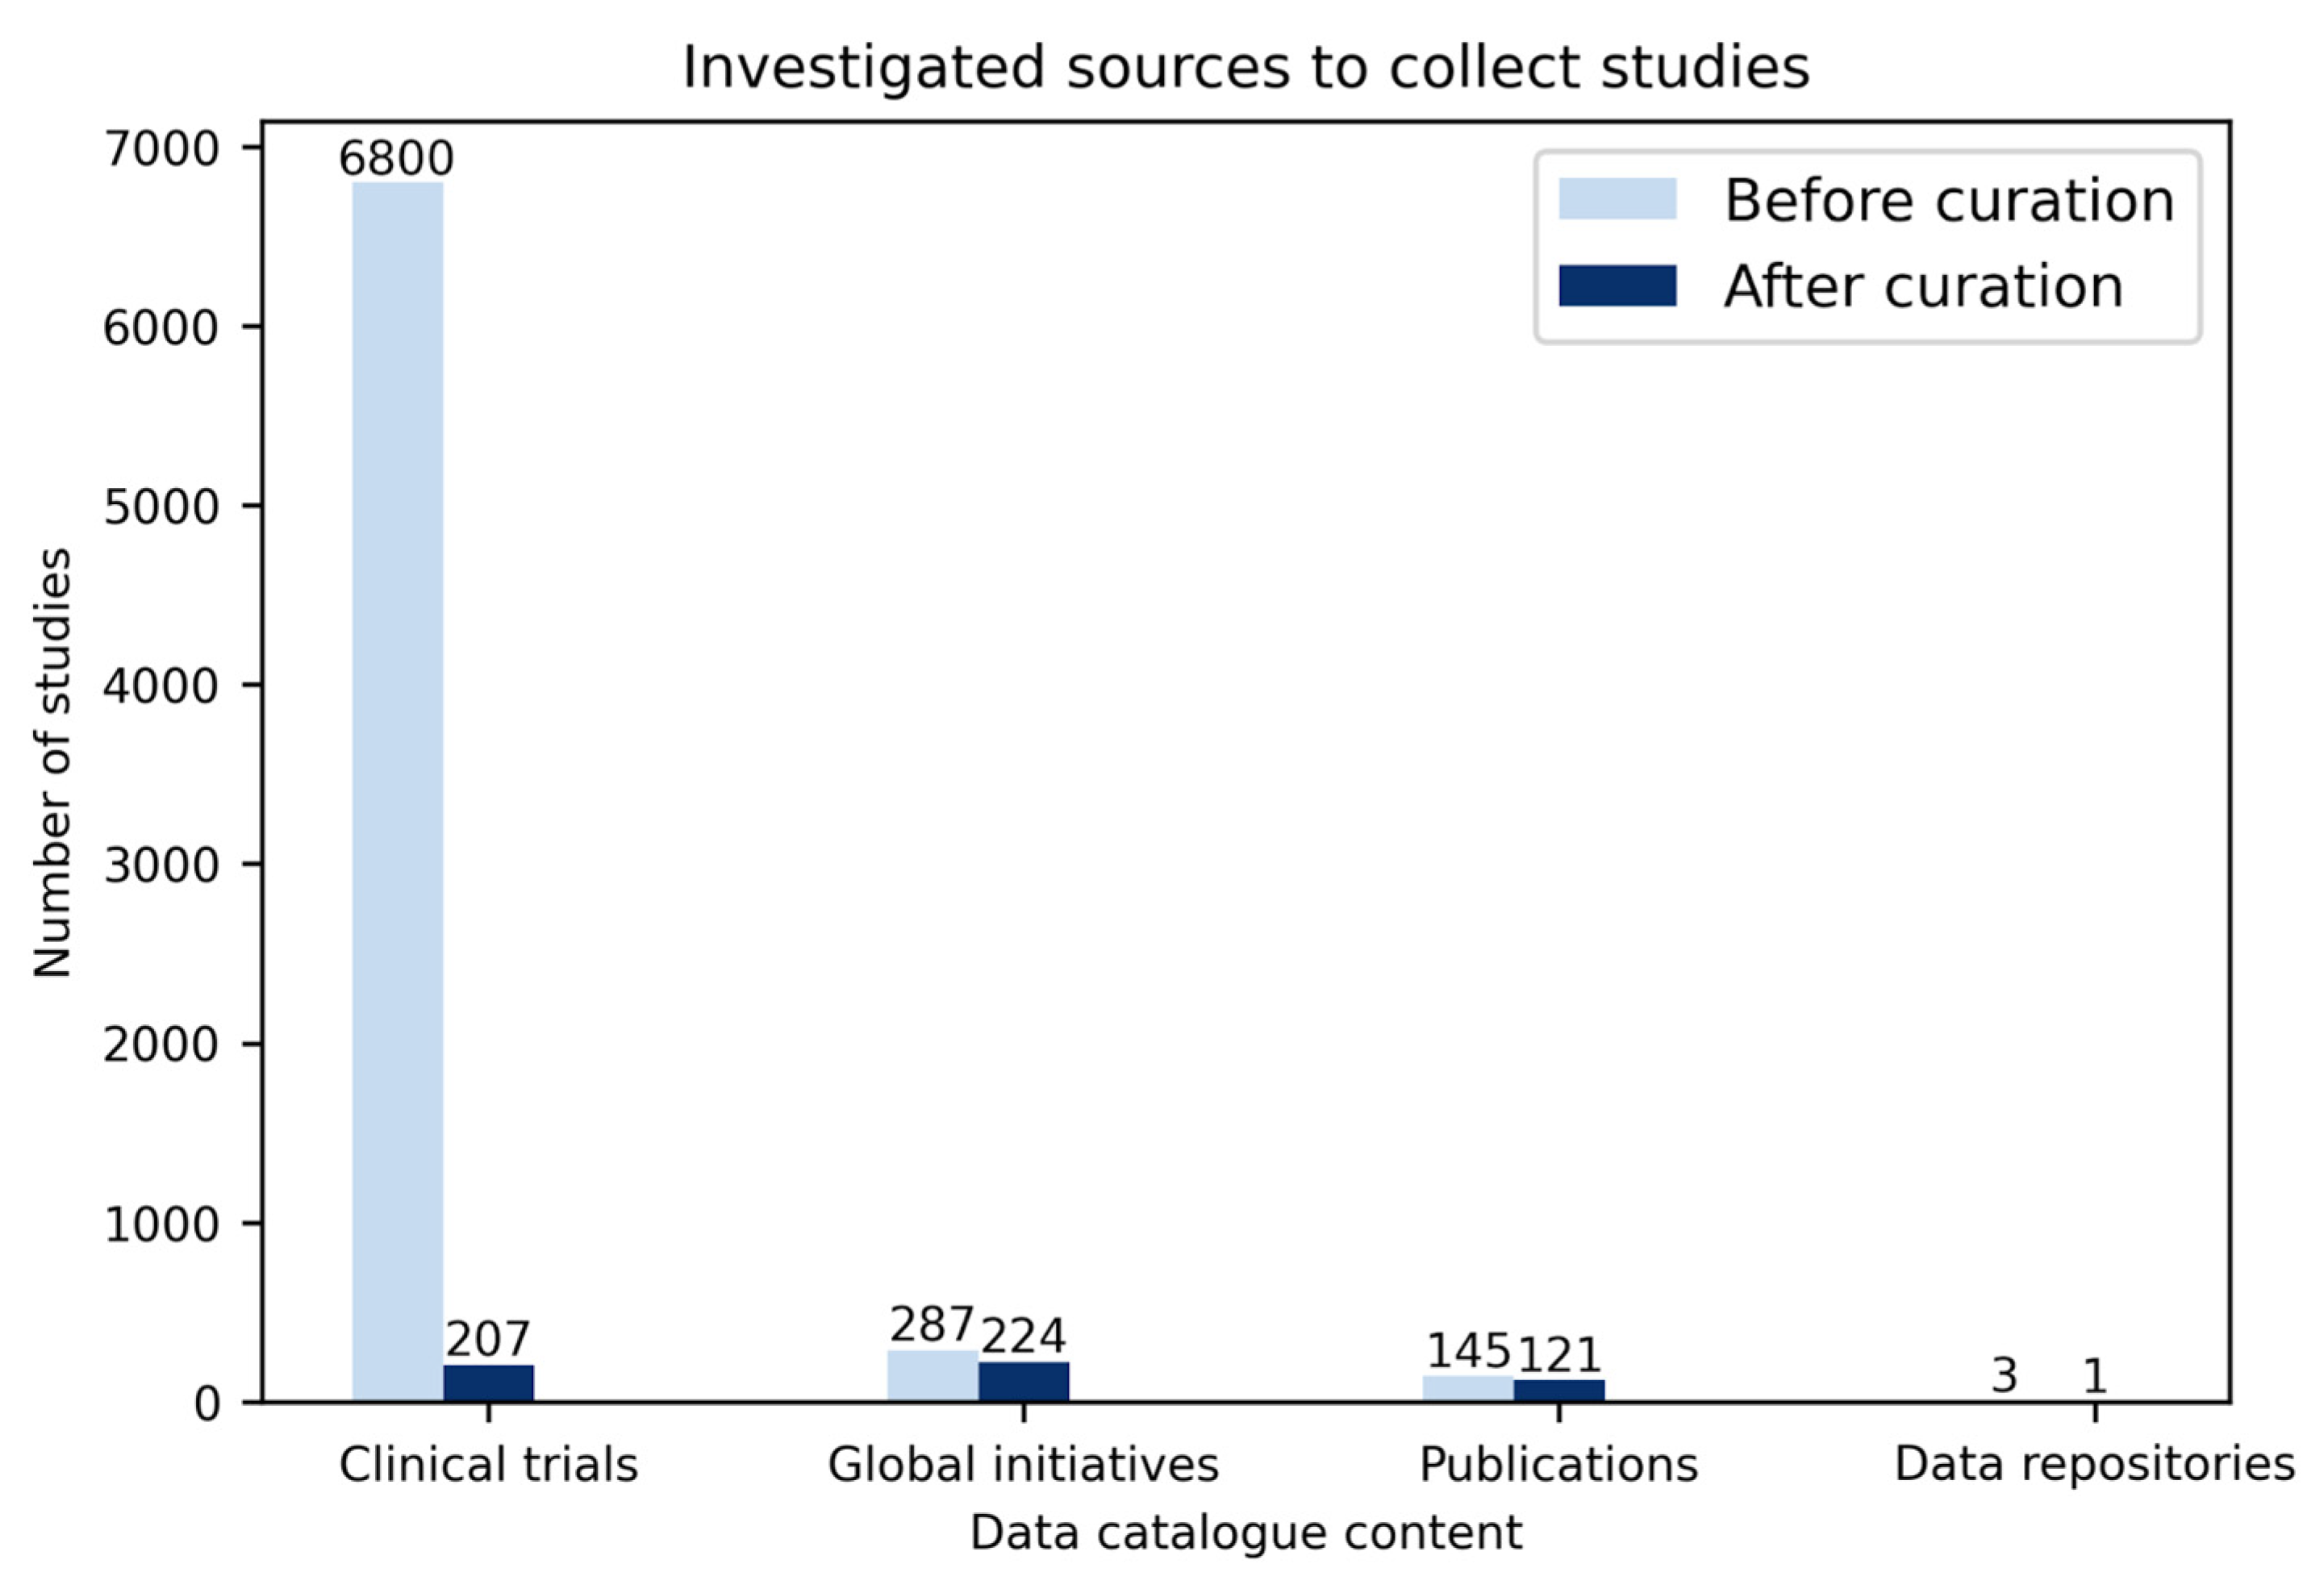
Global initiatives. In total, 287 studies were collected from the global initiatives’ sources (COVID-Analytics: 202, COVID-NMA: 64, COVID-Evidence: 21) in which after curation (i.e., omitting duplicates and studies without contact information), 224 studies were added to our data catalogue (
Figure 2).
Three main sources including global initiatives, clinical trials, and publications were investigated. Over 7000 studies were investigated, from which, following curation, around 500 studies were added to the data catalogue.
Clinical trials. Until 27 November 2020, around 6800 clinical trials were registered in different registers worldwide, e.g., ClinicalTrials.gov: 3327, ChiCTR: 762, CTRI: 514, IRCT: 337 (
Figure 2). After extracting information from all these clinical trials such as the number of participants, contact address, study type (e.g., interventional, observational), study phase (e.g., recruiting, completed), and data type (cross-sectional, longitudinal), 207 trials were selected to be added to our data catalogue. The chosen trials were selected based on multiple criteria, including: (
i) a minimum of 100 participants, (
ii) the availability of clinical/ICU data, (
iii) the availability of longitudinal data, and (
iv) the completeness of the studies.
Publications. Altogether, 145 studies were gathered from PubMed, bioRxiv, and medRxiv using different combinations of SARS-CoV-2, COVID-19, machine learning, survival analysis, longitudinal data, and clinical data keywords. Out of the 145 studies, 121 remaining after curation were added to our data catalogue (i.e., omitting duplicate studies, those with missing contact information, and studies with explicit mentions that the data cannot be shared) (
Figure 2).
3.2. Studies Overview
Not all studies included in the data catalogue addressed the same study goal, thus, the same variables were not consistently observed across these studies. For example, while some studies were designed to answer specific questions on interventions and included drugs as important variables, other studies investigated COVID-19 risk factors, and thus, other types of variables, such as demographics and comorbidities, were considered in them.
Figure 3 displays different types of variables that were measured in the studies included in the data catalogue. While clinical and laboratory variable types are the two most commonly measured variables, imaging variables are the least common.
As shown in
Figure 3, the clinical and laboratory variables are the two most measured features from over 150 studies.
Similarly, several associated COVID-19 clinical and laboratory variables, such as blood oxygen saturation, respiratory rate, neutrophils, lymphocytes, platelets and D-dimer have been reported [
20,
21]. However, not all of them were measured across the studies that are included in our data catalogue. The charts below (
Figure 4 and
Figure 5) display the number of studies in which not only these variables but also some other important variables were observed.
As we can see in
Figure 4, the
X-axis shows the more common clinical variables, and the
Y-axis shows the number of studies in which these variables were measured. Heart rate and body temperature are the two most measured features from over 150 studies, with measurements observed in 10 collected studies.
In
Figure 5, the
X-axis shows common laboratory variables while the
Y-axis shows the number of studies in which each of the variables was measured.
3.3. Data Acquisition Outcome
Study contacts (PIs) of collected studies were contacted in two rounds. In the first round, a data request email was sent (organized via a professional CRM system) to 552 contacts, of which 319 were from China. As we received a limited response from the contacts of each of these studies, we performed a second round of email campaigning to 225 PIs who had not responded in the first round. In a third attempt, study contacts from 50 studies from rank one and two studies based on specific study regions (i.e., USA and European countries) and number of participants (i.e., more than 100) were prioritized and contacted directly via email. Overall, from the 552 data collection requests that were sent, only 15 replies were received, and the acquisition of exclusively 4 datasets was successful.
3.4. Summary of Harmonization and Variable Mapping
While a wide range of studies have been performed since the start of the pandemic, not all of them have had the same goal and study design, and thus, their measured variables are different. For example, while in LEOSS and Medical Information Mart for Intensive Care (MIMIC) [
22] studies, a wide range of features, such as clinical, ICU, laboratory, drug, and comorbidities have been measured in other studies, such as data from COVID-19 patients from the Aachen and Frankfurt university clinics, ICU and laboratory features are the main measured features. To better assess the interoperability of the collected studies, we harmonized and mapped the corresponding variables of the studies to GECCO, COVOC, and the COVID-19 ontology (see
Section 2.4).
Table 2 represents the overview of interoperability evaluation by summarizing the number of features in individual studies and the number of common concepts between certain pairs of studies.
3.5. Dataset Preparation for Machine Learning Pipelines
As a showcase,
Table 3 summarizes the AI-readiness evaluation of one of the acquired datasets, Major Determinants of COVID-19-Associated Pneumonia study (MC-19), by investigating some of its main characteristics (
Figure 6,
Figure 7,
Figure 8 and
Figure 9). The procedure for the preprocessing of the dataset from this study is provided in the
Supplementary Materials.
MC-19, sponsored by the Catholic University of the Sacred Heart in Italy, is an observational study (case-control) to assess if samples with negative tests in laboratory testing for COVID-19 suffering from pneumonia are positive in the serology for SARS-CoV-2. Moreover, the investigators aimed to identify patients with initially negative laboratory tests for COVID-19 with the help of serology measurements and CT scans.
Sample size and event rate: We visualized the longitudinal hospitalization of the patients and thus, by extension, the patient hospitalization outcome (i.e., discharged or died) over the course of hospitalization. While the hospitalization time was less than 14 days for most patients, some stayed up to 50 days in the hospital (
Figure 6).
The chart illustrates the duration of hospitalization (in days) for patients in the MC-19 study and, thereby, inherently patient hospitalization outcomes (i.e., discharged or died). For most patients, hospitalization time was less than 14 days.
While MC-19 has 319 samples, hospitalization outcome was only recorded for 304 samples (i.e., event rate = 95%); thus, the further downstream data-driven modeling would be limited to 304 samples. Although meaningful findings could be extracted from a dataset with only hundreds of samples, due to the limited sample size, the findings may not be reliable and affect the model’s generalizability. For example, investigating MC-19 shows a high risk of fatality in samples with a body mass index (BMI) lower than 20 and higher than 30 (
Figure 7), which has also been shown in other studies [
23]. However, due to the limited number of patients with the aforementioned BMI in MC-19, this finding cannot be generalized.
The bars in the figure depict the percentage of patients for a range of BMIs, while the line graph displays information on the fatality rate for these patients. The fatality rate for patients with a BMI less than 20 or greater than 30 is the highest among all other BMI ranges.
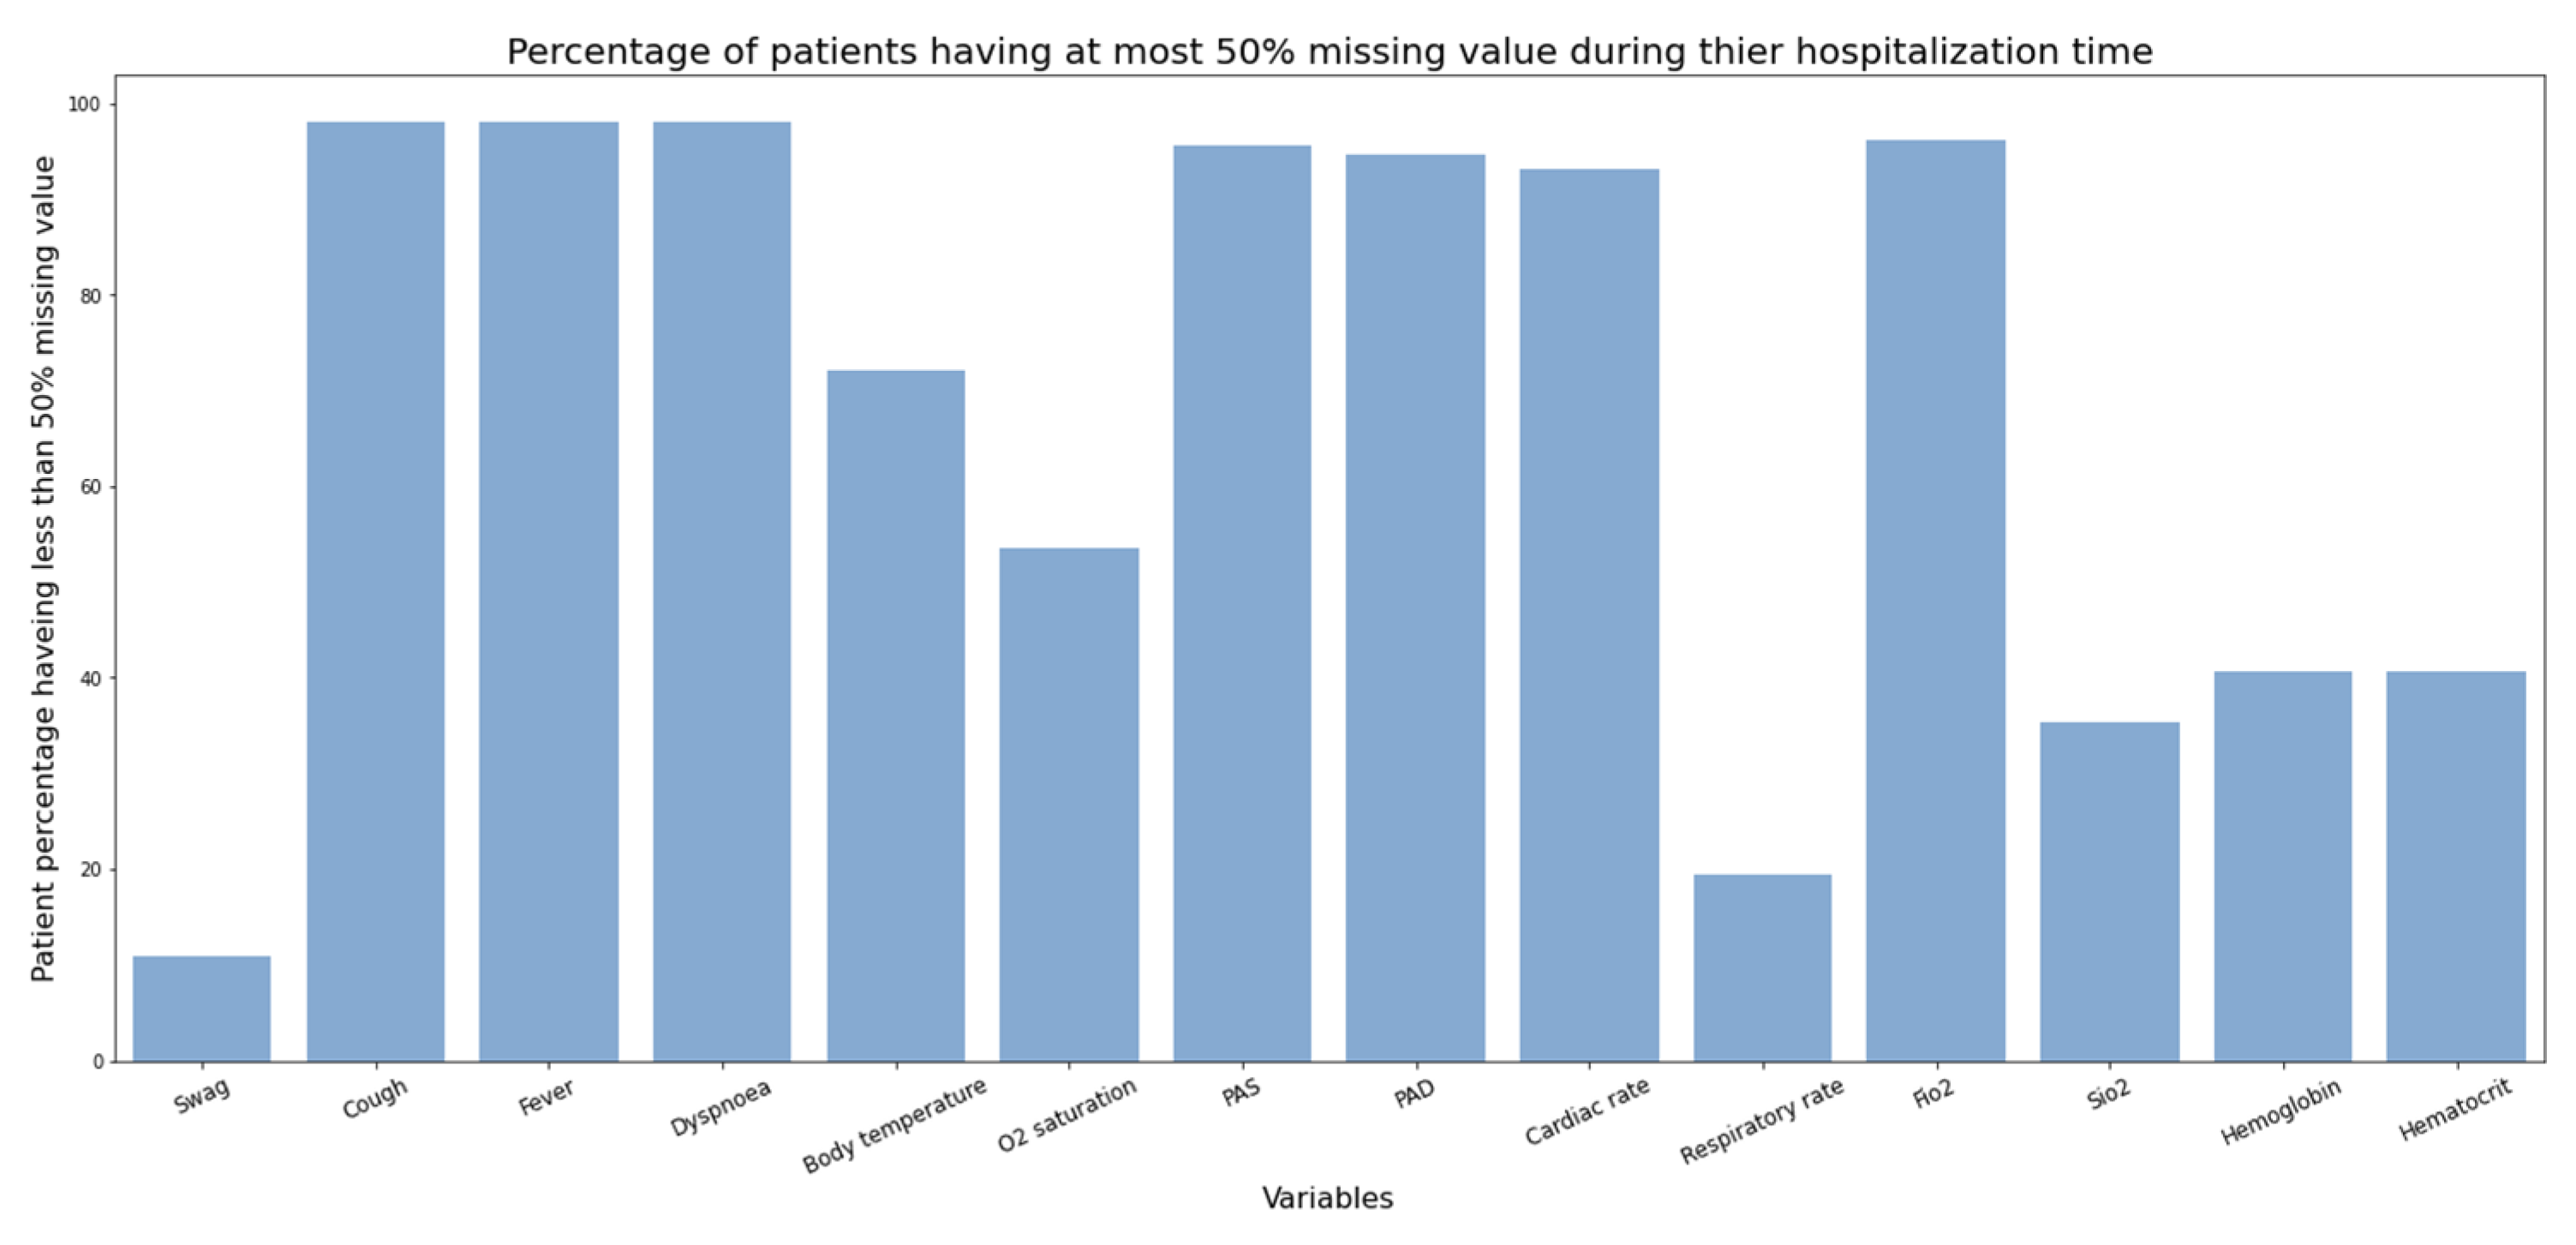
Data completeness: A wide range of variables, including drug, demographics, laboratory, serology, imaging, ICU, and clinical variables were measured for this study (
Figure 8 and
Figure 9). We investigated the proportion of missing values for some of the longitudinal (
Figure 8) and static variables (
Figure 9). While the proportion of missing values in static variables except “smoking” and “pneumonia” is not considerable, the proportion for longitudinal variables is significant. For example, measurements for “hemoglobin”, “hematocrit”, and “Sio2” were not taken in half of the patient’s hospitalization time in almost 50% of patients. This much missing data could make a dataset unsuitable for applying statistics and further disease modeling.
From
Figure 8 we can see that hemoglobin, hematocrit, and Sio2 were not measured in half of the patient’s hospitalization time in almost 50% of patients. However, PAS, PAD, and Fio2 were measured for more than half of the patient’s hospitalization time in almost 95% of patients.
In
Figure 9, the
X-axis shows static variables, and the
Y-axis shows the number of missing values for each variable. Smoking and pneumonia status are missing for more than 30% of patients.
The first effort to aggregate cohorts: As the final target for making datasets ready for advanced algorithms is the aggregation of several cohorts to generate a consistent but expanded dataset for modeling applications, we attempted to integrate two of the sampled cohorts (MC-19 and Presurv [
24]) into a new one (Merged). This effort required the fulfillment of several criteria to be technically and ethically successful. First, only “matchable” variables were mapped and considered for aggregation (38 variables). Second, patient identifiers and all related demographic variables remained unchanged during the merging process. Third, visit dates were altered, removing their time notations and transforming them to an additional variable, “hospitalization days” (i.e., days spent in hospital since initial hospitalization). Finally, we annotated the provenance to maintain track of the original entries. With these basic principles in mind, we generated the Merged cohorts. Our expectation of the Merged cohort may sound counterintuitive: we could not expect, for instance, a reduction in the absolute number of missing values, though we did expect a more coherent and less dispersed distribution of variable values, which we indeed found, as summarized in
Table 4. Indeed, measuring the absolute distribution around the median (MAD), we found that the Merged cohort was more coherent and with fewer outliers than the original individual cohorts for more than 58% of the aggregated variables. Naturally, for half of the variables, Merged showed a lower MAD value than MC-19, while for the other half of the variables, Merged was more coherent with respect to the Presurv cohort. These values were somewhat surprising as, while we could anticipate that variable ranges would be less dispersed in the Merged cohort with respect to the original individual ones, we did not expect that they would be to the degree we observed. How much this behavior is general and extendable to all cohorts is beyond the scope of the present paper and we will perform a deeper analysis of this in the future.
Table 4 reports a set of 22 variables present in each of the cohorts (58% of 38 total numeric variables). Lower MAD deviations from the median signify that cohort aggregation helped make variables more coherent or closer to the median.
3.6. COVID-19 Datasets Visualization
The COVID-19 data viewer (
https://www.coperimoplus.eu/en/data-models/data.html, accessed on 27 November 2020) summarizes the most important metadata, such as measured features, and facilitates accessing the datasets and visualizing the relative number of collected studies in the data catalogue based on their geographic location (
Figure 10). Based on the geographic distribution of studies, the number of collected studies from European countries, such as Sweden and Russia, as well as countries from South America, such as Brazil, is greater compared with other locations. Furthermore, we released the underlying data at
https://github.com/SCAI-BIO/covid-data-catalogue (accessed on 7 June 2023).
4. Discussion
Our data catalogue provides information on around 500 studies on COVID-19, identified from manuscripts, clinical trials, and global initiatives. The organization of these studies supports the development of personalized predictive models and the broad investigation of disease risk factors, which, in turn, may lead to opportunities for therapeutic interventions. The data catalogue involved significant curation, harmonization, and evaluation of datasets that were not free of challenges. The challenges are discussed in three main groups, including sociological and technical and AI-readiness evaluation.
Ethical and sociological challenges: While we submitted data access requests to more than 500 PIs, only a handful of them shared their data. There were multiple reasons why we could not get access to some of the cohorts. First, the majority of data owners did not reply to our inquiries despite the multiple follow-up emails sent over the course of several months and even despite attempts to connect via business networks and social media. Second, legal issues during the data sharing process hindered our access to datasets. Third, ethical considerations also hampered access to datasets. Participant data can potentially be associated with their identity and, accordingly, data sharing poses a risk of identification of participants as well as stigmatization and discrimination, which ultimately prevents data owners from sharing their data. Hence, the privacy interests of participants are also important considerations to be made.
Technical challenges: The lack of interoperability across datasets impedes the development of harmonized datasets as each of the datasets was established without the use of controlled vocabularies for consistent feature naming. Thus, even if the same feature was collected in two studies, it would be referred to in different terms, severely impeding the direct comparison of datasets and validation of findings across disparate cohorts.
AI-readiness evaluation: The readiness of a dataset for AI purposes can be evaluated based on multiple criteria, each of which is highly situation-dependent. For example, while hundreds of samples can lead to a good performance using a simple linear AI algorithm aimed at predicting the true relationship between patient-specific characteristics and the endpoint, a nonlinear AI algorithm, such as neural networks, may require thousands of samples. Moreover, the number of samples in a dataset should be representative of the entire disease population. Thus, modeling approaches that are based on a few hundred samples might not represent the heterogeneity of the entire population. Given these two aforementioned points, while the MC-19 dataset can be used for simple time-to-event models, it might not be practical to be used with powerful AI algorithms for personalized predictive models as it has a limited number of samples. In addition, it is important to consider the completeness of the data as it is generally consistent over all the features in a dataset. Thus, removing missing values, imputing missing values, and removing features with a high number of missing values would be three potential solutions. While the first solution (i.e., removing missing values) may influence the number of features in relation to the number of patient criteria, the second option (i.e., imputation) could lead to model inaccuracy and affect the model robustness. Removing the features with a high proportion of missing values could also lead to losing a lot of information, which, in turn, causes model unreliability. The applicability of MC-19 with approximately 50% missing values specifically for variables with follow-up measurements highly depends on the type of the AI algorithm. In contrast, one recent study [
25] aimed at predicting COVID-19 mortality using the LEOSS dataset—a dataset containing relatively fewer missing values (less than 50%) and a broad range of modalities (i.e., demographics, clinical, drugs, laboratory, imaging, comorbidities)—resulted in an AUC of approximately 80%. Taken together, for a dataset to be “AI-ready”, which might need a lot of preprocessing work, is highly subjective, and different factors should be taken into consideration.


 ,
, 


