Abstract
The state of Victoria, Australia, implemented one of the world’s most prolonged cumulative lockdowns in 2020 and 2021. Although lockdowns have proven effective in managing COVID-19 worldwide, this approach faced challenges in containing the rising infection in Victoria. This study evaluates the effects of short-term (less than 60 days) and long-term (more than 60 days) lockdowns on public mobility and the effectiveness of various social restriction measures within these periods. The aim is to understand the complexities of pandemic management by examining various measures over different lockdown durations, thereby contributing to more effective COVID-19 containment methods. Using restriction policy, community mobility, and COVID-19 data, a machine-learning-based simulation model was proposed, incorporating analysis of correlation, infection doubling time, and effective lockdown date. The model result highlights the significant impact of public event cancellations in preventing COVID-19 infection during short- and long-term lockdowns and the importance of international travel controls in long-term lockdowns. The effectiveness of social restriction was found to decrease significantly with the transition from short to long lockdowns, characterised by increased visits to public places and increased use of public transport, which may be associated with an increase in the effective reproduction number (Rt) and infected cases.
1. Introduction
The global epidemic caused by severe acute respiratory syndrome 2 (SARS-CoV-2) has since spread rapidly worldwide. The main mode of transmission of SARS-CoV-2 is through respiratory droplets that are produced when an infected person talks or coughs and can be transmitted through the air and inhaled by people nearby [1,2]. The virus can land on a surface and remain viable for hours to days [3].
In an effort to stem the rise in COVID-19 cases worldwide, many countries have implemented lockdowns to restrict social gatherings and minimise contact with infected individuals. China, Sweden, Australia, and South Korea implemented a series of lockdowns in several cities to delay the time of peak infection, highlighting the effectiveness of restrictions in mitigating the ongoing transmission of SARS-CoV-2 by exerting a significant influence on public mobility [4,5,6]. Researchers have presented the effectiveness of restrictions in European countries, showing significant reductions in transmission rates and a flattening of the infection curve based on data collected from European countries [7]. A recent study has shown similar results, finding that restriction policies have significantly and substantially slowed the growth of COVID-19 infections in China, South Korea, Italy, Iran, France, and the USA [8]. In addition, a study conducted in England found that people consistently reported fewer social contacts during the lockdown period, resulting in a corresponding reduction in COVID-19 infections. However, the magnitude of this effect was found to depend on the specific type and nature of the restrictions implemented [9]. In a further case study of the UK and the US, researchers found that multiple interventions of quarantine had a significant impact on virus transmission [10]. Taken together, these findings highlight the critical role of lockdown in limiting the spread of the virus by restricting interpersonal interactions and mobility, ultimately contributing to the containment of the COVID-19 pandemic.
The state of Victoria in Australia gained international attention for setting a record as the region with the longest cumulative lockdown period in the world [11]. This record was achieved as Victoria spent a remarkable cumulative total of 302 days under a series of six lockdowns in 2020 and 2021. These lockdowns showed significant variation in their duration, ranging from 12 days to 141 days. This extended period of lockdown began on 19 January 2020, when the state confirmed its first case of COVID-19. However, despite the frequency of the lockdown policy in Victoria, the state government’s efforts to slow the spread of SARS-CoV-2 were not always effective. According to the data from the Victorian Government [12], the region continued to experience significant waves of COVID-19 infection during the lockdown period.
This situation raises two pertinent questions: (1) How effective are Victoria’s lockdowns in altering public mobility, given their long duration and frequent implementation? (2) What is the effectiveness of various social restriction measures, such as face cover policies, contact tracing and international travel controls, etc., over different durations of lockdown? This complex dynamic requires a thorough evaluation of the effectiveness of the various social restriction measures implemented during the Victoria lockdown periods. It also requires an in-depth analysis of the factors contributing to the trends observed in COVID-19 cases during these extended lockdowns to ensure a comprehensive understanding of pandemic progression and control measures.
The increasing availability of electronic health data provides a significant opportunity for the integration of machine learning approaches in health epidemiology [13]. Machine learning techniques harness the power of training data to construct simulation models, enabling researchers to conduct efficient and accurate analyses of large datasets. This approach facilitates the identification of complex patterns and relationships that may prove to be difficult to identify using traditional data analysis methods [14,15,16]. In addition, the flexibility of machine learning extends to its ability to aggregate data from different sources. This ability allows for a more holistic analysis, enriching health epidemiologists’ understanding of the complex interplay between biological and social factors that contribute to the risk of contracting infectious diseases. It improves the understanding of transmission pathways and supports the development of robust prevention strategies [13,15]. As such, machine learning is emerging as a valuable tool for advancing epidemiological research and public health efforts. Recent research on machine learning applications in the context of COVID-19 has shown promising progress, with recent studies highlighting the role of machine learning in supporting diagnosis, drug and vaccine development, and overall pandemic management [17,18]. In addition, a similar study demonstrates the significant impact of machine learning, such as SVM, on the forecasting and epidemiology of COVID-19, highlighting its potential to predict disease spread and aid early diagnosis [19]. Taken together, these studies highlight the growing importance of machine learning techniques in managing the COVID-19 crisis and their potential to shape future epidemiological research and public health strategies.
Consequently, this research, using advanced machine learning techniques, aims to (1) thoroughly investigate the complex interplay between lockdown duration and community mobility, particularly in terms of their influence on containing COVID-19 infection in Victoria, and (2) explore the multiple dimensions of pandemic management by evaluating the effectiveness of various social restriction strategies over different lockdown durations. This methodology is designed to significantly improve our understanding and formulation of more effective and resilient COVID-19 response strategies. Our research is not limited to mere observation but delves deeply into the effects of lockdown and provides profound insights into their effectiveness. By bringing together data from these policies, mobility patterns, and COVID-19-related information, we unravel the complex dynamics underlying pandemic control, highlighting the evolving pandemic response situation and the need for flexible and responsive strategies in our ongoing battles against this challenging public health adversary.
2. Materials and Methods
2.1. Data Sources
In this comprehensive study, we have used multiple datasets to explore the complex dynamics of the COVID-19 pandemic in Victoria. The dataset includes crucial information on Victoria’s COVID-19 cases and vaccination statistics, which have been extracted from the Johns Hopkins University COVID-19 data repository, covering the period from March 2020 to October 2021 [20]. In addition, the Victoria Mobility Dataset, sourced from Google Community Mobility, was instrumental in assessing public mobility trends during the pandemic [21]. A detailed breakdown of this dataset is provided in Table 1.

Table 1.
Mobility data during the lockdown period.
To provide a comprehensive view of the pandemic response, we also aggregated information on the six lockdowns that occurred in Victoria during 2020 and 2021. These data were sourced from the official Victorian Government website, as shown in Table 2 [22]. To facilitate analysis, we categorised them into two distinct groups based on their duration: short-term lockdowns (lasting less than 60 days) and long-term lockdowns (lasting more than 60 days). This categorisation provides valuable insights into the diverse range of COVID-19 control measures implemented in the region and highlights the varying lengths of these vital interventions.
Table 2.
Victorian lockdown information.
In addition, the social restriction policy dataset was obtained from the Oxford COVID-19 Government response tracker and Victorian Government website to evaluate daily social restriction levels in Victoria [22,23], as shown in Table 3. This will be used to evaluate the effectiveness of various social restrictions over different periods of lockdown.
Table 3.
Policy indicators.
Overall, the social restriction policy data, Google community mobility data, and lockdown information will be considered as the explanatory variables that are used in the model, while daily COVID-19 cases will be the dependent variables that we use to simulate the COVID-19 infection within Victoria.
2.2. Data Analysis
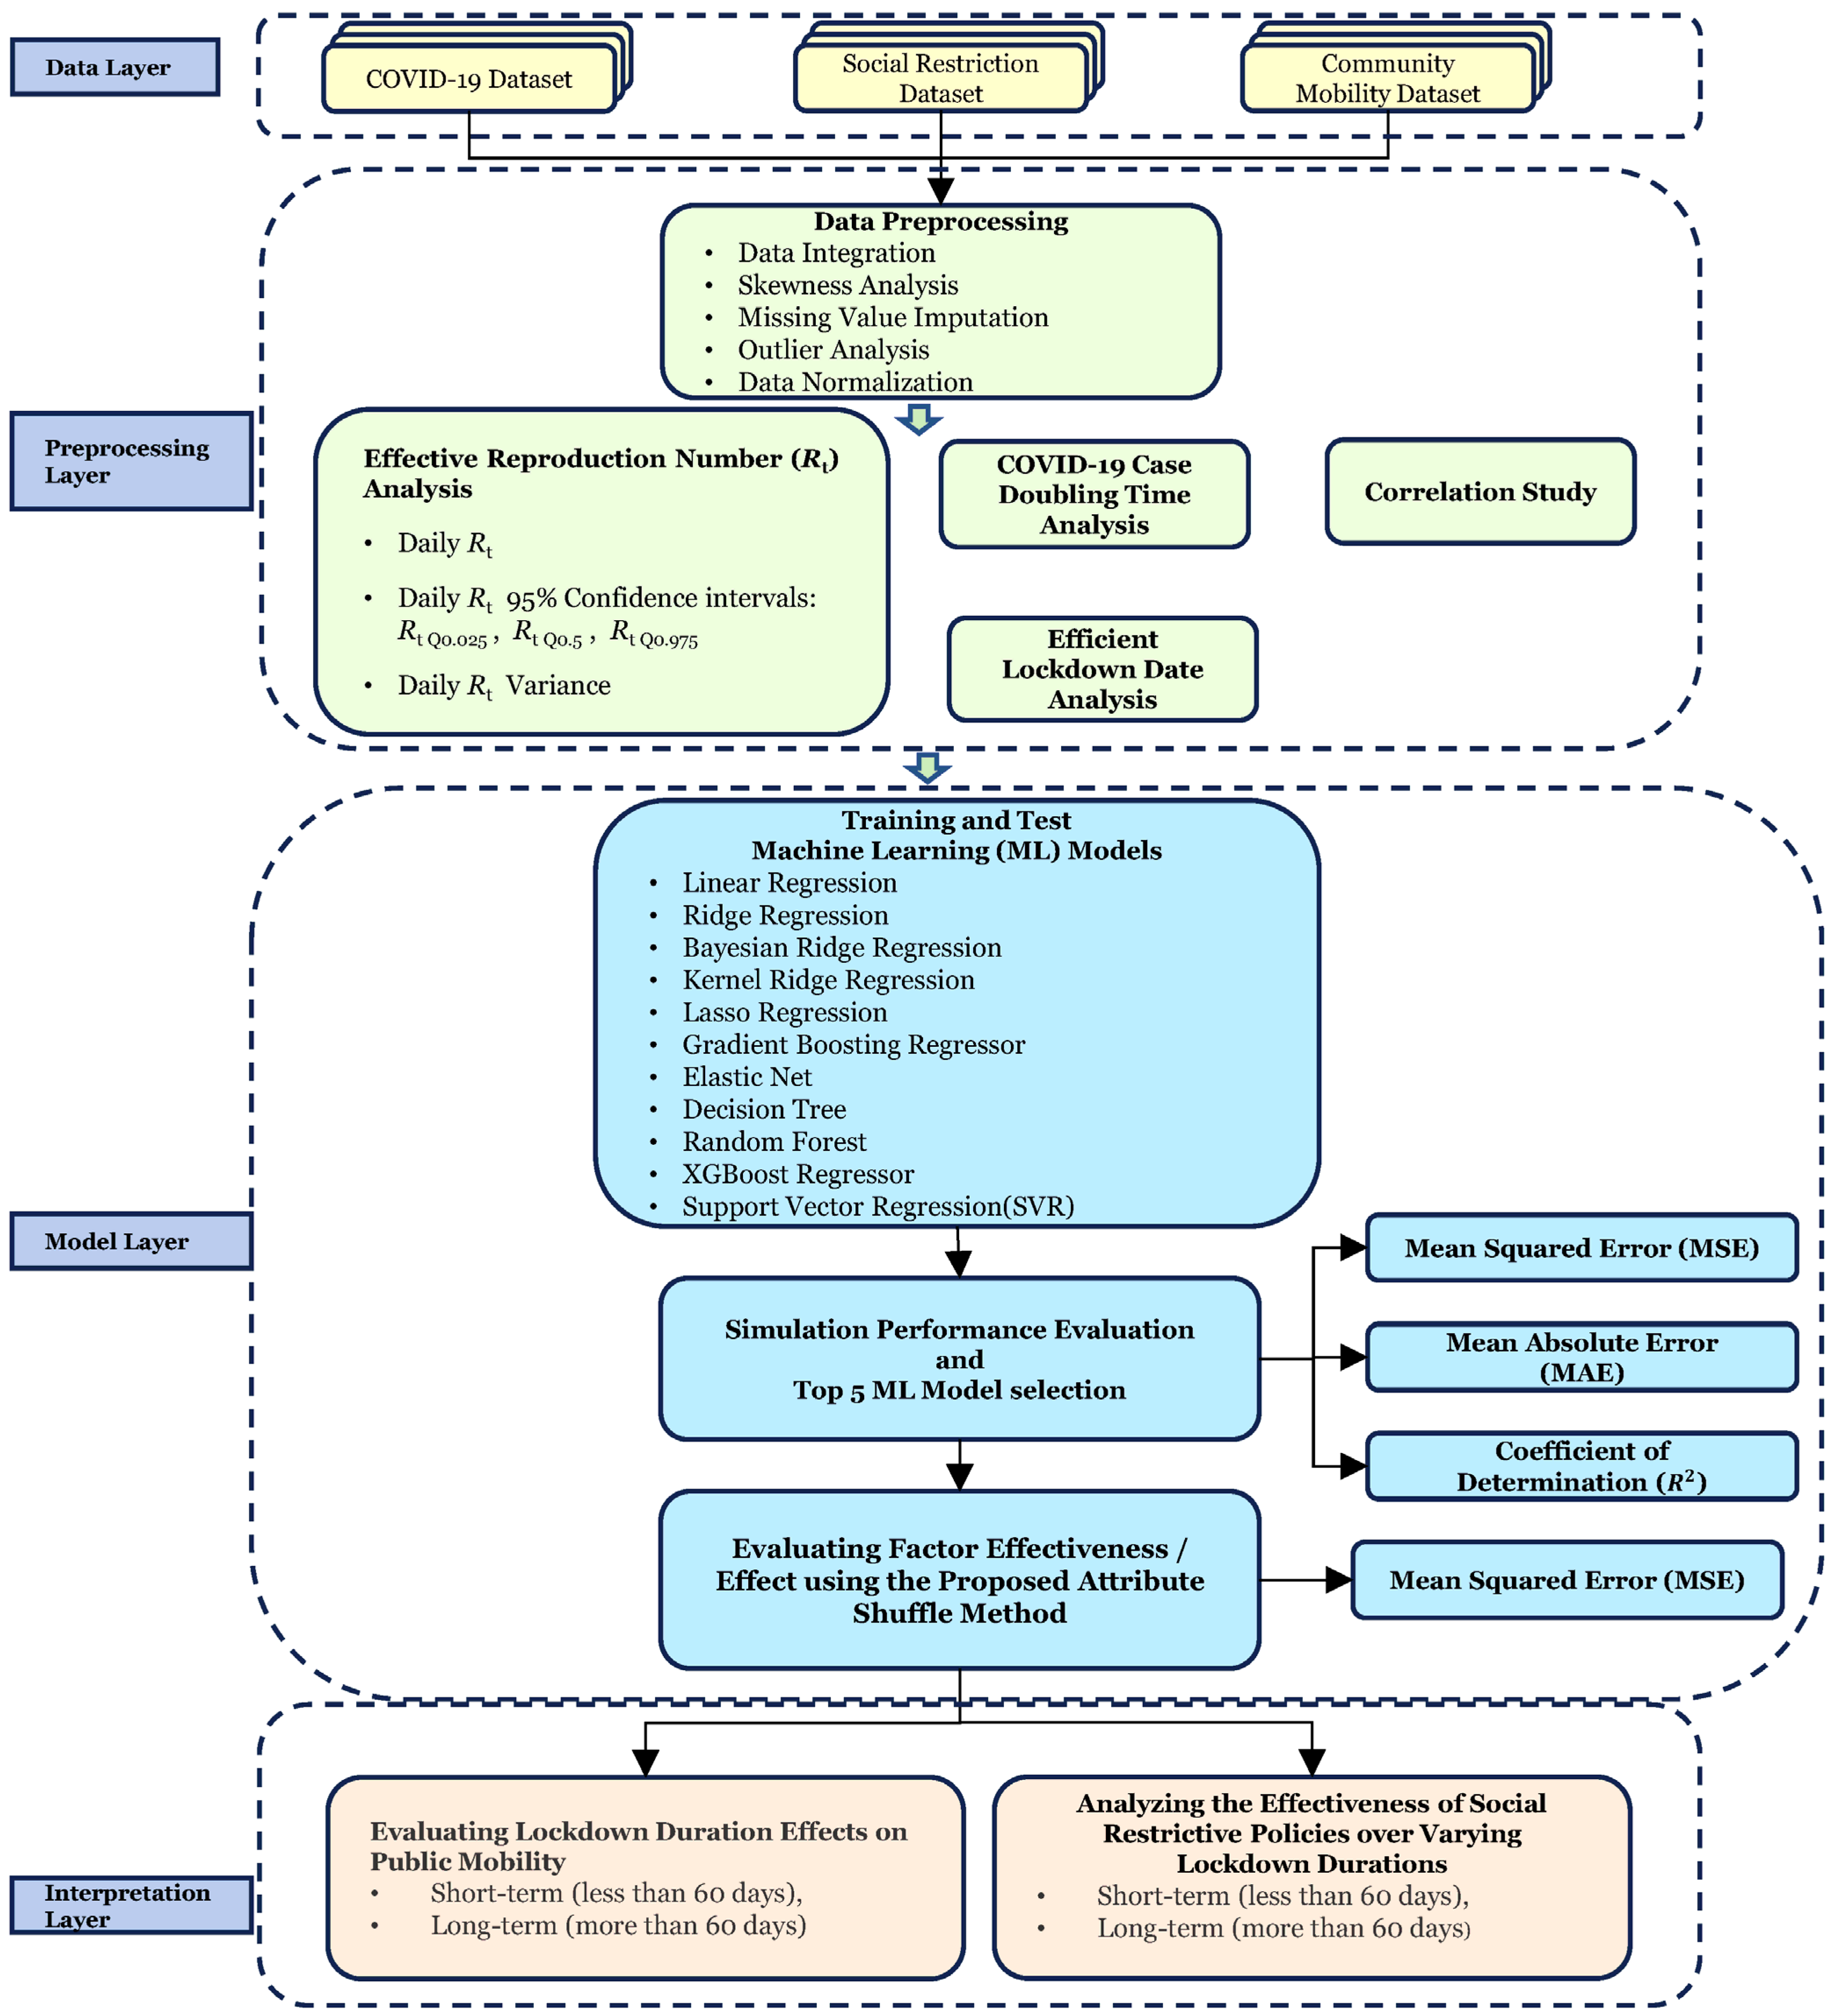
We have developed a machine-learning-based COVID-19 simulation model. Figure 1 illustrates the flowchart of this simulation model.
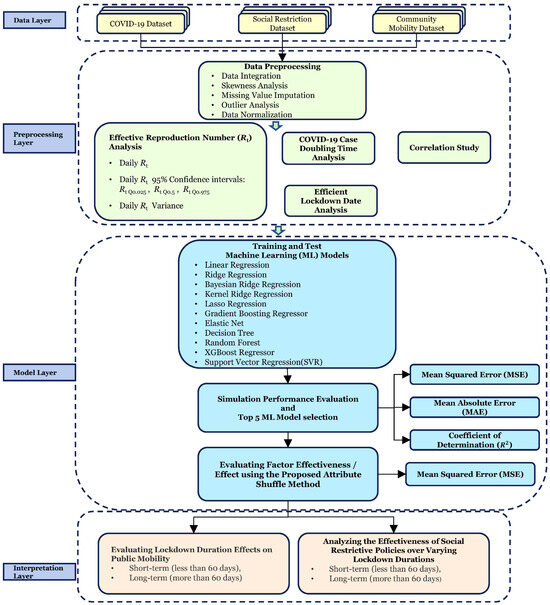
Figure 1.
Machine-learning-based COVID-19 simulation model for the Victoria area.
2.2.1. Data Preprocessing and Exploratory Data Analysis
In Phase 2, the spreadability of COVID-19 infection was assessed employing an effective reproduction number (Rt) estimated based on daily confirmed cases [24]. Rt represents the average number of people infected with a disease [6]. An Rt of 1 means, on average, an infected person will only infect one person. We estimated Rt based on a 7-day rolling average of confirmed cases. The serial interval distribution (µ = 4.3 days) and reporting delay distribution (µ = 10.3 days) were used in the estimation [7].
Moreover, to ensure comparability, we standardised the 7-day rolling average of confirmed COVID-19 cases and vaccination numbers using the min–max scaling method. The resulting standardised values range from 0 to 10, with 10 corresponding to the highest number of confirmed cases and vaccination numbers and 0 representing the lowest. The min–max feature scaling method is defined as
where Xmax and Xmin represent the maximum and minimum daily confirmed cases in the lockdown period. This standardisation ensures that each variable contributes equally to our analysis, a crucial step given the large variation in daily COVID-19 case magnitudes. We chose to scale to a range of 0–10, as opposed to the typical 0–1 range, to allow for a more nuanced differentiation between values. This approach enhances the interpretability of our data, which is particularly beneficial when analysing the diverse magnitudes present in our study.
Moreover, to identify the effectiveness of the lockdown, the analysis of doubling time COVID-19 infection was employed in the data preprocessing section. The doubling time at day i is defined as
where and represent the cumulative cases on day and day , respectively. Then, the max–min feature scaling method was applied to the double time day(i) to avoid the effects of differences in the magnitude of the values within the simulation model. The normalised double time will be incorporated as an additional feature in the simulation model.
To determine the relationship strength between social restriction policies and mobility data, we calculated Pearson’s correlation coefficient (r) between social restriction policy indicators and Victoria’s mobility data.
In addition, the issue of policy time lags becomes critical when analysing the effectiveness of social restriction policies on mobility data in the Victorian region. Previous research has shown a strong correlation between mobility and COVID-19 transmission, with a lag of about 10 days observed in China [25]. Similar patterns have been observed in Spain [26]. Therefore, in this study, we determine the effective lockdown date by monitoring the initial decline in overall mobility data. This allows us to determine when restrictions begin to have a significant impact on people’s lives. The analysis of the effective lockdown data is carried out by assessing the fluctuations in mobility data during the lockdown period. In order to merge the various mobility data, we assign weights to each mobility data point in Table 1, which allows us to calculate overall mobility changes, which are defined as
where represents the weight for mobility attributes in the mobility dataset, and is the value for mobility attributes on day . In this study, an equal weighting is assigned to the combined process. Then, an automated change point detection technique has been programmed to identify the inflection point in the mobility curve that indicates the effective lockdown date. This inflection point corresponds to the time when the overall mobility data begin to decrease. The simulation model will integrate multiple datasets from the effective lockdown date to the end of the lockdown period.
2.2.2. Establishing the Machine Learning Model
In Phase 3, we have adopted a more comprehensive approach to simulating COVID-19 infection during the lockdown period by incorporating multiple machine learning algorithms rather than relying on a single model. This will allow us to select the most appropriate algorithm for the simulation, improving the accuracy and effectiveness of the process.
In this study, we embark on a thorough exploration of different modelling approaches to simulate the number of COVID-19 cases in Victoria. We consider various factors, including linearity, multilinearity, and the presence of outliers or missing values, to ensure a well-rounded evaluation of modelling approaches. Recognising the complexity and multifaceted nature of this task, we explore a range of regression techniques and machine learning algorithms that have gained prominence in epidemiological research. We begin our analysis with a linear regression model using independent variables related to lockdown policies, community mobility, and COVID-19 infection rates. While linear regression provides a basic understanding, its limitations become apparent, particularly in the face of multicollinearity [27]. To address these challenges and improve predictive performance, researchers have turned to advanced regression methods such as ridge and lasso regression [28,29,30]. These techniques have demonstrated superior accuracy and reliability compared to traditional linear regression models. In addition, our investigation extends to Bayesian ridge regression, which proves to be a more robust choice for datasets characterised by collinearity and relatively small sample sizes [31]. Bayesian ridge regression excels at dealing with collinearity issues, making it a robust option in situations where data resources are limited. In addition, elastic net, a linear regression model trained with both L1 and L2 regularization, is effective in variable selection and can deal with multicollinearity, which is crucial when dealing with the plethora of factors influencing the pandemic.
In recognition of the nonlinear dynamics inherent in COVID-19 time series data, we look at tree-based algorithms. Models such as random forest and XGBoost regression have attracted attention for their ability to combat overfitting, excel in the presence of outliers, and effectively deal with missing data [32,33,34]. These algorithms provide flexible solutions for capturing complex relationships within data. Our study also incorporates a diverse set of machine learning algorithms, including decision trees, kernel ridge regression, and support vector regression. Kernel ridge regression is effective at capturing nonlinear relationships by mapping the input data into higher-dimensional spaces, making it adept at handling the complex and evolving nature of the COVID-19 distribution [35]. This diverse range of methods allows us to make a comprehensive assessment of their suitability for modelling the dynamics of COVID-19 cases in Victoria.
The simulation performance of the machine learning models was assessed using the following metrics: mean squared error (MSE), mean absolute error (MAE), and coefficient of determination (R2). R2 is widely used to measure the level of fit between the predicted and observed values of target variables [36,37].
where represents the COVID-19 confirmed cases in day , is the average value of COVID-19 confirmed cases, is the predicted number of COVID-19 cases in day , and n is the total number of days.
2.2.3. Social Restriction Policy and Mobility Data Effectiveness Analysis
In Phase 4, to assess the effectiveness of policies and their impact on mobility data for short- and long-term lockdowns, we selected the top five performers based on simulation metrics. Then, we randomly shuffle attributes in the X dataset to generate new test data Xnew. The original model error and new estimate error were defined as
where is defined as the number of COVID-19 cases in day , is the original test data, while denotes the new test data after random shuffling. is the predicted number of COVID-19 cases based on the original test data, and is the predicted number of COVID-19 cases based on the shuffled test data. To evaluate the effectiveness of our model, we utilise the MSE as our loss function. The policy effectiveness score of the attribute j is defined as
Subsequently, the of each machine learning model is calculated. Finally, the average from all models is utilised to compute the normalised feature score. This standardisation allows a more direct comparison between variables that originally had different scales and distributions.
3. Results
3.1. Exploratory Data Analysis
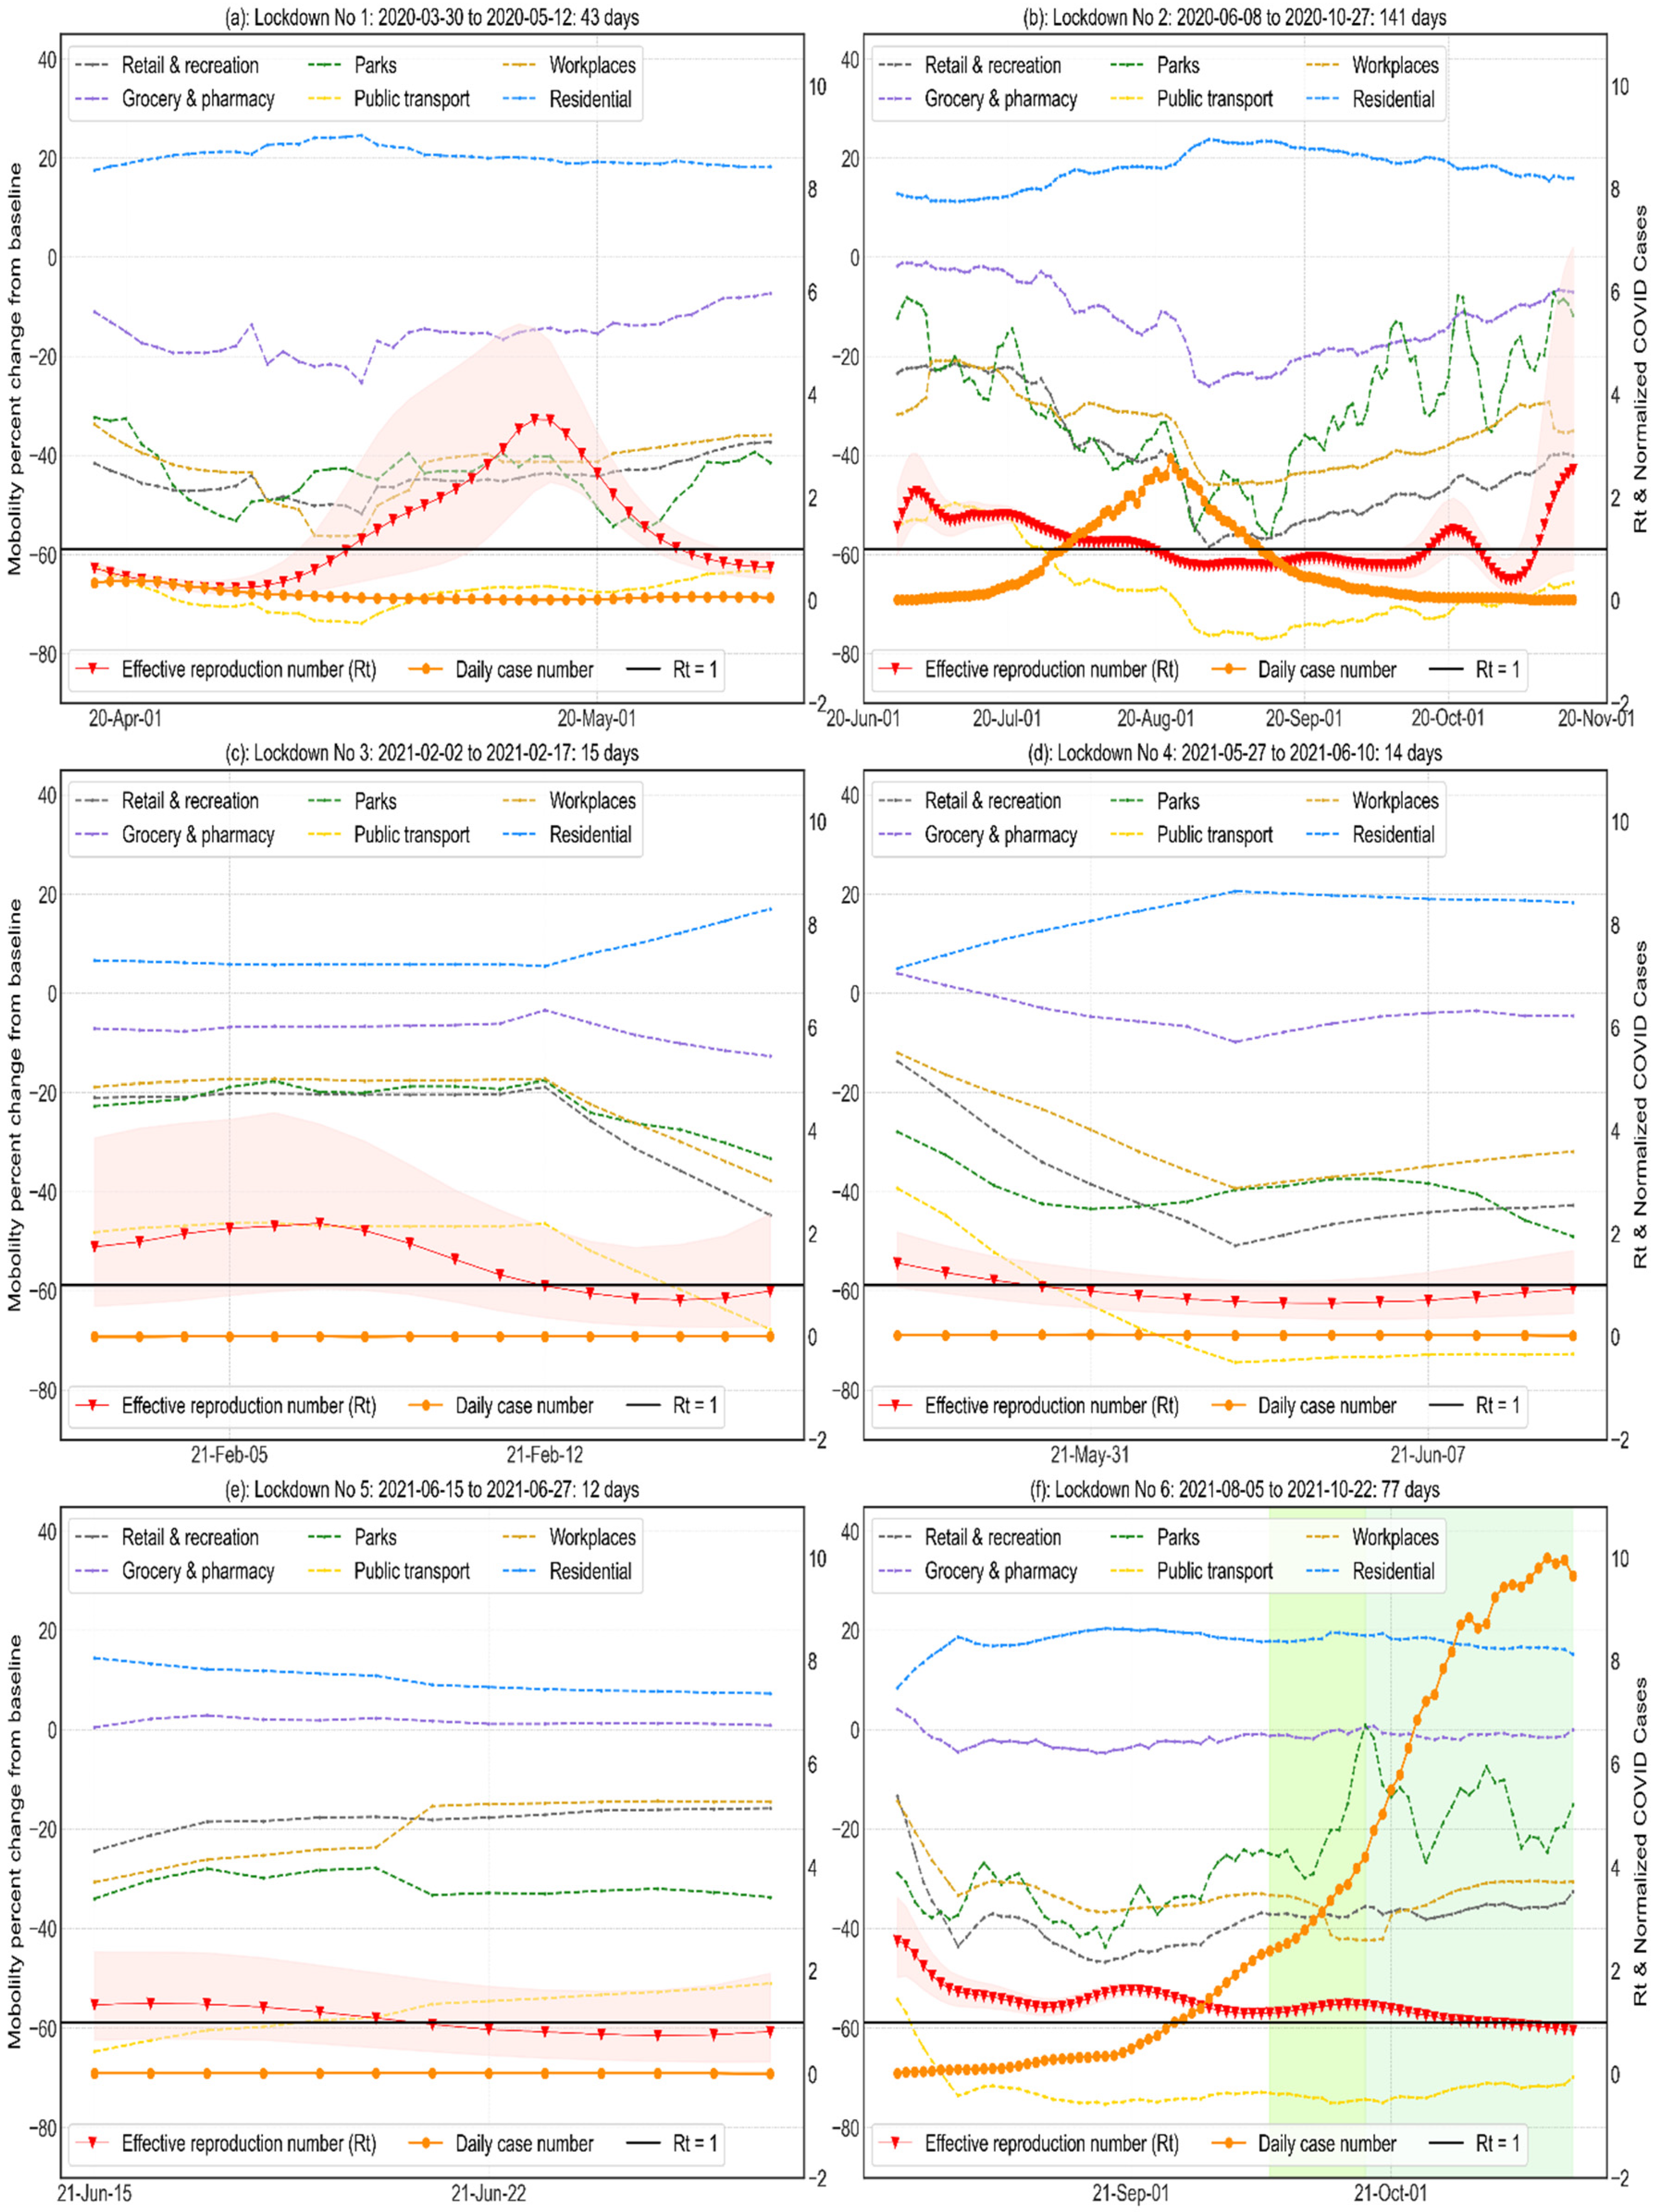
During the short-term lockdown periods (Lockdowns 1, 3, 4, and 5, Figure 2a,c,d,e), the tightened restriction policy led to a significant decrease in retail and leisure visits (−37.8% on average) and public transport use (−72.85% on average), which is accompanied by a decrease in Rt below 1. Conversely, there was a noticeable increase in residential mobility (+18% on average). However, the reduction in COVID-19 infection was short-lived. In the long-term, the Rt started to gradually increase after the lowest point (0.41). This trend was observed alongside an increase in retail and recreation visits, park visits, workplace visits, grocery and pharmacy visits, and public transport visits. Furthermore, there was a decrease in residential mobility data, all of which were recorded during the second lockdown period (Figure 2b). A similar increasing mobility tendency was also found in the sixth lockdown (Figure 2f), in which the increasing mobility data may be associated with a significant increase in daily cases.
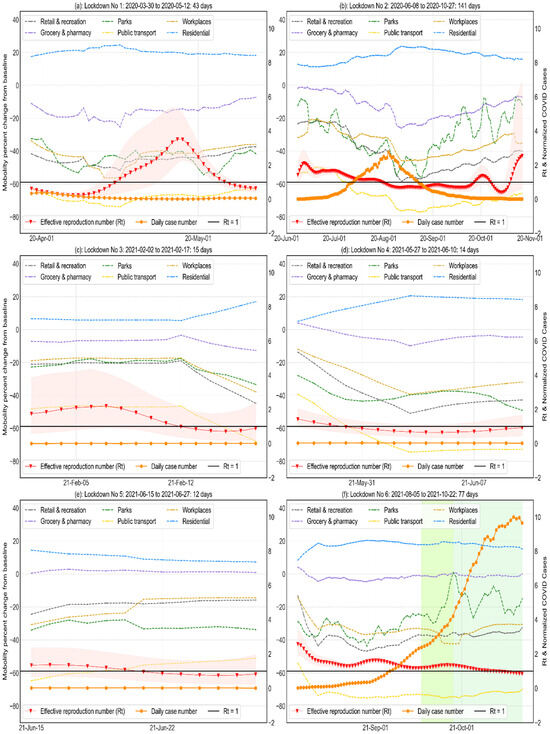
Figure 2.
Normalised Victorian mobility measures, daily COVID-19 cases, and the effective reproduction number in the six lockdown periods. The Rt values together with their 95% confidence intervals (CI) are presented in red, and green plots represent the relaxation of social restrictions during the sixth lockdown (Figure 2f) due to the increased number of vaccination numbers in the Victorian area.
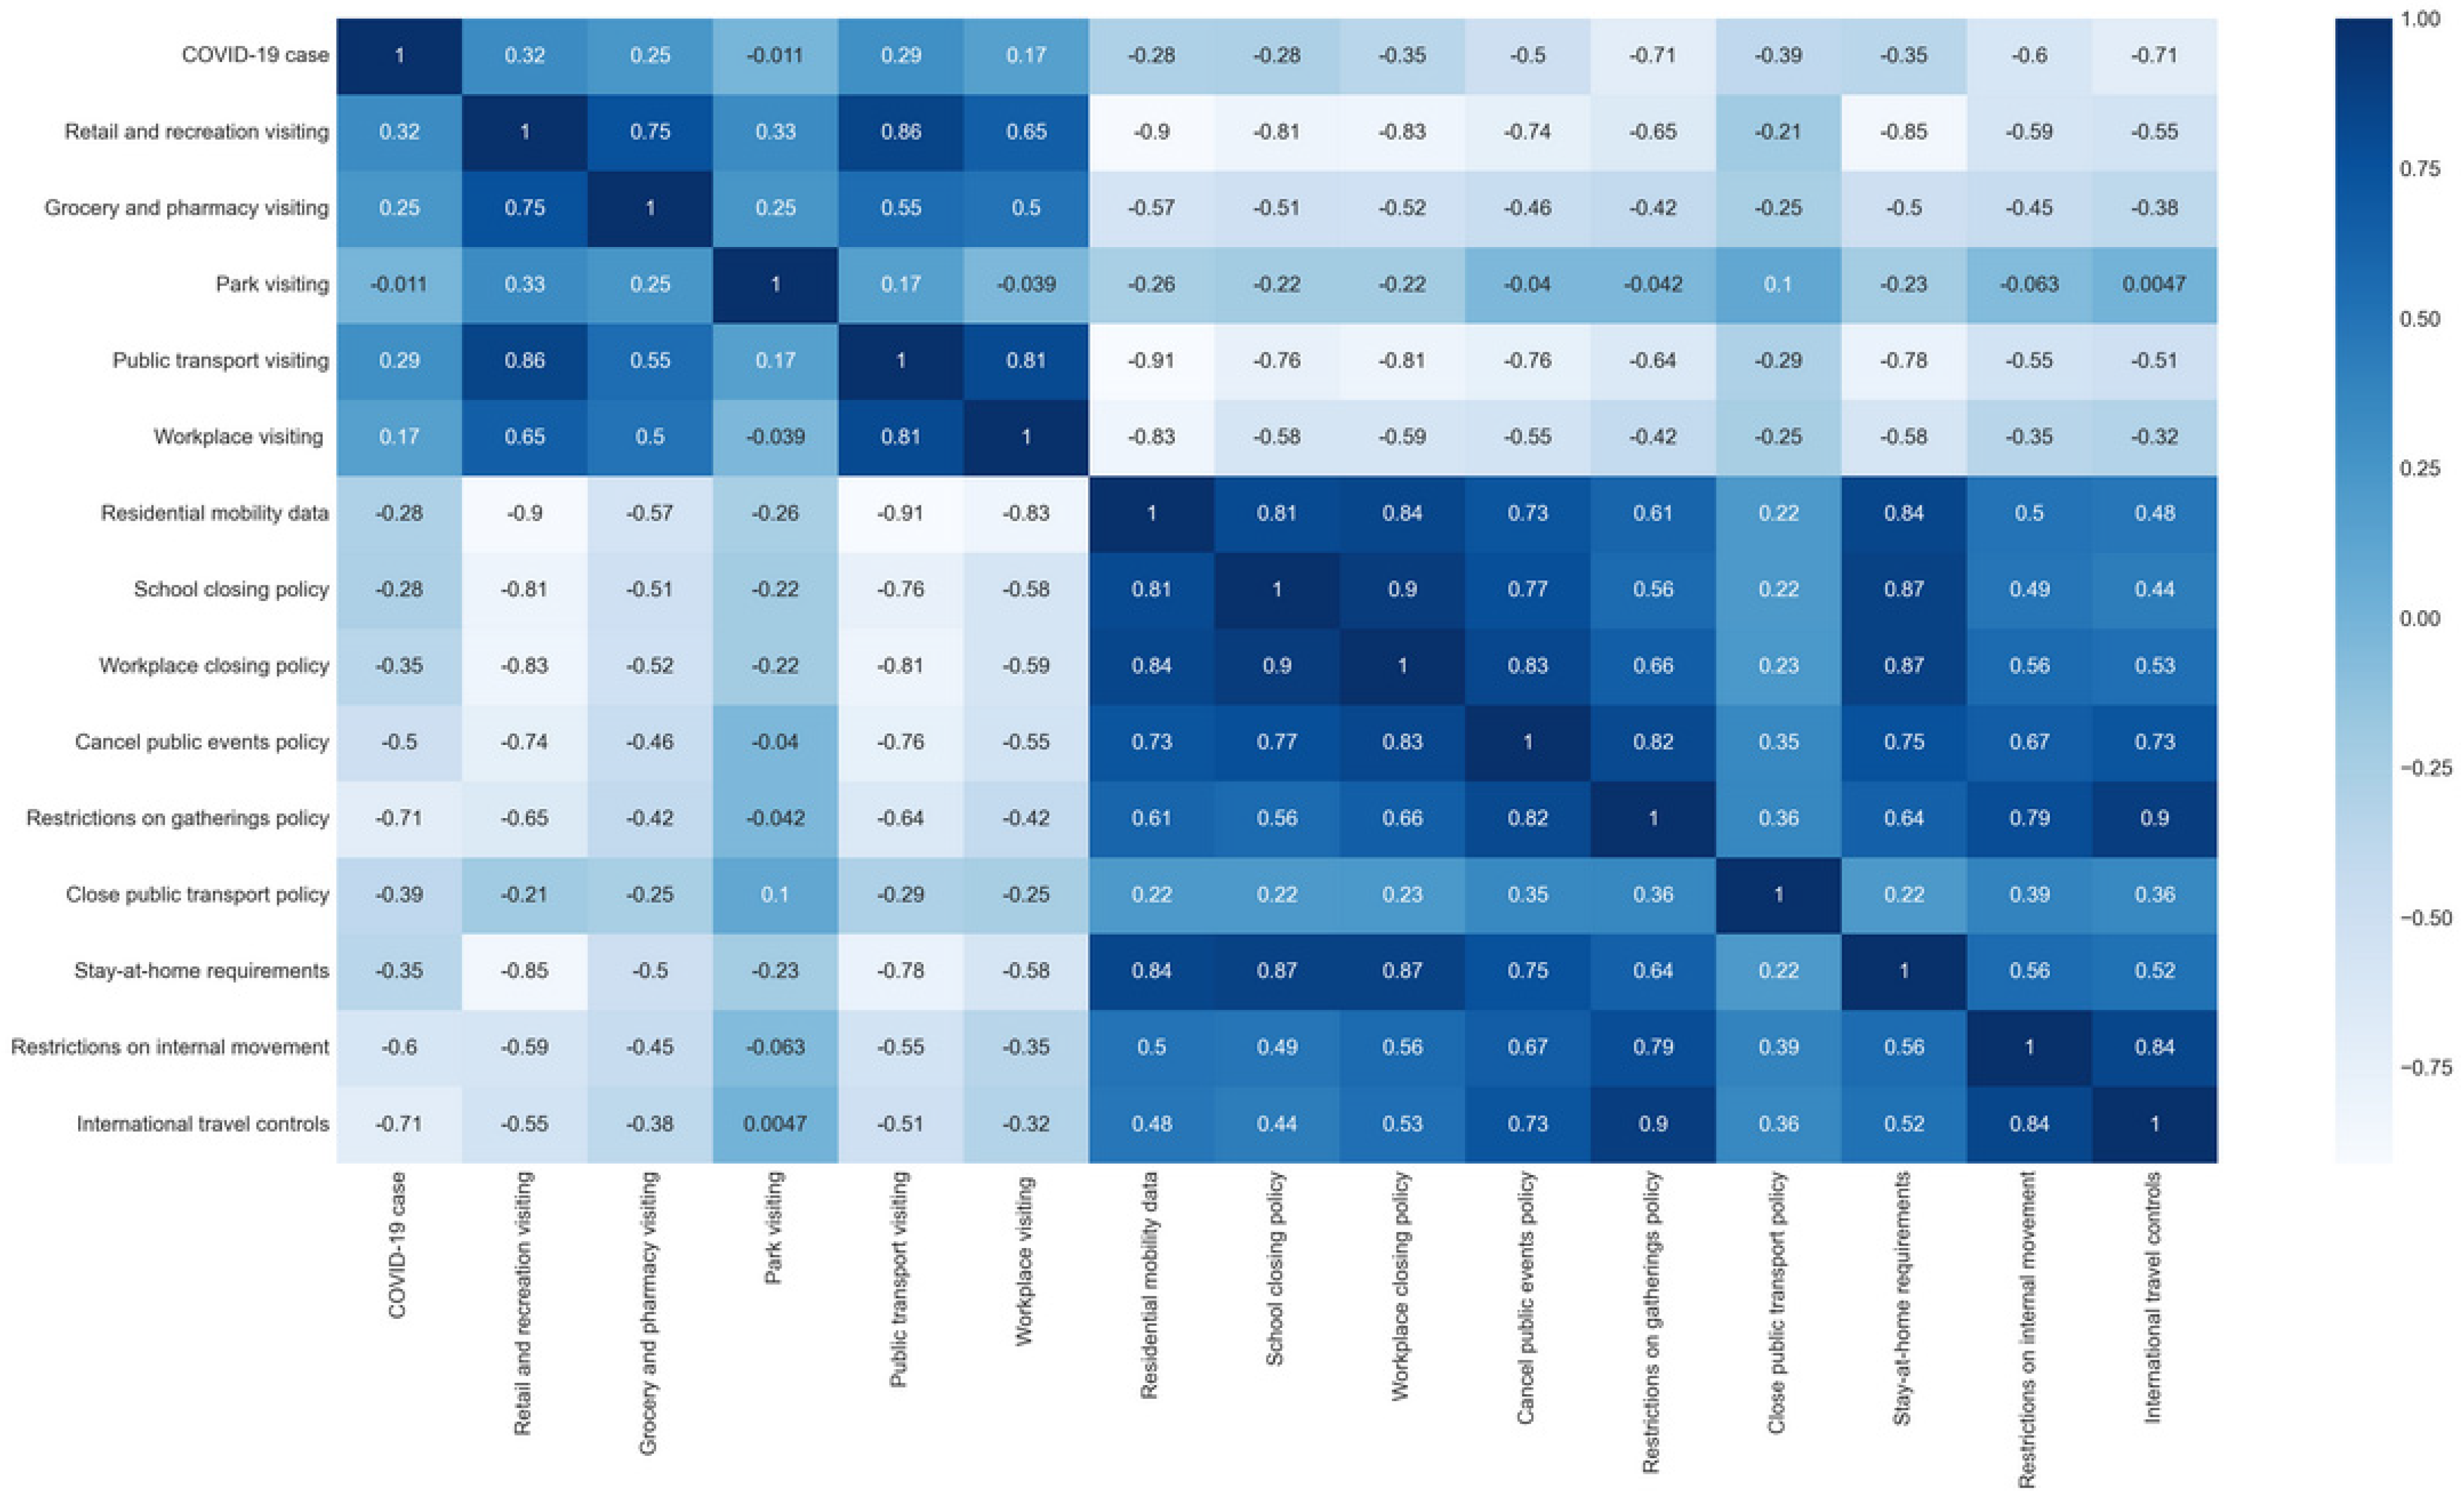
To determine the effectiveness of the social restriction policies on limiting public mobility, we conducted a correlation analysis. Overall, stay-at-home orders (r = 0.84, p < 0.001), workplace closures (r = 0.83, p < 0.001), school closures (r = 0.81, p < 0.001), and public event cancellations (r = 0.73, p < 0.001) show a robust positive correlation with increases in the residential mobility data, as shown in Figure 3 and Appendix A. This positive relationship suggests that individuals spent more time in their residences when these restrictive measures were implemented, reflecting compliance with the lockdown policy and a reduction in movement within communities. Conversely, these policy indicators are negatively associated with reduced retail and leisure activities and the reduced use of public transport. This negative association highlights the alignment of these policies with reduced consumer activity and reduced reliance on public transport. This observation highlights the impact of public health policies on the economic and mobility dynamics of the Victoria region.

Figure 3.
Correlation analysis between policy data and mobility data in the Victorian area (Note: we used p = 0.05 to determine statistical significance; the p-value results are attached in Appendix A, Table A1).
Furthermore, our analysis reveals a clear negative association between the incidence of COVID-19 cases (r = −0.71, p < 0.001) and restrictions on gathering. This finding suggests that the number of COVID-19 cases decreased as restrictions on gatherings increased. It underscores the effectiveness of such restrictions in reducing the spread of the virus and highlights the importance of public health interventions in containing the pandemic. These correlations provide valuable insights into the complex dynamics between policy interventions, mobility patterns, and COVID-19 outcomes, offering a nuanced perspective on the multifaceted challenges faced during the pandemic.
To improve the simulation capabilities of the model, we also included doubling time as an additional attribute during the data preprocessing phase. In the analysis of the doubling time of COVID-19 infection cases, a red doubling time (see Figure 4) close to the shortest normalised doubling time of 0 indicates that the daily COVID-19 case takes a shorter time to double in the infection case, while a longer doubling time close to 1, shown in green in Figure 4, indicates a longer time to double in the infection case. Overall, the study observed notable variations in the effectiveness of lockdowns in curbing the rise of COVID-19 infections, attributable to differences in their durations. In particular, there was considerable variation in doubling time during the long lockdown period (see Figure 4b,f). This may be associated with increased visits to retail and recreational areas, parks, workplaces, food and pharmacy stores, and public transportation. In contrast, fluctuations in doubling time were generally more stable during the short-term lockdown period (see Figure 4a,c,d,e) than during the long-term period.
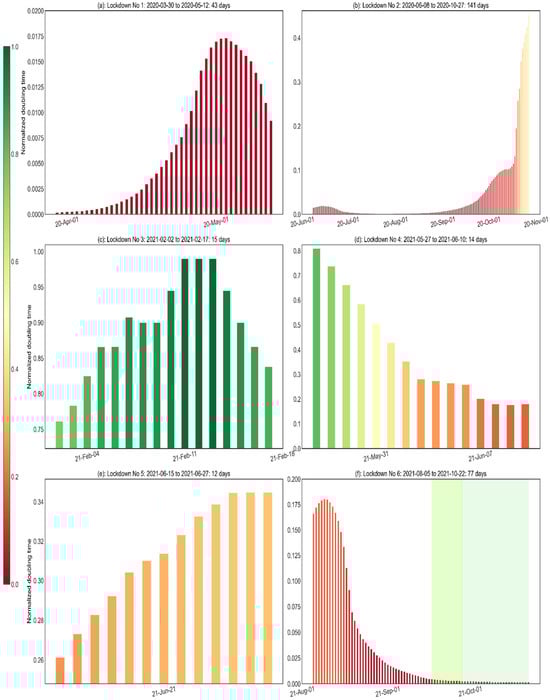
Figure 4.
Analysis of the normalised doubling time of COVID-19 infection cases. Values that were normalised to be closer to 1 are shown in green, indicating a longer doubling time. This indicates that the COVID-19 infection rate among people in Victoria has been effectively controlled. Conversely, values normalised to be closer to 0 were displayed in red, indicating a shorter doubling time, indicating that COVID-19 infection cases were increasing rapidly in the Victorian area.
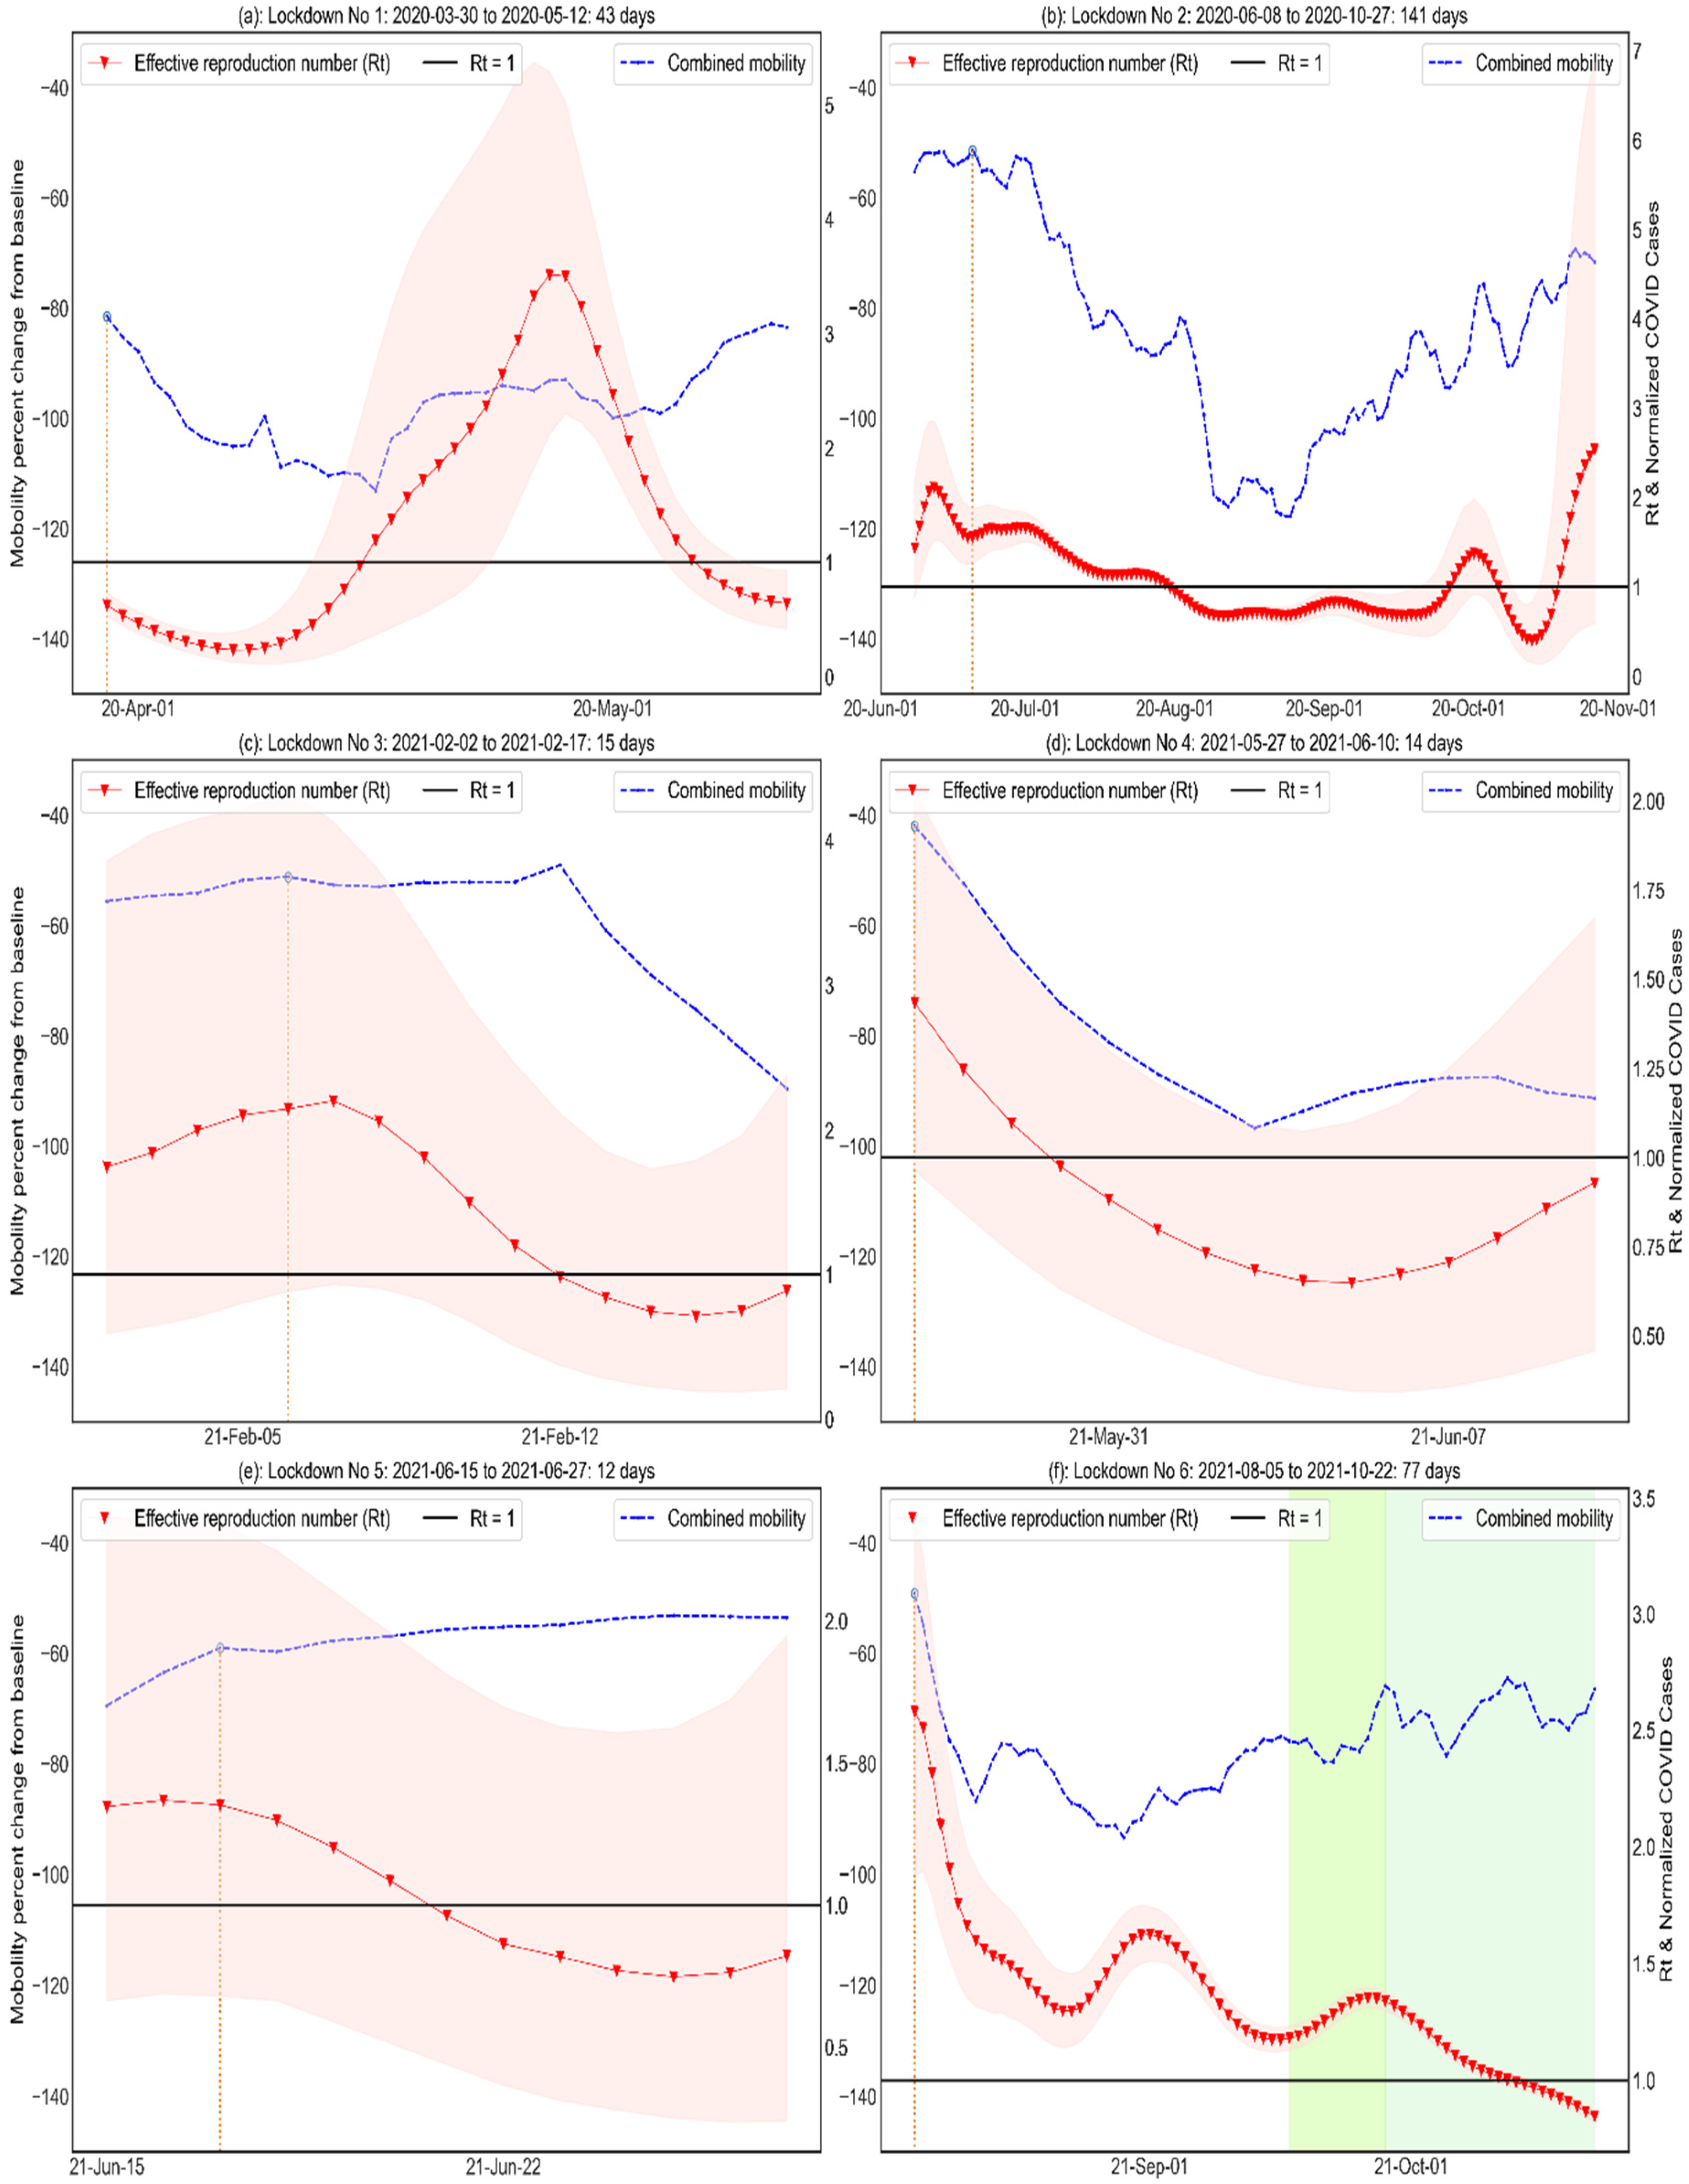
Lastly, the overall mobility data show a significant decrease at the beginning of the 1st, 4th, and 6th lockdowns, followed by a gradual increase (refer to Figure 5). In contrast, the 2nd, 3rd, and 5th lockdowns show fluctuations, first mildly increasing and then decreasing. By adjusting the efficient lockdown dates to coincide with the first day of mobility decline, we refined them for use in the machine-learning-based simulation model and determined the training and test data periods.
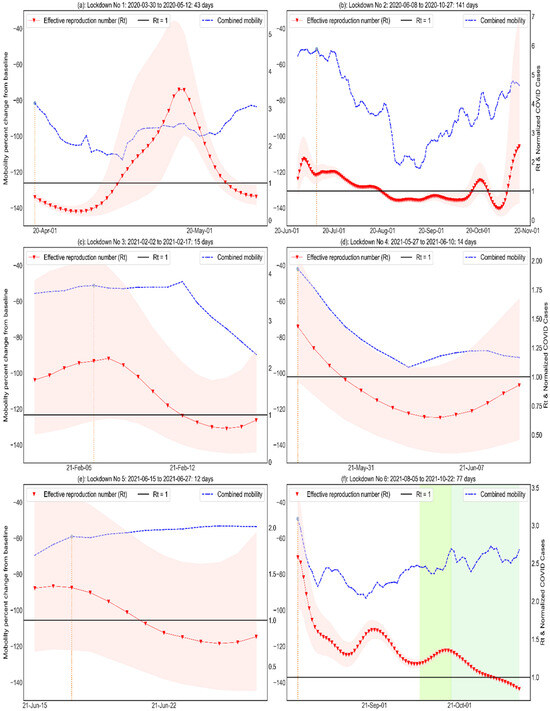
Figure 5.
Effective lockdown date analysis for the lockdown period. The effective lockdown date is determined by observing a decline in overall mobility data, which typically corresponds to the time when the lockdown policy comes into effect, allowing us to identify the point at which the restrictions begin to have a tangible impact on people’s lives. Note that the effective lockdown dates (orange vertical line) for the 1st, 4th, and 6th closures are marked from the first closure date, as a significant drop in the combined mobility curve was found.
3.2. Model Evaluation
Eleven machine learning algorithms were implemented in this study. Overall, based on the highest R2 and lowest MSE and MAE, we found gradient boosting regressor, XG boost regressor, random forest, decision tree, and support vector regression to have achieved the best performance (Table 4). Thus, they were selected to simulate both short- and long-term lockdown scenarios.
Table 4.
Simulation accuracy test.
3.3. Analyzing the Impact of Mobility Data during Short- and Long-Term Lockdowns
Analysis of mobility during the short- and long-term lockdowns showed that retail and recreation visiting and public transport visiting were the main contributors to reducing the increase in COVID-19 infection in Vicotria (refer to Table 5). They accounted for more than 30% of mobility in short-term lockdowns, while public transport alone accounted for more than 50% in long-term lockdowns, with the remaining measures accounting for less than 15%. It is also worth noting that both retail and recreation visiting and workplace visiting showed a significant drop in their effectiveness in curbing COVID-19 cases when moving from short-term to long-term lockdowns. The remaining mobility measures did not exhibit significant changes when the duration of the lockdown period changed.
Table 5.
Normalised mobility effectiveness score.
3.4. Social Restriction Effectiveness Analysis
In terms of policy perspectives (refer to Table 6), the top three policies in terms of effectiveness scores were the cancelled public events, restrictions on gathering, and school closing policy, which each accounted for more than 20% of the total policies. Notably, the effectiveness of restrictions on gatherings decreased significantly as the duration of lockdowns increased, which may indicate that the public’s compliance with these restrictions decreased during longer lockdowns. In contrast, only the cancellation of public events policy and international travel controls were found to be more effective than other policies in the long-term lockdown.
Table 6.
Normalised policy effectiveness score.
4. Discussion
Using machine-learning-based COVID-19 simulation models has provided interesting insights into the evolving effectiveness of social restriction policies during both short-term and long-term lockdown scenarios. Of particular interest is the significant decline in the contribution of the school closure policy, which reaches its lowest level during the transition from short-term to long-term lockdowns. This observation challenges the conventional assumption about the effectiveness of school closures as a preventive measure against increasing COVID-19 infection cases. In contrast to other social restrictions, such as stay-at-home orders and the cancellation of public events, some recent studies suggest that school closures may have a limited impact on reducing the spread of the virus [38,39]. Furthermore, it is important to recognise that school closures have potentially negative consequences for students’ physical health and general well-being. Research has shown that prolonged closures are associated with an increased risk of obesity and screen addiction among students [40]. There has been a significant decline in physical activity among children and adolescents worldwide, accompanied by an increase in sedentary behaviour [41]. For instance, a study from Spain revealed a 52% decline in weekly physical activity [42]. At the same time, a US microsimulation study projected an 11.1% increase in childhood obesity after two months of school closures, underscoring the significant impact of these closures on children’s health and well-being [43]. These findings highlight the need for a balanced approach to the implementation of school closure policies, taking into account both their limited effectiveness in reducing COVID-19 transmission and their potential adverse effects on students’ health and development.
Conversely, the international travel control policy showed a striking shift, jumping to the second-highest effectiveness score in the long-term lockdown analysis. This shift is particularly noteworthy given its implications for border control measures in the context of COVID-19 prevention and transmission containment. Recent research has highlighted the critical role of border control measures in preventing the direct entry of COVID-19 cases and containing the widespread transmission of SARS-CoV-2 [44]. This underscores the importance of robust international travel control measures, particularly in extended lockdown scenarios where preventing the introduction of new cases becomes increasingly important. The remarkable increase in the effectiveness of international travel control policies during prolonged lockdowns underscores their central role in mitigating the global impact of the pandemic and serves as a testament to the effectiveness of strategic border control measures in these challenging circumstances.
With regard to the data on mobility, an interesting pattern was observed when looking at the measures of mobility during both the short and the long periods of lockdown. In particular, the mobility curve during the longer lockdowns exhibited a distinct anti-bell shape. Initially, there was a significant decrease in mobility measures at the beginning of the long-term lockdown, which was in line with expectations. However, what distinguishes this observation is the subsequent rebound in mobility that began around the middle of the lockdown and continued until its end. This phenomenon is consistent with the findings of a previous European study, which also found a notable decrease in compliance with restrictions during the middle and late phases of the lockdown [45]. This suggests a possible relaxation of public compliance with social restrictions as the duration of the lockdown increased. Consequently, this fluctuation in mobility measures over the course of the lockdown had a noticeable impact on the effectiveness of these measures within the COVID-19 infection simulation model. This underscores the need to consider the dynamic evolution of public behaviour and compliance with restrictions as a key factor in mitigating the escalating number of COVID-19 cases in the Victorian region. This is particularly true in the context of lockdown duration, where a nuanced understanding of evolving compliance patterns is critical.
Overall, the results of our simulation model have important implications for policy and practice in pandemic management. The analysis shows that policies such as the cancellation of public events and restrictions on gatherings are highly effective in containing the spread of SARS-CoV-2, whether the lockdown is short-term or long-term. These findings are consistent with a Japanese study, which indicated that voluntary event cancellations could be an effective strategy for reducing COVID-19 infectiousness [46]. The study revealed a decrease in Rt from 2.534 to 1.077 during the restriction period. The cancellation of mass gatherings was identified in the previous study as another critical factor in pandemic prevention [47]. This effectiveness is further underscored by the observed negative correlation between these measures and various aspects of public mobility, such as visits to retail and leisure outlets and the use of public transport. Such measures have the potential to significantly reduce the number of COVID-19 cases by reducing mobility and limiting opportunities for the virus to spread.
Furthermore, our research provides critical insights for policymakers and public health officials, particularly regarding the diminishing effectiveness of lockdowns over longer periods of time. We observed that as the duration of lockdowns increased, their effectiveness in controlling the spread of COVID-19 decreased. This trend highlights the importance of understanding the dynamic nature of public behaviour and compliance with restrictions. It is a key factor that significantly influences the success of these measures in mitigating the escalation of the pandemic. Recognising this pattern is essential for formulating effective and sustainable public health strategies. In response to these findings, we recommend a more adaptive and responsive approach to pandemic management. Prolonged lockdowns, while initially effective, can lead to “lockdown fatigue”, reducing public compliance over time. It is therefore essential to complement lockdowns with other strategies, including effective communication, community engagement, and robust testing and traceability systems. The continuous monitoring and evaluation of the public’s response to these measures is essential. By adapting strategies to changing public behaviour, health authorities can maintain high levels of compliance and effectiveness, striking a balance between controlling the spread of the virus and minimising the socioeconomic impact of prolonged lockdowns. This approach not only improves the immediate response to the pandemic but also contributes to the development of more resilient public health systems for future challenges.
Lastly, our study’s application of machine learning techniques to analyse the interplay between social restriction policies, community mobility, and COVID-19 infection under different lockdown duration scenarios provides a methodological blueprint for future epidemiological research, particularly in adapting these methods to other infectious diseases. The findings are critical for data-driven public health policy, helping policymakers make informed decisions during health emergencies and tailor interventions to specific scenarios. In addition, our findings are helping to improve predictive models in epidemiology, integrating variables such as mobility data and social restriction policies to improve the accuracy of predicting disease spread. This interdisciplinary approach, combining epidemiology with data science and public policy, provides new insights for comprehensive research on disease dynamics and control. Our research not only provides a detailed analysis of pandemic management strategies but also lays the groundwork for future research in this area to improve public health responses to global health challenges.
A limitation of this study is that the community mobility dataset may not fully capture all mobility changes in Victoria during the period of social restrictions. The dataset relies primarily on specific mapping applications and there may be other sources of mobility data, such as other transport apps, which are not accounted for in this analysis. These unaccounted sources could introduce potential biases and gaps in our understanding of mobility patterns during lockdowns. It is also important to note that the effectiveness of policies and their impact on mobility may vary depending on cultural, economic, and social factors. This study focuses on Victoria and the findings may not be directly generalisable to other regions with different demographics and policy implementation strategies.
5. Conclusions
In summary, this study highlights a significant reduction in compliance with social restrictions during the middle and final stages of long-term lockdown. This trend is evidenced by a marked increase in visits to retail and leisure centres, parks, workplaces, grocery stores, and pharmacies, as well as increased use of public transport. Furthermore, the proposed machine-learning-based model of COVID-19 stimulation revealed that this fluctuation in mobility measures over the course of the lockdown had a noticeable impact on the effectiveness of controlling COVID-19 infection. This underscores the importance of maintaining ongoing efforts to contain the spread of the virus. Meanwhile, a strong negative correlation was also observed between social restriction policies, retail and recreation visiting, and public transport visiting mobility.
In terms of social restriction policies, the proposed model suggests that the cancellation of public events and restrictions on gatherings are the most effective restriction policies to prevent the increase of COVID-19 infection in the Victorian region in terms of short-term and long-term lockdowns. The study provides valuable insights for policymakers in designing effective lockdown policies that can slow the spread of the virus.
In conclusion, the application of machine learning techniques in our study to analyse the relationship between social restriction policies, community mobility, and COVID-19 infection across varying lockdown durations provides a valuable framework for future epidemiological studies. This approach may be particularly useful for adaptation to other infectious diseases. The knowledge gained is crucial for the design of data-driven public health policies, enabling policymakers to make informed decisions during health crises and tailor interventions to different situations.
Author Contributions
Conceptualisation, S.L., O.A., K.A., T.I.E. and D.T.; methodology, S.L.; software, S.L.; validation, S.L., O.A., K.A., T.I.E. and D.T.; resources, S.L. and D.T.; data curation, S.L., K.A. and D.T.; writing—original draft preparation, S.L. writing—review and editing, S.L., O.A., K.A., T.I.E. and D.T.; visualisation, S.L.; supervision, O.A., K.A., T.I.E. and D.T. All authors have read and agreed to the published version of the manuscript.
Funding
This research received no external funding.
Institutional Review Board Statement
Not applicable.
Informed Consent Statement
The data used in this study were obtained from open-source repositories and did not require informed consent from participants. Therefore, no participants were directly involved in this study and no personally identifiable information was used.
Data Availability Statement
The datasets utilised in this study are publicly accessible. The COVID-19 data for Victoria can be found on the official Victorian Government website at https://www.coronavirus.vic.gov.au/victorian-coronavirus-covid-19-data (accessed on 8 December 2022). Google Community Mobility Reports data are available at https://www.google.com/covid19/mobility/ (accessed on 17 October 2022). Information regarding social restriction measures is sourced from the Oxford COVID-19 Government Response Tracker, accessible at https://github.com/OxCGRT/covid-policy-tracker/blob/master/documentation/codebook.md#containment-and-closure-policies (acessed on 8 December 2022).
Conflicts of Interest
The authors declare no conflicts of interest.
Appendix A
Table A1.
p values for the correlation analysis.
Table A1.
p values for the correlation analysis.
| p-value | cases | Retail and recreation visiting | Grocery and pharmacy visiting | Park visiting | Public transport visiting | Workplace visiting | Residential mobility data | School closing policy | Workplace closing policy | Cancel public events policy | Restrictions on gatherings | Close public transport policy | Stay-at-home requirements | Restrictions on internal movement | International travel controls |
| cases | <0.001 | 0.001 | 0.001 | 0.266 | 0.001 | 0.005 | 0.002 | 0.002 | 0.001 | <0.001 | <0.001 | 0.001 | 0.001 | <0.001 | <0.001 |
| Retail and recreation visiting | 0.001 | <0.001 | <0.001 | 0.016 | <0.001 | <0.001 | <0.001 | <0.001 | <0.001 | <0.001 | <0.001 | 0.014 | <0.001 | <0.001 | <0.001 |
| Grocery and pharmacy visiting | 0.001 | <0.001 | <0.001 | 0.024 | <0.001 | <0.001 | <0.001 | <0.001 | <0.001 | <0.001 | <0.001 | 0.005 | <0.001 | <0.001 | <0.001 |
| Park visiting | 0.266 | 0.016 | 0.024 | <0.001 | 0.038 | 0.109 | 0.024 | 0.018 | 0.021 | 0.057 | 0.091 | 0.478 | 0.019 | 0.086 | 0.131 |
| Public transport visiting | 0.001 | <0.001 | <0.001 | 0.038 | <0.001 | <0.001 | <0.001 | <0.001 | <0.001 | <0.001 | <0.001 | 0.011 | <0.001 | <0.001 | <0.001 |
| Workplace visiting | 0.005 | <0.001 | <0.001 | 0.109 | <0.001 | <0.001 | <0.001 | <0.001 | <0.001 | <0.001 | <0.001 | 0.014 | <0.001 | <0.001 | <0.001 |
| Residential mobility data | 0.002 | <0.001 | <0.001 | 0.024 | <0.001 | <0.001 | <0.001 | <0.001 | <0.001 | <0.001 | <0.001 | 0.018 | <0.001 | <0.001 | <0.001 |
| School closing policy | 0.002 | <0.001 | <0.001 | 0.018 | <0.001 | <0.001 | <0.001 | <0.001 | <0.001 | <0.001 | <0.001 | 0.023 | <0.001 | <0.001 | <0.001 |
| Workplace closing policy | 0.001 | <0.001 | <0.001 | 0.021 | <0.001 | <0.001 | <0.001 | <0.001 | <0.001 | <0.001 | <0.001 | 0.018 | <0.001 | <0.001 | <0.001 |
| Cancel public events policy | <0.001 | <0.001 | <0.001 | 0.057 | <0.001 | <0.001 | <0.001 | <0.001 | <0.001 | <0.001 | <0.001 | 0.005 | <0.001 | <0.001 | <0.001 |
| Restrictions on gatherings | <0.001 | <0.001 | <0.001 | 0.091 | <0.001 | <0.001 | <0.001 | <0.001 | <0.001 | <0.001 | <0.001 | 0.003 | <0.001 | <0.001 | <0.001 |
| Close public transport policy | 0.001 | 0.014 | 0.005 | 0.478 | 0.011 | 0.014 | 0.018 | 0.023 | 0.018 | 0.005 | 0.003 | <0.001 | 0.019 | 0.002 | 0.002 |
| Stay-at-home requirements | 0.001 | <0.001 | <0.001 | 0.019 | <0.001 | <0.001 | <0.001 | <0.001 | <0.001 | <0.001 | <0.001 | 0.019 | <0.001 | <0.001 | <0.001 |
| Restrictions on internal movement | <0.001 | <0.001 | <0.001 | 0.086 | <0.001 | <0.001 | <0.001 | <0.001 | <0.001 | <0.001 | <0.001 | 0.002 | <0.001 | <0.001 | <0.001 |
| International travel controls | <0.001 | <0.001 | <0.001 | 0.131 | <0.001 | <0.001 | <0.001 | <0.001 | <0.001 | <0.001 | <0.001 | 0.002 | <0.001 | <0.001 | <0.001 |
References
- Yuki, K.; Fujiogi, M.; Koutsogiannaki, S. COVID-19 pathophysiology: A review. Clin. Immunol. 2020, 215, 108427. [Google Scholar] [CrossRef] [PubMed]
- McCafferty, C.; Cai, T.; Borgel, D.; Lasne, D.; Renolleau, S.; Vedrenne-Cloquet, M.; Bonnet, D.; Wu, J.; Zaw, T.; Bhatnagar, A.; et al. Path-ophysiological pathway differences in children who present with COVID-19 ARDS compared to COVID-19 induced MIS-C. Nat. Commun. 2022, 13, 2391. [Google Scholar] [CrossRef] [PubMed]
- Ahmad, S.; Hafeez, A.; Siddqui, S.A.; Ahmad, M.; Mishra, S. A review of COVID-19 (Coronavirus Disease-2019) diagnosis, treatments and prevention. Eurasian J. Med. Oncol. 2020, 4, 116–125. [Google Scholar] [CrossRef]
- Johanna, N.; Citrawijaya, H.; Wangge, G. Mass screening vs. lockdown vs. combination of both to control COVID-19: A systematic review. J. Public Health Res. 2020, 9, jphr-2020. [Google Scholar] [CrossRef] [PubMed]
- Tran, T.H.; Sasikumar, S.N.; Hennessy, A.; O’Loughlin, A.; Morgan, L. Associations between restrictions on public mobility and slowing of new COVID-19 case rates in three countries. Med. J. Aust. 2020, 213, 471–473. [Google Scholar] [CrossRef] [PubMed]
- Ryu, S.; Han, C.; Kim, D.; Tsang, T.K.; Cowling, B.J.; Lee, S. Association Between the Relaxation of Public Health and Social Measures and Transmission of the SARS-CoV-2 Omicron Variant in South Korea. JAMA Netw. Open 2022, 5, e2225665. [Google Scholar] [CrossRef] [PubMed]
- Flaxman, S.; Mishra, S.; Gandy, A.; Unwin, H.J.T.; Mellan, T.A.; Coupland, H.; Whittaker, C.; Zhu, H.; Berah, T.; Eaton, J.W.; et al. Estimating the effects of non-pharmaceutical interventions on COVID-19 in Europe. Nature 2020, 584, 257–261. [Google Scholar] [CrossRef]
- Ferguson, N.M.; Laydon, D.; Nedjati-Gilani, G.; Imai, N.; Ainslie, K.; Baguelin, M.; Bhatia, S.; Boonyasiri, A.; Cucunubá, Z.; Cuomo-Dannenburg, G.; et al. Impact of Non-Pharmaceutical Interventions (NPIs) to Reduce COVID-19 Mortality and Healthcare Demand; Imperial College COVID-19 Response Team, Imperial College London: London, UK, 2020; Volume 20, p. 77482. [Google Scholar]
- Jarvis, C.I.; Gimma, A.; van Zandvoort, K.; Wong, K.L.M.; CMMID COVID-19 Working Group; Edmunds, W.J. The impact of local and national restrictions in response to COVID-19 on social contacts in England: A longitudinal natural experiment. BMC Med. 2021, 19, 52. [Google Scholar] [CrossRef]
- Hsiang, S.; Allen, D.; Annan-Phan, S.; Bell, K.; Bolliger, I.; Chong, T.; Druckenmiller, H.; Huang, L.Y.; Hultgren, A.; Krasovich, E.; et al. The effect of large-scale anti-contagion policies on the COVID-19 pandemic. Nature 2020, 584, 262–267. [Google Scholar] [CrossRef]
- Boaz, J. Melbourne Passes Buenos Aires’ World Record for Time Spent in Lockdown. ABC News. 2021. Available online: https://www.abc.net.au/news/2021-10-03/melbourne-longest-lockdown/100510710 (accessed on 29 December 2022).
- Coronavirus (COVID-19) Victoria. Coronavirus Victoria. (n.d.). Available online: https://www.coronavirus.vic.gov.au/ (accessed on 12 February 2023).
- Wiens, J.; Shenoy, E.S. Machine learning for healthcare: On the verge of a major shift in healthcare epidemiology. Clin. Infect. Dis. 2018, 66, 149–153. [Google Scholar] [CrossRef]
- Bi, Q.; Goodman, K.E.; Kaminsky, J.; Lessler, J. What is machine learning? A primer for the epidemiologist. Am. J. Epidemiol. 2019, 188, 2222–2239. [Google Scholar] [CrossRef] [PubMed]
- Wiemken, T.L.; Kelley, R.R. Machine Learning in Epidemiology and Health Outcomes Research. Annu. Rev. Public Health 2019, 41, 21–36. [Google Scholar] [CrossRef] [PubMed]
- Lyu, S.; Lee, V.C.; Liu, G. An intelligent hybrid cloud-based ANP and AI model for Development Site Selection. In Intelligent Systems and Applications; Lecture Notes in Networks and Systems; Spinger: Berlin/Heidelberg, Germany, 2022; pp. 84–102. [Google Scholar]
- Chadaga, K.; Prabhu, S.; Vivekananda, B.K.; Niranjana, S.; Umakanth, S. Battling COVID-19 using machine learning: A review. Cogent Eng. 2021, 8, 1958666. [Google Scholar] [CrossRef]
- Syeda, H.B.; Syed, M.; Sexton, K.; Syed, S.; Begum, S.; Syed, F.; Prior, F.; Yu, F., Jr. Role of Machine Learning Techniques to Tackle the COVID-19 Crisis: Systematic Review. JMIR Med. Inform. 2020, 9, e23811. [Google Scholar] [CrossRef] [PubMed]
- Saleem, F.; Al-Ghamdi, A.S.A.M.; Alassafi, M.O.; AlGhamdi, S.A. Machine learning, deep learning, and mathematical models to analyze forecasting and epidemiology of COVID-19: A systematic literature review. Int. J. Environ. Res. Public Health 2022, 19, 5099. [Google Scholar] [CrossRef] [PubMed]
- CSSEGIS and Data 2022. COVID-19 Data Repository by the Center for Systems Science and Engineering (CSSE) at Johns Hopkins University. Available online: https://github.com/CSSEGISandData/COVID-19 (accessed on 17 October 2022).
- COVID-19 Community Mobility Reports. Available online: https://www.google.com/covid19/mobility/ (accessed on 17 October 2022).
- COVID-19 Government Response Tracker. Blavatnik School of Government. Available online: https://www.bsg.ox.ac.uk/research/covid-19-government-response-tracker (accessed on 17 October 2022).
- Department of Health, Victoria, Australia. Pandemic Order Register. 2022. Available online: https://www.health.vic.gov.au/covid-19/pandemic-order-register (accessed on 29 December 2022).
- Hilfiker, L. Epyestim. GitHub. 2022. Available online: https://github.com/lo-hfk/epyestim (accessed on 18 September 2022).
- Xi, W.; Pei, T.; Liu, Q.; Song, C.; Liu, Y.; Chen, X.; Ma, J.; Zhang, Z. Quantifying the Time-Lag Effects of Human Mobility on the COVID-19 Transmission: A Multi-City Study in China. IEEE Access Pract. Innov. Open Solut. 2020, 8, 216752–216761. [Google Scholar] [CrossRef] [PubMed]
- Boto-García, D. Investigating the two-way relationship between mobility flows and COVID-19 cases. Econ. Model. 2023, 118, 106083. [Google Scholar] [CrossRef]
- Hade, E.M.; Lu, B. Bias associated with using the estimated propensity score as a regression covariate. Stat. Med. 2014, 33, 74–87. [Google Scholar] [CrossRef]
- Alin, A. Multicollinearity. Wiley Interdiscip. Rev. Comput. Stat. 2010, 2, 370–374. [Google Scholar] [CrossRef]
- Yang, X.; Wen, W. Ridge and lasso regression models for cross-version defect prediction. IEEE Trans. Reliab. 2018, 67, 885–896. [Google Scholar] [CrossRef]
- Thrampoulidis, C.; Abbasi, E.; Hassibi, B. Lasso with non-linear measurements is equivalent to one with linear measurements. In Advances in Neural Information Processing Systems; MIT Press: Cambridge, MA, USA, 2015; Volume 28. [Google Scholar]
- Efendi, A.; Effrihan, E. A simulation study on Bayesian Ridge regression models for several collinearity levels. AIP Conf. Proc. 2017, 1913, 020031. [Google Scholar]
- Aich, S.; Younga, K.; Hui, K.L.; Al-Absi, A.A.; Sain, M. A non-linear decision tree based classification approach to predict the Parkinson’s disease using different feature sets of voice data. In Proceedings of the 2018 20th International Conference on Advanced Communication Technology (ICACT), Chuncheon, Republic of Korea, 11–14 February 2018; pp. 638–642. [Google Scholar]
- Alle, S.; Kanakan, A.; Siddiqui, S.; Garg, A.; Karthikeyan, A.; Mehta, P.; Mishra, N.; Chattopadhyay, P.; Devi, P.; Waghdhare, S.; et al. COVID-19 Risk Stratification and Mortality Prediction in Hospitalized Indian Patients: Harnessing clinical data for public health benefits. PLoS ONE 2022, 17, e0264785. [Google Scholar] [CrossRef] [PubMed]
- Wang, L.; Wang, X.; Chen, A.; Jin, X.; Che, H. Prediction of Type 2 Diabetes Risk and Its Effect Evaluation Based on the XGBoost Model. Healthcare 2020, 8, 247. [Google Scholar] [CrossRef] [PubMed]
- Xia, D.; Yao, R.; Wang, S.; Chen, G.; Wang, Y. Mapping Trends and Hotspots Regarding Clinical Research on COVID-19: A Bibliometric Analysis of Global Research. Front. Public Health 2021, 9, 713487. [Google Scholar] [CrossRef] [PubMed]
- Chicco, D.; Warrens, M.J.; Jurman, G. The coefficient of determination R-squared is more informative than SMAPE, MAE, MAPE, MSE and RMSE in regression analysis evaluation. PeerJ Comput. Sci. 2021, 7, e623. [Google Scholar] [CrossRef] [PubMed]
- Vidyullatha, P.; Rao, D.R. Machine learning techniques on multidimensional curve fitting data based on R-square and chi-square methods. Int. J. Electr. Comput. Eng. 2016, 6, 974. [Google Scholar]
- Nikolopoulou, G.B.; Maltezou, H.C. COVID-19 in Children: Where do we Stand? Arch. Med. Res. 2022, 53, 4731–4738. [Google Scholar] [CrossRef] [PubMed]
- Lyu, S.; Adegboye, O.; Adhinugraha, K.; Emeto, T.I.; Taniar, D. COVID-19 Prevention Strategies for Victoria Students within Educational Facilities: An AI-Based Modelling Study. Healthcare 2023, 11, 860. [Google Scholar] [CrossRef]
- Xie, X.; Xue, Q.; Zhou, Y.; Zhu, K.; Liu, Q.; Zhang, J.; Song, R. Mental health status among children in home confinement during the coronavirus disease 2019 outbreak in Hubei Province, China. JAMA Pediatr. 2020, 174, 898–900. [Google Scholar] [CrossRef]
- Viner, R.; Russell, S.; Saulle, R.; Croker, H.; Stansfield, C.; Packer, J.; Nicholls, D.; Goddings, A.L.; Bonell, C.; Hudson, L.; et al. School Closures During Social Lockdown and Mental Health, Health Behaviors, and Well-being Among Children and Adolescents During the First COVID-19 Wave: A Systematic Review. JAMA Pediatr. 2022, 176, 400–409. [Google Scholar] [CrossRef]
- López-Bueno, R.; López-Sánchez, G.F.; Casajús, J.A.; Calatayud, J.; Gil-Salmerón, A.; Grabovac, I.; Tully, M.A.; Smith, L. Health-Related Behaviors Among School-Aged Children and Adolescents During the Spanish COVID-19 Confinement. Front. Pediatr. 2020, 8, 573. [Google Scholar] [CrossRef] [PubMed]
- An, R. Projecting the impact of the coronavirus disease-2019 pandemic on childhood obesity in the United States: A microsimulation model. J. Sport Health Sci. 2020, 9, 302–312. [Google Scholar] [CrossRef] [PubMed]
- Tamang, S.T.; Lhendup, K.; Dorji, T. Control of travel-related COVID-19 in Bhutan. J. Travel Med. 2021, 28, taab137. [Google Scholar] [CrossRef] [PubMed]
- Smyth, B. The fading impact of lockdowns: A data analysis of the effectiveness of COVID-19 travel restrictions during different pandemic phases. PLoS ONE 2022, 17, e0269774. [Google Scholar] [CrossRef]
- Sugishita, Y.; Kurita, J.; Sugawara, T.; Ohkusa, Y. Effects of voluntary event cancellation and school closure as countermeasures against COVID-19 outbreak in Japan. PLoS ONE 2020, 15, e0239455. [Google Scholar] [CrossRef]
- Ebrahim, S.H.; Memish, Z.A. COVID-19—The role of mass gatherings. Travel Med. Infect. Dis. 2020, 34, 101617. [Google Scholar] [CrossRef]

Disclaimer/Publisher’s Note: The statements, opinions and data contained in all publications are solely those of the individual author(s) and contributor(s) and not of MDPI and/or the editor(s). MDPI and/or the editor(s) disclaim responsibility for any injury to people or property resulting from any ideas, methods, instructions or products referred to in the content. |
© 2023 by the authors. Licensee MDPI, Basel, Switzerland. This article is an open access article distributed under the terms and conditions of the Creative Commons Attribution (CC BY) license (https://creativecommons.org/licenses/by/4.0/).