
Information Competences and Academic Achievement: A Dataset

Abstract
1. Summary
2. Data Description
- Information search: covers the abilities to locate and access information.
- Information evaluation: “to analyse and assess the quality of the information by recognizing its usefulness, credibility and relevance” [14].
- Information processing: involves the abilities and skills of handling tools and applications to organize, store and retrieve information, as well as to manage the bibliography.
- Information communication: “concerns the set of abilities for transferring knowledge, promoting information dissemination and developing virtual spaces for work and debate” [14].
2.1. Files
2.2. Features
- The first feature is a unique participant identifier.
- The next three features correspond to scores achieved in the self-perceived IL competences instrument.
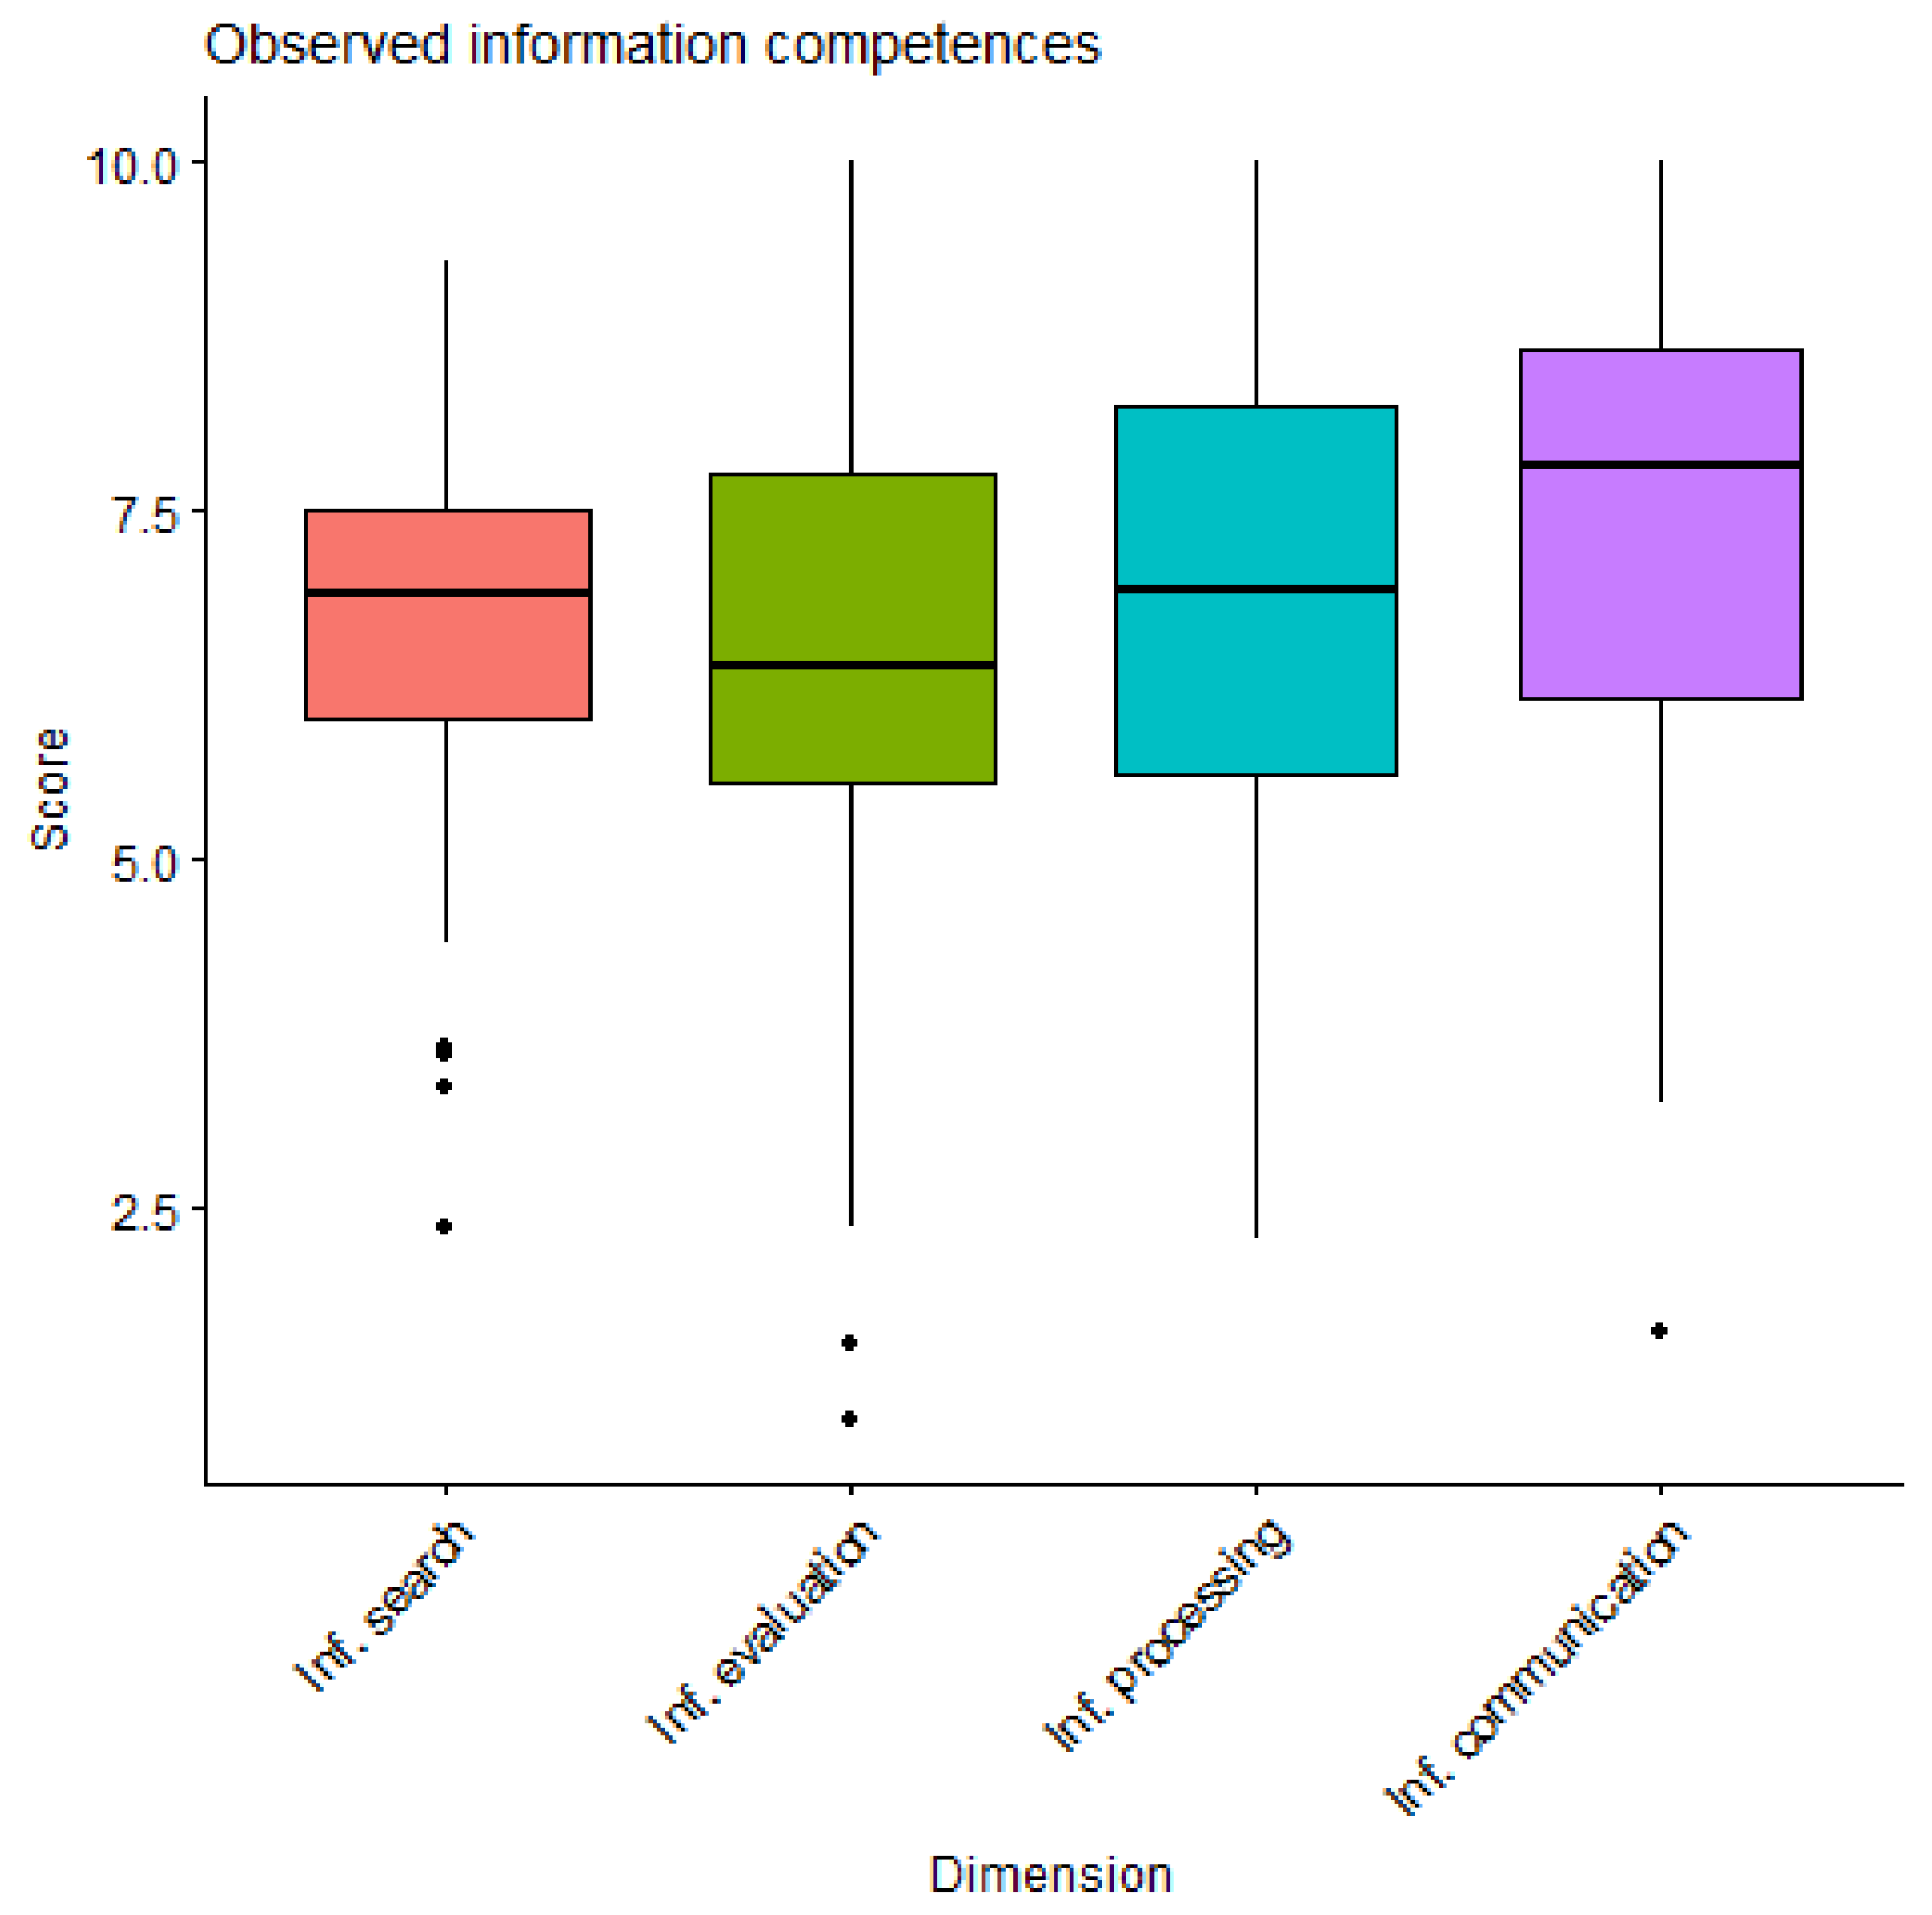
- The following five features include scores achieved in the observed IL competences instruments.
- Next, four features present demographic and socioeconomic indicators.
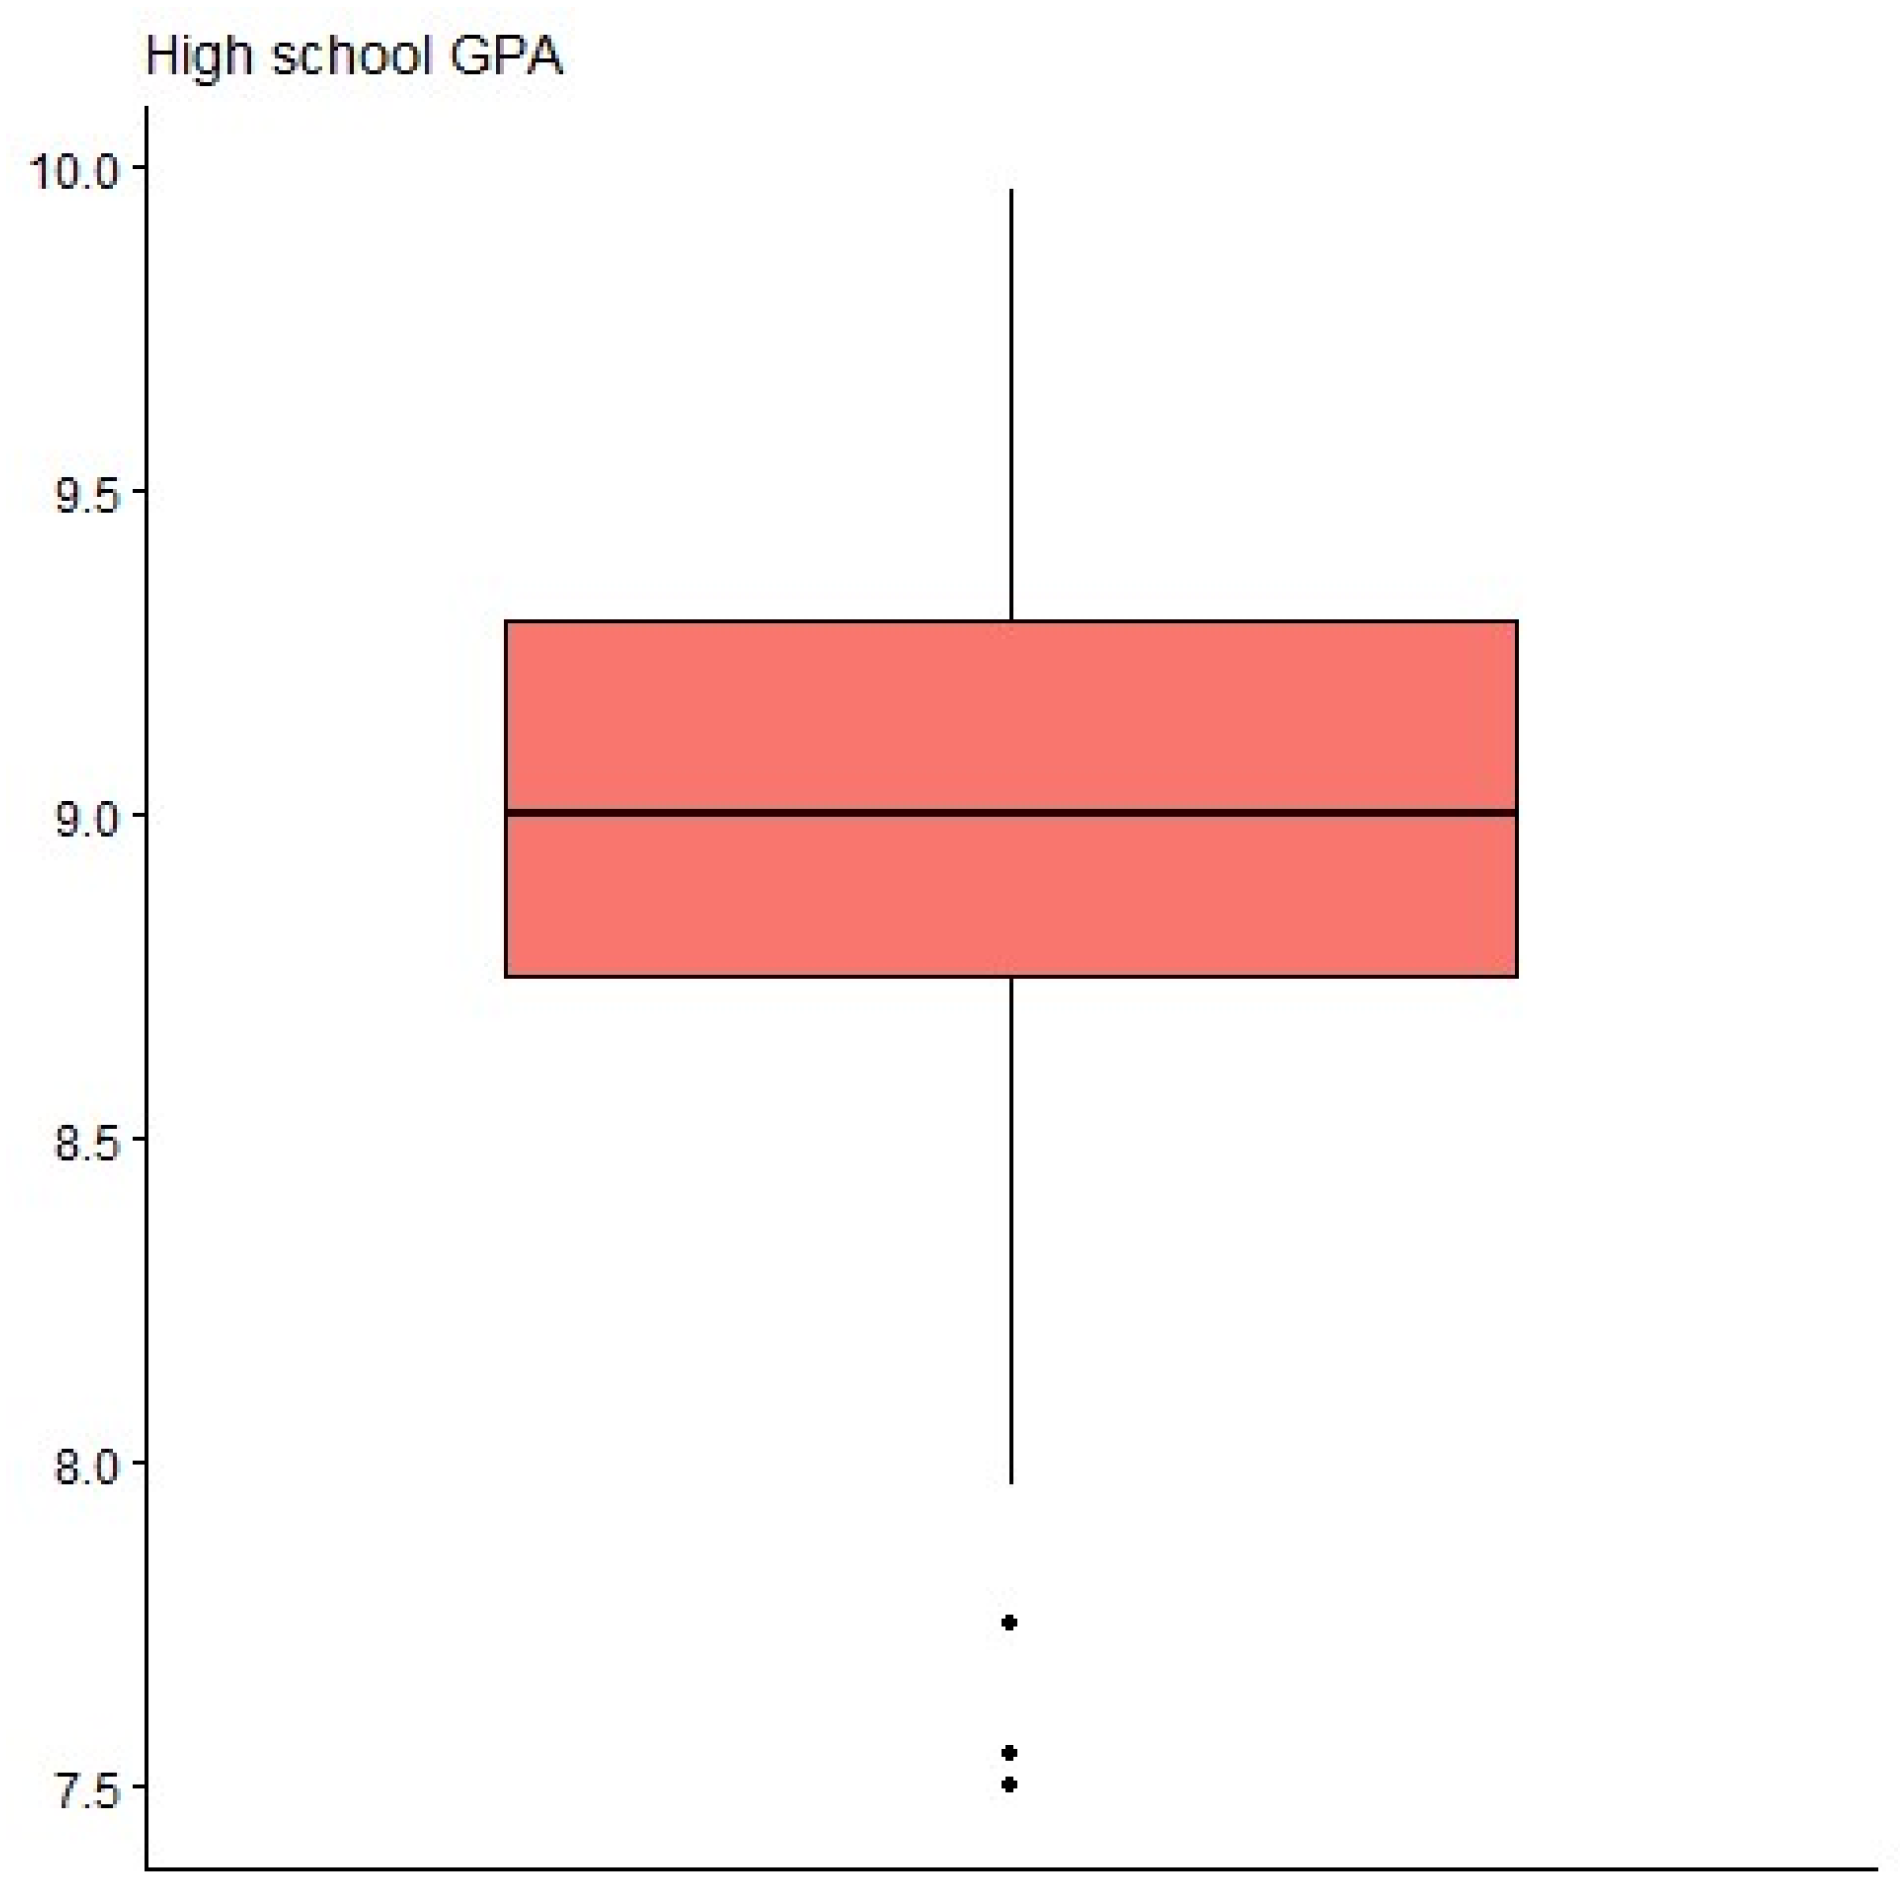
- The following five features summarize previous academic achievement.
- Following that, four features include the final grades achieved in three common first-semester courses and the first-semester GPA.
- The remaining three features include the courses’ final statuses (pass or fail).
2.3. Data Distribution
3. Methods
- All students taking first- and second-year common courses for all 23 Engineering programs were invited to answer the survey. We obtained 195 complete answers.
- Data were filtered to discard duplicates, students enrolled in non-engineering programs, students not in the cohorts of interest (2021 and 2022) and students who did not agree to participate in the study or did not authorize the use of their academic records.
- Scores for both IL competences assessments were calculated.
- Final grades for three common first-semester courses (Calculus I, Algebra I and Physics I), as well as the first-semester GPA were collected. After this stage, the resulting dataset contained 153 complete observations.
- To ensure that individual students cannot be identified, we took several measures: (1) We pseudonymized the dataset by discarding personal information (national unique ID and e-mail), shuffling dataset rows and then adding a unique numeric row ID. (2) Data were then generalized by deleting answers for individual questions on the survey, keeping only the total scores per dimension and the overall totals. (3) Finally, course final grades, GPAs and higher education admission test scores were re-scaled.
4. User Notes
Author Contributions
Funding
Institutional Review Board Statement
Informed Consent Statement
Data Availability Statement
Conflicts of Interest
References
- American Library Association Presidential Committee on Information Literacy: Final Report. Available online: https://www.ala.org/acrl/publications/whitepapers/presidential (accessed on 20 July 2019).
- Bruce, C. The Seven Faces of Information Literacy. Available online: https://www.researchgate.net/publication/239229387_The_Seven_Faces_of_Information_Literacy (accessed on 4 April 2023).
- Association of College and Research Libraries Information Literacy Competency Standards for Higher Education. 2000.
- Bundy, A.L. Australian and New Zealand Information Literacy Framework: Principles, Standards and Practice, 2nd ed.; Australian and New Zealand Institute for Information Literacy: Adelaide, Australia, 2004. [Google Scholar]
- Catts, R.; Lau, J. Towards Information Literacy Indicators; UNESCO: Paris, France, 2008; Available online: https://unesdoc.unesco.org/ark:/48223/pf0000158723 (accessed on 20 July 2019).
- SCONUL. National and University Libraries Perceptions of the SCONUL Seven Pillars of Information Literacy. A Brief Review; SCONUL: London, UK, 2015. [Google Scholar]
- Organization for Economic Cooperation and Development. PISA 2015 Released Field Trial: Cognitive Items; OECD: Paris, France, 2015. [Google Scholar]
- Organization for Economic Cooperation and Development. Skills Studies. In Skills Matter: Further Results from the Survey of Adult Skills; OECD Publishing: Paris, France, 2016.
- Organization for Economic Cooperation and Development. Statistics Canada. In Literacy in the Information Age: Final Report of the International Adult Literacy Survey; OECD Publishing: Paris, France, 2000. [Google Scholar]
- Fraillon, J.; Ainley, J.; Schulz, W.; Duckworth, D.; Friedman, T. IEA International Computer and Information Literacy Study 2018 Assessment Framework; Springer: Cham, Switzerland, 2019; ISBN 978-3-030-19389-8. [Google Scholar]
- Douglas, K.A.; Fernandez, T.; Purzer, Ş.; Fosmire, M.; Van Epps, A. A Self-Assessment Instrument to Assess Engineering Students’ Self-Directedness in Information Literacy. In Proceedings of the 2015 IEEE Frontiers in Education Conference (FIE), El Paso, TX, USA, 21–24 October 2015; pp. 1–8. [Google Scholar]
- García-Llorente, H.J.; Martínez-Abad, F.; Rodríguez-Conde, M.J. Evaluación de La Competencia Informacional Observada y Autopercibida En Estudiantes de Educación Secundaria Obligatoria En Una Región Española de Alto Rendimiento PISA. Rev. Electrón. Educ. 2020, 24, 24–40. [Google Scholar] [CrossRef]
- Katz, I.R. Testing Information Literacy in Digital Environments: ETS’s iSkills Assessment. Inf. Technol. Libr. 2007, 26, 3–12. [Google Scholar] [CrossRef]
- Pinto, M. Design of the IL-HUMASS Survey on Information Literacy in Higher Education: A Self-Assessment Approach. J. Inf. Sci. 2010, 36, 86–103. [Google Scholar] [CrossRef]
- Bielba Calvo, M.; Martínez Abad, F.; Herrera García, M.E.; Rodríguez Conde, M.J. Diseño de Un Instrumento de Evaluación de Competencias Informacionales En Educación Secundaria Obligatoria a Través de La Selección de Indicadores Clave. Educ. Knowl. Soc. 2015, 16, 124–143. [Google Scholar] [CrossRef][Green Version]
- Hollis, H.; Rachitskiy, M.; Leer, L. van der The Development and Face Validity Testing of the Open Test of Information Literacy with Context-Specific Add-Ons: OTIL. LIBER Q. J. Assoc. Eur. Res. Libr. 2019, 29, 1–21. [Google Scholar] [CrossRef]
- Hahnel, C.; Eichmann, B.; Goldhammer, F. Evaluation of Online Information in University Students: Development and Scaling of the Screening Instrument EVON. Front. Psychol. 2020, 11, 562128. [Google Scholar] [CrossRef]
- van Helvoort, J. A Scoring Rubric for Performance Assessment of Information Literacy in Dutch Higher Education. J. Inf. Lit. 2010, 4, 22–39. [Google Scholar] [CrossRef]
- Coiro, J.; Kennedy, C. The Online Reading Comprehension Assessment (ORCA) Project: Preparing Students for Common Core Standards and 21st Century Literacies 2011. Available online: https://www.academia.edu/download/5672240/CCSS_ORCA_Alignment_June_2011.pdf (accessed on 22 July 2019).
- González-Ibáñez, R.; Gacitúa, D.; Sormunen, E.; Kiili, C. NEURONE: oNlinE inqUiRy experimentatiON systEm. Proc. Assoc. Inf. Sci. Technol. 2017, 54, 687–689. [Google Scholar] [CrossRef]
- González-Ibáñez, R.; Chourio-Acevedo, L.; Gacitúa, D.; Márquez, C.; Mellado, J.; Villarreal, F.; Becerra, C.; Köhler, J.; Proaño-Ríos, V.; Joglar, C.; et al. Let’s Play: Toward an Effective Approach to Assess Online Inquiry Competences at School Level. In Proceedings of the 2021 40th International Conference of the Chilean Computer Science Society (SCCC), La Serena, Chile, 15–19 November 2021; pp. 1–8. [Google Scholar]
- Catalano, A.J.; Phillips, S.R. Information Literacy and Retention: A Case Study of the Value of the Library. Evid. Based Libr. Inf. Pract. 2016, 11, 1–13. [Google Scholar] [CrossRef]
- Ay, K.; Erdem, M. An Investigation on University Students’ Online Information Search Strategies and Relationships with Some Educational Variables [Üniversite Öğrencilerinin Çevrimiçi Bilgi Arama Stratejileri ve Bazı Eğitimsel Değişkenlerle Ilişkilerinin Incelenmesi]. Hacettepe Egitim Dergisi 2020, 35, 843–857. [Google Scholar] [CrossRef]
- Wittkower, L.R.; McInnis, J.W.; Pope, D.R. An Examination of Relationships Between Library Instruction and Student Academic Achievement. J. Libr. Adm. 2022, 62, 887–898. [Google Scholar] [CrossRef]
- Jones, W.L.; Mastrorilli, T. Assessing the Impact of an Information Literacy Course on Students’ Academic Achievement: A Mixed-Methods Study. Evid. Based Libr. Inf. Pract. 2022, 17, 61–87. [Google Scholar] [CrossRef]
- Sharun, S. Enrollment in a Library Credit Course Is Positively Related to the College Graduation Rates of Full Time Students. Evid. Based Libr. Inf. Pract. 2015, 10, 156–157. [Google Scholar] [CrossRef]
- Espe, T.W.; Dettman, D.M.; Noltze, M.; Harnett, D. Credit Score: Assessing a Library Course’s Association with Graduation Rates and GPAs for at-Risk Students at a Regional Public University. Coll. Undergrad. Libr. 2021, 28, 243–252. [Google Scholar] [CrossRef]
- Bacarrisas, H.P. College Student Self-Efficacy in Information Literacy: Influence on Their Research Academic Skills. Br. J. Multidiscip. Adv. Stud. 2023, 4, 12–19. [Google Scholar] [CrossRef]
- Al-Fairouz, E.I.; Al-Hagery, M.A. Students Performance: From Detection of Failures and Anomaly Cases to the Solutions-Based Mining Algorithms. Int. J. Eng. Res. Technol. 2020, 13, 2895–2908. [Google Scholar] [CrossRef]
- Baz, A.; Alshareef, F.; Alshareef, E.; Alhakami, H.; Alsubait, T. Predicting Students’ Academic Performance Using Naïve Bayes. Int. J. Comput. Sci. Netw. Secur. 2020, 20, 182–190. [Google Scholar]
- Pekuwali, A.A. Prediction of Student Learning Outcomes Using the Naive Bayesian Algorithm (Case Study of Tama Jagakarsa University). In Proceedings of the IOP Conference Series: Materials Science and Engineering, Kupang, Indonesia, 17–21 October 2020; Volume 823. [Google Scholar]
- Köhler, J.; Hidalgo, L.; Jara, J.L. Using Machine Learning Techniques to Predict Academic Success in an Introductory Programming Course. In Proceedings of the 2022 41st International Conference of the Chilean Computer Science Society (SCCC), Santiago, Chile, 21–25 November 2022; pp. 1–8. [Google Scholar]
- Shi, Y.; Sun, F.; Zuo, H.; Peng, F. Analysis of Learning Behavior Characteristics and Prediction of Learning Effect for Improving College Students’ Information Literacy Based on Machine Learning. IEEE Access 2023, 11, 50447–50461. [Google Scholar] [CrossRef]
- García Llorente, H.J.; Martínez Abad, F.; Rodríguez Conde, M.J. Validación de un Instrumento de Evaluación de Competencias Informacionales Autopercibidas en Educación Secundaria Obligatoria. An. Doc. 2019, 22, 1–14. [Google Scholar] [CrossRef]
- Bielba Calvo, M.; Martínez Abad, F.; Rodríguez Conde, M.J. Validación psicométrica de un instrumento de evaluación de competencias informacionales en la educación secundaria. Bordón Rev. Pedagog. 2017, 69, 27–43. [Google Scholar] [CrossRef]
- Ley N° 20.027 Establece Normas para el Financiamiento de Estudios de Educación Superior. 2005. Available online: https://transparenciaactiva.cultura.gob.cl/uploads2010/marcoNormativo/4f5e40ee9cff6525ebd2a7d4648f2ac77ce228e5.pdf (accessed on 13 April 2023).
- Heady, C.; Morrison, M.M.; Vossler, J. Ecological Study of Graduation Rates and GPA in a Library Credit Course. J. Acad. Librariansh. 2018, 44, 642–649. [Google Scholar] [CrossRef]
- Ahmed, S.T.; Roche, T. Making the Connection: Examining the Relationship between Undergraduate Students’ Digital Literacy and Academic Success in an English Medium Instruction (EMI) University. Educ. Inf. Technol. 2021, 26, 4601–4620. [Google Scholar] [CrossRef]
- Crawford-Visbal, J.L.; Crawford-Tirado, L.; Ortiz-Záccaro, Z.Z.; Abalo, F. Assessment of Digital Competences in Communication Students across Four Latin American Universities. Educ. Knowl. Soc. (EKS) 2020, 21, 14. [Google Scholar] [CrossRef]
- Horn, A.; Maddox, A.; Hagel, P.; Currie, M.; Owen, S. Embedded Library Services: Beyond Chance Encounters for Students from Low SES Backgrounds. Aust. Acad. Res. Libr. 2013, 44, 235–250. [Google Scholar] [CrossRef][Green Version]
- Mortimore, J.M.; Wall, A. Motivating African-American Students through Information Literacy Instruction: Exploring the Link between Encouragement and Academic Self-Concept. Ref. Libr. 2009, 50, 29–42. [Google Scholar] [CrossRef]


| Feature | Type | Description | Values |
|---|---|---|---|
| ID | Identifier | Unique identifier for the row. | |
| S_SEARCH | Integer | Total score for the search dimension of the self-perceived IL competences instrument. | 0–10 |
| S_EVAL | Integer | Total score for the evaluation dimension of the self-perceived IL competences instrument. | 0–10 |
| S_TOT | Integer | Total score for the self-perceived IL competences instrument. | 0–20 |
| O_SEACH | Numeric | Total score for the search dimension of the observed IL competences instrument. | 0–10 |
| O_EVAL | Numeric | Total score for the evaluation dimension of the observed IL competences instrument. | 0–10 |
| O_PROC | Numeric | Total score for the processing dimension of the observed IL competences instrument. | 0–10 |
| O_COM | Numeric | Total score for the communication dimension of the observed IL competences instrument. | 0–10 |
| O_TOT | Numeric | Total score for the observed IL competences instrument. | 0–40 |
| SEX | Categorical | Sex. | 0: male, 1: female |
| SCHOOL_TYPE | Categorical | Indicates the type of high school a student attended. Lower values are associated with a lower family income. | 0, 1, 2 |
| FEE_EXEMPTION | Categorical | Indicates if a student has a fee exemption benefit. | 0: no, 1: yes |
| FIRST_CHOICE | Categorical | Indicates if a student was admitted to the program of his/her preference. | 0: no, 1: yes |
| SCHOOL_GPA | Numeric | Final high school GPA. | 0–10 |
| SCORE_LAN | Numeric | Score achieved in the language admission test. | 0–100 |
| SCORE_MAT | Numeric | Score achieved in the math admission test. | 0–100 |
| SCORE_SCI | Numeric | Score achieved in the sciences admission test. | 0–100 |
| SCORE_WAV | Numeric | Weighted average score achieved in the admission test. Includes the three above items, student high school ranking and high school GPA. | 0–100 |
| G_ALG | Numeric | Final grade in Algebra I. | 0–10 |
| G_CAL | Numeric | Final grade in Calculus I. | 0–10 |
| G_PHY | Numeric | Final grade in Physics I. | 0–10 |
| S1_GPA | Numeric | First semester GPA. | 0–10 |
| ST_ALG | Categorical | Final status in Algebra I. | 0: fail, 1: pass |
| ST_CAL | Categorical | Final status in Calculus I. 0: fail, 1: pass. | 0: fail, 1: pass |
| ST_PHY | Categorical | Final status in Physics I. 0: fail, 1: pass. | 0: fail, 1: pass |
| Feature | Min | Q1 | Median | Mean | Q3 | Max | SD |
|---|---|---|---|---|---|---|---|
| S_SEARCH | 0.000 | 6.875 | 8.750 | 7.921 | 9.375 | 10.000 | 2.151 |
| S_EVAL | 1.000 | 6.500 | 8.000 | 7.529 | 9.000 | 10.000 | 2.030 |
| S_TOT | 1.500 | 14.000 | 16.125 | 15.450 | 18.375 | 20.000 | 3.866 |
| O_SEARCH | 2.357 | 6.000 | 6.893 | 6.763 | 7.500 | 9.286 | 1.205 |
| O_EVAL | 0.972 | 5.556 | 6.389 | 6.432 | 7.778 | 10.000 | 1.779 |
| O_PROC | 2.267 | 5.600 | 6.933 | 6.945 | 8.267 | 10.000 | 1.793 |
| O_COM | 1.625 | 6.167 | 7.833 | 7.455 | 8.667 | 10.000 | 1.712 |
| O_TOT | 10.499 | 25.032 | 27.871 | 27.595 | 30.412 | 36.589 | 4.401 |
| SCHOOL_GPA | 7.500 | 8.750 | 9.000 | 8.989 | 9.300 | 9.967 | 0.450 |
| SCORE_LAN | 39.000 | 55.714 | 62.714 | 63.006 | 70.000 | 93.714 | 10.008 |
| SCORE_MAT | 51.286 | 64.857 | 70.286 | 69.078 | 73.429 | 83.429 | 6.868 |
| SCORE_SCI | 22.714 | 59.714 | 64.286 | 63.464 | 70.143 | 85.286 | 9.889 |
| SCORE_WAV | 57.814 | 71.221 | 75.900 | 75.052 | 78.721 | 99.751 | 6.059 |
| G_ALG | 0.333 | 4.167 | 5.000 | 5.014 | 5.833 | 8.500 | 1.388 |
| G_CAL | 0.000 | 2.000 | 5.000 | 4.062 | 5.500 | 8.333 | 2.084 |
| G_PHY | 0.000 | 4.000 | 5.333 | 4.881 | 5.833 | 9.667 | 1.734 |
| S1_GPA | 1.118 | 4.886 | 5.946 | 5.667 | 6.543 | 8.220 | 1.191 |
| Feature | W | p |
|---|---|---|
| S_SEARCH | 0.839 | 0.000 * |
| S_EVAL | 0.904 | 0.000 * |
| S_TOT | 0.875 | 0.000 * |
| O_SEARCH | 0.980 | 0.027 * |
| O_EVAL | 0.976 | 0.010 * |
| O_PROC | 0.964 | 0.000 * |
| O_COM | 0.952 | 0.000 * |
| O_TOT | 0.978 | 0.015 * |
| SCHOOL_GPA | 0.980 | 0.023 * |
| SCORE_LAN | 0.993 | 0.716 |
| SCORE_MAT | 0.985 | 0.099 |
| SCORE_SCI | 0.933 | 0.000 * |
| SCORE_WAV | 0.975 | 0.008 * |
| G_ALG | 0.955 | 0.000 * |
| G_CAL | 0.917 | 0.000 * |
| G_PHY | 0.950 | 0.000 * |
| S1_GPA | 0.965 | 0.001 * |
| S_SEARCH | 0.839 | 0.000 * |
| Feature | Level | Male | Female | Total |
| n = 106 | n = 47 | n = 153 | ||
| School type | Type 0 | 21.70% | 23.40% | 22.22% |
| Type 1 | 57.55% | 57.45% | 57.52% | |
| Type 2 | 20.75% | 19.15% | 20.26% | |
| Has fee exemption | Yes | 87.74% | 85.11% | 86.93% |
| No | 12.26% | 14.89% | 13.07% | |
| Program is first choice | Yes | 49.06% | 65.96% | 54.25% |
| No | 50.94% | 34.04% | 45.75% |
| Course | Final Status | Male | Female | Total |
| n = 106 | n = 47 | n = 153 | ||
| Algebra I | Pass | 65.09% | 80.85% | 69.93% |
| Fail | 34.91% | 19.15% | 30.07% | |
| Calculus I | Pass | 50.94% | 72.34% | 57.52% |
| Fail | 49.06% | 27.66% | 42.48% | |
| Physics I | Pass | 66.98% | 59.57% | 64.71% |
| Fail | 33.02% | 40.43% | 35.29% |
Disclaimer/Publisher’s Note: The statements, opinions and data contained in all publications are solely those of the individual author(s) and contributor(s) and not of MDPI and/or the editor(s). MDPI and/or the editor(s) disclaim responsibility for any injury to people or property resulting from any ideas, methods, instructions or products referred to in the content. |
© 2023 by the authors. Licensee MDPI, Basel, Switzerland. This article is an open access article distributed under the terms and conditions of the Creative Commons Attribution (CC BY) license (https://creativecommons.org/licenses/by/4.0/).
Share and Cite
Köhler, J.; González-Ibáñez, R. Information Competences and Academic Achievement: A Dataset. Data 2023, 8, 164. https://doi.org/10.3390/data8110164
Köhler J, González-Ibáñez R. Information Competences and Academic Achievement: A Dataset. Data. 2023; 8(11):164. https://doi.org/10.3390/data8110164
Chicago/Turabian StyleKöhler, Jacqueline, and Roberto González-Ibáñez. 2023. "Information Competences and Academic Achievement: A Dataset" Data 8, no. 11: 164. https://doi.org/10.3390/data8110164
APA StyleKöhler, J., & González-Ibáñez, R. (2023). Information Competences and Academic Achievement: A Dataset. Data, 8(11), 164. https://doi.org/10.3390/data8110164